The Active Galactic Nuclei in the Hobby-Eberly Telescope Dark Energy Experiment Survey (HETDEX) III. A red quasar with extremely high equivalent widths showing powerful outflows
Abstract
We report an Active Galactic Nucleus (AGN) with extremely high equivalent width (EW), in the rest-frame, at in the Hobby-Eberly Telescope Dark Energy Experiment Survey (HETDEX) as a representative case of the high EW AGN population. The continuum level is a non-detection in the HETDEX spectrum, thus the measured EW is a lower limit. The source is detected with significant emission lines () at LyN V , C IV , and moderate emission line () at He II within the wavelength coverage of HETDEX (3500 Å - 5500 Å). The -band magnitude is 24.57 from the Hyper Suprime-Cam-HETDEX joint survey with a detection limit of at . The emission line spans a clearly resolved region of (85 kpc) in diameter. The line profile is strongly double peaked. The spectral decomposed blue gas and red gas Ly emission are separated by (10.1 kpc) with a line-of-sight velocity offset of . This source is probably an obscured AGN with powerful winds.
[table]capposition=top
1 Introduction
Active Galactic Nuclei (AGN) are among the most energetic phenomena known in the universe. They can be identified with various observational techniques in different bands. Radio selection is sensitive to the powerful jet of luminous radio-loud AGN. X-ray has strong penetration and low dilution from the host galaxies, thus is the most efficient way in identifying low luminosity AGN (e.g., Xue et al., 2016; Luo et al., 2017). Mid-IR can identify both obscured and un-obscured AGN (e.g., Stern et al., 2012). However, different bands may represent different phases of AGN evolution and a single band identified AGN sample can be contaminated with strong starbursts. Deep UV/optical observations, especially the spectroscopic ones, are still a unique window to study the evolution of AGN.
Traditional optical spectroscopic surveys of AGN usually select targets based on photometric observations, i.e., detections in the broad band imaging with point-like morphologies to be distinguished from extended nearby galaxies, and blue colors to characterize the power-law continuum shape (e.g., Richards et al., 2006). The photometric selection can produce a selection effect on the AGN sample that fails to include the potential AGN population with optically faint host galaxies and high equivalent widths (EWs). These optically faint AGN could either be intrinsically less massive, which could make them outliers in the super-massive black hole (SMBH) - host relation (see Kormendy & Ho, 2013, for a review of the “co-evolution” between SMBH and their host galaxies), or red and obscured AGN.
Whether the co-evolution stands for all SMBHs and their host galaxies remains an open question. Early works in the 1990s reported the discovery of “naked” quasars with no host galaxies (e.g., Bahcall et al., 1994). However, these “naked” quasars were later found to be hosted by normal elliptical galaxies with improved smoothing of the HST images (McLure et al., 1999; McIntosh et al., 1999). Simulations have suggested another special class of SMBHs that may not follow the SMBH-host correlation: the ejected SMBHs (Loeb, 2007; Haiman et al., 2009; Ricarte et al., 2021). A SMBH binary in a gas-rich merger could be ejected as a SMBH remnant carrying an accretion disk. A SMBH remnant of an SMBH binary with similar masses could have a recoil speed of thousands of . The ejected SMBH could transverse a considerable distance from the merged galaxy and be observed as an off-centered quasar if the ejected SMBH happens to pass through a dense molecular cloud.
Red and obscured AGN are very important candidates for understanding the early quasar phases, galaxy quenching, and the enrichment of the intergalactic medium. Interactions between galaxies can help remove the angular momentum of the cold gas in the outskirts of galaxies. The inflowed gas can fuel the star formation in the galaxies, feed the central SMBH, and trigger AGN. The systems are then dusty, gaseous, and usually observed as red and obscured AGN. The radiation from AGN could in return power feedback and affect the evolution of their host galaxies. Strong outflows can clear up the gas reservoir in the host galaxies, shut down the star formation, enrich the environments, and make the AGN visible in optical. Outflows are widely used in understanding the co-evolution between SMBHs and their host galaxies, the lack of luminous quasars in the luminosity function, and the quenching of the star formation of galaxies.
Spatially extended ionized gas and powerful outflow winds have been observed in a few high-redshift obscured quasars (Cai et al., 2017; Fluetsch et al., 2021; Vayner et al., 2021; Lau et al., 2022). These sources were pre-identified in large surveys and followed-up with hours of observation time for spatially resolved spectra on the Large Binocular Telescope/Medium-Dispersion Grating Spectroscopy, Keck/Keck Cosmic Web Imager, Very Large Telescope/Multi Unit Spectroscopic Explorer, etc.
In order to search for AGN with high EW, we need a spectroscopic survey that does not require continuum imaging pre-selection such as the Hobby-Eberly Telescope Dark Energy Experiment (HETDEX, Gebhardt et al. 2021). HETDEX is a spectroscopic survey with no photometric pre-selection (magnitude/color/morphology). All sources within the footprint of the survey are observed with a set of 78 Integral Field Units (IFUs) consisting of 34,944 fibers and a 18-minute exposure. HETDEX enables spectroscopic detection of the AGN hosted by galaxies that may be fainter than the detection limit of the corresponding photometric observations. Additionally, there is no need to perform follow-up observations for the extended sources on other instruments. The spatially resolved spectra can be obtained directly.
In this paper, we introduce an AGN (HETDEX J115031.93+504850.4, shortened to J1150+5048 in this paper) with extremely high EW () at from the HETDEX survey. Section 2 briefly summarizes the first AGN catalog of the HETDEX survey. In Section 3, we present the basic information of J1150+5048, why it is selected for study, and the detailed spatially resolved properties of J1150+5048 with its narrow-band flux maps. We discuss the possible explanations for this high EW AGN in Section 4. We summarize our discovery in Section 5.
2 The HETDEX AGN Catalog
HETDEX (Gebhardt et al., 2021) is an ongoing spectroscopic survey (3500 Å - 5500 Å) on the upgraded 10-m Hobby-Eberly Telescope (HET, Hill et al. 2021). It uses the Visible Integral field Replicable Unit Spectrograph (VIRUS; Hill et al., 2021) to record spectra of every object falling within its field of view. A typical exposure contains 34,944 spectra, most of which capture “blank” sky. The primary goal of this survey is to measure the large-scale structure at using emitters (LAEs) as tracers. The HETDEX survey is expected to be active from 2017 to 2024, and eventually will cover 540 deg2 with a filling factor of 1 in 4.6.
The first AGN catalog of the HETDEX survey is presented in Liu et al. (2022) (Paper I). Here we briefly summarize the sample identification. AGN candidates are identified by requiring at least two significant AGN emission lines, such as the and C IV line pair, or with a single broad emission line with FWHM1000 km s-1, free of any pre-selection based on imaging (magnitude, morphology, or color). Each candidate AGN is then confirmed by visual inspection. This catalog contains 5,322 AGN, covering an effective sky coverage of 30.61 deg2 and a redshift range of . Measurements from the overlap regions with the Hyper Suprime-Cam (HSC) imager of the Subaru telescope from the HSC-HETDEX joint survey (HSC-DEX; depth is mag; S15A, S17A, S18A, PI: A. Schulze, and S19B, PI: S. Mukae) and the HSC Subaru Strategic Program (HSC-SSP; depth is mag ;Aihara et al. 2019) show that the median -band magnitude of our AGN catalog is 21.6 mag, with 34% of the objects having . Approximately 2.6% of the HETDEX AGN are not detected at confidence.
3 J1150+5048
| Coordinate | |||||
| (R.A., Dec.) (HETDEX) | (R.A., Dec.) (WISE) | redshift | |||
| (177.633030, 50.813999) | (177.632964, 50.814293) | 2.24 | |||
| Rest-frame equivalent width (Å) | |||||
| 747 | 174 | 921 | – | 177 | 86 |
| Broad-band Photometry | |||||
| 24.23 | 24.570.13 | 17.500.14 | 16.820.29 | 12.470.38 | 8.93 |
-
•
1) The Rest-frame EWs are all lower limits, because the continuum level in the [1275, 1290] Å window at used in the calculation of EWs is a non-detection.
-
•
2) is measured from the HETDEX spectrum (see Davis et al. in preparation for more details) at the HETDEX coordinate. The continuum of J1150+5048 is a non-detection in -band. 24.23 is lower limit.
-
•
3) is measured from HSC-DEX at the WISE pointing. The depth of this field is (AB mag).
-
•
4) W1-W4 are taken from the ALLWISE catalog (Cutri et al., 2021). W1, W2, W3, and W4 are the filters at 3.4, 4.6, 12, and 22 µm, respectively. W4 is a non-detection.
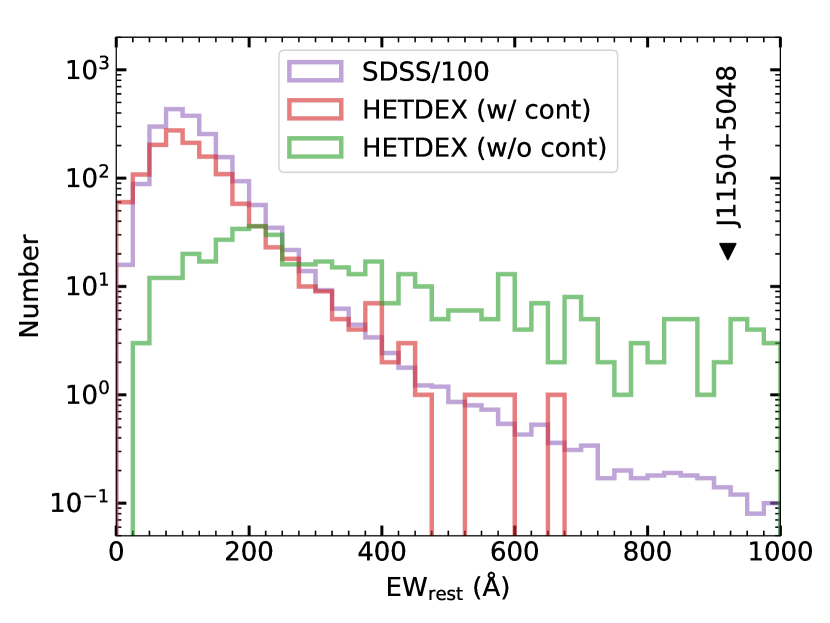
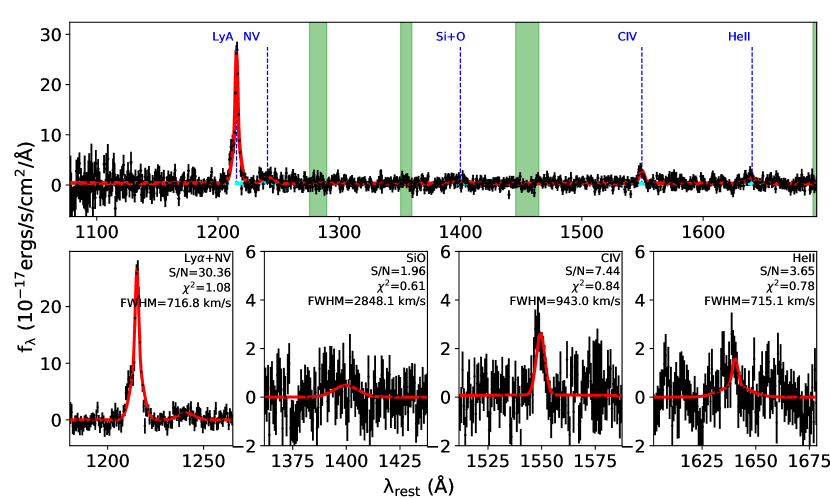
Figure 1 shows the distribution of the rest-frame EW of the LyN V emission of the HETDEX AGN with continuum detection (; red), that of the HETDEX AGN without continuum detection (; green), and that of the latest SDSS quasar catalog (purple; Pâris et al. 2018; Rakshit et al. 2020). Similar with the SDSS quasars, the number of the HETDEX AGN detected with continuum decreases with . The green histogram shows the distribution of the lower limits of for the HETDEX AGN not detected with continuum. In this paper, we study J1150+5048 as a representative case of the high EW AGN population with no continuum detection as it is detected with significant emission lines () at LyN V , C IV , and moderate emission line () at He II (Figure 2). Additionally, it has very deep -band imaging from HSC-DEX. It is a type-II AGN with narrow lines (). The fitting of the spectrum is detailed in Paper I. We fit a power-law continuum to the wavelength windows highlighted by the green shaded areas in Figure 2. The continuum subtracted emission lines are then fit with two Gaussian profiles if there is a significant broad component, otherwise a single narrow Gaussian profile is fit for each emission line.
Table 1 lists the basic information of J1150+5048. The EWs are measured directly from the ratio between the line flux and the best-fit continuum at the lines from the spectrum in Figure 2. The continuum level is in the spectrum, so the measured EWs are only lower limits. The lower limit of the rest-frame EW of the LyN V emission of J1150+5048 is 921 Å. This is significantly higher than the typical at 100 Å as indicated by the where the number of SDSS quasars is highest in Figure 1.
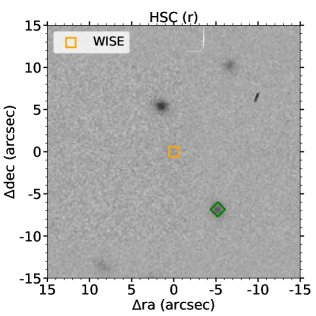
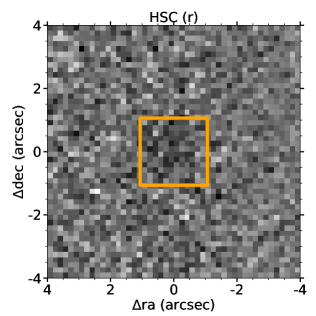
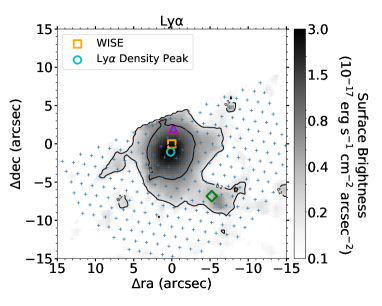
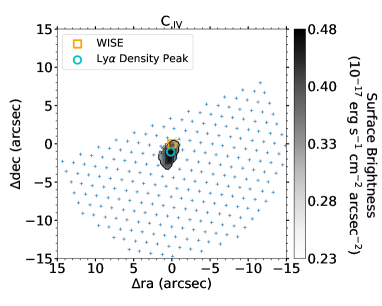
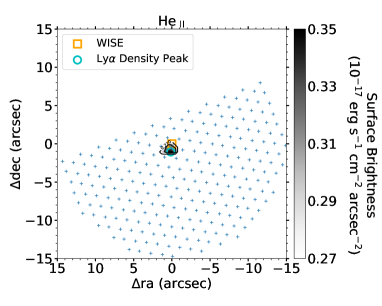
Figure 3 displays the -band cutout from HSC-DEX in the upper panels and the narrow band images ( Å) of the , C IV , He II emission lines from HETDEX in the remaining three panels. Only spatial pixels with the signal-to-noise ratio of emission lines greater than 1 are used to generate the narrow band images.
The flux from the emission line region is highly spatially resolved in J1150+5048 as shown by the middle panel of Figure 3. The seeing of this HETDEX observation is (FWHM). The Ly emission is clearly more extended than the other two emission lines. It spans a region of (85 kpc) in diameter. The recorded R.A. and Dec. of HETDEX in Table 1 is the coordinate where the line flux is highest (the cyan circle in Figure 3 and Figure 4). The recorded R.A. and Dec. of WISE in Table 1 is the coordinate of the continuum detection, taken from the WISE catalog (Cutri et al., 2021). All images in Figure 3 and Figure 4 are centered at the WISE coordinate. The offset between the emission-line center (HETDEX coordinate) and the continuum center (WISE coordinate) is .
The emission lines of J1150+5048 are strongly bimodal with a red peak at and a blue peak at as shown in Figure 4. The recorded redshift of in Table 1 is a combination of the red peak and the blue peak.
J1150+5048 is a non-detection () in -band measured from the HETDEX spectrum at the HETDEX coordinate. It has an IR detection in the WISE catalog (Cutri et al., 2021) with the W4 band (22 µm) being a non-detection. When measuring at the pointing of the IR detection from HSC-DEX, its -band magnitude is 24.57. The limiting magnitude of this field is . The spatial distribution of the -band flux of J1150+5048 (top panels in Figure 3) is strikingly different from the typical 24-25 mag sources (see the first two examples of Figure 12 in Paper I): It is too diffuse that it might be dominated by a spatially extended emission line, such as C III] , rather than the true continuum.
J1150+5048 is a non-detection in the Faint Images of the Radio Sky at Twenty-Centimeters survey (FIRST, Becker et al. 1995), while it has a radio detection at the location of the WISE source at from the LOw-Frequency ARray (LOFAR) Two-metre Sky Survey (LoTSS) (Shimwell et al., 2022).
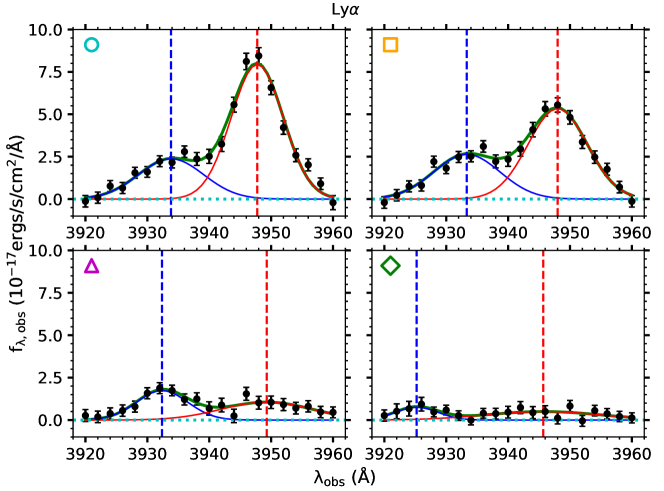
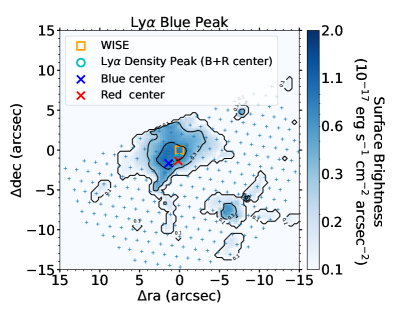

Figure 4 presents the line profiles at the four representative positions marked in the Ly narrow band image of Figure 3 in the upper two rows. The emission line clearly has two distinctive peaks. We decompose the emission line into a blue peak and a red peak with a double-Gaussian model. The velocity offset between the two peaks () does not change significantly with location. The bottom two panels shows the surface density maps of the decomposed blue peak and red peak respectively. The blue cross and the red cross mark the positions where the flux is highest for the blue peak and the red peak. The separation between the two centers is (10.1 kpc). For most of the spatial pixels, the blue peak is weaker than the red peak. This asymmetry is an evidence of outflows, as the near side of is resonantly scattered by an optically thick medium. The C IV and He II emission lines also display double peak profiles; however, the two lines are not sufficiently strong for spatial decomposition as was done for Ly.
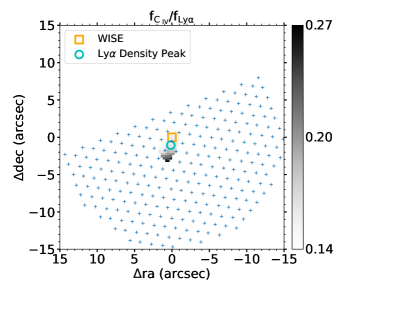
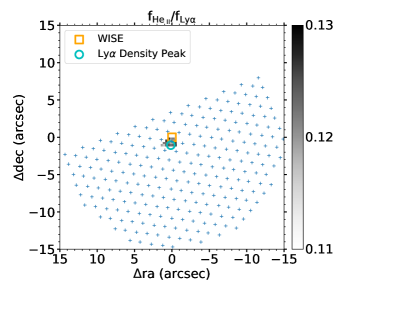
Figure 5 shows the line flux ratio of the C IV emission over the emission in the left panel and that of the He II emission over the emission in the right panel. The line ratio of C IV ranges from 0.1 to 0.3. The line ratio of He II ranges from 0.11 to 0.13. The combination of the C IV He II ratio and the C III] C IV would provide diagnostics for the ionization levels and the metallicities given quasar photoionization models (e.g. Guo et al., 2020). Unfortunately, the C III] emission is out of the HETDEX wavelength range. Lau et al. (2022) suggested that the the ionization parameter can be assumed to be . The C IV He II ratio of in at the density peak (shown by the cyan circle) would suggest a metallicity of . The spatially-integrated line ratio of out to ( 20 kpc) corresponds to a metallicity of . The metallicity enrichment suggests centrally-driven outflows to the host galaxy.
4 Discussion
There are several possibilities that can produce the high EW of J1150+5048; we discuss three possible explanations in this section.
4.1 Collapsing Protogiant Elliptical Galaxy
Adams et al. (2009) studied the famous radio loud AGN (B2 0902+34) at with VIRUS-prototype on the 2.7-m Harlan J. Smith Telescope. B2 0902+34 also has bimodal Ly emission line profile, and the Ly emission is extended with a radius of 50 kpc. The observed data was successfully reproduced with a model of a collapsing protogiant elliptical galaxy (). is a common era of galaxy formation. Massive galaxies and their formation have many signatures, most of which include a lot of emission in radio and infrared. B2 0902+34 is detected at 300 Jy in the FIRST survey. J1150+5048 is also covered by FIRST, but there is no radio excess within of the AGN. The radio detection of J1150+5048 in LoTSS at is also too weak compared to B2 0902+34. These may rule out the possibility of collapsing protogiant elliptical galaxy.
4.2 Off-centered SMBH
SMBHs can be ejected after merger event (Loeb, 2007; Haiman et al., 2009; Ricarte et al., 2021). If they happen to fall in a gas rich environment, the ejected SMBH can irradiate the inter-galactic medium (IGM) in its vicinity and appear as a naked BH with no host galaxy. The narrow band emission line flux maps in Figure 3 show that J1150+5048 might be related with the other -band detection covered by the HETDEX fibers marked by the green diamond which is . It has weak emission lines at similar redshift with J1150+5048 with a velocity offset of as shown by the spectra in Figure 4. If the green diamond is the original host and the WISE detection is the SMBH, then the separation between the two is (72 kpc).
4.3 Extremely Red Quasar with Strong Winds
The optical broad band imaging could be heavily obscured by dust in the outskirts of the host galaxy. Extremely red quasars (ERQs) are first were first identified in Ross et al. (2015) with , i.e. . They are revisited by Hamann et al. (2017) with the definition of and the rest-frame . Although J1150+5048 is a non-detection in the W4 band and it lacks the observation in -band, the color of and high indicates that J1150+5048 probably belongs to the ERQ population. The current photometric data is not sufficient to break the degeneracy among various models in the spectral energetic distribution. Photometric observations in more bands, such as -band and -band, might further help confirm whether J1150+5048 is an ERQ.
Many of ERQs are found in large-scale overdensities, we checked the full emission line catalog of the HETDEX survey (Cooper et al. in preparation) and only found one weak emitter candidate within (2.5 Mpc) at down to the detection limit of HETDEX at mag. J1150+5048 might not be in an large-scale overdensity.
Besides J1150+5048, we found that other high EW AGN in our catalog are all narrow-line AGN with , corresponding to the velocity dispersion of . Lau et al. (2022) also found that the halo of the ERQ they studied is kinematically quiet with the velocity dispersion of .
A significant fraction of our AGN sample has extended emission-line regions. Ouchi et al. (2020) collected emitters with measurements of their diffuse emission and found that the radius of diffuse emitters are correlated with the luminosities. The luminosity of their sample ranges from to . The spatially integrated luminosity of J1150+5048 is . The emission of J1150+5048 extends to kpc. J1150+5048 lies well within the scattered region of the correlation between the radius and the luminosity in Figure 13 of Ouchi et al. (2020).
The extended emission-line region can be explained either by central-driven outflows or by inflows from the circumgalactic medium. The blue peak of the emission is always weaker than the red peak. This suggests that the near side is more heavily scattered than the far side, and the gas flows are outflows rather than inflows. If the direction of the outflows are perpendicular to the line-of-sight direction, the separation between the blue peak and the red peak () would not change significantly with positions as was found in Section 3.
We estimate the outflow mass and the outflow rate of J1150+5048 following Equation 5 and 6 in Fluetsch et al. (2021). However, the H emission is not covered by the wavelength range of the HETDEX spectrum. We therefore make a simple assumption that the luminosity of the emission is around 1.5 times that of the H emission following (Allen et al., 1982). The electron density should be carefully calculated from doublets such as the [O II] /[O II] ratio and the [S II] /[S II] ratio, but these emission lines are again out of the wavelength coverage of HETDEX. We then take the typical of outflows from Fluetsch et al. (2021). With these two assumptions, the outflow mass and the outflow rate of J1150+5048 are then and 1.5 .
As shown in Figure 1, there are many other high-EW AGN in our catalog, although some are missing -band imaging, and some do not have significant emission line detected besides . By the time the HETDEX survey is complete, we expect the final AGN sample to be about five times larger than the current one. We will systematically study all AGN with high EWs. It is expected that many of these high-EW AGN are similar to J1150+5048 with red colors and bipolar outflows. It is interesting to study the outflow properties, such as the outflow mass and the outflow rate , as a function of luminosity, reddening, and redshift.
5 Summary
We have identified an AGN (J1150+5048) with extremely high EW at , with strong Ly, C IV , and He II emission lines and non-detected continuum in the HETDEX spectrum. The measured is a lower limit of its rest-frame line strength at Ly. Extended emission is measured at in the deep -band image () from the HSC-DEX survey. It has an IR detection in the WISE catalog, but it is a non-detection in the W4 band. The Ly emission line is significantly extended in the narrow band image spanning 10″ in diameter in the observation. The line profile of Ly is strongly bimodal. The decomposed blue peak and red peak separated from each other with . The line-of-sight velocity offset between the two peaks is .
Further statistical studies on the full high-EW AGN sample are needed to understand the relation among this sample, the ERQs, type-II AGN, and the AGN with diffuse ionized gas. These would provide key information in understanding the early quasar phases, galaxy quenching, and the enrichment of the intergalactic medium. The HETDEX survey is very efficient in such studies because the spatial resolved information is observed simultaneously while the emission-line sources are identified in the 18-min spectroscopic exposures with no pre-selection based on imaging.
References
- Adams et al. (2009) Adams, J. J., Hill, G. J., & MacQueen, P. J. 2009, ApJ, 694, 314
- Aihara et al. (2019) Aihara, H., AlSayyad, Y., Ando, M., et al. 2019, PASJ, 71, 114
- Allen et al. (1982) Allen, D. A., Barton, J. R., Gillingham, P. R., & Carswell, R. F. 1982, MNRAS, 200, 271
- Bahcall et al. (1994) Bahcall, J. N., Kirhakos, S., & Schneider, D. P. 1994, ApJ, 435, L11
- Becker et al. (1995) Becker, R. H., White, R. L., & Helfand, D. J. 1995, ApJ, 450, 559
- Cai et al. (2017) Cai, Z., Fan, X., Yang, Y., et al. 2017, ApJ, 837, 71
- Cutri et al. (2021) Cutri, R. M., Wright, E. L., Conrow, T., et al. 2021, VizieR Online Data Catalog, II/328
- Fluetsch et al. (2021) Fluetsch, A., Maiolino, R., Carniani, S., et al. 2021, MNRAS, 505, 5753
- Gebhardt et al. (2021) Gebhardt, K., Mentuch Cooper, E., Ciardullo, R., et al. 2021, ApJ, 923, 217
- Guo et al. (2020) Guo, Y., Maiolino, R., Jiang, L., et al. 2020, ApJ, 898, 26
- Haiman et al. (2009) Haiman, Z., Kocsis, B., & Menou, K. 2009, ApJ, 700, 1952
- Hamann et al. (2017) Hamann, F., Zakamska, N. L., Ross, N., et al. 2017, MNRAS, 464, 3431
- Hill et al. (2021) Hill, G. J., Lee, H., MacQueen, P. J., et al. 2021, AJ, 162, 298
- Kormendy & Ho (2013) Kormendy, J., & Ho, L. C. 2013, ARA&A, 51, 511
- Lau et al. (2022) Lau, M. W., Hamann, F., Gillette, J., et al. 2022, arXiv e-prints, arXiv:2203.06203
- Liu et al. (2022) Liu, C., Gebhardt, K., Mentuch Cooper, E., et al. 2022, arXiv e-prints, arXiv:2204.13658
- Loeb (2007) Loeb, A. 2007, Phys. Rev. Lett., 99, 041103
- Luo et al. (2017) Luo, B., Brandt, W. N., Xue, Y. Q., et al. 2017, ApJS, 228, 2
- McIntosh et al. (1999) McIntosh, D. H., Rieke, M. J., Rix, H. W., Foltz, C. B., & Weymann, R. J. 1999, ApJ, 514, 40
- McLure et al. (1999) McLure, R. J., Kukula, M. J., Dunlop, J. S., et al. 1999, MNRAS, 308, 377
- Ouchi et al. (2020) Ouchi, M., Ono, Y., & Shibuya, T. 2020, ARA&A, 58, 617
- Pâris et al. (2018) Pâris, I., Petitjean, P., Aubourg, É., et al. 2018, A&A, 613, A51
- Rakshit et al. (2020) Rakshit, S., Stalin, C. S., & Kotilainen, J. 2020, ApJS, 249, 17
- Ricarte et al. (2021) Ricarte, A., Tremmel, M., Natarajan, P., Zimmer, C., & Quinn, T. 2021, MNRAS, 503, 6098
- Richards et al. (2006) Richards, G. T., Strauss, M. A., Fan, X., et al. 2006, AJ, 131, 2766
- Ross et al. (2015) Ross, N. P., Hamann, F., Zakamska, N. L., et al. 2015, MNRAS, 453, 3932
- Shimwell et al. (2022) Shimwell, T. W., Hardcastle, M. J., Tasse, C., et al. 2022, A&A, 659, A1
- Stern et al. (2012) Stern, D., Assef, R. J., Benford, D. J., et al. 2012, ApJ, 753, 30
- Vayner et al. (2021) Vayner, A., Zakamska, N. L., Riffel, R. A., et al. 2021, MNRAS, 504, 4445
- Xue et al. (2016) Xue, Y. Q., Luo, B., Brandt, W. N., et al. 2016, ApJS, 224, 15