Surpassing the Standard Quantum Limit using an Optical Spring
Quantum mechanics places noise limits and sensitivity restrictions on physical measurements. The balance between unwanted backaction and the precision of optical measurements impose a standard quantum limit (SQL) on interferometric systems. In order to realize a sensitivity below the SQL, it is necessary to leverage a back-action evading measurement technique, or else exploit cancellations of any excess noise contributions at the detector. In this work, we extend that initial demonstration and realize sub-SQL measurement sensitivity nearly two times better than previous measurements, and with architecture applicable to interferometric gravitational wave detectors. In fact, this technique is directly applicable to Advanced LIGO, which could observe similar effects with a detuned signal recycling cavity. By exploiting quantum correlations created by an optical spring, we measure a total sensitivity below the SQL by 2.8 dB, corresponding to a reduction in the noise power by % below the quantum limit. Through the use of a detuned optical spring, this noise reduction is tunable, allowing us to choose the desired range of frequencies that fall below the SQL. This result demonstrates access to sensitivities well below the SQL at frequencies ranges applicable to LIGO, with the potential to extend the reach of gravitational wave detectors further into the universe.
1 Introduction
Through quantum mechanics and the Heisenberg uncertainty principle, there exists a standard quantum limit (SQL) on high precision measurements. Ground based gravitational wave detectors such as LIGO have achieved sensitivities that approach the SQL at frequencies near 100 Hz [1, 2]. As of the conclusion of the third observing run, the aLIGO detectors are within a factor of 2-3 of the SQL at 70 Hz [3, 4], with this quantity expected to improve at the start of the fourth observing run. In this letter, we develop a technique that could allow interferometric gravitational wave detectors to reach sensitivities below the SQL.
In an interferometric measurement such as LIGO, quantum noise exists in two parts: shot noise (imprecision noise) and quantum backaction (radiation pressure noise). Shot noise scales inversely with laser power and radiation pressure noise (RPN) scales proportionally to laser power. The uncertainty principle for these two quantities is given by
| (1) |
The SQL may be derived by analyzing this relationship. A spectral density for the imprecision and radiation pressure noise can be given by [5, 6]
| (2) |
| (3) |
where is a measurement rate and is the RMS of the oscillator’s zero-point fluctuations[5, 6]. By analyzing the equation of motion for a damped harmonic oscillator the mechanical susceptibility of the system is
| (4) |
where is a mechanical damping rate and is the fundamental resonant frequency of the oscillator. Equations 2, 3, and 4 lead to the total quantum noise (qn) in the system, given by
| (5) |
This quantity can be minimized with respect to the measurement strength to determine the corresponding level of minimum noise,
| (6) |
Plugging this into Eq 5 yields what is known as the SQL,
| (7) |
This quantity in the free mass regime for a two mirror Fabry-Perot cavity configuration, as tested in this work, is given by [7, 8],
| (8) |
where m is the mass and f is the frequency. Systems are generally not able to measure at SQL sensitivity or below due to other noise sources precluding it.
A variety of proof-of-principle sub-SQL techniques have been explored [9, 10, 11, 12, 13]. One method is using injected squeezed light, something that was accomplished by the detector group at aLIGO. In that work, a sub-SQL measurement of up to dB below was made by making use of injected squeezed vacuum states and by subtracting unwanted classical noises from the measurement [4]. This technique also takes advantage of a variational readout which makes use of a second field, often originating from the same laser source, to change the measurement quadrature [2, 4]. This letter makes use of a third method, by creating strong quantum correlations between radiation pressure and shot noise in an optomechanical system [14] via an optical spring [15]. Not until recently has someone been able to experimentally demonstrate any interferometric measurement with sensitivity below the SQL [5, 16]. The Mason et al. experiment utilized a cryogenically cooled high quality factor Si3N4 membrane resonator dispersively coupled to a Fabry Perot cavity which allowed a sensitivity measurement up to 1.5 dB below the SQL, at frequencies on the order of megahertz. We go beyond this previously ground breaking measurement by performing the experiment in the audio band, and forgoing dispersive coupling by instead employing a linear two-mirror cavity with a movable mirror. This operating range and optical setup is more akin to the current design of ground based gravitational wave detectors.
Previous experiments performed by our group [17, 18] were performed at room temperature. In order to surpass the SQL, two main upgrades to our system must be made. First, thermal noise must be combatted. This is realized with the addition of a cryostat cooler, bringing the cavity down to approximately K. Secondly, the frequency noise of the laser begins to limit noise levels at cryogenic temperatures. Frequency noise is addressed with the addition of a delay line interferometer.
2 Experimental Setup and Procedures
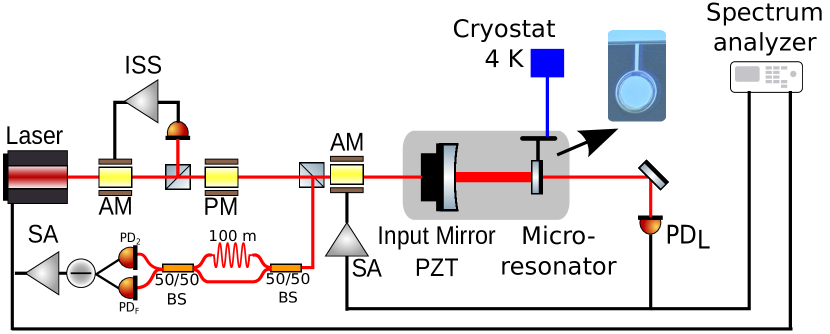
Our experimental setup consists of three main subsystems: the optomechanical (OM) cavity and associated feedback, a meter delay line interferometer, and an intensity stabilization server (ISS). The OM cavity utilizes a 1-cm long Fabry-Perot configuration incorporating a half inch input mirror with a radius of curvature of 1 in and a second m diameter GaAs/AlGaAs (23 pairs) Bragg reflector integrated on a low-noise single-crystal GaAs cantilever [17, 19]. The suspended micromirror has a mass of ng and a fundamental resonance frequency of Hz. The OM cavity is housed in a vacuum chamber ( torr) and is cooled cryogenically to about K. Cavity readout is realized via a Nd:YAG non-planar ring oscillator (NPRO) laser with wavelength 1064 nm.
The delay line interferometer is created by a free space path with the exception for the 100 meter long optical fiber that creates the optical path length difference between the two paths. The entirety of the delay line is kept at room temperature and atmospheric pressure. This subsystem has two functions. First, it is used to suppress the laser frequency noise (LFN). The interference of the two paths in the delay line is measured on two photodetectors, and in Fig. 1, and the two signals are subtracted from one another and sent to a PID controller to stabilize these fluctuations. This allows the interferometer to be locked to a stable value in order to facilitate its second function: precisely calibrating the LFN. With a precise calibration of the LFN and the measurement scheme described at lengths in Methods, we can study the noise spectrum free of LFN. Additionally, the final subsystem, an intensity stabilization servo (ISS), is used to suppresses classical relative intensity noise fluctuations.
At room temperature, thermal noise is much larger than the SQL, so we introduce a two stage cryocooler. The minimum temperature reached on the sample holder is K. However, the large mechanical vibrations introduced by the cryostation compresser frequently result in a loss of the cavity lock. For this reason, the cryostation compressor is turned off and the cavity slowly warms as a measurement is performed. All temperatures recorded refer to the final temperature at the end of the calibration and measurement process.
To compare the measured noise to the SQL we make use of modified measurement scheme from previous experiments. The ISS and cryostation reduce classical intensity noise (CIN) and thermal noise below the SQL, but laser frequency noise still remains. A precise measurement of the LFN can be subtracted at the time of measurement.
The light transmitted through the optomechanical cavity is maximized on . The signal from is sent through a servo amplifier (SA) before being sent to the second AM to lock the cavity. We lock the cavity with a detuning of where is the detuning in terms of linewidths of the cavity. The linewidth of the cavity (half width half maximum) is kHz. Given a detuning of 3.1 linedwiths, the corresponding circulating power is mW and the optical spring frequency is kHz. The mechanical quality factor of the cantilever at cryogenic temperatures is .
3 Results and discussion
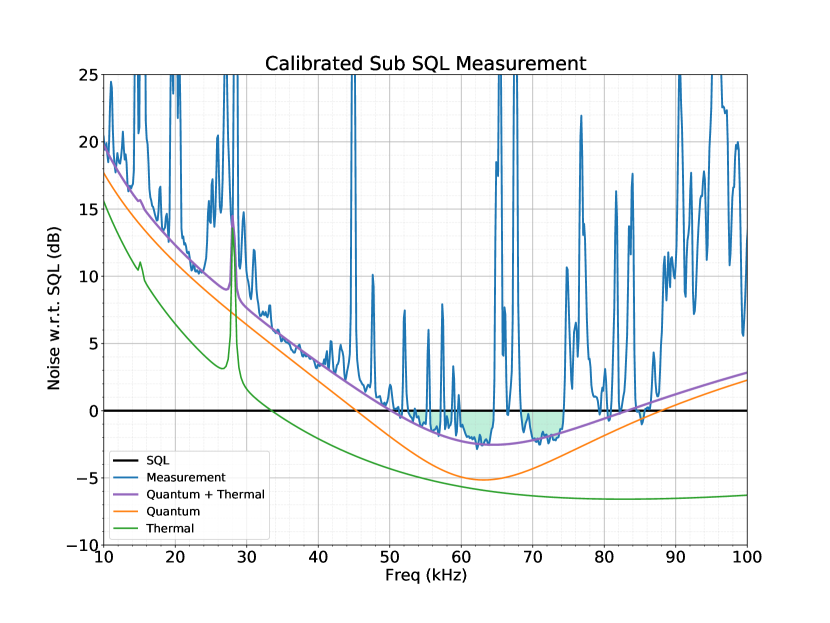
A displacement measurement as a ratio to the SQL of the system can found in Fig. 2. At an upper limit temperature of K, we observe up to a dB reduction below the SQL. Additionally, the frequency band at which any amount below the SQL is observed is between kHz - kHz, with the maximum reduction occurring at kHz. This maximum reduction corresponds to a reduction in the power spectral density. The orange and green curve represents the expected quantum and thermal noise respectively, as calculated by Ref [20]. Not pictured in Figure 2 is a measured noise level due to the electronics noise of the system, which we have found to be insignificant.
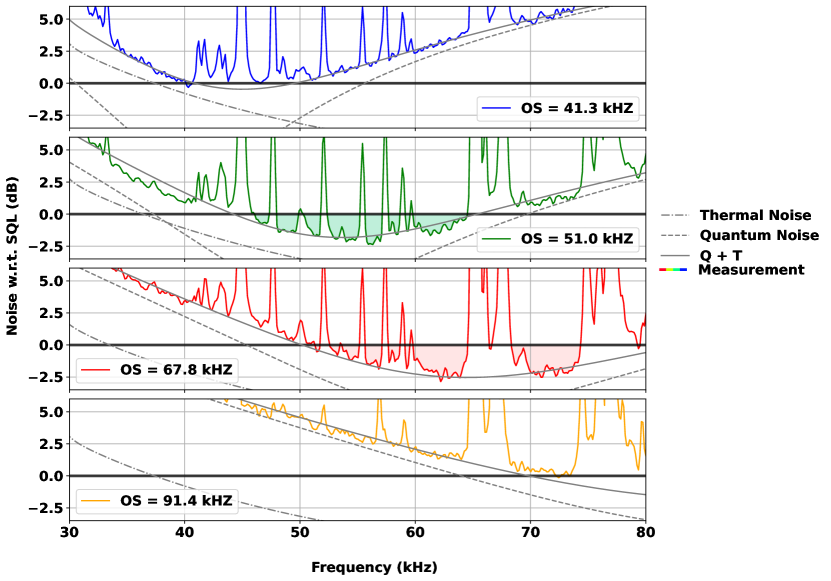
As the optical spring generates quantum correlations between shot noise and radiation pressure noise, we can adjust at which frequency we go below the SQL by changing the optical spring frequency. In this sense, we can create a tunable sub-SQL device as seen in Fig. 3. The optical spring frequency range that we observe sensitivities at or below the SQL is kHz - kHz. As seen in the top and bottom panels, at an optical spring frequency of and kHz, the calibrated noise measurement shown has the most sensitive portion equal to the SQL. For all optical spring frequencies in between, we see a reduction below the SQL. For the full range of optical spring strength, the measurement frequency range where sub-SQL sensitivity is observed is between kHz - kHz. Such tunability could be exploited for LIGO and other interferometric experiments if there is a specific frequency range of interest.
An at length discussion of the calibration technique can be found in the Methods section. Here we discuss the uncertainties associated with the experiment. There are two main contributions to the total experimental uncertainty: the uncertainty associated with our measure of the total noise, or our calibration technique, and the uncertainty in the magnitude of the SQL of our system, stemming from an uncertainty in the mass of the movable mirror (see Equation 8).
For a robust sub-SQL claim, we require that the uncertainty in the calibration technique be much less than the amount we beat the SQL by. For this reason it is important to constrain an uncertainty in the calibration process. This can be done through testing the repeatability of the calibration process with a fixed line, fed in through a Electro-Optic Modulator (EOM). We send a single frequency signal in, and measure the frequency response of this signal. This process was repeated to show that each measurement never had variations greater than of each other, setting the uncertainty due to the calibration process at just under .
Additionally, we must take into consideration how well we know the SQL for our system. In the free mass regime, this solely depends on the mass. In ref [19], the mass of the movable mirror was estimated to be ng. This was done through a calibrated measurement of the thermal noise of the system, in which Cripe et al. estimates a uncertainty in the mass. This propagated through the SQL free mass formula corresponds to a uncertainty in the SQL of our system. If we consider the ratio of our calibrated measurement to the SQL as our final quantity, such as the blue curve in Fig. 2, the total relative error of the experiment is . This is a significant value, as it is indeed less than the amount by which we are beating the SQL.
The displacement sensitivity of this system has been shown to beat a long standing goal in the quantum optics community. The results presented here show that the standard quantum limit can be beaten at frequencies and using mechanical systems relevant to gravitational wave detectors. Additionally, the creation of a tunable sub-SQL device has the potential to produce better gravitational wave detector sensitivity through the use of a detuned signal recycling cavity.
References
- [1] H. J. Kimble, Y. Levin, A. B. Matsko, K. S. Thorne, and S. P. Vyatchanin, “Conversion of conventional gravitational-wave interferometers into quantum nondemolition interferometers by modifying their input and/or output optics,” prd, vol. 65, p. 022002, Dec. 2001.
- [2] V. B. Braginsky, M. L. Gorodetsky, F. Y. Khalili, A. B. Matsko, K. S. Thorne, and S. P. Vyatchanin, “Noise in gravitational-wave detectors and other classical-force measurements is not influenced by test-mass quantization,” Phys. Rev. D, vol. 67, p. 082001, Apr 2003.
- [3] A. e. a. Buikema, “Sensitivity and performance of the advanced ligo detectors in the third observing run,” Phys. Rev. D, vol. 102, p. 062003, Sep 2020.
- [4] H. Yu, L. McCuller, M. Tse, and et al, “Quantum correlations between light and the kilogram-mass mirrors of ligo,” Nature, vol. 583, pp. 43–47, 2020.
- [5] D. Mason, J. Chen, M. Rossi, Y. Tsaturyan, and A. Schliesser, “Continuous force and displacement measurement below the standard quantum limit,” Nature Physics, vol. 15, no. 8, pp. 745–749, 2019.
- [6] M. Aspelmeyer, T. J. Kippenberg, and F. Marquardt, “Cavity optomechanics,” Reviews of Modern Physics, vol. 86, pp. 1391–1452, Oct. 2014.
- [7] V. B. Braginsky, Y. I. Vorontsov, and K. S. Thorne, “Quantum nondemolition measurements,” Science, vol. 209, no. 4456, pp. 547–557, 1980.
- [8] Y. Chen, “Macroscopic quantum mechanics: theory and experimental concepts of optomechanics,” Journal of Physics B: Atomic, Molecular and Optical Physics, vol. 46, p. 104001, may 2013.
- [9] N. S. Kampel, R. W. Peterson, R. Fischer, P.-L. Yu, K. Cicak, R. W. Simmonds, K. W. Lehnert, and C. A. Regal, “Improving broadband displacement detection with quantum correlations,” Phys. Rev. X, vol. 7, p. 021008, Apr 2017.
- [10] J. Suh, A. Weinstein, C. Lei, E. Wollman, S. Steinke, P. Meystre, A. Clerk, and K. Schwab, “Mechanically detecting and avoiding the quantum fluctuations of a microwave field,” Science, vol. 344, no. 6189, pp. 1262–1265, 2014.
- [11] E. E. Wollman, C. U. Lei, A. J. Weinstein, J. Suh, A. Kronwald, F. Marquardt, A. A. Clerk, and K. C. Schwab, “Quantum squeezing of motion in a mechanical resonator,” Science, vol. 349, no. 6251, pp. 952–955, 2015.
- [12] F. Lecocq, J. B. Clark, R. W. Simmonds, J. Aumentado, and J. D. Teufel, “Quantum nondemolition measurement of a nonclassical state of a massive object,” Phys. Rev. X, vol. 5, p. 041037, Dec 2015.
- [13] M. J. Yap, J. Cripe, G. L. Mansell, and et al., “Broadband reduction of quantum radiation pressure noise via squeezed light injection,” Nature Photonics, vol. 14, pp. 19–23, Jan 2020.
- [14] A. Buonanno and Y. Chen, “Quantum noise in second generation, signal-recycled laser interferometric gravitational-wave detectors,” Phys. Rev. D, vol. 64, p. 042006, Jul 2001.
- [15] T. Corbitt, Y. Chen, F. Khalili, D. Ottaway, S. Vyatchanin, S. Whitcomb, and N. Mavalvala, “Squeezed-state source using radiation-pressure-induced rigidity,” Phys. Rev. A, vol. 73, p. 023801, Feb 2006.
- [16] T. Xie, Z. Zhao, X. Kong, W. Ma, M. Wang, X. Ye, P. Yu, Z. Yang, S. Xu, P. Wang, Y. Wang, F. Shi, and J. Du, “Beating the standard quantum limit under ambient conditions with solid-state spins,” Science Advances, vol. 7, no. 32, p. eabg9204, 2021.
- [17] N. Aggarwal, T. Cullen, J. Cripe, and et al., “Room-temperature optomechanical squeezing,” Nat. Phys., vol. 16, p. 784–788, 2020.
- [18] J. Cripe, T. Cullen, Y. Chen, P. Heu, D. Follman, G. D. Cole, and T. Corbitt, “Quantum backaction cancellation in the audio band,” Phys. Rev. X, vol. 10, p. 031065, Sep 2020.
- [19] J. Cripe, N. Aggarwal, R. Lanza, A. Libson, R. Singh, P. Heu, D. Follman, G. D. Cole, N. Mavalvala, and T. Corbitt, “Measurement of quantum back action in the audio band at room temperature,” Nature, vol. 568, no. 7752, pp. 364–367, 2019.
- [20] T. Corbitt, Y. Chen, and N. Mavalvala, “Mathematical framework for simulation of quantum fields in complex interferometers using the two-photon formalism,” Phys. Rev. A, vol. 72, p. 013818, Jul 2005.
Methods
Laser frequency noise
This section describes the process we use to convert the measured signal on the photodetector, PDL, initially in , to a displacement measurement in . This requires an intermediary step of first converting from to by using a Mach-Zender interferometer with a m delay line. This can be done by examining the electric field incident on the photodetector at the end of the delay line. The light arriving at either and is comprised of two contributions, one from each arm of the delay line. This can be written as,
| (9) |
where the first term is from the shorter arm, and the second term is due to the phase accrued by the light in the longer arm. Because the difference between the length of the two arms (L) can be related to the time () the light takes to traverse the path, Equation 9 can be rewritten as,
| (10) |
The photodetector measures the square of the quantity which is,
| (11) |
where and have been rewritten in terms of new constants A and B. A and B represent the offset and amplitude of the interference pattern respectively. These quantities can be determined experimentally by driving the temperature of the monolithic laser crystal, which changes the frequency of the light produced by the laser. This process is also beneficial as it allows for an imperfect visibility when the two paths of the delay line interfere.
The derivative with respect to of Eq. 11 is then,
| (12) |
is obtained by sending a signal into a phase modulator (PM) and finding the frequency at which the signal on is minimized. The second harmonic is used because the first happens to lie on the PM’s, resonance making the signal noisy. Because of this is then,
| (13) |
We can then solve for the phase delay of the light, , using Equation 11,
| (14) |
where is the average value of the offset on . This value is kept constant via a PID controller and is fed back to the frequency tuning input of the laser. Plugging this into Eq 12 yields,
| (15) |
The quantity in Eq 15 has units of and is used to convert the light exiting the cavity, measured at , from to .
Now that we have a quantity in , we can use the length of the cavity, L, and the wavelength of light in the cavity, , to convert to a displacement measurement. By multiplying the spectrum in by , we obtain a quantity in . With our measurement in the proper units, the following section now focuses on how we subtract off this precisely calibrated laser frequency noise measurement.
Calibration and uncertainty
In order study the light exiting the cavity without laser frequency noise, we measure the frequency noise directly and subtract it from the measurement. In this experiment, this is done by first considering the power spectrum of the two signals, one from the feedback locking photodetector, , and the other at the end of the delay line, ,
| (16) |
| (17) |
where F is the frequency noise of the laser, is the signal from the transmitted light of the cavity, is the factor used to represent the ratio of gains between the two photodetectors, and is the shot noise contribution of . The cross correlation of the two signals can be written as,
| (18) |
The coherence between the two signals is defined as,
| (19) |
Plugging Equations 16, 17, 18 into Equation 19
| (20) |
Rearranging Equation 20 for , we find a frequency noise free measurement of the cavity can obtained by measuring the quantity,
| (21) |
Figure 4 shows the result of this calibration process compared to the SQL.
Noise model
The quantum and thermal noise curves found in Fig. 2 are calculated via code developed by Ref [20] and later adapted. Additionally, the SQL of the system is calculated by this code via the mechanical susceptibility. This code utilizes the two-photon formalism for optical fields, and can calculate expected noise signatures from noise sources such as radiation pressure and thermal noise. Careful consideration of certain experimental parameters, such as the cavity detuning, mechanical quality factor, temperature, and a number of optical loss parameters is required.
Acknowledgements
T. Cullen, R.P, S.A, H.C., and T. Corbitt are supported by the National Science Foundation grants PHY-1150531 and PHY-1806634. NA is supported by NSF grant PHY–1806671 and a CIERA Postdoctoral Fellowship from the Center for Interdisciplinary Exploration and Research in Astrophysics at Northwestern University. A portion of this work was performed in the UCSB Nanofabrication Facility.This document has been assigned the LIGO document number LIGO-P2200263.
Author contributions
Torrey J Cullen (T.J.C.) led the work, with this project being a major focus on his doctoral dissertation. This work was supervised by Thomas R Corbitt (T.R.C.). J.C. and T.R.C. designed and built the optomechanical cavity and a majority of its subsystems. T.J.C., H.C., and T.R.C. designed and built the laser frequency noise detection system and calibration process. T.J.C., R.P., and T.R.C. performed the measurements and performed the data analysis. T.J.C. wrote the manuscript with help from R.P. and T.R.C., and very helpful discussions with J.C.,G.D.C., and N.A., P.H., D.F., and G.D.C. fabricated the cantilever mirror used in this experiment.
Competing interests
The authors declare no competing interests.