A New Distance to the Supernova Remnant DA 530 Based on HI Absorption of Polarized Emission
Abstract
Supernova remnants (SNRs) are significant contributors of matter and energy to the interstellar medium. Understanding the impact and the mechanism of this contribution requires knowledge of the physical size, energy, and expansion rate of individual SNRs, which can only come if reliable distances can be obtained. We aim to determine the distance to the SNR DA 530 (G93.3+6.9), an object of low surface brightness. To achieve this, we used the Dominion Radio Astrophysical Observatory Synthesis Telescope and the National Radio Astronomy Observatory Very Large Array to observe the absorption by intervening HI of the polarized emission from DA 530. Significant absorption was detected at velocities and km s-1 (relative to the local standard of rest), corresponding to distances of 4.4 and 8.3 kpc, respectively. Based on the radio and X-ray characteristics of DA 530, we conclude that the minimum distance is 4.4 kpc. At this minimum distance, the diameter of the SNR is 34 pc, and the elevation above the Galactic plane is 537 pc. The km s-1 absorption likely occurs in gas whose velocity is not determined by Galactic rotation. We present a new data processing method for combining Stokes and observations of the emission from an SNR into a single HI absorption spectrum, which avoids the difficulties of the noise-bias subtraction required for the calculation of polarized intensity. The polarized absorption technique can be applied to determine distances to many more SNRs.
1 Introduction
A supernova remnant (SNR) is an expanding structure bounded by a blast wave that began with a supernova (SN). Understanding SNRs is vital to understanding many fundamental processes in the interstellar medium (ISM). For example, for some years after the initial explosion, an SNR disperses the products of stellar fusion and nucleosynthesis into the ISM, enriching its surroundings. At the same time, the expanding shock front compresses and heats the ISM, initiating chemical reactions that would not be possible otherwise (Dubner & Giacani, 2015). Given that a star explodes as a supernova roughly every 4010 years in our Galaxy (Tammann et al., 1994), and the age of our Galaxy is estimated to be around 1010 years (Sharma et al., 2019), the sheer number of Galactic SNRs that have existed means that a significant fraction of the ISM has been processed through an SNR at some point (Padmanabhan, 2001).
A reliable distance measurement to an SNR is required to model its physical attributes, such as size, age, expansion rate, energy, mass, and evolutionary stage. Unfortunately, due to the diverse characteristics of SNRs, no simple relationship between distance and their measurable attributes (e.g., surface brightness and angular size) can be derived (Green, 1984). As a result, distance determination has proven to be challenging for many SNRs. Of the 294 Galactic SNRs in Green’s catalog (Green, 2019), only 112 (38%) have recorded distances, and many of those are broad estimates with significant uncertainties111See https://www.mrao.cam.ac.uk/surveys/snrs/ for the current web version of Green’s catalog.
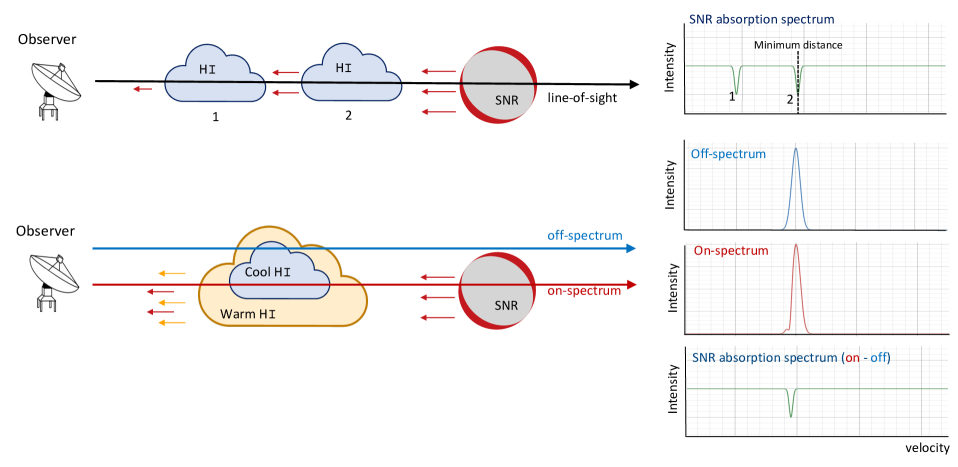
One of the most widely applied methods to date for determining distances to SNRs uses the absorption of their radio emissions by intervening neutral hydrogen gas (HI). Of the 112 SNR distances recorded in Green’s catalog, 51 have been determined by this method. HI between an SNR and an observer absorbs the SNR’s emission via the 21 cm (1420 MHz) electron spin-flip transition. This absorption can be used to estimate the distance to the SNR by placing lower limits on the SNR location. If there is HI absorption detected in the spectrum of an SNR, we can be certain that the SNR is some distance beyond the absorbing cloud. Since the frequency of the detected absorption line represents the motion of the cool HI, the distance to the absorbing HI cloud can be determined through Galactic kinematics. There may be several absorption features in the spectrum of an SNR, as its emission may pass through many cool HI clouds; the furthest absorption provides a minimum distance to the SNR (see the top panel of Figure 1; e.g., Schwarz et al., 1980; Foster et al., 2004; Kothes, 2013; Tian et al., 2019).
Despite its success, the HI absorption technique is limited to measuring distances for SNRs that are bright emission sources (Kothes et al., 2004). While cool HI primarily absorbs radio waves at 21 cm, warm HI primarily emits at 21 cm. As a result, the raw spectrum observed towards an SNR usually shows a mixture of continuum emission from the SNR and line emission from Galactic HI. In addition, cool HI absorbs the emission from warm HI at the same radial velocity (HI self-absorption). Unless the SNR has a brightness temperature significantly greater than the background warm HI emissions, it can be difficult to untangle these different effects.
In order to detect only the absorption of emission from the SNR, removal of the signal contributions from HI emission and self-absorption may be attempted. To do this, spectra are measured from a position on the SNR and from a nearby background position off the SNR (see the bottom panel of Figure 1). Assuming that the HI emission and absorption features in the off-spectrum are identical to those in the on-spectrum, subtracting the off-spectrum from the on-spectrum yields only the absorption spectrum for the SNR (e.g., Tian et al., 2007; Ranasinghe & Leahy, 2018).
There are two problems with applying this background subtraction technique for a low-intensity SNR. First, the subtraction of two noisy measurements further reduces the signal-to-noise. To improve this situation, the average emission from a much larger background region can be calculated to reduce the contribution of noise from the off-spectrum. However, this leads to the second problem: with a larger background region, it is less likely that the off-source HI brightness temperature matches what is actually on the source. If there is excess HI emission in the off-spectrum, then background subtraction will fabricate artificial absorption features. If there is HI self-absorption in the on-spectrum that is unmatched in the off-spectrum, the additional HI self-absorption features will remain in the spectrum after subtraction. Therefore, in order to correctly identify HI absorption of the continuum emission from the SNR, the SNR must be significantly brighter than the emitting HI along the line-of-sight (LOS).
We use the novel technique of measuring the absorption of polarized SNR emission in order to circumvent the ambiguity of HI self-absorption or the emission from small warm HI clouds at the same velocity. All SNRs are linearly polarized radio sources (via synchrotron emission), while HI emission is not polarized. As a result, if the linear polarization parameters, Stokes and (hereafter and ), are measured from an SNR rather than total intensity, Stokes , the excess emission from background HI is eliminated from the spectrum. Since there is no HI emission in the polarized on-spectrum, there is no need for background subtraction. Consequently, the problems due to background subtraction are no longer an issue.
Dickey (1997) pioneered the polarized HI absorption method when he demonstrated HI absorption of polarized Galactic extended emission (diffuse synchrotron radiation from relativistic electrons spiraling around interstellar magnetic field lines). Kothes et al. (2004) were the first to explore the use of polarized absorption for SNRs. From observations of the spectra of three SNRs, Tycho’s SNR, DA 495, and G106.3 +2.7, they showed that polarized HI absorption features tend to be deeper than their counterpart in total intensity and avoid the systematic noise contribution from small warm clouds. They concluded that polarized HI absorption could be used for any SNR and showed particular potential for detecting HI absorption towards weaker sources.
With the distances to a considerable number of Galactic SNRs still undetermined, the development of new techniques is essential for advancing our understanding of SNRs. Polarized HI absorption opens up the possibility of reliable detection of HI absorption in the spectra of very faint SNRs in order to establish their distance. This paper continues the investigation initiated by Kothes et al. (2004) by measuring the polarized absorption spectrum for the SNR DA 530.
DA 530 is an example of an SNR with low continuum emission to which it has been a challenge to establish a distance using traditional HI absorption. Landecker et al. (1999; hereafter L99) observed DA 530 with the Dominion Radio Astrophysical Observatory Synthesis Telescope (DRAO-ST). However, DA 530 is too faint to be able to detect HI absorption of its emission in total intensity, and the DRAO-ST did not have polarized spectrometry at the time. As a result, in 1999 a distance estimate by HI absorption was not possible with the DRAO-ST. Instead, L99 identified HI emission structures at km s-1 that they interpreted to be a stellar wind bubble associated with the progenitor star of DA 530. They concluded the systemic velocity of DA 530 to be the same as that of the proposed bubble, km s-1.
Assuming a systemic velocity of km s-1 for DA 530 led to distance estimates ranging from 2.2 kpc (Foster & Routledge, 2003) to 3.5 kpc (L99), as well as conclusions about associated parameters such as energy, age, and swept-up mass, which have informed the literature about DA 530 for over 20 years. Still, questions have persisted about the consistency of this distance estimate with accepted SNR models. For example, Jiang et al. (2007; hereafter Jiang07) found that this distance implies kinetic energy of the order of erg for DA 530, which is at the low end of the expected kinetic energy. A greater distance would be required to obtain a more typical energy estimate. In addition, when West et al. (2016) used computer modelling to describe the expansion of SNRs into the interstellar magnetic field, they determined that the tangential magnetic field of DA 530 could only be reproduced if the distance to the SNR were kpc.
In this paper, we use the polarized HI absorption method to investigate a new distance to DA 530, which improves the agreement with the models discussed above. DA 530 is one of the most strongly polarised SNRs in the Galaxy, with a percentage polarisation at 1420 MHz higher than 40% over a significant fraction of the remnant (L99). The high degree of polarization of the emission from DA 530 makes it an excellent candidate for the application of the polarized absorption technique.
2 Observations of DA 530
To obtain a polarized HI absorption spectrum for DA 530, we first used the National Radio Astronomy Observatory Karl G. Jansky Very Large Array (NRAO-VLA) in 2004 (data set referred to as VLA-2004). Subsequently, we used the DRAO-ST HI spectrometer and continuum correlator (data sets referred to as S21-2020 and C21-2020). To supplement our 2020 polarization data, we also have a Stokes HI data cube observed along the LOS towards DA 530 in 2012 by the DRAO-ST (referred to as S21-2012), with short spacings provided by the HI4PI survey (HI4PI Collaboration et al., 2016). The observing parameters for the four observations are given in Table 1. All four data sets are used in our analysis. The NRAO-VLA can achieve higher signal-to-noise with a shorter observation time. Set against this advantage, the field of view of the NRAO-VLA is smaller than that of the DRAO-ST, and only the central part of the NRAO-VLA field is usable due to instrumental polarization problems. In spite of these differences, the ability to compare polarized absorption spectra from two entirely different instruments, observed sixteen years apart, provides a unique opportunity to validate our results.
2.1 Observations by the NRAO-VLA
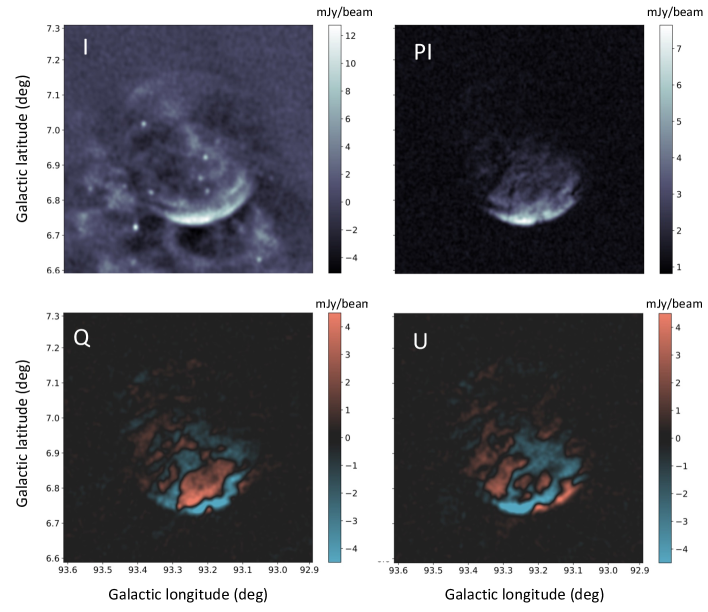
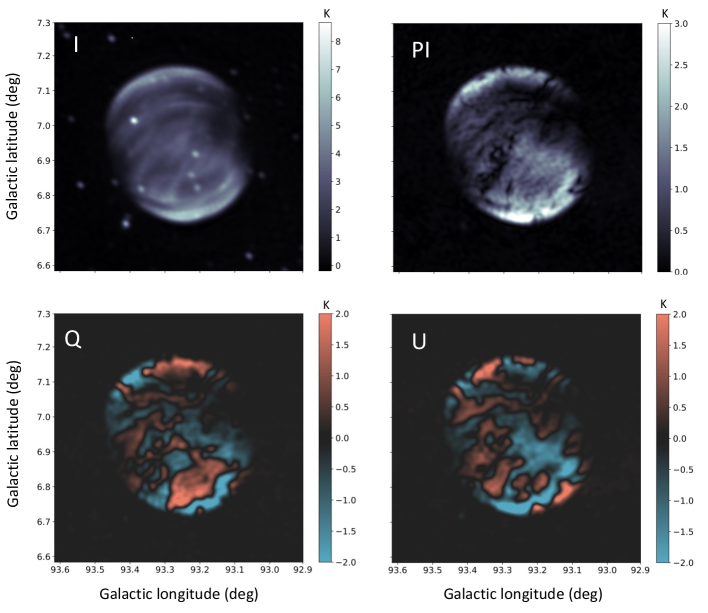
The VLA-2004 observations were made using the D configuration of the NRAO-VLA (baselines 35 m to 1 km). The primary beam of the 25 m NRAO-VLA antennas has a half-power beamwidth of 32′ at 1420 MHz, which is very close to the angular diameter of DA 530, and the field of view did not include all of the SNR. In addition, the NRAO-VLA has strong off-axis instrumental polarization (Uson & Cotton, 2008) and yields reliable data only very close to the field center, prompting us to center our observations on the southwest shell of DA 530, where the polarized intensity from the remnant is highest. Continuum images of DA 530 in Stokes , , , and linear polarized intensity (), created by averaging across the end channels of the VLA-2004 data cubes, are shown in Figure 2.
| Parameter | NRAO-VLA | DRAO-ST | DRAO-ST | DRAO-ST |
|---|---|---|---|---|
| (VLA-2004) | (S21-2012) | (S21-2020) | (C21-2020) | |
| Date of observation | July 22, 2004 | 2012 | 2020 June-July | 2020 June-July |
| Duration of observations | 6 h 1 field | 144 h 4 fields | 288 h 3 fields | 288 h 3 fields |
| Configuration | D | east-west | east-west | east-west |
| Field center: | 2052 + | 2052 +55.3∘ | 2052 + 55.3∘ | |
| RA DEC (J2000) | 2052 +55.3∘ | 2052 + 55.3∘ | ||
| 2052 +55.3∘ | 2052 + 55.3∘ | |||
| Field of view at 1.4 GHz | 32′ to half power | 2.65∘ diameter | 2.65∘ diameter | 2.65∘ diameter |
| to 20% | to 20% | to 20% | ||
| Synthesized beam at 1.4 GHz | 46′′ | 1′ | 1′ | 1′ |
| Sensitivity | 0.4 K | 2.9 K | 1.3 K | 0.4 K |
| Frequency center | - - - - - - - - - - - - | - - - - - - - - - - - - | - - - - - - - - - - - - | MHz |
| - - - - - - - - - - - - | - - - - - - - - - - - - | - - - - - - - - - - - - | MHz | |
| - - - - - - - - - - - - | - - - - - - - - - - - - | - - - - - - - - - - - - | MHz | |
| - - - - - - - - - - - - | - - - - - - - - - - - - | - - - - - - - - - - - - | MHz | |
| Velocity coverage | 109.4 km s-1 | 144.65 km s-1 | 144.65 km s-1 | - - - - - - - - - - - - |
| to 19.4 km s-1 | to 65.51 km s-1 | to 65.51 km s-1 | - - - - - - - - - - - - | |
| Bandwidth | 1.29 km s-1 | 0.82 km s-1 | 0.82 km s-1 | 7.5 MHz |
| Velocity resolution | 2.4 km s-1 | 1.3 km s-1 | 1.3 km s-1 | |
| Polarization | , , | , | , , | |
| Calibrator | 3C 147 | 3C 147 | 3C 147 | 3C 147 |
| 3C 286 | 3C 295 | 3C 295 | 3C 295 | |
| J2052+365 | 3C 286 | 3C 286 |
2.2 Observations by the DRAO-ST
As the VLA-2004 observations were not able to provide data for the entire remnant, we supplemented our study of DA 530 with observations from the DRAO-ST (Landecker et al., 2000) and obtained the S21-2020 and C21-2020 data. The DRAO-ST is an east-west interferometer consisting of seven dishes, 9 m in diameter, with a baseline range of 12.86 m to 617.2 m. The larger field-of-view, 2.65∘ diameter to 20% power, is more than sufficient to observe the full angular extent of DA 530. The S21-2020 observations of DA 530 were made using the HI spectrometer (the S21 spectrometer) of the DRAO-ST, which was designed to image Stokes only (Hovey, 1998), so we had to adapt it to measure and (see Section 2.3). The duration of the 2020 observations, about six times longer than the normal observing mode for this telescope, was chosen to ensure adequate sensitivity (see Table 1).
As a result of the polarimetry modifications to the S21 spectrometer, the S21-2020 observations of DA 530 only include and ; however, we were able to supplement our polarized data with the S21-2012 Stokes observations towards DA 530 (available in the DRAO data archive).
The continuum (C21) and S21 correlators of the DRAO-ST operate simultaneously during an observation. The C21 correlator has four frequency channels (centered at frequencies MHz, MHz, MHz, and MHz), which are outside the expected Galactic HI frequency range and therefore detects continuum emission in these bands. The resulting data products are Stokes , , and images for all four frequency bands (Landecker et al., 2000). The C21-2020 images of DA 530, made by combining the four continuum frequency channels, are shown in Figure 3.
2.3 Adapting the S21 spectrometer to be able to observe polarization
In order to observe and spectra for our S21-2020 data, the S21 spectrometer needed to be adapted to make polarimetry possible. Radio observations of polarization are achieved by correlating the signals from orthogonally polarized antenna feeds (Cohen, 1958). In the case of the DRAO-ST, each antenna is equipped with circular feeds measuring left () and right () circular polarization. When an interferometer correlates circularly polarized signals, each permutation of the and correlation products is comprised of two of the four Stokes visibilities, , , , and . Stokes visibilities are Fourier transformed during the imaging process to obtain maps of their corresponding Stokes parameters. The four possible correlation products are (Conway & Kronberg, 1969):
| (1) |
| (2) |
| (3) |
| (4) |
where the ∗ represents complex conjugation of the second signal.
Equations 1 and 2 are co-polar correlation products, where the same hands of circular polarization are correlated ( with and with ). If the emission source being observed is expected to have no circular polarization, then it can be assumed that Stokes is zero. In this case, the co-polar correlation products each represent half of , so and are equivalent. In its original configuration, the S21 spectrometer calculates both and , and the correlation products are summed to obtain as
| (5) |
Equations 3 and 4 are cross-polar correlation products, where the opposite hands of circular polarization are correlated ( with and with ). and can be obtained by summing the cross-polar correlation products as
| (6) |
| (7) |
In order to observe a polarized spectrum, the S21 spectrometer was converted from its normal mode of measuring co-polarization ( and ) to measuring cross-polarization ( and ) by interchanging the signal inputs. As a result, the computer that originally calculated RR correlations instead calculated LR, and the computer that calculated LL correlations instead calculated RL. Having only cross-polar correlations calculated by the S21 spectrometer meant that a Stokes spectrum towards DA 530 could not be generated; however, the S21-2012 Stokes cube was available to complete the data set.
3 Data processing
The two different telescopes used to make our observations of DA 530 each have unique data processing methods developed for the specific characteristics of the instrument. For example, data from the NRAO-VLA is processed using the AIPS software package (Greisen, 2003), while the DRAO Export Package (Higgs et al., 1997) is used for data from the DRAO-ST. In this section, we describe the telescope-specific imaging procedures that were applied to convert our raw DA 530 data into the final maps used in our analysis.
3.1 Processing the VLA-2004 observations
The VLA-2004 observations were reduced using the 31DEC18 version of the NRAO AIPS package (Greisen, 2003). The data format (used by NRAO before 2010) was translated to AIPS with task FILLM. Primary calibrators 3C 147 and 3C 286, with flux densities drawn from Perley & Butler (2017), and secondary calibrator J2052+365, were used to determine antenna phase (task CALIB). BPASS removed antenna-based bandpass using 3C 286 as calibrator. CALIB then derived antenna gain and phase, with interpolation between calibrations. Task PCAL solved for the polarization of the three calibrators and determined antenna-dependent polarization leakage. The right-left phase difference, required to calibrate polarization angle, was measured using 3C 286. All calibration values are determined from values averaged across the total spectrometer band of 1 MHz, with some edge channels excluded.
3.2 Processing the DRAO-ST observations
Before assembly into a mosaic, the radio continuum and polarization data for the individual fields observed by the DRAO-ST were carefully processed to remove artifacts and to obtain the highest dynamic range. The routines used to do this processing are described by Willis (1999) and are part of the DRAO Export Package. To process the S21-2020 spectrometer data, several procedures in the DRAO Export Package were modified to accommodate the unorthodox input connections to the S21 spectrometer. Two modifications were required, one to appropriately process polarization data, as opposed to total-intensity data, and one to calibrate the polarization data in the absence of total-intensity data.
The ST makes its observations over 12-hour periods, chosen by the demands of scheduling and the availability of targets above the telescope horizon. For processing, the visibilities are mapped onto the hour-angle range to . By assuming that Hermitian symmetry can be applied, visibilities observed outside this range are “mirrored” into it, replacing the observed visibilities by their complex conjugates (a standard technique in aperture-synthesis imaging; Thompson, 1989). The S21 spectrometer was designed for imaging HI, which is unpolarized; all Stokes parameters other than are therefore zero. Stokes is real, and the visibilities of Stokes , which are the Fourier conjugates of Stokes , are also real. The data therefore have Hermitian symmetry, and simple conjugation is all that is required when visibilities are mirrored into the to range.
The Export Package applies the mirroring to correlation products before and are calculated. Since the cross-polar products, and , are not Hermitian, the processing algorithm required modification. When was calculated, following Equation 7, any mirrored visibilities had to be multiplied by . Although this was a simple process, considerable time was required to understand the need for it (see Booth, 2021).
S21 spectrometer observations are usually calibrated from Stokes observations of compact sources (usually 3C 147 and 3C 295) using channels free of HI emission. However, when configured for polarimetry, the S21 spectrometer produced no Stokes data. Calibration of the S21-2020 and images was accomplished by comparing continuum and images from the C21 correlator, and also channels free of HI emission (for details of the C21-2020 data, see Table 1). This is likely less accurate than the usual calibration process, but our objective in this project is the detection of absorption, which requires relative measurements, not absolute.
4 Analysis
To detect absorption, a spectrum representing the average emission from regions on DA 530 as a function of velocity needed to be produced. In addition, with polarized emission data split between and , the data cubes required further processing to create a single plot from the separate and spectra. In this section, we describe the procedure for producing polarized absorption spectra for DA 530 from the VLA-2004 and the S21-2020 data sets.
The change in intensity of the emission from an SNR as the signal passes through a column of HI gas that is both emitting and absorbing is modelled through the radiative transfer equation,
| (8) |
where is the intensity of the observed SNR signal at velocity , is the path length, is the absorption coefficient, and is the emission coefficient (both appropriate for the frequency 1420.406 MHz). For gas that is both emitting and absorbing, the emission coefficient relates to the absorption coefficient via Kirchoff’s law,
| (9) |
where is the blackbody intensity at temperature and velocity . In the Rayleigh-Jeans limit the solution to the radiative transfer equation (in units of brightness temperature as a function of velocity) observed from a position on the SNR is
| (10) |
where is the continuum brightness temperature of the unabsorbed SNR emission, is the HI spin temperature, and is the optical depth at velocity , given by
| (11) |
For total intensity observations, the contributions from HI emission and absorption, expressed through the second term of Equation 10, need to be removed from the spectrum by background subtraction in order to detect the absorption of the SNR emission only. However, in this study we observed the spectrum in polarization, which means that the extra HI spin temperature term vanishes, since there is no polarized HI emission. Therefore, for our observations the brightness temperature of the and emission from the SNR can be expressed more simply as
| (12) |
4.1 Polarized absorption spectra for DA 530
An absorption profile for an SNR is often plotted as an optical depth spectrum in an exponential form, , as a function of velocity. To obtain the absorption profile for DA 530 in this form, we first subtracted the continuum maps (Figures 2 and 3) from the and data cubes. This resulted in two new data cubes where, for a position on DA 530, we have the continuum subtracted and brightness temperatures and , such that
| (13) |
After continuum subtraction the unabsorbed line is at and absorption features may be positive or negative, as and can have either sign.
To combine the and profiles, which would gain a factor of in sensitivity, we could calculate the linear polarized intensity absorption profiles (). However, a noise bias correction is required when calculating polarized intensity (see Wardle & Kronberg 1974). The noise correction is applied uniformly across each map in the data cube and therefore, any remaining localized noise that is not removed in the noise bias correction procedure remains to further reduce the signal-to-noise. For a low-intensity SNR like DA 530, this adds additional uncertainty to the absorption analysis. Therefore, instead of directly calculating polarized intensity, we obtained the optical depth spectrum for and separately by calculating a weighted average over regions on each cube, and then combined the results later. We weighted each velocity channel map in the and data cubes by multiplying each pixel with its corresponding pixel in the or continuum map (Figures 2 and 3). This ensured that the data values for the absorption signal were always negative, and gave higher weight to the pixels with greater signal-to-noise.
After multiplying the continuum subtracted maps (described in equation 13) by the continuum maps, we obtained the weighted brightness temperature for each pixel on DA 530, and , as
| (14) |
To calculate the weighted average for the optical depth spectra, we summed over selected regions on DA 530 in each of the weighted and data cubes, and divided by the square of the sum of the absolute continuum brightness temperature. This yielded the and weighted spectra,
| (15) |
where the index represents the pixel number out of total pixels in the selected region. Once the optical depth spectra were obtained for the same region in the and data cubes separately using the method described above, the and optical depth spectra were averaged to combine them into a single optical depth spectrum.
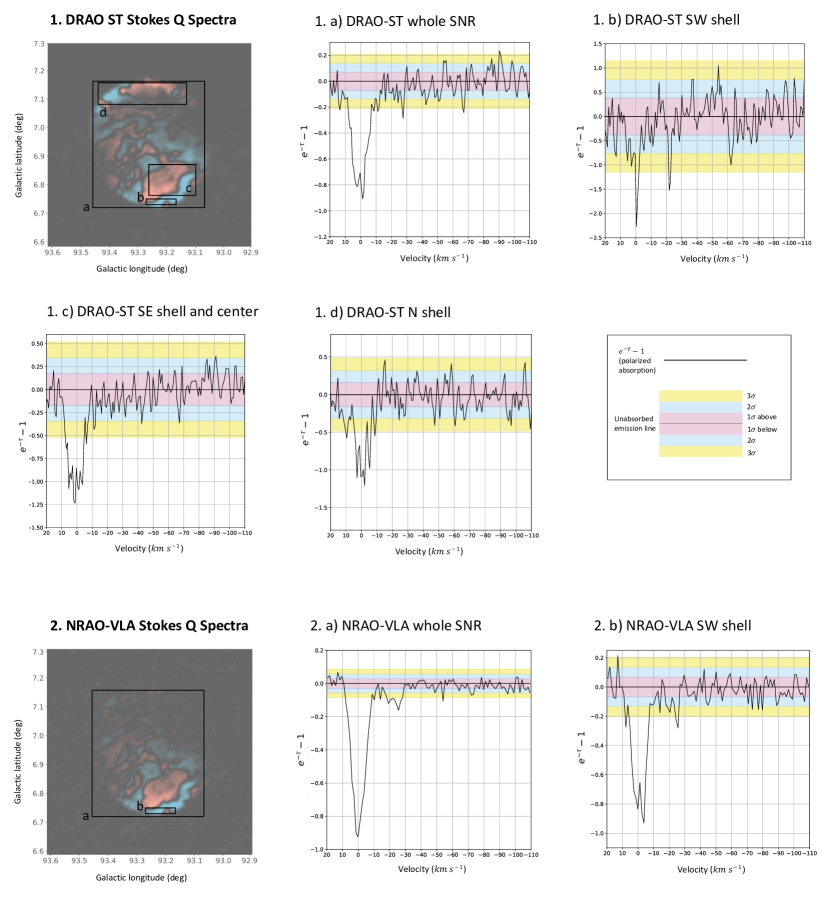
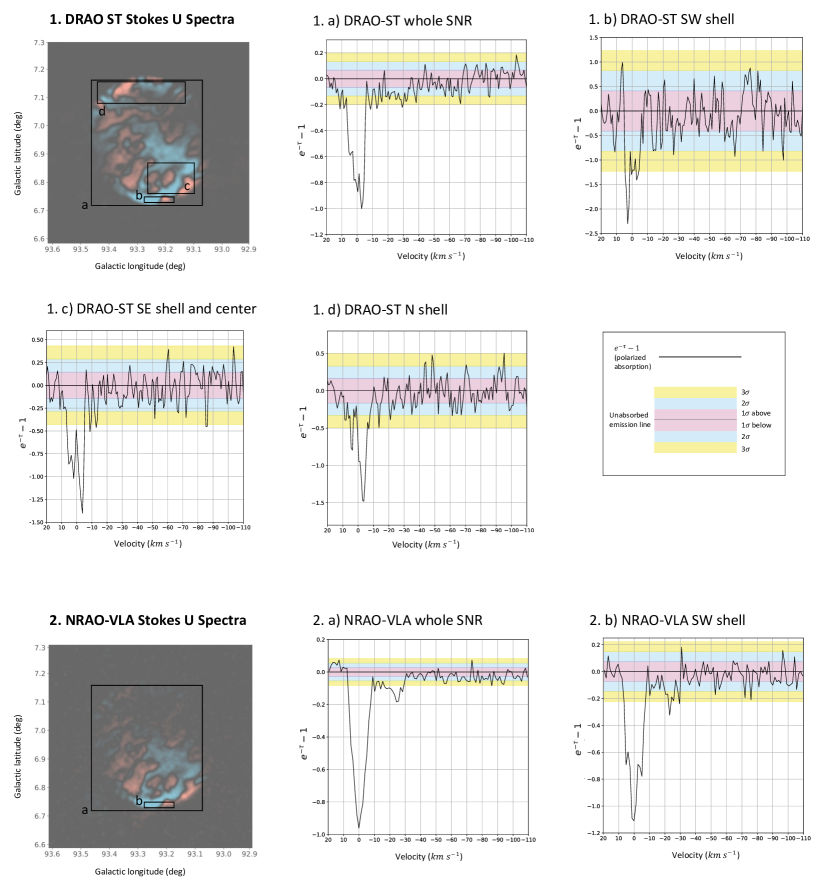
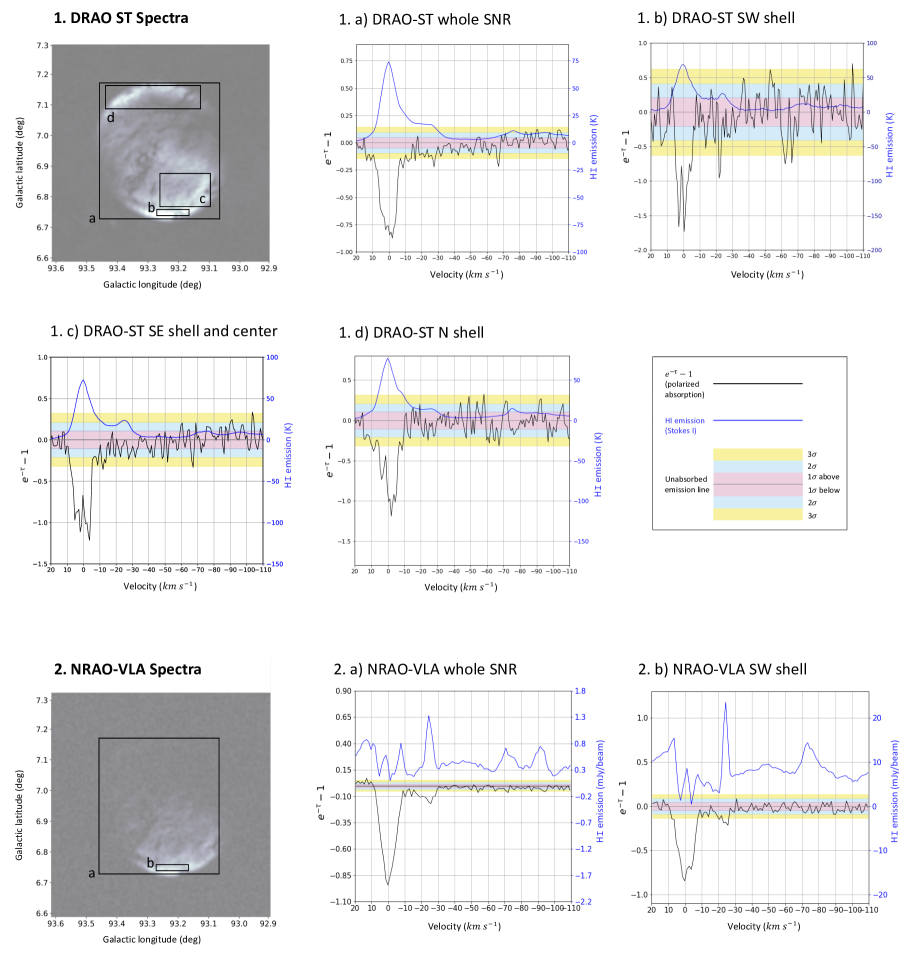
The final combined spectra for DA 530 are shown in Figure 4, with the the S21-2020 spectra on the top and the VLA-2004 spectra on the bottom. The separate and spectra are included in the Appendix as Figures 10 and 11. The standard deviation in each spectrum was calculated using the end channels of the spectrum, where there is unlikely to be absorption by Galactic HI. We consider a drop in optical depth below three standard deviations to represent statistically significant absorption. The velocity axis is shown from positive to negative because in the direction of DA 530 negative velocities of higher magnitude correspond to farther distances, if we assume a flat rotation curve for our Galaxy.
Differences in the observing characteristics of the NRAO-VLA and the DRAO-ST contribute to the differences between the two sets of spectra in Figure 4. For example, the NRAO-VLA has a smaller field-of-view than the DRAO-ST and strong off-axis instrumental polarization (see Section 2). This means that only the signal from the SW shell of DA 530, where the VLA-2004 fields were centred, is reliably included at full power in the NRAO-VLA spectra. In addition, the VLA-2004 data has half the velocity resolution of the S21-2020 data. As a result, the NRAO-VLA spectra have less noise than the DRAO-ST spectra, as more signal is included in each velocity channel; however, with a wider velocity resolution, channel width smoothing may remove narrow features from the NRAO-VLA spectra.
The different baselines of the two telescopes result in different - coverage. The NRAO-VLA, with its smallest baseline at 35 m and largest at 1 km, is more sensitive to small-scale structures and will not detect structures larger than approximately 15 at 1420 MHz. On the other hand, the DRAO-ST has baselines ranging from 12.86 m to 617.2 m and can therefore detect HI structures at much larger scales than the NRAO-VLA, up to 45 at 1420 MHz. In addition, the short spacings for the S21-2012 Stokes data cube, which was used to generate the HI emission spectrum for the DRAO-ST spectra (Figure 4, top two rows), were provided by the HI4PI survey (HI4PI Collaboration et al., 2016). The HI emission spectra for the NRAO-VLA were derived from interferometric data alone and do not contain information about large-scale structures. As a result, the blue HI emission curve in the VLA-2004 spectrum only represents emission from small-scale HI clouds.
4.2 HI column density
L99 calculated the total foreground HI column density toward DA 530 to be cm-2, using their HI emission profiles. They integrated up to a velocity of km s-1, which is the systemic velocity assigned to the HI bubble that is supposedly related to DA 530. However, calculating the HI column density from emission profiles alone has a large uncertainty because of the unknown optical depth of the absorbing gas.
As we now have optical depth spectra for DA 530 (see Figure 4), we are able to determine the HI column density more precisely. The absorbing foreground HI column density, , for each velocity channel can be calculated from the absorption spectra via (e.g. Kothes & Kerton, 2002)
| (16) |
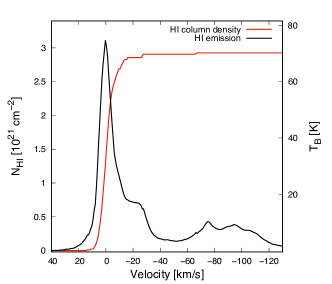
where is the HI emission brightness temperature in K and is the width of the velocity channels in km s-1. For our observations km s-1. Using the DRAO-ST absorption profile averaged over the whole remnant (see Figure 4), we obtained Figure 5, which shows the HI column density as a function of velocity, with negative velocities increasing in magnitude to reflect the accumulating HI column density at distances farther away from the Sun. This results in an averaged integrated absorbing foreground HI column density of cm-2 for DA 530. The uncertainty in the brightness temperature, , is essentially zero, and for the fractional uncertainty in the column density per velocity channel is
| (17) |
where is the uncertainty in the optical depth variable. From Figure 4.1.a, the uncertainty in the optical depth variable is and the optical depth is . From this, we find an uncertainty of 5-6% per channel. Therefore, the integrated column density over channels will have an approximate fractional uncertainty of 6%; integrated to 28 km s-1 we find cm-2.
5 Discussion
In our polarized absorption spectra, shown in Figure 4, there is absorption out to km s-1 in both the VLA-2004 and S21-2020 spectra. There is also absorption as far as km s-1 in the S21-2020 spectra; however, this absorption is not seen in the VLA-2004 spectra. Even though the km s-1 absorption is present in only one of the two data sets, we consider it to be real for the following reasons. First, the km s-1 absorption can be seen all over DA 530 in the S21-2020 spectra: in the south-west shell (Figure 4.1b), the south-east shell and the central region (Figure 4.1c), and the northern shell (Figure 4.1d). This feature is unlikely to be the result of noise. In addition, there are several reasons why the km s-1 absorption is not seen in the VLA-2004 spectra. Since it appears over a large area of DA 530, the absorbing HI is likely to be large-scale and diffuse. While the NRAO-VLA is quite sensitive to small-scale structure, it rapidly loses sensitivity to structures larger than 15. Additionally, since the absorption feature at km s-1 is quite narrow in the S21-2020 spectra, the lower velocity resolution of the VLA-2004 data set could result in this absorption being smoothed away.
The previously assumed systemic velocity for DA 530 was 12 km s-1 (L99), implying an unusually low energy for the SNR (Jiang07). Since negative velocities of higher magnitude correspond to farther distances in the direction of DA 530, our detection of absorption beyond km s-1 indicates that the SNR is farther away than the previous distance estimates associated with this velocity. A farther distance to DA 530 changes what we know about the characteristics of this SNR and adjusts the energy to a more typical range. In this section, we will discuss the new minimum distance to DA 530 and reinterpret some of the previous results for DA 530 due to the updated distance.
We note that the proposed stellar wind bubble described by L99 at km s-1 would need to have a peculiar velocity of km s-1 to be related to the lower absorption or a peculiar velocity of km s-1 to be related to the higher absorption. For an adiabatic gas, the local speed of sound is 0.103, where is the temperature of the warm neutral medium. For a warm neutral medium between 5000 K and 8000 K (lower and upper limits suggested by Kulkarni & Heiles, 1988) this is 8 km s-1. Since the proposed stellar wind bubble does not appear to be shocked (L99) as would be expected for it to have a peculiar velocity greater than the local speed of sound, we no longer consider this structure to be associated with DA 530. It is more likely to be a coincidentally shaped HI feature in the “frothy” ISM noted by L99.
5.1 Relating velocities to distances
Kinematic distances are only reliable estimates if the absorbing HI is moving with pure circular motion about the Galactic centre (rotation). This is only approximately the case for large-scale Galactic structures; for example, spiral arms themselves have a gravitational potential that can create non-circular velocities of order 5-10% of circular velocities. To estimate the distance to DA 530 kinematically, we apply the model of Foster & MacWilliams (2006). The idea behind this model is to improve kinematic distance estimates by reproducing brightness temperature, , spectra with a multi-parameter model of Galactic HI structure along a LOS. The model includes large-scale density features like the HI disk’s scale length, height, flaring of its thickness and the warp of the midplane, as well as density enhancements for spiral arms. The model also includes gravitational effects of spiral arms (which create features) calculated from density wave theory, including an empirical model of the shock that precedes spiral arms. While the LOS to DA 530 does not intersect with spiral features, the HI emission spectrum in Figure 4 shows the signature of the warped midplane. As a consequence of this geometry, the LOS to DA 530 enters the tilted disk more steeply from above and passes through it more vertically, than if the midplane were flat, creating a broad emission hump at km s-1. The warped disk component in the model (found at 12 kpc) reproduces the broad enhancement in the spectrum very well. The presence of this feature constrains the run of velocity-distance along the LOS to DA 530 especially well, and gives confidence in distances out to these velocities.
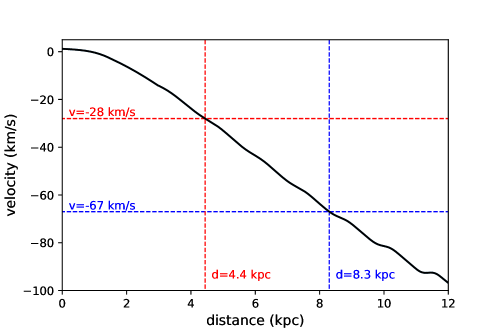
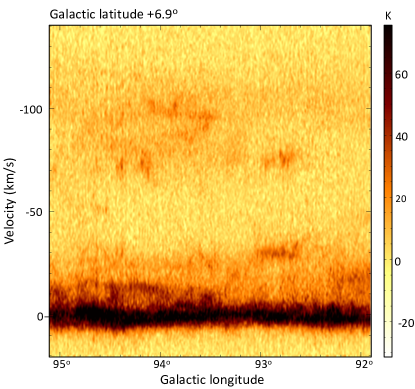
The velocity profile in Figure 6 shows the modelled relationship between velocity and kinematic distance for the LOS towards DA 530. Using this velocity profile we determine that the absorption at km s-1 corresponds to a kinematic distance of kpc and km s-1 corresponds to a kinematic distance of kpc. In Figure 7, we display the distribution of HI as a function of Galactic longitude and radial velocity from the S21-2012 Stokes data cube. There is smooth continuous HI emission up to a velocity of about km s-1. Therefore, the absorbing HI at km s-1 has motion that is consistent with Galactic rotation, with an uncertainty of km s-1 arising from the random motion of atoms within the cloud itself (Lockman, 2002). Applying this uncertainty to the km s-1 absorption, the corresponding kinematic distance of 4.4 kpc has an uncertainty range from 4.2 kpc to 4.8 kpc.
The absorbing HI at km s-1 cannot be easily identified as part of Galactic structure. In Figure 7, the only emitting HI gas at this velocity comes from isolated clouds. Thus, it is quite possible that the absorbing HI cloud at km s-1 has a peculiar velocity and the corresponding kinematic distance of 8.3 kpc is much less credible. We will use both 4.4 kpc and 8.3 kpc as possible minimum distances in our analysis, but recognize that the latter value is more tentative due to increased uncertainty.
5.2 Elevation above the Galactic plane
A distance of 4.4 kpc, from the absorption at km s-1, implies that DA 530 has a diameter of 34 pc and an elevation of pc above the Galactic plane. By contrast, a distance of 8.3 kpc, from km s-1, suggests that DA 530 is located at an elevation of 1004 pc above the Galactic plane and has a diameter of 65 pc. In addition, since these two distances come from absorption features that indicate a lower limit to the actual distance, the diameter and elevation for DA 530 may be even greater than these values.
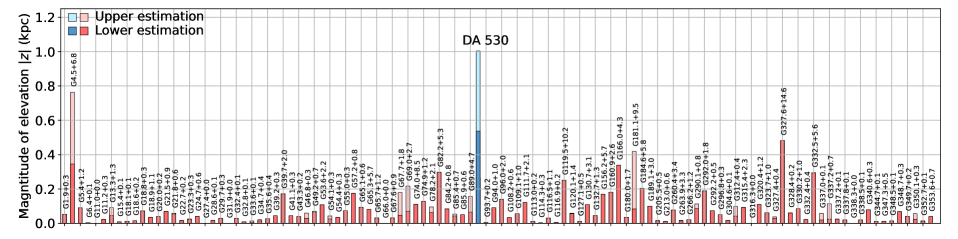
Figure 8 shows the magnitude of the elevation above the Galactic plane, , for the 112 SNRs in Green’s catalog (Green, 2019) that have recorded distance values. For SNRs with more than one distance recorded in the catalog, the largest distance is shown with a lighter shaded bar and the smallest distance with a darker shaded bar. The average magnitude of elevation for an SNR in this figure is pc with a standard deviation of 89 pc.
The elevations associated with our two absorptions for DA 530 are highlighted in blue in Figure 8. It is clear that with the new distances, DA 530 stands out as having a far greater elevation than the other Galactic SNRs. In addition, if DA 530 is at the upper limit elevation of pc, then it is the SNR with the highest elevation in the Galaxy, 10.4 standard deviations above the average. Even the lower limit elevation of pc is striking at 5.2 standard deviations above the average.
Jiang07 reported two x-ray emitting components inside the shell of DA 530: the pulsar wind nebula of a neutron star and thermal emission from the SN ejecta of an 8-10 Solar mass progenitor star. Consequently, DA 530 is believed to be the remnant of a type II core-collapse SN. The formation of the high mass stars that undergo core-collapse SN events is thought to be restricted to pc, and the majority of these stars spend their entire lifetimes close to the stellar cluster where they formed (de Wit et al., 2005). Finding an SNR resulting from a core-collapse SN at a height above pc is extraordinarily unusual. The next two highest SNRs (G4.5+6.8 - Kepler’s SNR and G327.6+14.6 - the remnant of the SN of AD1006) are the product of type Ia SN explosions; it is less surprising to find them at large elevations above the Galactic plane, as their progenitor stars have had more time to travel away from their place of birth.
The possible elevations for DA 530 discussed above do not take into account the Galactic warp, a twisting of the Galactic disk such that the Galactic plane rises to higher latitudes in the direction of DA 530 at large Galacto-centric radii. However, from the discussion in Lockman (2002), we conclude that the warp near longitude amounts to of latitude at velocity -30 km s-1 and at -70 km s-1. The elevations that we calculated, 537 pc and 1004 pc, are elevations above the unwarped mid-plane. If the warp is taken into account, at the Galactic latitude of DA 530, b= these elevations decrease to become 468 and 778 pc respectively. These elevations are still many standard deviations above the average.
t
5.3 Evolutionary phase
In this absorption study, we have found two possible minimum distances to DA 530, 4.4 kpc and 8.3 kpc. However, the 8.3 kpc distance is tentative because of the potentially large uncertainty in the velocity of the absorbing cloud (section 5.1) and because of the low likelihood of finding a type II SNR high above the Galactic plane, beyond the height distribution of all other SNRs by ten standard deviations (Section 5.2). Given a minimum distance to an SNR obtained by HI absorption, it is often possible to obtain an upper bound to the distance by measuring the HI absorption profile of a nearby (on the sky) extragalactic source. Emission from such a source can be expected to be absorbed in all significant HI structures along the line of sight, and absorption in HI at a kinematic distance beyond the SNR will supply the desired upper limit. For example, this technique was applied by Kothes et al. (2003) in placing bounds on the distance to the PWN CTB 87. Unfortunately, there is no suitable extragalactic source in the vicinity of DA 530. Instead, we constrain the distance by examining which of the two minimum distances supports realistic physical attributes for DA 530.
The first step is to determine the evolutionary phase of DA 530 in order to establish which model of SNR development can be used to estimate the physical characteristics of the SNR. SNR evolution proceeds through four phases: the free expansion phase, the adiabatic expansion or Sedov-Taylor phase, the radiative or pressure-driven snowplow (PDS) phase, and dispersion. L99 considered DA 530 to be in the Sedov-Taylor phase of its development, implying that radiative energy loss from the expanding shell is still negligible (Sedov, 1959). Their main arguments for this were: 1. a lack of optical emission; 2. the high fractional polarization, indicating a well-ordered magnetic field; 3. the small amount of swept-up material deduced from ROSAT X-ray data. We consider each of these arguments in turn.
-
1.
The lack of optical emission implies the absence of highly compressed radiative filaments that would be present in the radiative SNR phase. Hence we infer that DA 530 is not yet in the radiative phase.
-
2.
Observationally, DA 530 is highly polarized across a wide frequency range, showing 40% fractional polarization at 1.4 GHz (L99) and at 2.7 and 4.75 GHz (Haslam et al. 1980; Lalitha et al. 1984). As well, the magnetic field in its shell is tangential (Kothes & Brown, 2008). Young SNRs in their free-expansion phase typically have highly turbulent magnetic fields, leading to very low fractional polarization, and the polarized emission that remains indicates radial magnetic field alignment (West et al., 2017). Cas A, with 5% polarization (Reich, 2002), is one example of a young SNR. Another example is G11.20.3, which has a mere 2% integrated polarization at 32 GHz, displaying both radial and tangential fields in its shell, and is probably in transition from free expansion to the Sedov-Taylor phase (Kothes & Reich, 2001). By contrast, the tangential magnetic field of DA 530 and the high degree of polarization of its emission indicate that DA 530 has likely evolved well past the free expansion phase.
-
3.
Interpreting their ROSAT data, L99 found an X-ray emitting swept-up mass of 3.9 , assuming a distance of 2.5 kpc. They assumed a type Ia SN explosion on the basis of the high latitude of DA 530, and such a remnant typically has only of ejecta. The beginning of the Sedov-Taylor phase marks the time when the swept-up material starts to dominate the hydrodynamics of the expanding SNR (Sedov, 1959). According to the simulations by McKee & Truelove (1995), this point is reached when the swept-up mass is about 1.6 times the ejecta mass. Therefore, this relatively small swept-up mass of 3.9 suggests that DA 530 is just entering the Sedov-Taylor phase.
Newer CHANDRA X-ray observations now imply that DA 530 is a type II core-collapse explosion with an ejecta mass of 8 to 10 (Jiang07). In this case, the amount of swept-up mass calculated by L99 points to a freely expanding SNR. However, the estimated swept-up mass increases with distance squared. Our new distance estimates imply a greater swept-up mass, supporting the argument that DA 530 is in the Sedov-Taylor phase.
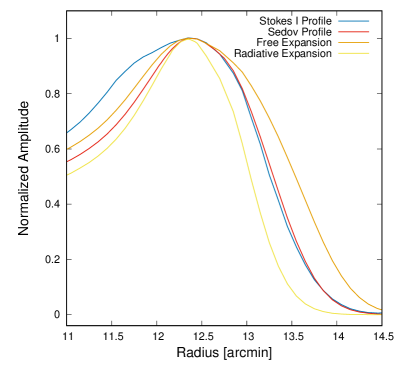
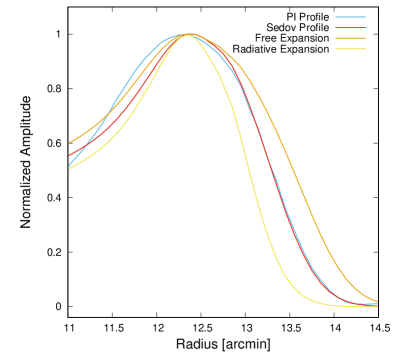
Another way of distinguishing between the evolutionary phases of an SNR is through the compression factor in its shell. We simulated SNR shells with different compression factors using the technique of Kothes et al. (2017) and compared the simulated radial profiles with the observed profile of the northern shell of DA 530 from the C21-2020 maps. We simulated spherical shells on a grid of 0.1 pc and integrated emission along the line of sight to produce a map, which we then convolved with the ST beam. The compression ratio of an SNR in its Sedov-Taylor phase is 4 (Sedov, 1959); younger SNRs in the free expansion phase have a lower compression ratio, and older SNRs in the radiative phase have a higher compression ratio.
In Figure 9, we compare simulated radial profiles with the observed profile of the northern shell of DA 530, averaged over approximately 30% of the SNR circumference. We show total intensity, Stokes , and polarized intensity, PI. We must restrict this comparison to emission beyond the peak of the profiles (radius ) because of the substructure in the interior of DA 530. We normalized the radii of the simulated and observed SNR shells to align with the peak emission on the shell. This peak is at the inside edge of the shell, where the line of sight through the shell is longest. The comparison in Figure 9 clearly shows that the radial profile for the simulated Sedov-Taylor phase best describes our observations. An SNR in free expansion would be wider, simply because the compression ratio is lower, whereas a radiative phase SNR, with its higher compression, would show a steeper profile. Based on this experiment, and the facts discussed in the preceding paragraphs, we proceed on the assumption that DA 530 is in the Sedov-Taylor phase of its development.
5.4 Physical characteristics of DA 530
We now discuss which of the two minimum distances supports reasonable physical characteristics for DA 530. We consider both possible distances, 4.4 and 8.3 kpc, and make extensive use of the CHANDRA X-ray observations of the SNR reported by Jiang07. They found synchrotron emission from a pulsar wind nebula, and thermal emission from a combination of shock-heated ejecta and swept-up material in the interior, projected on the front and back faces of the shell.
For the remainder of our discussion, we will assume that the diffuse thermal X-ray emission studied by Jiang07 is completely dominated by emission from the shock-heated ejecta, and that the contribution from the swept-up material is negligible. We support this assumption with the following arguments. First, the high over-abundance of silicon found by Jiang07 indicates that a significant amount of the thermal emission must come from the ejecta. Combined with the fact that they found one temperature with relatively low uncertainty, this indicates that the ejecta component is the dominating one. During the Sedov phase, the temperature of the ejecta should be higher than the temperature of the swept-up material (Jiang07), and foreground material will more strongly absorb thermal X-ray emission at lower temperatures. Neither the ROSAT observations of the entire remnant (L99), nor the XMM observations of its southern shell (Bocchino et al., 2008), show significant thermal emission related to the SNR shell, where the thermal emission from swept-up material should be the greatest. The thermal X-ray luminosity from the swept-up material should be proportional to the line of sight through the X-ray emitting area, which in this case is the SNR shell. The longest line of sight through the shell is where we look along the shell, and this area was covered by the ROSAT and XMM observations. The shortest line of sight is in the centre, where we look perpendicular to the thin shells that are expanding towards us and away from us. In the Sedov phase, the shell thickness makes up 10 % of the radius. In this case, the ratio of the longest line of sight to the shortest line of sight through the X-ray emitting area is 3:1. As a result, we can assume that any contribution from the shells is negligible in the CHANDRA observation compared to the emission from shock-heated ejecta. Therefore, we will not use the results of Sedov-Taylor modelling based on the CHANDRA observation presented by Jiang07. However, we will return to the lack of thermal emission from the shells due to swept-up material in the next subsection.
Jiang07 presented two sets of results based on two different values for the absorbing foreground column density: , estimated by L99, and , obtained by allowing the foreground column to be a free parameter in the Jiang07 fitting of X-ray spectra. The L99 value was based on the emission profiles of HI and CO, with an assumed average optical depth. The CO data used in that work has a very low angular resolution (), and more recent observations of higher resolution indicate that the CO emission mostly lies just outside the eastern border of the SNR, with only faint emission covering the northern shell (Jeong et al., 2012). Therefore, we will ignore any contribution of molecular gas to foreground absorption in interpreting the CHANDRA X-ray data and will only use the results produced by Jiang07 related to the lower foreground column density.
In our absorption study, we calculated a foreground neutral hydrogen column of (see Section 4), which is within the upper end of the range for the total hydrogen column obtained from fits to the CHANDRA spectra. However, our value is based on the absorption profile for the entire remnant, and we find that the absorption on the southern and northern shells is somewhat deeper than the average. We cannot derive a reliable absorption profile for the central regions covered by the CHANDRA observations because the polarized emission is low there. Consequently, we regard our value as an upper limit to the absorbing column in front of the X-ray emission detected by CHANDRA.
Accounting for the area missed in the CHANDRA observation, Jiang07 found an X-ray emitting mass of,
| (18) |
where is the distance in units of 2.2 kpc (the distance adopted in that paper) and is the filling factor. Assuming a filling factor of 1 and translating this estimate to our two possible distances, we obtained 9.6 M⊙ for a distance of 4.4 kpc, and 47 M⊙ for 8.3 kpc (Table 2). The lower mass of 9.6 M⊙ is credible for a typical type II SN explosion, but the higher mass of 47 M⊙ stretches credulity. Such a mass is virtually impossible for a typical population I star with solar abundances: a star of this mass would lose its outer layers in a strong stellar wind (like a Wolf-Rayet wind). If the filling factor is less than 1, the mass increases, making the farther distance even more improbable.
We used simulations by McKee & Truelove (1995), which describe the early free-expansion and the subsequent Sedov-Taylor phase of an SNR, and those of Cioffi et al. (1988), which describe the eventual PDS phase, to understand DA 530 and its environment.
At the onset of the Sedov-Taylor phase, the radius, , and age, , of the remnant are (McKee & Truelove, 1995)
| (19) |
and
| (20) |
At the onset of the PDS phase, for solar abundances, the corresponding quantities, (in pc) and (in years), are (Cioffi et al., 1988)
| (21) |
and
| (22) |
In these equations represents the mass of the ejecta in , is the explosion energy in units of ergs, and is the ambient number density in cm-3.
For the two possible minimum distances, we calculated limits on the ambient density and on the age of DA 530, assuming it is in the Sedov-Taylor phase, using the radii and ejecta masses calculated for the two distances. We used two explosion energies, and , to cover the range of energies considered typical for type II SN explosions (e.g. Pejcha & Prieto, 2015), with results shown in Table 2. Since the radius at the onset of the Sedov-Taylor phase depends only on the ambient density, not on the explosion energy, the lower limit for in Table 2 is the same for both values of . Most of the results in Table 2 are quite reasonable, although the age limits for the larger distance are quite high. However, for the combination of the larger distance and the lower explosion energy, the upper limit for the age is lower than the lower limit, implying that, in this extreme case, the SNR would never expand adiabatically, moving directly from free expansion into the radiative phase.
| Parameter | kpc | kpc | ||
|---|---|---|---|---|
| Radius [pc] | 17 | 32.5 | ||
| Ejecta mass [M⊙] | 9.6 | 47 | ||
| Explosion Energy [ erg] | 0.1 | 1.0 | 0.1 | 1.0 |
| Ambient density [cm-3] | ||||
| Age [yr] | ||||
| Ambient density [cm-3] | ||||
| Age [yr] | ||||
For each of the two possible minimum distances, we attempted to find a set of parameters that reasonably match the observed characteristics of DA 530. The results are summarized in Table 3. These results are not the final proposed characteristics of DA 530. Instead, they are values obtained by modelling the situations where DA 530 is at each of the two distances to help establish which lower-limit distance supports sensible physical characteristics for the SNR.
First, we utilized data from extragalactic supernovae (SNe). Pejcha & Prieto (2015) studied extragalactic type IIP SN explosions and found a correlation between explosion energy and ejecta mass. For the lower ejecta mass value of 9.6 M⊙, we obtained an explosion energy of ergs for DA 530 from the relationship they presented. However, Pejcha & Prieto (2015) did not observe ejecta masses above 30 M⊙, as those are improbable for type IIP SNe, so high ejecta masses were not included in their relationship. Therefore, in the absence of a model to obtain an explosion energy from the higher ejecta mass value of 47 M⊙, we used the canonical value of erg, which is also in the high explosion energy range for typical type IIP SNe in Pejcha & Prieto (2015).
Second, we examined the XMM observations of DA 530 of Bocchino et al. (2008), who detected a bright, high-energy X-ray source, spatially coincident with one of the inner radio shells of DA 530. Bocchino et al. (2008) proposed that this might be a pulsar-wind nebula surrounding a fast-moving pulsar, a relic of the initial explosion. Given the detection of a pulsar-wind nebula near the centre of DA 530 by Jiang07, this explanation does not seem tenable. However, the X-rays could arise from accelerated electrons or as thermal emission from hot plasma. Since the X-ray emission is coincident with an inner radio shell, it could mark the interaction of the reverse shock with the SN ejecta. In this case, DA 530 would be a very young SNR, just entering the Sedov-Taylor phase, with a ratio between blast-wave and reverse-shock radii of 1.4. Using the equations of McKee & Truelove (1995), we calculated the characteristics of DA 530 for this possibility and present them in Table 3 for both possible distances.
Also presented in Table 3 is a second set of parameters, calculated in the same way, treating DA 530 as a well-evolved SNR in which the reverse shock has already reached the centre. An intermediate location for the reverse shock would leave ejecta in the centre, which are not yet shock heated, causing a central minimum of emission; there is no evidence of such a ‘hole’ in the CHANDRA X-ray data (Jiang07).
| Early Sedov-Taylor phase | Evolved Sedov-Taylor phase | |||
|---|---|---|---|---|
| Distance [kpc] | 4.4 | 8.3 | 4.4 | 8.3 |
| Radius [pc] | 17 | 32.5 | 17 | 32.5 |
| Ejecta mass [M⊙] | 9.6 | 47 | 9.6 | 47 |
| Explosion Energy [ erg] | 0.32 | 1.0 | 0.32 | 1.0 |
| Ambient Density [cm-3] | 0.036 | 0.025 | 0.25 | 0.18 |
| Age [years] | 9900 | 24000 | 20500 | 50000 |
| Blastwave Shock Velocity [km s-1] | 900 | 750 | 350 | 280 |
| Blastwave Postshock Temperature [keV] | 1.0 | 0.7 | 0.15 | 0.09 |
| Reverse Shock Postshock Temperature [keV] | 0.7 | 0.5 | - | - |
| Swept up Mass [M⊙] | 24 | 115 | 170 | 825 |
5.5 The distance to DA 530
Of the four models presented in Table 3, we believe the most likely scenario for DA 530 to be an SNR in a more evolved Sedov-Taylor phase and more closely related to the lower minimum distance of 4.4 kpc (i.e., column 3). The strongest argument for the nearer distance is the corresponding ejecta mass of 9.6 , which is typical of the type II explosions studied by Pejcha & Prieto (2015). In contrast, the farther distance implies a very large ejecta mass, 47 , which is nearly impossible.
The calculated ambient densities also point towards the nearer distance. The densities for the late Sedov-Taylor phase are reasonable. In contrast, those for the early Sedov-Taylor phase are very low, even for the considerable elevations above the Galactic plane implied by the two distances. Further, the X-ray observations have not detected any thermal emission from the shells. A hot plasma with 24 of material at a temperature of 1 keV, or 115 of material at 0.7 keV, would have been detected by CHANDRA or XMM, or even ROSAT, independent of distance. The shells are resolved, so the X-ray surface brightness would not change with distance. The only possible explanation is a low-temperature plasma whose emission peaks below, or at, the low-energy limit of the telescopes and is mostly absorbed by foreground material. This would suggest that most of the thermal X-ray emission detected in the CHANDRA, XMM, and ROSAT observations is coming from the shock heated ejecta, and not the swept-up material. This also favours the evolved Sedov-Taylor interpretation, as our calculations indicate a lower limit for the age and temperature.
In summary, we propose that DA 530 is at, or close to, the nearer distance, 4.4 kpc, and is in the late Sedov-Taylor phase of its evolution. As this distance represents a minimum, DA 530 may still be farther and the values modeled in Table 3 will change as the distance is increased. However, we have shown that a substantially larger distance will yield unrealistic characteristics and DA 530 is more likely to be close to this lower limit. The HI absorption at kms-1, from which we estimated the larger distance of 8.3 kpc, must then come from gas with a peculiar velocity, not determined by Galactic rotation. We note that the HII region CTB 102 is centred at and is at a distance of 4.3 kpc (Arvidsson et al., 2009). This would place it directly below DA 530 if the SNR were at a distance of 4.4 kpc. Arvidsson et al. (2009) described HI filaments associated with CTB 102, having radial velocities ranging from kms-1 to kms-1, that extend up to at least . We speculate that the absorption at kms-1 may be associated with such a filament. We will explore this possibility in a future paper.
6 Conclusion
Using the polarized HI absorption technique, we have detected absorption of the emission from DA 530 at velocities of and km s-1. From the km s-1 absorption, we conclude that the minimum distance to DA 530 is 4.4 kpc with an uncertainty range between 4.2 kpc and 4.8 kpc. The km s-1 absorption gives unrealistic characteristics for DA 530, and we believe that the absorbing HI gas likely has additional peculiar motion that is not represented by Galactic kinematics. The km s-1 absorption may be related to HI filaments extending out of the HII region, CTB 102. If DA 530 can be confirmed in a follow-up study to be associated with CTB 102, the minimum distance of 4.4 kpc can be taken to be the absolute distance to the SNR.
At the minimum distance of 4.4 kpc, the diameter of DA 530 is 34 pc and its elevation above the Galactic plane is 537 pc. At this elevation, DA 530 is among the highest known Galactic SNRs, and may in fact be the highest. We have shown that the most likely scenario for DA 530 is for the remnant to be in a late Sedov-Taylor phase of evolution. Applying standard models for such an SNR, we derived a set of parameters for a distance of 4.4 kpc, which satisfy all observations of DA 530. In this scenario, the SNR was a type IIP supernova with an ejecta mass of about 10 solar masses that exploded some 20,000 years ago. Right now, the shock wave would expand at an average velocity of about 350 km/s, with a post-shock temperature of 0.15 keV ( K) and a swept-up mass of almost 200 solar masses. These parameters are merely examples and have uncertainties inherited from the observations on which the models are based. As the 4.4 kpc distance is a lower limit, the final parameters for DA 530 will change as the distance estimate increases. However, we have shown that substantially larger distances yield increasingly improbable characteristics. What has emerged from this study is that DA 530, at a distance of about 4.4 kpc, can be understood as an SNR with typical properties. The previous distance, 2.2 kpc, required DA 530 to have very unusual properties.
DA 530 is a low-intensity SNR, which means that detecting HI absorption of its emission using the standard total intensity technique would not have been possible. By using polarized observations of DA 530, we have been able to, for the first time, detect HI absorption towards the SNR. In addition, we have presented a new way of combining linear polarization data, and , into weighted optical depth maps in order to obtain an HI absorption profile and thereby avoid problems with noise bias in PI calculations. This method will be particularly useful for preparing HI absorption profiles for low-intensity SNRs. By detecting HI absorption of the emission from DA 530, we have demonstrated that the novel polarized HI absorption technique is a superior tool for measuring an HI absorption spectrum for low-intensity SNRs.
References
- Arvidsson et al. (2009) Arvidsson, K., Kerton, C. R., & Foster, T. 2009, ApJ, 700, doi: 10.1088/0004-637X/700/2/1000
- Bocchino et al. (2008) Bocchino, F., Bandiera, R., & Gallant, Y. 2008, AdSpR, 41, 407, doi: 10.1016/j.asr.2007.06.036
- Booth (2021) Booth, R. 2021, Master of science, University of Calgary, Calgary
- Cioffi et al. (1988) Cioffi, D. F., McKee, C. F., & Bertschinger, E. 1988, ApJ, 334, 252, doi: 10.1086/166834
- Cohen (1958) Cohen, M. 1958, Proceedings of the IRE, 46, doi: 10.1109/JRPROC.1958.286729
- Conway & Kronberg (1969) Conway, R. G., & Kronberg, P. P. 1969, MNRAS, 142, doi: 10.1093/mnras/142.1.11
- de Wit et al. (2005) de Wit, W. J., Testi, L., Palla, F., & Zinnecker, H. 2005, A&A, 437, doi: 10.1051/0004-6361:20042489
- Dickey (1997) Dickey, J. M. 1997, ApJ, 488, doi: 10.1086/304707
- Dubner & Giacani (2015) Dubner, G., & Giacani, E. 2015, A&ARv, 23, doi: 10.1007/s00159-015-0083-5
- Foster & MacWilliams (2006) Foster, T., & MacWilliams, J. 2006, ApJ, 644, 214, doi: 10.1086/500815
- Foster & Routledge (2003) Foster, T., & Routledge, D. 2003, ApJ, 598, doi: 10.1086/378947
- Foster et al. (2004) Foster, T., Routledge, D., & Kothes, R. 2004, A&A, 417, 79, doi: 10.1051/0004-6361:20034253
- Green (1984) Green, D. A. 1984, MNRAS, 209, doi: 10.1093/mnras/209.3.449
- Green (2019) —. 2019, JApA, 40, doi: 10.1007/s12036-019-9601-6
- Greisen (2003) Greisen, E. W. 2003, in Astrophysics and Space Science Library, Vol. 285, Information Handling in Astronomy - Historical Vistas, ed. A. Heck, 109, doi: 10.1007/0-306-48080-8_7
- Haslam et al. (1980) Haslam, C. G. T., Pauls, T., & Salter, C. J. 1980, A&A, 92, 57
- HI4PI Collaboration et al. (2016) HI4PI Collaboration, Ben Bekhti, N., Flöer, L., et al. 2016, A&A, 594, A116, doi: 10.1051/0004-6361/201629178
- Higgs et al. (1997) Higgs, L. A., Hoffmann, A. P., & Willis, A. G. 1997, in ASP Conference Series, Vol. 125, Astronomical Data Analysis Software and Systems VI, ed. G. Hunt & H. Payne, 58
- Hovey (1998) Hovey, G. J. 1998, PhD thesis, University of British Columbia
- Jeong et al. (2012) Jeong, I.-G., Byun, D.-Y., Koo, B.-C., et al. 2012, Ap&SS, 342, doi: 10.1007/s10509-012-1196-1
- Jiang et al. (2007) Jiang, B., Chen, Y., & Wang, Q. D. 2007, ApJ, 670, doi: 10.1086/522299
- Kothes (2013) Kothes, R. 2013, A&A, 560, doi: 10.1051/0004-6361/201219839
- Kothes & Brown (2008) Kothes, R., & Brown, J.-A. 2008, Proceedings of the International Astronomical Union, 4, doi: 10.1017/S1743921309030087
- Kothes & Kerton (2002) Kothes, R., & Kerton, C. R. 2002, A&A, 390, 337, doi: 10.1051/0004-6361:20020671
- Kothes et al. (2004) Kothes, R., Landecker, T. L., & Wolleben, M. 2004, ApJ, 607, doi: 10.1086/383610
- Kothes et al. (2017) Kothes, R., Reich, P., Foster, T. J., & Reich, W. 2017, A&A, 597, A116, doi: 10.1051/0004-6361/201629848
- Kothes & Reich (2001) Kothes, R., & Reich, W. 2001, A&A, 372, 627, doi: 10.1051/0004-6361:20010407
- Kothes et al. (2003) Kothes, R., Reich, W., Foster, T., & Byun, D.-Y. 2003, ApJ, 588, 852, doi: 10.1086/374219
- Kulkarni & Heiles (1988) Kulkarni, S. R., & Heiles, C. 1988, in Galactic and Extragalactic Radio Astronomy, ed. K. I. Kellermann & G. L. Verschuur, 95–153
- Lalitha et al. (1984) Lalitha, P., Mantovani, F., Salter, C. J., & Tomasi, P. 1984, A&A, 131, 196
- Landecker et al. (1999) Landecker, T. L., Routledge, D., Reynolds, S. P., et al. 1999, ApJ, 527, doi: 10.1086/308100
- Landecker et al. (2000) Landecker, T. L., Dewdney, P. E., Burgess, T. A., et al. 2000, A&AS, 145, doi: 10.1051/aas:2000257
- Lockman (2002) Lockman, F. J. 2002, in ASP Conference Series, Vol. 276, Seeing Through the Dust, ed. A. R. Taylor, T. L. Landecker, & A. Willis, 107–122
- McKee & Truelove (1995) McKee, C. F., & Truelove, J. K. 1995, Phys. Rep., 256, 157, doi: 10.1016/0370-1573(94)00106-D
- Padmanabhan (2001) Padmanabhan, T. 2001, Theoretical Astrophysics (Cambridge University Press), doi: 10.1017/CBO9780511840159
- Pejcha & Prieto (2015) Pejcha, O., & Prieto, J. L. 2015, ApJ, 806, 225, doi: 10.1088/0004-637X/806/2/225
- Perley & Butler (2017) Perley, R. A., & Butler, B. J. 2017, ApJS, 230, 7, doi: 10.3847/1538-4365/aa6df9
- Ranasinghe & Leahy (2018) Ranasinghe, S., & Leahy, D. A. 2018, AJ, 155, 204, doi: 10.3847/1538-3881/aab9be
- Reich (2002) Reich, W. 2002, in Neutron Stars, Pulsars, and Supernova Remnants, ed. W. Becker, H. Lesch, & J. Trümper, 1. https://arxiv.org/abs/astro-ph/0208498
- Schwarz et al. (1980) Schwarz, U. J., Arnal, E. M., & Goss, W. M. 1980, MNRAS, 192, 67P, doi: 10.1093/mnras/192.1.67P
- Sedov (1959) Sedov, L. 1959, Similarity and Dimensional Methods in Mechanics (Academic Press), doi: https://doi.org/10.1016/B978-1-4832-0088-0.50005-0
- Sharma et al. (2019) Sharma, S., Stello, D., Bland-Hawthorn, J., et al. 2019, MNRAS, 490, doi: 10.1093/mnras/stz2861
- Tammann et al. (1994) Tammann, G. A., Loeffler, W., & Schroeder, A. 1994, ApJS, 92, doi: 10.1086/192002
- Thompson (1989) Thompson, A. R. 1989, in ASP Conference Series, Vol. 6, Synthesis Imaging in Radio Astronomy, ed. R. A. Perley, F. R. Schwab, & A. H. Bridle, 11
- Tian et al. (2007) Tian, W. W., Leahy, D. A., & Wang, Q. D. 2007, A&A, 474, 541, doi: 10.1051/0004-6361:20077527
- Tian et al. (2019) Tian, W. W., Zhu, H., Zhang, M. F., et al. 2019, PASP, 131, 114301, doi: 10.1088/1538-3873/ab35f4
- Uson & Cotton (2008) Uson, J. M., & Cotton, W. D. 2008, A&A, 486, doi: 10.1051/0004-6361:200809509
- Wardle & Kronberg (1974) Wardle, J. F. C., & Kronberg, P. P. 1974, ApJ, 194, doi: 10.1086/153240
- West et al. (2017) West, J. L., Safi-Harb, S., & Ferrand, G. 2017, A&A, 597, doi: 10.1051/0004-6361/201628079
- West et al. (2016) West, J. L., Safi-Harb, S., Jaffe, T., et al. 2016, A&A, 587, doi: 10.1051/0004-6361/201527001
- Willis (1999) Willis, A. G. 1999, A&AS, 136, 603, doi: 10.1051/aas:1999237
7 Appendix