Missing beauty of proton-proton interactions ††thanks: Presented at the XIVth International Conference on Beauty, Charm and Hyperon Hadrons, June 5-11, 2022, Kraków, Poland by Alexander Milov
Abstract
From first principles, particles with the same quark content and similar masses should have similar kinematic distributions. Transverse mass scaling may be employed to estimate possible differences in the momentum distribution of such particles. Based on this scaling the excited bottomonium states measured at the LHC are found to be significantly different from (1S) to the extent that the integrated yield of (2S) is 1.6 times less and (3S) 2.4 times less than would be explained by the mass difference. This proceeding explains how the estimate is worked out and relates it to other measurements performed at the LHC.
Recent measurements conducted by the ATLAS [1], CMS[2, 3] and LHCb [4] experiments show that in proton-proton (pp) collisions the yield of excited quarkonia states, , with respect to the ground state, , diminishes with the event multiplicity. The magnitude of the effect increases at low transverse momentum () of the particle. This effect should have an impact on the distribution of the which can be measured in an independent analysis. An approach to do that can be based on the assumption that particles with the same quark content and close mass should have similar momentum distributions. This assumption is appropriate for the -meson family, in which the masses of the and are larger than the mass of by 6% 9.5%, respectively.
In a broader sense, this assumption is the basis of the transverse mass () scaling, stating that particles produced in pp collisions have the same -distribution, where and is the particle rest mass. The -scaling is widely exploited in many phenomenological studies [5, 6, 7, 8, 9] and is often used in the form
| (1) |
The -scaling phenomenon is equivalent to the fact that the exponent and parameter are universal for all particles, although different for mesons and baryons (e.g. [8] and references therein). This analysis considers only mesons. The scaling behavior of heavy mesons is studied in comparison to light quark species and is used to understand the ratios between excited and ground quarkonia states measured in experiments.
A comprehensive study of the distributions of the mesons at three LHC energies , and 13 TeV is performed in [10]. It uses 72 data samples of 18 mesons and their isospin partners. Figure 1 shows the parameter obtained in fits of individual data samples.
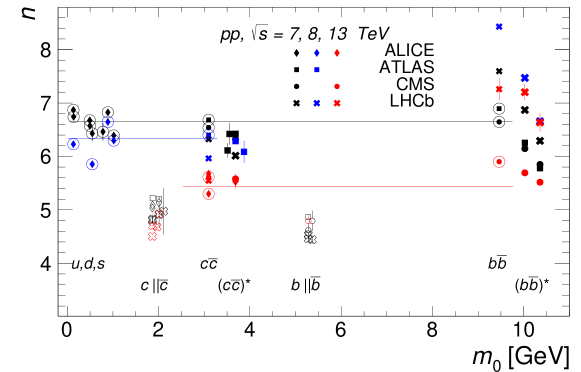
When fitting data with the form of Eq. 1, parameters and are strongly correlated, therefore is fixed to 254 MeV. This value is similar to many other studies conducted at LHC energies and it can be somewhat different at different energies. It is shown later that the derived conclusions are indifferent to the exact value of , which is also checked by varying it by MeV in the analysis.
Several trends are visible in Figure 1. Particles produced in collisions with higher have harder spectra (lower ). The magnitude of depends on the quark content of the particle. Open heavy flavor mesons () demonstrate significantly harder spectra compared to other species and harder for the open bottom () than for open charm ().
At each collision energy, the LHCb results for -mesons are above others because they are measured at higher rapidity. Comparing results at the same energy as it is done in [5] shows that increases with rapidity. Figure 1 shows that the exponent for u,d,s and mesons are similar. At the same time, have lower values of than the ground-state: , and for bottomonia states: .
Based on these observations, the values of for u,d,s and ground-state mesons measured at midrapidity (circled data points in Figure 1) are fit to extract a common . There are 12, 5 and 3 data samples at , 8, and 13 TeV respectively. The TeV values are fit to a linear function, which becomes constant for MeV. Due to the low number of selected data sets at higher energies, the 8 and 13 TeV data are initially fit to a constant. The values of , are shown in Figure 1 with lines.
Figure 2 shows the results at 3 collision
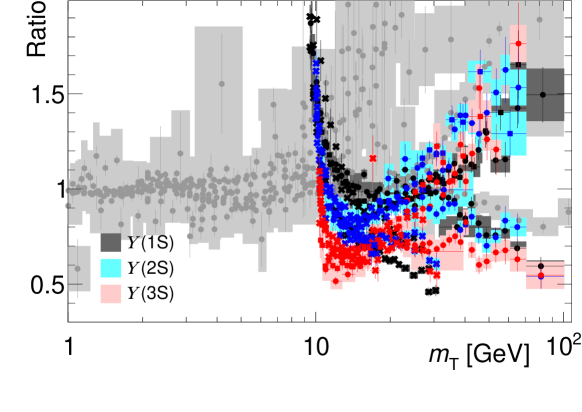
energies, divided by the common fit. The -points are shown in different colors, regardless of energy, and points that are used in the common fit are shown in gray. The latter demonstrate reasonable agreement with unity, although at high- spectra tend to rise up to a factor of 2, somewhat similar to what can be seen in Ref. [5]. Using Eq. 1 at high this translates to –18% deviation of from the ‘true scaling’ value, which is comparable or even smaller than the difference in at three measured energies. Similarly, the LHCb results which are measured at high rapidity, yield a value of that is larger approximately by 1 (see Figure 1) and constitutes approximately the same 20% deviation from the common .
A significant rise for all states at low , i.e. , is clearly visible. The contribution of has been estimated using Pythia8 [11] simulations to work out the prompt fraction of . Inclusive data that is used in the analysis and the prompt fraction, estimated from Pythia8 are shown in Figure 3 with full and open circles respectively.
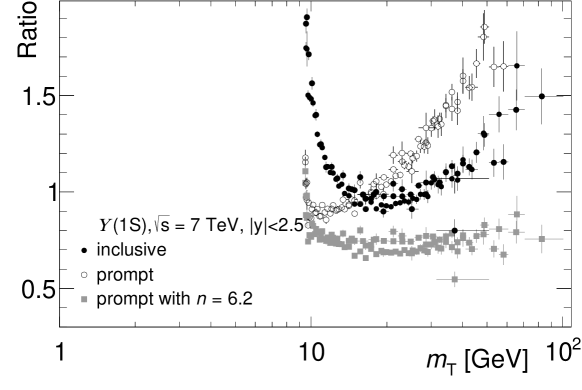
The prompt fraction has only a weak excess at , but it still rises at high . Decreasing by 8% flattens the ratio, as shown in the figure with squares. Nevertheless, inclusive data with GeV is used in the fit, because prompt fractions for are not yet reliably measured experimentally nor fully modeled successfully.
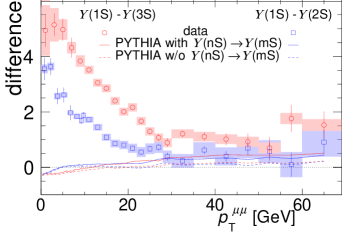
The ratios of all measured at the LHC are shown in Figure 4.
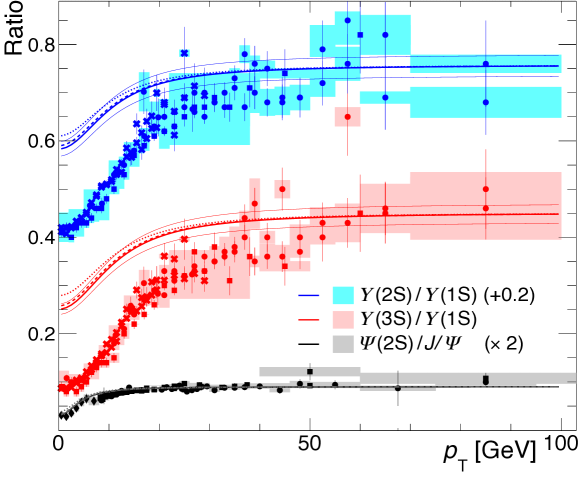
The ratio curves derived from -scaling are drawn normalized to data at GeV, which uncertainties are shown with thin solid lines. Dashed lines correspond to higher energies. The shape of the curves can be directly derived from Eq. 1 and is governed by their minimum-to-maximum span:
| (2) |
where corresponding to is equal to 9.46 GeV and is 0.9 GeV for . Equation 2 makes it clear that the value of has only a minor effect on the shape because . Since , even for , the ratio before in Eq. 2 is , therefore the two curves for and 13 TeV are close to each other. As discussed above, residual non-flatness of the common fit and the rapidity dependence have similar or smaller impacts on compared to . None of these effects can explain the drastic difference between the experimentally measured / ratios and the curves shown in Figure 4. To reconcile -ratio curve with the data, the feed downs from Pythia8 that are consistent with LHCb results [12] and nearly eliminate the peak at in Figure 3, should be increased by 2.5 and even more than that for , which is not plausible.
To quantify the discrepancy between the data and the -scaling prediction one can build the particles’ ‘missing fraction’: . This fraction is shown in the left panel of Figure 5. Assuming the -scaling scenario and the -meson production cross-section, expected production at low is approximately twice higher than the measurement and is roughly three times higher.
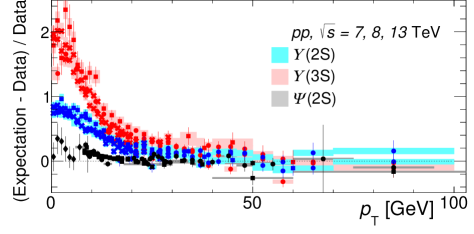
The discrepancy between the measured production rates of in pp collisions and rates expected from the -scaling approach may share a common origin with the results reported in [10, 3]. This would explain the striking similarity between the ‘missing fraction’ and the difference in the number of tracks in the underlying event measured by the ATLAS experiment. This comparison is demonstrated in the two panels of Figure 5. It would mean that the track present in pp collisions reduces the production rate of . Using the ‘missing fraction’ and the measured differential cross section of states (for the full list of references see [10]) one can estimate that the measured cross-sections of and mesons are ‘suppressed’ by factors of 1.6 and 2.4 compared to the expectation from the production rates of .
Research of Z.C. is supported by the Israel Science Foundation (grant 1946/18). Research of I.A. and A.M. is supported by Israel Academy of Science and Humanity and the MINERVA Stiftung with the funds from the BMBF of the Federal Republic of Germany.
References
- [1] ATLAS Collaboration. ATLAS-CONF-2022-023, 2022.
- [2] CMS Collaboration. JHEP, 04:103, 2014.
- [3] CMS Collaboration. JHEP, 11:001, 2020.
- [4] LHCb Collaboration. Phys. Rev. Lett., 126(9):092001, 2021.
- [5] Smbat Grigoryan. Phys. Rev. D, 95(5):056021, 2017.
- [6] E. L. Bratkovskaya, W. Cassing, and U. Mosel. Phys. Lett. B, 424:244–252, 1998.
- [7] STAR Collaboration. Phys. Rev. C, 75:064901, 2007.
- [8] L. Altenkämper, F. Bock, C. Loizides, and N. Schmidt. Phys. Rev. C, 96(6):064907, 2017.
- [9] PHENIX Collaboration. Phys. Rev. D, 83:052004, 2011.
- [10] I. Aizenberg, Z. Citron, and A. Milov. arXiv:2203.11831, 2022.
- [11] Sjöstrand et. al. Comput. Phys. Commun., 191:159–177, 2015.
- [12] LHCb Collaboration. Eur. Phys. J. C, 74(10):3092, 2014.