A search for kilonova radio flares in a sample of Swift/BAT short GRBs
Abstract
The multi-messenger detection of GW170817 showed that binary neutron star (BNS) mergers are progenitors of (at least some) short gamma-ray bursts (GRBs), and that short GRB jets (and their afterglows) can have structures (and observational properties) more complex than predicted by the standard top-hat jet scenario. Indeed, the emission from the structured jet launched in GW170817 peaked in the radio band (cm wavelengths) at d since merger —a timescale much longer than the typical time span of radio follow-up observations of short GRBs. Moreover, radio searches for a potential late-time radio flare from the fast tail of the neutron-rich debris that powered the kilonova associated with GW170817 (AT 2017gfo) have extended to even longer timescales (years after the merger). In light of this, here we present the results of an observational campaign targeting a sample of seven, years-old GRBs in the Swift/BAT sample with no redshift measurements and no promptly-identified X-ray counterpart. Our goal is to assess whether this sample of short GRBs could harbor nearby BNS mergers, searching for the late-time radio emission expected from their ejecta. We found one radio candidate counterpart for one of the GRBs in our sample, GRB 111126A, though an origin related to emission from star formation or from an AGN in its host galaxy cannot be excluded without further observations.
1 Introduction
Since the discovery of the binary neutron star (BNS) merger GW170817 in gravitational waves (GWs) and light at all wavelengths (Abbott et al., 2017a, b, c), the question of whether there may be a population of nearby, GW170817-like events in the known sample of short gamma-ray bursts (GRBs) has received particular attention (e.g., Horesh et al., 2016; Bartos et al., 2019; Dichiara et al., 2020; Schroeder et al., 2020; Matsumoto & Piran, 2020; Ricci et al., 2021). Notably, GW170817 had a delayed electromagnetic afterglow (Abbott et al., 2017c), first detected in X-rays about 9 days after the merger and the prompt detection of -rays (Haggard et al., 2017; Margutti et al., 2017; Troja et al., 2017). A radio afterglow detection followed, about 15 days after the merger (Alexander et al., 2017; Hallinan et al., 2017). This delayed, non-thermal, radio-to-X-ray emission was related to a structured jet launched after the merger and observed off-axis (e.g., Granot et al., 2018; Lazzati et al., 2017, 2018; Mooley et al., 2018a, b; Nakar & Piran, 2018; Ghirlanda et al., 2019; Makhathini et al., 2021). X-ray emission in excess to that expected from the structured jet was tentatively detected over 900 days after the GW170817 merger (Hajela et al., 2022; Troja et al., 2022). Possible explanations for this emission include a flat radio-to-X-ray spectrum afterglow from the slower kilonova ejecta that powered AT 2017gfo via the -process (e.g., Arcavi et al., 2017; Chornock et al., 2017; Coulter et al., 2017; Cowperthwaite et al., 2017; Drout et al., 2017; Kasliwal et al., 2017; Kasen et al., 2017; Kilpatrick et al., 2017; Pian et al., 2017; Shappee et al., 2017; Smartt et al., 2017; Tanvir et al., 2017; Valenti et al., 2017; Metzger, 2019; Radice et al., 2018, 2020), or radiation from accretion processes (Hajela et al., 2022; Metzger & Fernández, 2021; Nedora et al., 2021; Troja et al., 2021). Balasubramanian et al. (2021) and Balasubramanian et al. (2022) found no evidence for radio emission in excess to that expected from a structured jet at late times, though efforts to detect a kilonova radio afterglow are still ongoing. O’Connor & Troja (2022) also did not find further evidence of an X-ray excess at 4.8 yrs since the GW170817 merger. Kilpatrick et al. (2021) observed the field of GW170817 in the optical band at late times, finding no remnant of the kilonova emission in their observations.
As evident from the above discussion, continued radio (and X-ray) observations are needed to confirm the presence of late-time emission from GW170817 and disentangle its origin. However, these results have spurred new interest in the search for so-called late-time radio flares from short GRBs (e.g. Nakar & Piran, 2011; Hotokezaka & Piran, 2015; Hotokezaka et al., 2018; Kathirgamaraju et al., 2019; Nedora et al., 2021), especially considering that the kilonova afterglow could be visible in radio for years after the initial event. Several recent efforts have targeted both well-localized short GRBs with known redshifts and short GRBs lacking accurate X-ray localizations and redshift measurements (e.g. Schroeder et al., 2020; Bruni et al., 2021; Grandorf et al., 2021; Ricci et al., 2021; Ghosh et al., 2022).
Searches targeting well-localized, cosmological short GRBs have been motivated by the expectation that radio flares can be brighter in the presence of a long-lived magnetar formed after the BNS merger and thus are potentially detectable also at cosmological distances (Ricci et al., 2021). For example, Schroeder et al. (2020) conducted 6 GHz observations of nine, low-redshift () short GRBs with the Karl G. Jansky Very Large Array (VLA) on rest-frame timescales of yr following the bursts. The lack of detections constrained the energy deposited into the ejecta to ergs (see also Ricci et al., 2021; Ghosh et al., 2022). A re-analysis of 27 short GRBs with GHz radio observations also enabled them to conclude that of events could have formed a stable magnetar after the mergers.
Grandorf et al. (2021) used the VLA to observe four short GRBs in the Swift/BAT sample without X-ray localizations. They found a previously uncatalogued radio source within the error region of GRB 130626 with a GHz flux density consistent with a radio flare associated with a BNS at a distance of Mpc. However, an origin related to a persistent radio source, not the GRB, could not be excluded.
Here, we present the results of continued efforts aimed at uncovering potentially nearby, GW170817-like short GRBs via a search for their late-time radio emission. Specifically, we carried out observations of 7 short GRBs in the Swift/BAT sample that lack accurate X-ray localizations and have unknown distances. Our short GRB selection criteria, as well as observations and analysis procedures, are very similar to those described in Grandorf et al. (2021). Our paper is organized as follows. In Section 2, we describe how we select our GRB sample. In Section 3, we describe our observations. In Section 4 we describe the counterpart radio candidates identification. In Sections 5 and 6, we present and discuss our results. In Section 7, we summarize and conclude.
Hereafter we assume cosmological parameters km s-1 Mpc-1, , (Bennett et al., 2014). All times are given in UT unless otherwise stated.
2 GRB sample selection
For this study, we consider only short GRBs in the Swift/BAT sample. We focus on short GRBs detected by the Swift/BAT because the VLA can cover the typical BAT localization error region in a single-field observation at GHz. We consider events with s as those have been traditionally linked to BNS merger progenitors (Nakar, 2007), though see e.g. Rastinejad et al. (2022) for a recent discovery of a kilonova associated with the nearby, minute-long duration GRB 211211A.
We further select short GRBs with no (promptly) identified X-ray counterparts. Short GRBs in the Swift sample that have identified afterglows reside at larger distances at which the detection of long-term radio flares is unlikely with short VLA observations. Instead, we select GRBs with no redshift measurement because those could hide a population of nearby events. In fact, we note that without a GW detection, GW170817 would have remained one of the several short GRBs with no follow-up observations and no redshift measurement. This motivates our search.
We exclude from our short GRB sample events in regions of the sky inaccessible to the VLA, particularly those with declination below . In addition, we avoided the Clarke belt of satellites, ranging from a declination of to 15∘, because VLA observations of sources in the belt are subject to strong radio frequency interference (RFI) from satellites in C-band ( GHz), X-band ( GHz), and Ku-band ( GHz).
3 VLA Observations and data reduction
| GRB | 111Observation central frequency. | RMS222The RMS noise at the center of the image. | Date Observed | 333Time between the GRB trigger and our VLA observations. | Time On Source | BAT Center444Swift/BAT refined localization center. | BAT Radius555Error radius of the refined Swift/BAT localization. | Reference |
| (GHz) | (Jy) | (UT) | (yr) | (mm:ss) | (R.A. Dec.) | (′) | ||
| 080121A | 2.8 | May 22, 2020 | 12.3 | 33:12 | 09h09m01.8s d50m21.3s | 2.5 | (15) | |
| 6.0 | 39 | April 17/18, 2020 | 12.2 | 34:00 | ” | ” | ” | |
| 090417A | 2.7 | 16 | May 23, 2020 | 11.1 | 33:09 | 02h19m58.3s d08m28.9s | 2.8 | Baumgartner et al. (2009) |
| 6.1 | 9.1 | April 14, 2020 | 11.0 | 34:00 | ” | ” | ” | |
| 101129A | 2.9 | 21 | May 25, 2020 | 9.5 | 33:09 | 10h23m41.0s d38m42.0s | 3.1 | (16) |
| 6.1 | 5.7 | April 16, 2020 | 9.4 | 34:05 | ” | ” | ” | |
| 111126A | 3.0 | 7.4 | May 23, 2020 | 8.5 | 33:09 | 18h24m07.1s d28m06.1s | 2.5 | (17) |
| 6.0 | 4.8 | April 23, 2020 | 8.4 | 34:00 | ” | ” | ” | |
| 120403A | 3.0 | 15 | May 23, 2020 | 8.1 | 33:12 | 02h49m49.8s d29m21.8s | 2.3 | Sakamoto et al. (2012) |
| 6.1 | 5.2 | April 16, 2020 | 8.0 | 34:05 | ” | ” | ” | |
| 140606A | 3.0 | 9.7 | May 29, 2020 | 6.0 | 33:06 | 13h27m11.7s d35m56.5s | 2.4 | Cummings et al. (2014) |
| 6.1 | 5.5 | April 25, 2020 | 5.9 | 34:05 | ” | ” | ” | |
| 160726A | 2.8 | 13 | May 24, 2020 | 3.8 | 33:09 | 06h35m14.3s d37m1.4s | 1.29 | (18) |
| 6.1 | 7.9 | April 18, 2020 | 3.7 | 34:00 | ” | ” | ” |
We carried out VLA observations of the 7 GRBs in our sample via project VLA/20A-239 (PI: Bartos). Each GRB was observed at nominal central frequencies of 6 GHz (C-band) and 3 GHz (S-band) with the VLA in its C configuration. The choice of frequency was motivated by the need to match the VLA field of view to the typical size of the error region of the Swift/BAT GRBs in our sample. Moreover, late-time radio flares from BNS mergers are expected to be powered by optically thin radio emission (Nakar & Piran, 2011), thus lower frequencies offer better chances for discovery. On the other hand, the lower the frequency, the larger the expected number of unrelated sources in the field and the slower the time variability (hence, the harder the identification of false positives). Based on the above considerations, S- and/or C-band observations are overall advantageous compared to both L-band (nominal central frequency of 1.4 GHz) observations, or observations at frequencies above 6 GHz.
| Source Name | R.A. Dec. | Class666NED classification of the closest cataloged object | Epoch777The mid-time of our VLA observation. | 888The time between the BAT trigger and the mid-time of our VLA observation (see the “Epoch” column). | 999The central frequency of our VLA observation. | 101010The imstat peak flux density. | Offset111111The angular distance between the radio candidate and the closest known object in NED | Pos. Err.121212VLA position error calculated as described in Section 4. | Compactness131313Compactness parameter calculated as described in Section 4. |
| (MJD) | (yr) | (GHz) | (Jy) | (″) | (″) | ||||
| A-Candidate-1 | 10h23m45.15s d35m51.20s | IrS | 58955.07 | 9.4 | 6.1 | .84 | .25 | ||
| ” | ” | 58994.14 | 9.5 | 2.9 | ” | .48 | |||
| A-Candidate-1 | 18h24m20.56s d28m44.71s | IrS | 58962.53 | 8.4 | 6.0 | 18 | .13 | ||
| ” | ” | 58992.38 | 8.5 | 3.0 | ” | .20 | |||
| A-Candidate-2 | 18h23m55.44s d28m08.04s | IrS | 58962.53 | 8.4 | 6.0 | 12 | .18 | ||
| ” | ” | 58992.38 | 8.5 | 3.0 | ” | .20 |
The VLA data were calibrated using the automated VLA calibration pipeline in CASA141414https://casa.nrao.edu/index.shtml. The calibrated data were then inspected manually for additional flagging, especially to mitigate RFI. The CASA task tclean was used in interactive mode to image the observed fields, with a robust parameter of and Briggs weighting. Sources were identified in the cleaned images both by hand and by using Blobcat, a Python program designed to locate sources in an image, to ensure all sources were investigated (Hales et al., 2012a, b).
The central noise RMS of each image was determined using imstat by measuring the RMS of the residual image within a central circular region of radius 10 times the FWHM of the nominal synthesized beam. The efficiency-corrected RMS was then calculated by dividing this central RMS by the efficiency (primary beam correction) as measured at the location of each candidate. Our results are summarized in Table 1.
4 Candidate radio counterpart identification
We visually inspected all of our calibrated images to search for candidate radio sources. Most sources identified via visual inspection were also confirmed by running Blobcat. We used the CASA task imfit to estimate the VLA position errors. Specifically, errors were calculated by dividing the clean beam semi-major axis, as measured using imfit, by the signal-to-noise ratio (SNR) of a given source. Following Mooley et al. (2013), only radio sources found within the BAT error region of each GRB with were considered reliable detections. Hereafter, the SNR is defined as the ratio between the source peak flux density, and the peak flux density error calculated as described in what follows.
The peak flux density of each radio source was measured using imstat and a circular region centered on the source, with radius equal to the FWHM of the nominal synthesized beam. The peak flux density error was determined by adding the efficiency-corrected RMS in quadrature with the absolute flux calibration error. The last is estimated to be 5% of the peak flux density for observations using 3C 286 as absolute flux calibrator, and 10% of the peak flux density if the flux calibrator was 3C 48 (due to a recent flare).
For each of the radio sources with SNR, we further used the CASA task imfit to calculate the integrated flux density. The integrated flux density error was determined by adding the error of the integrated flux density as reported by imfit and 5% (or 10%) of the imfit integrated flux density in quadrature, similarly to what done for the peak flux density.
Next, we derive the compactness parameter by dividing the integrated flux by the imstat peak flux density. We used the compactness parameter to determine whether each radio source is more likely to be a compact object, like a merger, or an extended object, like a galaxy (Itoh et al., 2020). We take as the range of compactness values for a point-like source (Mooley et al., 2013). To ensure point-like morphology and avoid contamination from sidelobes, following Mooley et al. (2013), we also require that the size of the detected radio source, as reported by imfit, is smaller than the size of the clean beam FWHM on corresponding axes and that the source is located at a distance the geometric mean of the clean beam from sources with peak flux density Jy and extended sources. We require all of the above conditions to be met at both 3 GHz and 6 GHz. This helps ensure that the 3 GHz and 6 GHz flux are both likely to be dominated by the same emission process, and that the spectral indices (where is defined so that ) can be reliably estimated.
Finally, we narrowed down our remaining candidate radio counterparts by checking for the existence of previously cataloged sources at their location (Grandorf et al., 2021; Mooley et al., 2013). We consulted NED (NASA/IPAC Extragalactic Database, 2019), the VLA FIRST catalog (Becker et al., 1994), the VLASS quick look image repository (via CIRADA; Lacy et al., 2020), and the Chandra Source Catalog 2.0 (Evans et al., 2010). NED notably queries NVSS among other catalogs. If a source we observed with the VLA was found to be within 2″ of a cataloged radio source detected in catalog images taken before the GRB trigger time, it was discarded from further analysis (as this indicates that the radio source is likely persistent, not a transient).
The results of this selection process are reported in Table 2. As evident from this Table, only 2 of the 7 GRBs in our sample are associated with candidate radio counterparts that pass all of the selection criteria described here. In the following Section, we discuss each GRB in more detail.
5 Results
After observing the fields of the GRBs in our sample (Section 2) with the VLA, we calibrated our observations as described in Section 3 and selected candidate radio counterparts as described in Section 4. In what follows, we detail our analysis for each of the GRBs in our sample.
5.1 GRB 080121A
GRB 080121A triggered the Swift/BAT at 21:29:55 UT on 2008 January 21 (Cummings et al., 2008). It was detected at a refined, ground-based location of h09m01.8s and d50m21.3s (J2000), with an error region of radius 2.48′ with 90% confidence151515 swift.gsfc.nasa.gov/results/batgrbcat/GRB080121/web/GRB080121.html. We observed the field of this GRB at 6 GHz with the VLA for an hour (total time including calibration and overhead), starting at 23:04:52.0 UT on 2020 April 17. Our 3 GHz observations of the same field started at 18:00:54 UT on 2020 May 22, and lasted about an hour.
The central noise RMS we measure for this field is Jy at 6 GHz, and Jy at 3 GHz (Table 1). The relatively high RMS is due to a very bright source outside the BAT error region, which resulted in a limited dynamic range. None of the radio sources identified within the BAT error region passed the criteria described in Section 3. However, we note that this GRB was investigated further in Dichiara et al. (2020) and Ricci et al. (2021) due to its proximity to possible host galaxies, both of which are within 200 Mpc.
5.2 GRB 090417A
GRB 090417A triggered the Swift/BAT at 13:17:23 UT on 2009 April 17 (Mangano et al., 2009). It was detected at a refined, ground-based location of h19m58.3s d08m28.9s (J2000) with an uncertainty of 2.8′and 90% containment (Baumgartner et al., 2009). We observed the field of GRB 090417A with the VLA for one hour total time, starting at 20:21:37 UT on 2020 April 14 at 6 GHz and at 19:00:42 UT on 2022 May 23. The central noise RMS we measure for this field is Jy at 6 GHz, and Jy at 3 GHz (Table 1). No radio sources were detected within the BAT error region of this GRB.
5.3 GRB 101129A
GRB 101129A triggered the Swift/BAT at 15:39:32 UT on 2010 November 29161616 swift.gsfc.nasa.gov/results/batgrbcat/GRB101129A/web/GRB101129A.html. It was detected at a refined, ground-based location of h23m41.0s, d38m42.0s (J2000), with an uncertainty of 3.1′ and 90% containment. The VLA observed the GRB field for an hour, including calibrations, starting at 01:11:57.0 UTC on April 16th, 2020 for 6 GHz and starting at 02:49:57 UT on 2020 May 25 at 3 GHz. The central noise RMS we measure for this field is Jy at 6 GHz and Jy at 3 GHz. Several radio sources were identified in the images collected for this field, but only one candidate radio counterpart passed the selection criteria described in Section 3 (Table 2).
5.4 GRB 111126A
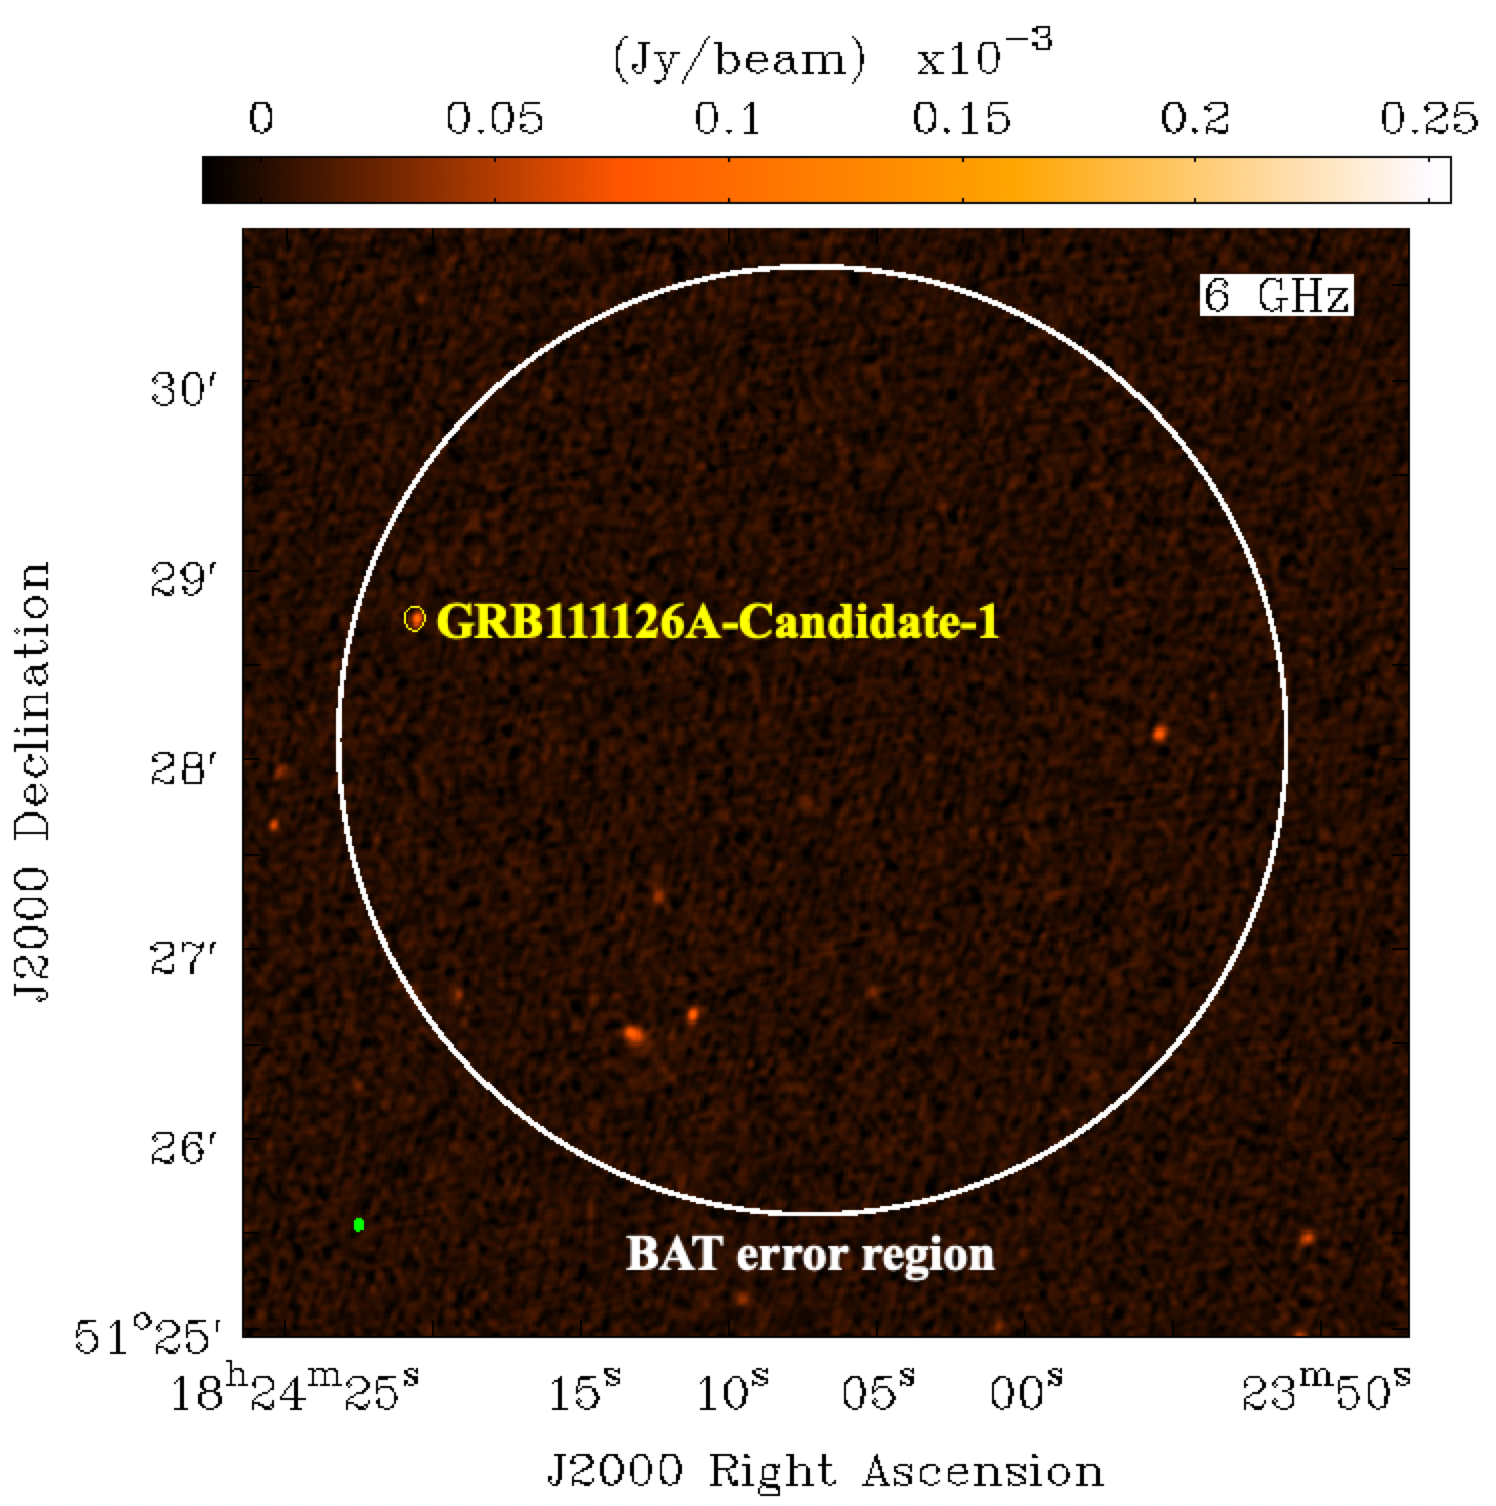
GRB 111126A triggered the Swift/BAT at 18:57:42 UT on 2011 November 26 (Cummings et al., 2011). It was detected at a refined, ground-based location of h24m07.1s and d28m06.1s (J2000) with an uncertainty of 2.5′171717 swift.gsfc.nasa.gov/results/batgrbcat/GRB111126A/web/GRB111126A.html. We observed the field of this GRB for one hour (total time), starting at 12:12:02 UT on 2020 April 23 at 6 GHz and at 08:32:43.0 UT on 2020 May 23 at 3 GHz. The central noise RMS we measure for this field is Jy and Jy at 6 GHz and 3 GHz, respectively. Several radio sources were identified within the BAT error circle, but only two candidate radio counterparts passed the selection criteria described in Section 3 (Table 2).
5.5 GRB 120403A
GRB120403A triggered Swift BAT at 01:05:23 UT on April 3rd, 2012 (Beardmore et al., 2012). It was located at 02h49m49.8s +40d29m21.8s (J2000) with an uncertainty of 2.3 arcminutes and 90% containment (Sakamoto et al., 2012). The VLA observed GRB120403A for an hour, including calibrations, starting at 00:03:17.0 UT on April 16th, 2020 for 6 GHz and starting at 11:37:19.0 UT on May 23rd, 2020 for 3 GHz. The central noise RMS we measure for this field is Jy and Jy at 6 GHz and 3 GHz, respectively (Table 1). No radio sources were detected within the BAT error region of this GRB at either of the observed radio frequencies.
5.6 GRB 140606A
GRB 140606A triggered the Swift/BAT at 10:58:13 UT on 2014 June 6 (Stroh et al., 2014). It was located at h27m11.7s and d35m56.5s (J2000), with an uncertainty of 2.4′and 90% containment (Cummings et al., 2014). We observed the field of this GRB with the VLA for one hour (total time) at both 6 GHz and 3 GHz, starting at 01:52:38 UT on 2020 April 25 and at 7:44:30 UT on 2020 May 29, respectively. The detected central RMS values are 5.5 Jy for 6 GHz and 9.7 Jy for 3 GHz (Table 1). Several radio sources were identified within the BAT error circle of this GRB, but none passed the selection criteria described in Section 3.
5.7 GRB 160726A
GRB 160726A triggered the Swift/BAT at 01:34:07.67 UT on 2016 July 26181818 swift.gsfc.nasa.gov/results/batgrbcat/GRB160726A/web/GRB160726A.html. It was located at h35m14.3s and d37m1.4s (J2000) with an uncertainty of 1.3′ (90% containment). We observed the field of this GRB with the VLA for one hour (total time) in each frequency, starting at 20:20:51.0 UT on 2020 April 18 at 6 GHz and at 17:55:04 UT on 2020 May 24 at 6 GHz. The central noise RMS we measure for this field is Jy at 6 GHz, and Jy at 3 GHz. No radio source passed the selection criteria described in Section 3 (Table 2).
6 Discussion
6.1 Spectral energy distribution
Using our observations at 3 GHz and 6 GHz, we compute the spectral indices of the three candidate radio counterparts listed in Table 2. We find , , and for the radio candidates 101129A-Candidate-1, 111126A-Candidate-1, and 111126A-Candidate-2, respectively. While all three of these spectral indices are compatible with optically-thin synchrotron emission, as expected from radio from BNS mergers (Nakar & Piran, 2011), they are also compatible (within errors) with radio emission from star formation (for which typical spectral indices are ; Seymour et al., 2008). We note that the spectral index of GW170817 was measured to be (Makhathini et al., 2021). Therefore, candidate 101129A-Candidate-1 with is the closest to GW170817, though our results all suggest steeper spectral indices. None of the spectral index values we derive for our candidate radio counterparts are suggestive of emission from flat-spectrum AGN (; Itoh et al., 2020).
6.2 Contamination from unrelated (persistent or variable) radio sources
In this Section, we discuss the likelihood that the candidate radio counterparts we have identified in the GRB error regions considered in this work are false positives i.e., radio sources whose origin is unrelated to the GRB itself.
Using the spectral index of each candidate counterpart, we estimate 1.4 GHx flux densities in the range mJy. According to Mooley et al. (2013) and Huynh et al. (2005), the average number of persistent radio sources (of any morphology) with a 1.4 GHz flux density above 0.1 mJy is deg-2. Hence, within the BAT error regions for GRB 101129A and GRB 111126A we would expect unrelated persistent radio sources for observations conducted at GHz (having also applied further cuts on their morphology). As discussed in Mooley et al. (2013), about of unresolved radio sources above Jy at 1.4 GHz are variable at the level. Hence, we would expect an average of variable unrelated radio sources in the error regions of our GRBs 191919We note that in Grandorf et al. (2021) the variable source range given should read rather than . Therefore, the average number of unrelated variable radio sources expected for the GRBs in our sample comparable to that found in Grandorf et al. (2021).. The Poisson probability of finding one or more unrelated variable sources would then be , which is sufficiently low to motivate further follow-up studies in the radio aimed at establishing the level of time variability of our radio candidates.
6.3 AGN or star-formation origin?
Possible explanations for origin of the radio candidates identified in our search are star-formation in unresolved galaxies and radio emission from AGNs (e.g. Condon, 1992; Sadler et al., 1999; Smolčić et al., 2008; Palliyaguru et al., 2016; Padovani et al., 2017). At 1.4 GHz, star-forming galaxies dominate at lower fluxes (below ), whereas AGNs dominate at higher fluxes (1 mJy and above; Padovani et al., 2017; Sadler et al., 1999; Smolčić et al., 2017).
To test whether our radio candidates can be related to star formation in unresolved galaxies, we first consider the constraints arising from the fact that these radio sources have point-like morphologies in our images. Short GRB host galaxies in the cosmological sample have effective radii in the range with a median size of (Fong & Berger, 2013). For the short GRBs with known redshifts, the median physical size is kpc (Fong & Berger, 2013). Hence, if we considered a short-GRB-like host galaxy located at Mpc, its angular radius would be of . Our radio candidates have an angular size of at 6 GHz (in C band) due to the requirement we imposed on their morphology and considering the nominal FWHM of the VLA synthesized beam in C configuration. Therefore, if our radio candidates are related to star formation in an unresolved host galaxy, most likely such a galaxy would be located at Mpc.
Radio emission associated with star formation at GHz frequencies is dominated by synchrotron radiation from electrons accelerated by supernovae. The following relation can be used to estimate the star formation rate (SFR) in the galaxy given the measured luminosity at 1.4 GHz (Murphy et al., 2011; Perley & Perley, 2013):
| (1) |
Assuming the candidate radio counterparts listed in Table 2 are located at a distance of 200 Mpc, their estimated flux densities of mJy at 1.4 GHz imply erg s-1 Hz-1 and, in turn, a SFR rate of . This is compatible with normal galaxies and with cosmological short GRB host galaxies ( M⊙ yr-1; Berger, 2009).
On the other hand, if we assume that our candidate radio counterparts are located at the median short GRB redshift of (Berger, 2014), then the measured fluxes would correspond to radio luminosities in the range erg at 1.4 GHz, favoring an AGN origin.
The AGN scenario can be further tested using AllWISE (Wright et al., 2019) color information. Indeed, AGNs are expected to fall in the wedge defined by the conditions and where , , and are the instrumental profile-fit photometry magnitudes202020https://wise2.ipac.caltech.edu/docs/release/allwise/expsup/sec2_1a.html#w1mpro in bands one (m), two (m), and three (m; Wright et al., 2010; Mateos et al., 2012; Gürkan et al., 2014). The 101129A-Candidate-1 candidate found in the error region of GRB 101129A has and , fulfilling only the first condition of the AGN wedge. Therefore, a SFR origin is more likely. The candidate radio counterparts found in the error region of GRB 111126A did not have any color information available in the AllWISE Source Catalog.
6.4 BNS Merger Origin
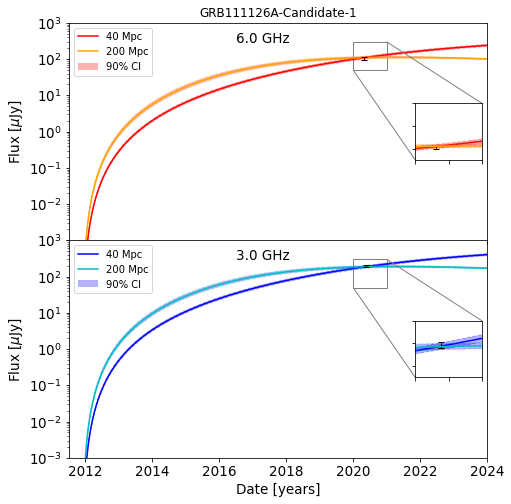
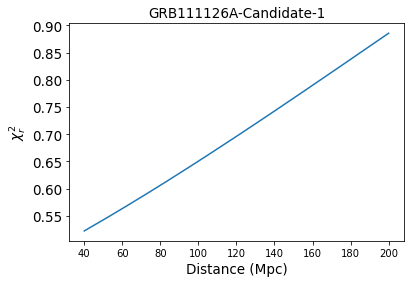
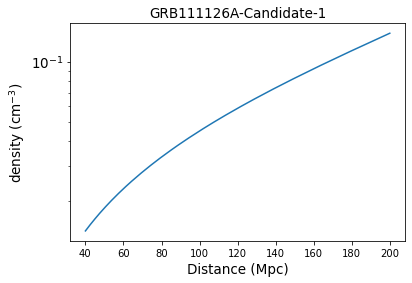
To test the possibility that the radio candidates identified in our analysis are related to radio counterparts of BNS mergers powering the corresponding GRBs, similarly to what done in Grandorf et al. (2021), we fit GHz model light curves to our flux density measurements. These light curves are derived assuming a two-component, GW170817-like ejecta model with masses of M⊙ and M⊙ and respective speeds of and . We set the fractions and of energy going into accelerated electrons and magnetic fields, respectively, equal to their fiducial values of 10% each. With these model assumptions, we have two free parameters left: the distance to the source and the interstellar medium (ISM) number density. Because we only have two observations per candidate radio counterpart, for each of these we fix the distance to a grid of values in between 40 Mpc and 200 Mpc and fit for the ISM density. Overall, our fits on the observed radio flux for GRB 101129A-Candidate-1 and for GRB 111126A-Candidate-2 return . Allowing for and to vary in the range – returns best fits with ISM densities cm-3. For a more realistic range of – cm-3 (given that – of short GRBs have densities cm-3; Fong et al., 2015), we get . Therefore, we rule out these candidates as promising radio counterparts for late-time radio flares. We obtain better results for GRB 111126A-Candidate-1, which we show in Figures 1-2. All of the ISM density values we determined for GRB 111126A-Candidate-1 as a function of distance are plausible values within a BNS merger scenario (see Figure 2). Indeed, short GRBs have been associated with ISM media with densities ranging from cm-3 to cm-3 (Fong et al., 2013), and GW170817 had a circum-burst density of cm-3 (e.g. Hallinan et al., 2017; Lazzati et al., 2018; Makhathini et al., 2021).
The 6 GHz discovery image of GRB111126A Candidate 1 is shown in Figure 3. If the hypothetical merger behind GRB111126A Candidate 1 is nearby, around 40 Mpc, our best fit model predicts rising light curves at 3–6 GHz (Figure 1, red and blue curves) and flux variations throughout 2023 and 2024 (compared to our observations in 2020). However, if the merger is farther away, say at 200 Mpc, the best fit light curves at 3–6 GHz flatten at late times and we would not expect to see significant flux variations in 2023–2024 compared to our 2020 observations (Figure 1, orange and light blue curves). Hence, re-observing this candidate in 2024 would be a promising strategy for further constraining its nature.
7 Summary and conclusion
We used the VLA to observe 7 GRBs without accurate X-ray localizations to identify potential nearby, GW170817-like events. In the 7 observed fields, we find a total of 3 candidate radio counterparts (one in the error region of GRB 101129A and two in the error region of GRB 111126A) passing all our cuts. We have discussed these findings in the context of expectations for false positives, as well as in the context of BNS late-time radio flare models. Overall, one of the radio candidate counterparts found in the error region of GRB 111126A, GRB 111126A-Candidate-1, appears worthy of further follow-up in the radio. Indeed, detecting radio variability at the level of appears possible over the next couple of years (at epochs of about years since the GRB). The existence of time variability in the radio would significantly decrease the odds of a false positive origin.
We conclude by stressing that, if 10% of short GRBs in the known sample of events lacking a redshift measurement is located within 200 Mpc (Gupte & Bartos, 2018), searches like the one described here and in Grandorf et al. (2021) could quickly become profitable: following up with the VLA a sample of short GRBs should result in a 90% chance of finding at least one nearby, GW170817-like event. So far with this work and with the observations presented in Grandorf et al. (2021), we have collected about half of the necessary sample size using only filler-mode observations with the VLA and with a relatively small use of observing resources. With a higher observing priority, we could cover the whole sample at a faster pace. This would also enhance chances for well-timed follow-up observations aimed at testing expectations for radio flux variability (that could be critical to help discern the nature of any potential radio candidate). Overall, we envision this type of observational programs to continue in the future.
References
- Abbott et al. (2017a) Abbott, B. P., Abbott, R., Abbott, T. D., et al. 2017a, ApJ, 848, L13, doi: 10.3847/2041-8213/aa920c
- Abbott et al. (2017b) —. 2017b, Phys. Rev. Lett., 119, 161101, doi: 10.1103/PhysRevLett.119.161101
- Abbott et al. (2017c) —. 2017c, ApJ, 848, L12, doi: 10.3847/2041-8213/aa91c9
- Alexander et al. (2017) Alexander, K. D., Berger, E., Fong, W., et al. 2017, ApJ, 848, L21, doi: 10.3847/2041-8213/aa905d
- Arcavi et al. (2017) Arcavi, I., Hosseinzadeh, G., Howell, D. A., et al. 2017, Nature, 551, 64, doi: 10.1038/nature24291
- Balasubramanian et al. (2021) Balasubramanian, A., Corsi, A., Mooley, K. P., et al. 2021, ApJ, 914, L20, doi: 10.3847/2041-8213/abfd38
- Balasubramanian et al. (2022) —. 2022, ApJ, 938, 12, doi: 10.3847/1538-4357/ac9133
- Bartos et al. (2019) Bartos, I., Lee, K. H., Corsi, A., Márka, Z., & Márka, S. 2019, MNRAS, 485, 4150, doi: 10.1093/mnras/stz719
- Baumgartner et al. (2009) Baumgartner, W. H., Barthelmy, S. D., Cummings, J. R., et al. 2009, Gamma-Ray Coordinate Network, 9138
- Beardmore et al. (2012) Beardmore, A. P., Barthelmy, S. D., Burrows, D. N., et al. 2012, Gamma-Ray Coordinate Network, 13191
- Becker et al. (1994) Becker, R. H., White, R. L., & Helfand, D. J. 1994, in Astronomical Society of the Pacific Conference Series, Vol. 61, Astronomical Data Analysis Software and Systems III, ed. D. R. Crabtree, R. J. Hanisch, & J. Barnes, 165
- Bennett et al. (2014) Bennett, C. L., Larson, D., Weiland, J. L., & Hinshaw, G. 2014, ApJ, 794, 135, doi: 10.1088/0004-637X/794/2/135
- Berger (2009) Berger, E. 2009, ApJ, 690, 231, doi: 10.1088/0004-637X/690/1/231
- Berger (2014) —. 2014, ARA&A, 52, 43, doi: 10.1146/annurev-astro-081913-035926
- Bruni et al. (2021) Bruni, G., O’Connor, B., Matsumoto, T., et al. 2021, MNRAS, 505, L41, doi: 10.1093/mnrasl/slab046
- Chornock et al. (2017) Chornock, R., Berger, E., Kasen, D., et al. 2017, ApJ, 848, L19, doi: 10.3847/2041-8213/aa905c
- Condon (1992) Condon, J. J. 1992, ARA&A, 30, 575, doi: 10.1146/annurev.aa.30.090192.003043
- Coulter et al. (2017) Coulter, D. A., Foley, R. J., Kilpatrick, C. D., et al. 2017, Science, 358, 1556, doi: 10.1126/science.aap9811
- Cowperthwaite et al. (2017) Cowperthwaite, P. S., Berger, E., Villar, V. A., et al. 2017, ApJ, 848, L17, doi: 10.3847/2041-8213/aa8fc7
- Cummings et al. (2011) Cummings, J. R., Palmer, D. M., & others. 2011, Gamma-Ray Coordinate Network, 12599
- Cummings et al. (2008) Cummings, J. R., Palmer, D. M., et al. 2008, Gamma-Ray Coordinate Network, 7209
- Cummings et al. (2014) Cummings, J. R., Barthelmy, S. D., Baumgartner, W. H., et al. 2014, Gamma-Ray Coordinate Network, 16354
- Dichiara et al. (2020) Dichiara, S., Troja, E., O’Connor, B., et al. 2020, MNRAS, 492, 5011, doi: 10.1093/mnras/staa124
- Drout et al. (2017) Drout, M. R., Piro, A. L., Shappee, B. J., et al. 2017, Science, 358, 1570, doi: 10.1126/science.aaq0049
- Evans et al. (2010) Evans, I. N., Primini, F. A., Glotfelty, K. J., et al. 2010, ApJS, 189, 37, doi: 10.1088/0067-0049/189/1/37
- Fong & Berger (2013) Fong, W., & Berger, E. 2013, ApJ, 776, 18, doi: 10.1088/0004-637X/776/1/18
- Fong et al. (2015) Fong, W., Berger, E., Margutti, R., & Zauderer, B. A. 2015, ApJ, 815, 102, doi: 10.1088/0004-637X/815/2/102
- Fong et al. (2013) Fong, W., Berger, E., Chornock, R., et al. 2013, ApJ, 769, 56, doi: 10.1088/0004-637X/769/1/56
- Ghirlanda et al. (2019) Ghirlanda, G., Salafia, O. S., Paragi, Z., et al. 2019, Science, 363, 968, doi: 10.1126/science.aau8815
- Ghosh et al. (2022) Ghosh, A., Vaishnava, C. S., Resmi, L., et al. 2022, arXiv e-prints, arXiv:2207.10001. https://arxiv.org/abs/2207.10001
- Grandorf et al. (2021) Grandorf, C., McCarty, J., Rajkumar, P., et al. 2021, ApJ, 908, 63, doi: 10.3847/1538-4357/abd315
- Granot et al. (2018) Granot, J., Gill, R., Guetta, D., & De Colle, F. 2018, MNRAS, 481, 1597, doi: 10.1093/mnras/sty2308
- Gupte & Bartos (2018) Gupte, N., & Bartos, I. 2018, arXiv e-prints, arXiv:1808.06238. https://arxiv.org/abs/1808.06238
- Gürkan et al. (2014) Gürkan, G., Hardcastle, M. J., & Jarvis, M. J. 2014, MNRAS, 438, 1149, doi: 10.1093/mnras/stt2264
- Haggard et al. (2017) Haggard, D., Nynka, M., Ruan, J. J., et al. 2017, ApJ, 848, L25, doi: 10.3847/2041-8213/aa8ede
- Hajela et al. (2022) Hajela, A., Margutti, R., Bright, J. S., et al. 2022, ApJ, 927, L17, doi: 10.3847/2041-8213/ac504a
- Hales et al. (2012a) Hales, C. A., Murphy, T., Curran, J. R., et al. 2012a, BLOBCAT: Software to Catalog Blobs. http://ascl.net/1208.009
- Hales et al. (2012b) —. 2012b, MNRAS, 425, 979, doi: 10.1111/j.1365-2966.2012.21373.x
- Hallinan et al. (2017) Hallinan, G., Corsi, A., Mooley, K. P., et al. 2017, Science, 358, 1579, doi: 10.1126/science.aap9855
- Horesh et al. (2016) Horesh, A., Hotokezaka, K., Piran, T., Nakar, E., & Hancock, P. 2016, ApJ, 819, L22, doi: 10.3847/2041-8205/819/2/L22
- Hotokezaka et al. (2018) Hotokezaka, K., Kiuchi, K., Shibata, M., Nakar, E., & Piran, T. 2018, ApJ, 867, 95, doi: 10.3847/1538-4357/aadf92
- Hotokezaka & Piran (2015) Hotokezaka, K., & Piran, T. 2015, MNRAS, 450, 1430, doi: 10.1093/mnras/stv620
- Huynh et al. (2005) Huynh, M. T., Jackson, C. A., Norris, R. P., & Prandoni, I. 2005, AJ, 130, 1373, doi: 10.1086/432873
- Itoh et al. (2020) Itoh, R., Utsumi, Y., Inoue, Y., et al. 2020, ApJ, 1, 12, doi: 10.3847/1538-4357/abab07
- Kasen et al. (2017) Kasen, D., Metzger, B., Barnes, J., Quataert, E., & Ramirez-Ruiz, E. 2017, Nature, 551, 80, doi: 10.1038/nature24453
- Kasliwal et al. (2017) Kasliwal, M. M., Nakar, E., Singer, L. P., et al. 2017, Science, 358, 1559, doi: 10.1126/science.aap9455
- Kathirgamaraju et al. (2019) Kathirgamaraju, A., Giannios, D., & Beniamini, P. 2019, MNRAS, 487, 3914, doi: 10.1093/mnras/stz1564
- Kilpatrick et al. (2017) Kilpatrick, C. D., Foley, R. J., Kasen, D., et al. 2017, Science, 358, 1583, doi: 10.1126/science.aaq0073
- Kilpatrick et al. (2021) Kilpatrick, C. D., Fong, W.-f., Blanchard, P. K., et al. 2021, arXiv e-prints, arXiv:2109.06211. https://arxiv.org/abs/2109.06211
- Lacy et al. (2020) Lacy, M., Baum, S. A., Chandler, C. J., et al. 2020, PASP, 132, 035001, doi: 10.1088/1538-3873/ab63eb
- Lazzati et al. (2017) Lazzati, D., Deich, A., Morsony, B. J., & Workman, J. C. 2017, MNRAS, 471, 1652, doi: 10.1093/mnras/stx1683
- Lazzati et al. (2018) Lazzati, D., Perna, R., Morsony, B. J., et al. 2018, Phys. Rev. Lett., 120, 241103, doi: 10.1103/PhysRevLett.120.241103
- Makhathini et al. (2021) Makhathini, S., Mooley, K. P., Brightman, M., et al. 2021, ApJ, 922, 154, doi: 10.3847/1538-4357/ac1ffc
- Mangano et al. (2009) Mangano, V., Barthelmy, S. D., Baumgartner, W. H., et al. 2009, Gamma-Ray Coordinate Network, 9133
- Margutti et al. (2017) Margutti, R., Berger, E., Fong, W., et al. 2017, ApJ, 848, L20, doi: 10.3847/2041-8213/aa9057
- Mateos et al. (2012) Mateos, S., Alonso-Herrero, A., Carrera, F. J., et al. 2012, MNRAS, 426, 3271, doi: 10.1111/j.1365-2966.2012.21843.x
- Matsumoto & Piran (2020) Matsumoto, T., & Piran, T. 2020, MNRAS, 492, 4283, doi: 10.1093/mnras/staa050
- Metzger (2019) Metzger, B. D. 2019, Living Reviews in Relativity, 23, 1, doi: 10.1007/s41114-019-0024-0
- Metzger & Fernández (2021) Metzger, B. D., & Fernández, R. 2021, ApJ, 916, L3, doi: 10.3847/2041-8213/ac1169
- Mooley et al. (2013) Mooley, K. P., Frail, D. A., Ofek, E. O., et al. 2013, ApJ, 768, 165, doi: 10.1088/0004-637X/768/2/165
- Mooley et al. (2018a) Mooley, K. P., Deller, A. T., Gottlieb, O., et al. 2018a, Nature, 561, 355, doi: 10.1038/s41586-018-0486-3
- Mooley et al. (2018b) Mooley, K. P., Frail, D. A., Dobie, D., et al. 2018b, ApJ, 868, L11, doi: 10.3847/2041-8213/aaeda7
- Murphy et al. (2011) Murphy, E. J., Condon, J. J., Schinnerer, E., et al. 2011, ApJ, 737, 67, doi: 10.1088/0004-637X/737/2/67
- Nakar (2007) Nakar, E. 2007, Phys. Rep., 442, 166, doi: 10.1016/j.physrep.2007.02.005
- Nakar & Piran (2011) Nakar, E., & Piran, T. 2011, Nature, 478, 82, doi: 10.1038/nature10365
- Nakar & Piran (2018) —. 2018, MNRAS, 478, 407, doi: 10.1093/mnras/sty952
- NASA/IPAC Extragalactic Database (2019) NASA/IPAC Extragalactic Database. 2019, IPAC, doi: 10.26132/NED1
- Nedora et al. (2021) Nedora, V., Radice, D., Bernuzzi, S., et al. 2021, MNRAS, 506, 5908, doi: 10.1093/mnras/stab2004
- O’Connor & Troja (2022) O’Connor, B., & Troja, E. 2022, GRB Coordinates Network, 32065, 1
- Padovani et al. (2017) Padovani, P., Alexander, D. M., Assef, R. J., et al. 2017, A&A Rev., 25, 2, doi: 10.1007/s00159-017-0102-9
- Palliyaguru et al. (2016) Palliyaguru, N. T., Corsi, A., Kasliwal, M. M., et al. 2016, ApJ, 829, L28, doi: 10.3847/2041-8205/829/2/L28
- Perley & Perley (2013) Perley, D. A., & Perley, R. A. 2013, ApJ, 778, 172, doi: 10.1088/0004-637X/778/2/172
- Pian et al. (2017) Pian, E., D’Avanzo, P., Benetti, S., et al. 2017, Nature, 551, 67, doi: 10.1038/nature24298
- Radice et al. (2020) Radice, D., Bernuzzi, S., & Perego, A. 2020, Annual Review of Nuclear and Particle Science, 70, 95, doi: 10.1146/annurev-nucl-013120-114541
- Radice et al. (2018) Radice, D., Perego, A., Hotokezaka, K., et al. 2018, ApJ, 869, 130, doi: 10.3847/1538-4357/aaf054
- Rastinejad et al. (2022) Rastinejad, J. C., Gompertz, B. P., Levan, A. J., et al. 2022, arXiv e-prints, arXiv:2204.10864. https://arxiv.org/abs/2204.10864
- Ricci et al. (2021) Ricci, R., Troja, E., Bruni, G., et al. 2021, MNRAS, 500, 1708, doi: 10.1093/mnras/staa3241
- Sadler et al. (1999) Sadler, E. M., McIntyre, V. J., Jackson, C. A., & Cannon, R. D. 1999, PASA, 16, 247, doi: 10.1071/AS99247
- Sakamoto et al. (2012) Sakamoto, T., Barthelmy, S. D., Baumgartner, W. H., et al. 2012, Gamma-Ray Coordinate Network, 13195
- Schroeder et al. (2020) Schroeder, G., Margalit, B., Fong, W.-f., et al. 2020, ApJ, 902, 82, doi: 10.3847/1538-4357/abb407
- Seymour et al. (2008) Seymour, N., Dwelly, T., Moss, D., et al. 2008, MNRAS, 386, 1695, doi: 10.1111/j.1365-2966.2008.13166.x
- Shappee et al. (2017) Shappee, B. J., Simon, J. D., Drout, M. R., et al. 2017, Science, 358, 1574, doi: 10.1126/science.aaq0186
- Smartt et al. (2017) Smartt, S. J., Chen, T. W., Jerkstrand, A., et al. 2017, Nature, 551, 75, doi: 10.1038/nature24303
- Smolčić et al. (2017) Smolčić, V., Delvecchio, I., Zamorani, G., et al. 2017, A&A, 602, A2, doi: 10.1051/0004-6361/201630223
- Smolčić et al. (2008) Smolčić, V., Schinnerer, E., Scodeggio, M., et al. 2008, ApJS, 177
- Stroh et al. (2014) Stroh, M. C., Beardmore, A. P., Cummings, J. R., et al. 2014, Gamma-Ray Coordinate Network, 16353
- Tanvir et al. (2017) Tanvir, N. R., Levan, A. J., González-Fernández, C., et al. 2017, ApJ, 848, L27, doi: 10.3847/2041-8213/aa90b6
- Troja et al. (2017) Troja, E., Piro, L., van Eerten, H., et al. 2017, Nature, 551, 71, doi: 10.1038/nature24290
- Troja et al. (2021) Troja, E., O’Connor, B., Ryan, G., et al. 2021, arXiv e-prints, arXiv:2104.13378. https://arxiv.org/abs/2104.13378
- Troja et al. (2022) —. 2022, MNRAS, 510, 1902, doi: 10.1093/mnras/stab3533
- Valenti et al. (2017) Valenti, S., Sand, D. J., Yang, S., et al. 2017, ApJ, 848, L24, doi: 10.3847/2041-8213/aa8edf
- Wright et al. (2010) Wright, E. L., Eisenhardt, P. R. M., Mainzer, A. K., et al. 2010, AJ, 140, 1868, doi: 10.1088/0004-6256/140/6/1868
- Wright et al. (2019) —. 2019, IPAC, doi: 10.26131/IRSA1
- Xu et al. (2014) Xu, D., Niu, H.-B., Yang, T.-Z., Esamdin, A., & Ma, L. 2014, Gamma-Ray Coordinate Network, 16359
- Yurkov et al. (2012) Yurkov, V., et al. 2012, Gamma-Ray Coordinate Network, 13197