Weakly Supervised Learning for Analyzing Political Campaigns on Facebook
Abstract
Social media platforms are currently the main channel for political messaging, allowing politicians to target specific demographics and adapt based on their reactions. However, making this communication transparent is challenging, as the messaging is tightly coupled with its intended audience and often echoed by multiple stakeholders interested in advancing specific policies. Our goal in this paper is to take a first step towards understanding these highly decentralized settings. We propose a weakly supervised approach to identify the stance and issue of political ads on Facebook and analyze how political campaigns use some kind of demographic targeting by location, gender, or age. Furthermore, we analyze the temporal dynamics of the political ads on election polls.
Introduction
Over the last decade, social media has impacted public discourse and communication, particularly in the political context (Kushin and Yamamoto 2010; Wattal et al. 2010; Ratkiewicz et al. 2011; Stieglitz and Dang-Xuan 2013; Jensen 2017; Marozzo and Bessi 2018; Badawy, Ferrara, and Lerman 2018; Ferrara et al. 2020; Sharma, Ferrara, and Liu 2021). Social media has a transformative effect on how political candidates interact with potential voters by adapting their messaging to different demographic groups’ specific concerns and interests. This process, known as microtargeting (Hersh 2015), relies on data-driven campaigning techniques that exploit the rich information collected by social networks about their users. By measuring the users’ engagement with political content, candidates can identify the issues, and even the specific phrases and slogans, that resonate with each demographic group. Furthermore, political campaigns on social media are highly distributed, with multiple stakeholders and interest groups using the platforms to advance their interests and show support for different candidates by specifically focusing on agenda items relevant for their interests (e.g., the National Rifle Association (NRA) might emphasize the track-record of each candidate on protecting gun rights).
Our goal in this paper is to take a first step towards analyzing and monitoring the landscape of political advertising on social media. We focus our experiments on the U.S. 2020 presidential elections, analyzing content supporting either the Biden-Harris or the Trump-Pence campaigns. Our goal is twofold: first to characterize the different stakeholders and analyze their content, and second to build on this characterization to analyze political messaging across different demographics.
We deal with the decentralized nature of political advertising on social media. We analyze over advertisers (referred to as funding entities) that funded over political ads on Facebook222https://www.facebook.com/ads/library/api, associating advertisers with a binary label (Pro-Biden or Pro-Trump) and ads with four categories capturing positive or negative messaging and its target. We also identify the specific policy issue discussed in the ad, a 13-class classification problem. To clarify, consider the following two ads:
Ad1: From COVID-19 to the environment to racial justice, Donald Trump has failed. Joe Biden and Kamala Harris can set us on a new course. The stakes for Pennsylvanians could not be higher.
Ad2: President Trump PROTECTED Social Security and Medicare. Joe Biden tried to cut them MULTIPLE times. President Trump LOWERED drug costs, and Medicare Advantage Premiums fell 34%. Under Biden, drug prices SKYROCKETED. Joe Biden and Kamala Harris’s FAR left plan threatens private insurance and limits choices.
Ad1 has Anti-Trump and Pro-Biden stances focusing on the multiple issues covid, climate, racial justice. On the other hand, Ad2 has Pro-Trump and Anti-Biden stances focusing on the healthcare issue.
In this paper, we suggest a weakly supervised graph-embedding based framework in which ads and advertisers are learned jointly. While some cases, the name of the advertisers capture their bias, e.g., ‘BIDEN FOR PRESIDENT’, ‘TRUMP MAGA COMMITTEE’ and we mention them as explicit advertisers. Some advertisers do not explicitly mention any candidate name/party affiliation in their names, e.g., ‘Union 2020’, ‘Plains PAC’ and we call them implicit advertisers. We leverage weak supervision from explicit advertisers for the stance prediction. Our embedding objective is derived from dedicated lexicons developed for identifying policy issues, and by identifying the political position of a small number of advertisers (i.e., the position of the Trump-Pence campaign is known). During learning, our model learns the associations between advertisers and their positions and the content they publish, as well as the issues they are mostly concerned with.
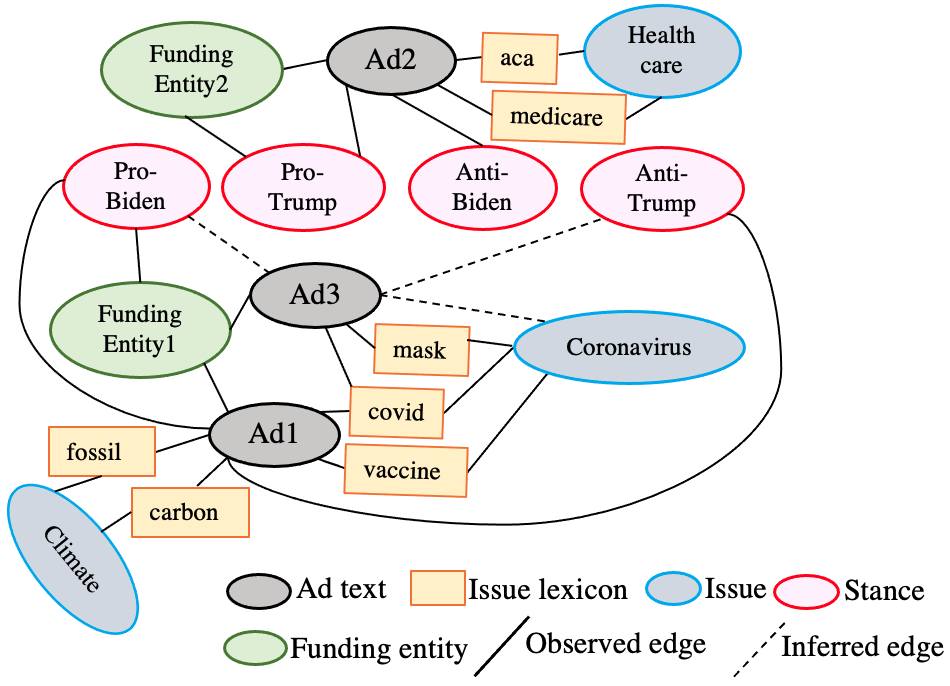
Fig. 1 represents the embedding graph of our framework containing nodes i.e., ads, funding entities, stances, issues, issue lexicons and edges representing their relationships, i.e. as Ad1 has Pro-Biden stance, there is an edge between node Ad1 and Pro-Biden. We learn a graph embedding to maximize the similarity between neighboring nodes (Perozzi, Al-Rfou, and Skiena 2014; Tang et al. 2015; Grover and Leskovec 2016). Fig. 1 shows that Ad1 and Ad2 have weak labels for stances and issues obtaining from their funding entities and issue lexicons respectively. Initially, Ad3 doesn’t have a label. It has edge with Funding Entity1 and issue lexicons named ‘covid’ and ‘mask’. We exploit these resources to train our embedding model, which captures the context and, as a result, can generalize and grasp stances and issues in new ads (i.e., Ad3 in Fig. 1).
The learned model allows us to analyze how political candidates and stakeholders micro-target specific demographics. In this work, we examine a novel dataset of advertisements posted to Facebook during the 2020 U.S presidential election and make the full dataset available to the research community. Using the information provided by Facebook Political Ads API, we analyze the issues used for supporting (and attacking) each candidate on ads targeting different geographical regions, age, and gender groups. We evaluate the quality of the learned model by applying it to detect the stance of implicit funding entities and compare it with their views (ground truth). Further, we discuss how election polls affect political campaigns using Granger causality (Granger 1988). We focus on the following research questions (RQ) to analyze political campaigns:
-
•
RQ1. Can we analyze political campaigns without direct supervision? (Section Results and Analysis)
-
•
RQ2. Are messages distinctive in ads? (Subsection Descriptive Insights)
-
•
RQ3. Which demographics are reached by advertisers? (Subsection Audience Demographics)
-
•
RQ4. How specific region is reached by advertisers and their messages? (Subsection State-wise Issue and Demographics)
-
•
RQ5. Are election polls represented in ad campaigns? (Subsection Granger Causality with Polls)
Our contributions are summarized as follows:
-
1.
We formulate a novel problem of exploiting weak supervision to analyze the landscape of political advertising on social media.
-
2.
We propose a weakly supervised graph embedding based framework to identify political stance of advertisers as well as the published content and issues of the content. We show that our model outperforms the baselines.
-
3.
We conduct quantitative and qualitative analysis on real-world dataset to demonstrate the effectiveness of our proposed model.
Our code and data are publicly available here333https://github.com/tunazislam/weaklysup-FB-ad-political.
Related Work
During elections, political candidates use social media for their campaigns. Recent works show monitoring and analysis of targeted advertising on social media (Andreou et al. 2019; Silva et al. 2020b; Serrano et al. 2020). Islam and Goldwasser (2022b) analyzed Covid-19 vaccine campaign on Facebook. Ribeiro et al. (2019) analyzed political ads on Facebook that are linked to a Russian propaganda group: Internet Research Agency (IRA). Silva et al. (2020a) showed Facebook ad (created by IRA) engagement targeting the 2016 U.S. general election. Silva et al. (2020b) designed a system to monitor political ads on Facebook in Brazil and deployed during the Brazilian 2018 elections. Capozzi et al. (2020, 2021) examined advertising concerning the issue of immigration in Italy. Our paper detects the stance and issue of political ads on Facebook. It analyzes political campaigns for both candidates based on the target audience’s demographic and geographic information as well as presents temporal analysis for the 2020 U.S presidential election.
Recent works frame the issue of perspective detection as a text categorization problem (Greene and Resnik 2009; Klebanov, Beigman, and Diermeier 2010; Recasens et al. 2013; Iyyer et al. 2014; Johnson and Goldwasser 2016). It is typically studied as a supervised learning task (Lin et al. 2006; Durant and Smith 2006; Greene and Resnik 2009). In contrast, our approach relies on weak supervision and lexicon based approaches (Roy and Goldwasser 2020; Field, Kliger et al. 2018). Weakly supervised methods reduce dependence on labeled texts. Graph based semi-supervised algorithms achieved considerable attention over the years (Zhu and Ghahramani 2002; Belkin, Niyogi, and Sindhwani 2006; Subramanya and Bilmes 2008; Talukdar et al. 2008; Sindhwani and Melville 2008; Yang, Cohen, and Salakhudinov 2016; Hisano 2018). Tang, Qu, and Mei (2015); Zhang et al. (2020) used graph-based methods to build text networks with words, documents and labels and propagate labeling information along the graph via embedding learning. Han and Shen (2016) encoded weakly supervised information in positive unlabelled learning tasks into pairwise constraints between training instances imposing on graph embedding. Recently, Islam and Goldwasser (2022a) proposed weakly supervised graph embedding based EM-style framework to characterize user types on social media. Our embedding model is similar to contrastive learning-based embedding (Wu et al. 2020; Giorgi et al. 2020). However, contrastive learning is self-supervised, where labels are generated from the data without any manual or weak label sources. In our case, we generate the label using weak supervision. Our work is also closely related to the entity-targeted sentiment analysis (Mohammad et al. 2016; Field and Tsvetkov 2019; Mitchell et al. 2013; Meng et al. 2012). In our work, we use weak supervision to identify stance and issue of political ads and analyze political campaigns. To the best of our knowledge, this is the first work to utilize a weakly supervised graph embedding based framework to analyze political campaigns on social media.
Data
We collect around million political ads from January-October 2020 using Facebook Ad Library API with the search term ‘biden’, ‘harris’, ‘trump’, ‘pence’. All advertisements are written in English. For each ad, the API provides the ad ID, title, ad body, and URL, ad creation time and the time span of the campaign, the Facebook page authoring the ad, funding entity, the cost of the ad (given as a range). The API also provides information on the users who have seen the ad (called ‘impressions’): the total number of impressions (given as a range and we take the average of the end points of the range), distribution over impressions broken down by gender (male, female, unknown), age ( groups), and location down to states in the USA. We have duplicate content among those collected ads because the same ad has been targeted to different regions and demographics with unique ad id. We have ads with different contents, unique funding entities, among them explicitly mention candidate names and/or party affiliations, e.g., BIDEN FOR PRESIDENT, DONALD J. TRUMP FOR PRESIDENT, INC.
Holdout Data
For validation purpose, we manually annotate ads for stances and issues. We consider stances ‘pro-biden’, ‘pro-trump’, ‘anti-biden’, ‘anti-trump’ and issues444https://ballotpedia.org/ called ‘abortion’, ‘covid’, ‘climate’, ‘criminal justice reform, race, law & order’, ‘economy and taxes’, ‘education’, ‘foreign policy’, ‘guns’, ‘healthcare’, ‘immigration’, ‘supreme court’, ‘terrorism’, ‘lgbtq’. We also mark ‘non-stance’, ‘non-issue’ ads. Two annotators from the Computer Science department manually annotate a subset of ads to calculate inter-annotator agreement using Cohen’s Kappa coefficient (Cohen 1960). This subset has inter-annotator agreements of for stance and for the issue, which are substantial agreements. In case of a disagreement, we resolve it by discussion. The rest of the data was annotated by one graduate student from the Computer Science department.
Methodology
We represent political advertising activity on social media as a graph, connecting funding entities to their ads. We represent the outcome of our analysis, stance and issue predictions, as separate label nodes in the graph connected via edges to ads and funding entities. Each issue label-node is associated with an -gram lexicon, a set of nodes representing lexical indicators for the issue. Based on known associations between funding entities and stances, we associate of the funding entities and their ads with stance labels. The lexicon and observed stance relations act as a weak form of supervision for graph embedding. Our model learns to generalize the stance predictor to new ads, and by contextualizing the lexicon -grams based on their occurrence in ads, we learn to associate other ads with the relevant issue even when the lexicon items are not present. These settings are described in Fig. 1. Note that each ad can be associated with multiple issues and stances (e.g., pro-biden and anti-trump).
| Issue(uni,bi,tri) | Issue(uni,bi,tri) |
|---|---|
| Abortion (56, 20, 1) | Foreign policy (95, 31, 6) |
| Covid (52, 23, 5) | Guns (92, 20, 6) |
| Climate (66, 22, 3) | Healthcare (62, 21, 4) |
| Criminal justice reform, race | Immigration (78, 25, 3) |
| law & order (93, 26, 5) | Supreme court (80, 25, 4) |
| Economy & taxes (41, 16, 2) | Terrorism (73, 19, 3) |
| Education (62, 22, 2) | LGBTQ (55, 12, 1) |
Issue Lexicon
To create the issue lexicon, we collect news articles covering each issue from left leaning, right leaning, and neutral news media. We know the news source bias from https://mediabiasfactcheck.com/. We calculate the Pointwise Mutual Information (PMI) (Church and Hanks 1990) to identify issue-specific lexicons. We calculate the PMI for an -gram, with issue, as . To compute , we take all news articles related to an issue and compute . We have news articles per issue. is computed by counting -gram, over the whole corpus ( news articles). We assign each -gram to the issue with the highest PMI and build an -gram lexicon for each issue. Table 1 shows the number of unigrams, bigrams, and trigrams with PMI per issue. In this paper, we use only unigrams, resulting in issue-indicating words.
Model
To identify stances and issues, we do the followings:
Inferring Stance Labels Using Knowledge.
In some cases, the names of funding entities capture their bias. For example: ‘Biden Victory Fund’, ‘Keep Trump in office’ clearly state their position.
We extract all funding entities mentioning the candidates or their party. In addition, if the funding entity name also includes the words {‘dump’, ‘lie’, ‘out’, ‘fail’, ‘against’}, we assume the funding agency has stance against that candidate. In this manner, we annotate funding entities. We annotate the ads generated by those funding entities. If a ‘pro-trump’ funding entity addresses ‘biden’, the ad is ‘anti-biden’ (and the vice-versa). We use this approach to provide labels for ads, and use them as weak supervision for our model.
| Model | Accuracy | Macro-avg F1 |
|---|---|---|
| BiLSTM_Glove | 0.54 | 0.42 |
| Fine-tuned BERT | 0.56 | 0.41 |
| Rule-based | 0.38 | 0.33 |
| Our Model | 0.73 | 0.63 |
Prediction of Stances and Issues of Ads and Funding Entities. We embed the following instances in a common embedding space - (a) Ads (b) Funding Entities; (c) Issue Lexicon; (d) Issue Labels; (e) Stance Labels. We maximize the similarity between two instances in the embedding space if – (1) A funding entity has a stance. (2) An ad has a stance. (3) An ad has a word from the issue lexicon. (4) An issue lexicon word has an annotated issue. We follow a negative sampling approach to learn the embeddings. Given an instance , a positive example and a negative example , where is placed closer to and far from in the embedding space, the embedding loss designed to place closer to than is Here, defines the embedding loss for objective type (for example, ad to stance). Our goal is to maximize the similarity of a node embedding with a positive example and minimize the similarity with a negative example. We call a stance a positive example for an ad, if the ad has the stance, otherwise, the stance is called a negative example. We randomly sample negative examples for each instance (ad) for the objectives numbered (1) and (2) and negative examples for (3) and (4). The number of negative examples provided differs by type of objectives because there are multiple stances and issues for the same instance. For example, let’s assume an ad has stances both ‘pro-biden’ and ‘anti-trump’ which are positive examples for the ad, and negative examples for that would be ‘pro-trump’ and ‘anti-biden’ stances – this is the reason for choosing negative examples randomly for objectives numbered (1) and (2). If the ad has multiple words from the issue lexicon, that means the ad has multiple issues that are considered positive examples. The rest would be the negative examples for the ad. Therefore, we randomly pick negative examples for the objectives numbered (3) and (4) for our data. is the dot product and is the cross-entropy loss, For all kind of objectives, we minimize the summed loss , where is the set of all objective functions and is the weight for objective function of type . We initialize , for all.
Experimental Setup
In this section, we present the baselines to evaluate the effectiveness of our model and hyperparameter tuning.
Baselines
For baseline comparison, we use rule-based ad stance prediction, based on simple paraphrases “We support Donald Trump”, “We support Joe Biden”, “We do not support Donald Trump”, “We do not support Joe Biden”. We predict the stance of all ads based on the similarity with the paraphrases.
For the supervised baseline, we train a model using the weak labels assigned by the knowledge from explicit funding entities and predict the stance of the ads having no weak label (test data).
From the weakly labeled training data, we randomly choose data as the validation set. Our first supervised baseline is referred to as BiLSTM_Glove model. We use Glove word embeddings to obtain the ad embeddings and pass them to bidirectional LSTM (Hochreiter and Schmidhuber 1997). For the second supervised baseline, we fine-tune the pre-trained BERT-base-uncased (Devlin et al. 2019) model. For the BERT’s input, we tokenize the text using BERT’s wordpiece tokenizer. For both supervised baselines, we use cross-entropy loss, -fold cross-validation and report the average test result (accuracy and macro-avg F1 score) considering only the manually annotated ads as ground truth.
FE GT Pred_M Acc_M (%) FE GT Pred_M Acc_M (%) Planned Parenthood Votes L L 100.0 Women Speak Out PAC C C 95.5 Union 2020 L L 82.8 America First Action C C 98.3 United We Dream Action L L 100.0 PRESERVE AMERICA PAC C C 100.0 Independence USA PAC L L 99.9 PROTECT FREEDOM PAC C C 68.5 PACRONYM L L 92.6 American Potential Fund C C 76.9 Alliance for a Better Minnesota L L 98.4 Plains PAC C C 100.0 Black PAC L L 100.0 Citizens for Free Enterprise C C 100.0 The Lincoln Project L L 100.0 AG TOGETHER PAC C C 100.0 DEFEAT DISINFO PAC L L 93.9 FREEDOM THROUGH TRUTH C C 63.2 UNITED FOR PROGRESS PAC L L 92.1 Family Policy Alliance C C 75.0 Veterans For Responsible Leadership L L 100.0 RESTORATION PAC C C 75.0 Dream Defenders Fight PAC L L 100.0 AMERICANS FOR PROSPERITY C L 22.4 Working America L L 100.0 Championing America at Her Best C L - UNITE THE COUNTRY L L 100.0 C3 PAC C L 46.6 FOR OUR FUTURE L L 100.0 Honoring American Law Enforcement PAC C C 100.0 BEST DAYS AHEAD L L 100.0 CONGRESSIONAL LEADERSHIP FUND C C 72.5 REALLY AMERICAN PAC L L 84.3 WE ARE GREAT AGAIN PAC C C 72.9 Win Justice L L 84.8 KEEP AMERICA GREAT COMMITTEE C C 73.2 VOTE VALUES L L 82.0 GREAT AMERICA PAC C C 100.0 NARAL Freedom Fund L L 90.9 Keep Kentucky Great C C 100.0 COMMON DEFENSE ACTION FUND L L 100.0 STOP SOCIALISM NOW PAC C C 100.0 DEFEAT BY TWEET L L 100.0 Wisconsin Right to Life C C 75.0 NJ7 CITIZENS FOR CHANGE L L 100.0 Texas Right to Life C C 100.0 NEW POWER PAC L L 100.0 FLORIDA 8TH PAC C C 100.0 QUESTION PAC L L 100.0 CatholicVote C C 100.0
Hyperparameter Details
Ad embeddings are obtained by running a Bi-LSTM (Schuster and Paliwal 1997) over the Glove (Pennington, Socher, and Manning 2014) word embeddings of the words of the ad. We concatenate the hidden states of the two opposite directional LSTMs to get representation over one time-stamp and average the representations of all time-stamps to get a single representation of the ad. All the embeddings are initialized in a space. We use single layer Bi-LSTM which takes Glove word embeddings as inputs and maps to a hidden layer. We train this Bi-LSTM jointly with the embedding learning. Adam (Kingma and Ba 2014) optimizer with learning rate is used. We initialize the embeddings of all of the other instances randomly. we use validation loss as a stopping criteria. We run the embedding learning at most epochs or stop the learning if the loss does not decrease for consecutive epochs. For BiLSTM_Glove baseline, the single layer Bi-LSTM takes Glove word embeddings as inputs and maps to a hidden layer with optimizer= , learning rate= , batch size = , epochs = . For BERT fine-tuning, we use maximum sentence length = , batch size = , learning rate = , optimizer= (Loshchilov and Hutter 2018), epochs = , epsilon parameter = . We chose the lowest validation loss as a stopping criterion for the two supervised baselines.
Results and Analysis
After learning the embeddings from our weakly supervised graph embedding approach, we can infer the stances and issues of unlabeled ads and funding entities by looking at the embedding similarity of the ads and funding entities having stance and issue labels. The stance or issue label having the maximum similarity is inferred as the predicted issues and stances. We discard ‘non-stance’ and ‘non-issue’ cases for the stance and issue prediction evaluation, resulting in ads and ads, respectively. We use accuracy and macro-average F1 score as the evaluation metrics. We obtain accuracy of and macro-average F1 score of for stance prediction of the ads. For the issue prediction tasks, we achieve accuracy and macro-average F1 score. For rule-based baseline of stance prediction we get accuracy and macro-average F1 score (Table. 2). We compare our model with two supervised baselines. BiLSTM_Glove obtains accuracy and macro-average F1 score for stance prediction (Table. 2). Second supervised baseline (Fine-tuned BERT) gets accuracy and macro-average F1 score (Table. 2). Table 2 shows that weakly supervised graph embedding model achieves the highest performance in stance prediction compare to the rule-based as well as supervised baselines which answers the RQ1.
Pro-biden Anti-trump Pro-trump Anti-biden Trigrams P_Cor Trigrams P_Cor Trigrams P_Cor Trigrams P_Cor vote joe biden 0.763 defeat donald trump 0.594 president trump need 0.667 joe biden democratic 0.713 presidential election held 0.470 request ballot today 0.526 trump need vote 0.729 dont let america 0.357 joe kamala democrat 0.579 time running out 0.238 vote november 0.539 taken joe biden 0.600 today vote democrat 0.583 not authorized candidate 0.353 president trump 0.510 radical left taken 0.431 vote democrat joe 0.683 affordable care act 0.382 fake news medium 0.303 democratic party dont 0.524 defeat donald trump 0.535 new trumpcare plan 0.572 president trump spent 0.523 million illegal immigrants 0.295 sure joe biden 0.659 health insurance affordable 0.206 poll sleepy joe 0.396 trillions new taxes&amnesty 0.460 endorse joe biden 0.740 save big health 0.199 live american dream 0.381 biden embraced policy 0.575 joe biden president 0.689 defeat trump gop 0.608 forgotten men woman 0.185 policy far left 0.466 kamala democrat country 0.407 condemn donald trump 0.446 equal opportunity justice 0.206 reduction police funding 0.231
Qualitative Analysis
As we do not have ground truths for implicit funding entities, for qualitative evaluation, we consider funding entities (containing ads) that do not explicitly mention any candidate name/party affiliation in their name. To understand their stance as ground truth, we look for their views at OpenSecrets.org.
We report results from liberal and conservative advertisers.
For each entity, we take the majority vote over the predictions. In Table. 3, we show the predicted stance with accuracy using our model and compare with ground truth.
From Table. 3, we observe ‘liberal’ view for the conservative advertiser ‘Championing America at Her Best’555https://www.championingamerica.com/.
The goal of this funding entity is to prevent the reelection of Donald Trump and founding director of this funding entity is Matthew Mattern who is a Republican committed to the ideals of the party of Lincoln and Reagan. Our model predict anti-trump stance for all ads ( accuracy) sponsored by this advertiser in our data.
We notice that our model provides ‘liberal’ view for conservative advertisers ‘AMERICANS FOR PROSPERITY’ and ‘C3 PAC’ based on majority vote over the predictions (Table. 3) by predicting ‘anti-trump’ stance mostly. For advertiser ‘AMERICANS FOR PROSPERITY’, we observe that our model predict anti-trump stance where ads contain text like – “Make your voice heard today by sending a letter to tell Senator – I support the confirmation of Justice Amy Coney Barrett!”, where = any Republican senators.
Our model predicts anti-trump stance for ads sponsored by ‘C3 PAC’ where it contains criticism of Trump inside quote, i.e., We can’t let Nancy Pelosi get away with more baseless lies and sham conspiracy theories. Join us in condemning her recent “Trump and GOP lawmakers are Enemies of the People” remarks.
Though our model can predict ‘liberal’ views for for all liberal advertisers based on majority vote (Table. 3), we notice that our model predicts pro-trump stance for the ads having rhetorical question – “Joe Biden worked with Obama to save the auto industry and bring back jobs. What has Trump done for American workers?”
Descriptive Insights
In our data, we have more pro-trump stance ads. We notice that supreme court is the most and lgbtq is the least prominent issues in the ad content. To answer RQ2, we focus on how distinctive the contents of ‘’ and ‘’ ads, where . To understand what kind of words ads use to represent positive and negative stance towards the candidates, we show most frequent trigrams for each category (Table. 4). To compute the statistical significance, we calculate Pearson correlation coefficient (Pearson 1895) between ads of each stance category and each trigram generated by corresponding category of ads (, where = trigrams generated from and = ads related to each stance category). To calculate correlation, we provide the embedding for each trigrams and embedding of ads for each stance category. For embedding, we use Sentence-BERT embeddings (Reimers and Gurevych 2019). Trigrams and corresponding Pearson correlation coefficient are shown in Table. 4. From Table. 4, we notice that the ads having pro-biden stance has common trigrams like ‘vote joe biden’, ‘today vote democrat’, ‘joe kamala democrat’ etc, whether anti-trump has trigrams like ‘defeat donald trump’, ‘request ballot today’, ‘new trumpcare plan’ etc. On the other hand, ads with pro-trump stance has common trigrams like ‘president trump need’, ‘vote november ’, ‘live american dream’, ‘equal opportunity justice’ etc, whether anti-biden ads contains trigrams like ‘radical left taken’, ‘million illegal immigrants’, ‘trillions new taxes&amnesty’, ‘reduction police funding’ etc. Biden’s economy & tax plans and immigration policies are often the target of anti-biden attacks, and as such are often mentioned and accused of raising tax on middle class families, providing illegal immigrants amnesty and healthcare, embracing far left policy. On the other side, pro-trump messages focus on Trump’s vow never to forget the ‘forgotten men and women’. They also advertise about how every single citizen have a chance to live their American dream and have equal opportunity justice under Trump administration.
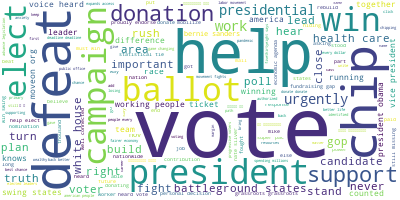
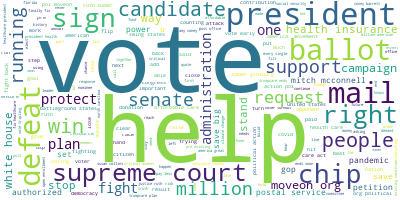
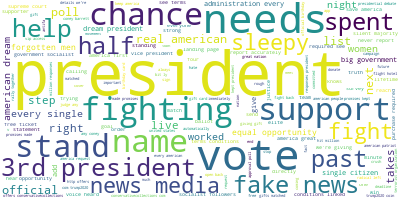
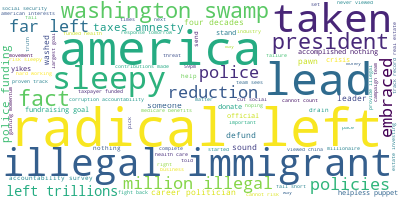
To show the noticeable qualitative differences, we create wordcloud with the most frequent words from the whole data. Fig. 2 shows the visual representation of the text for each stance category. Words are usually single words, and the importance of each tag is shown with font size and color. Ads with pro-biden and anti-trump stances are talking about vote, chip, donation, win, defeat, elect, ballot, win, support (Fig. 2(a) and 2(b)). Positive stance regarding Trump has following words president, vote, fighting, fake news, real american (Fig. 2(c)). Anti-biden wordcloud has noticeable words such as radical left, sleepy, washington swamp, illegal immigrant, far left (Fig. 2(d)).
Issue-specific Ads
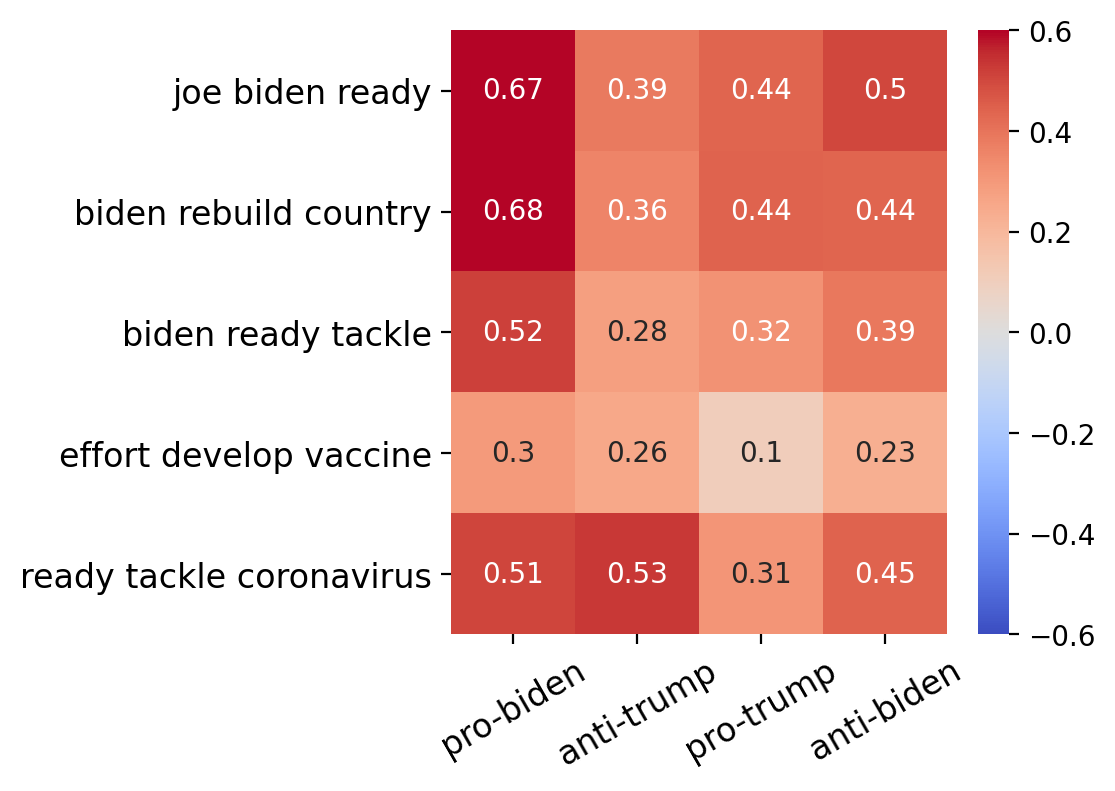
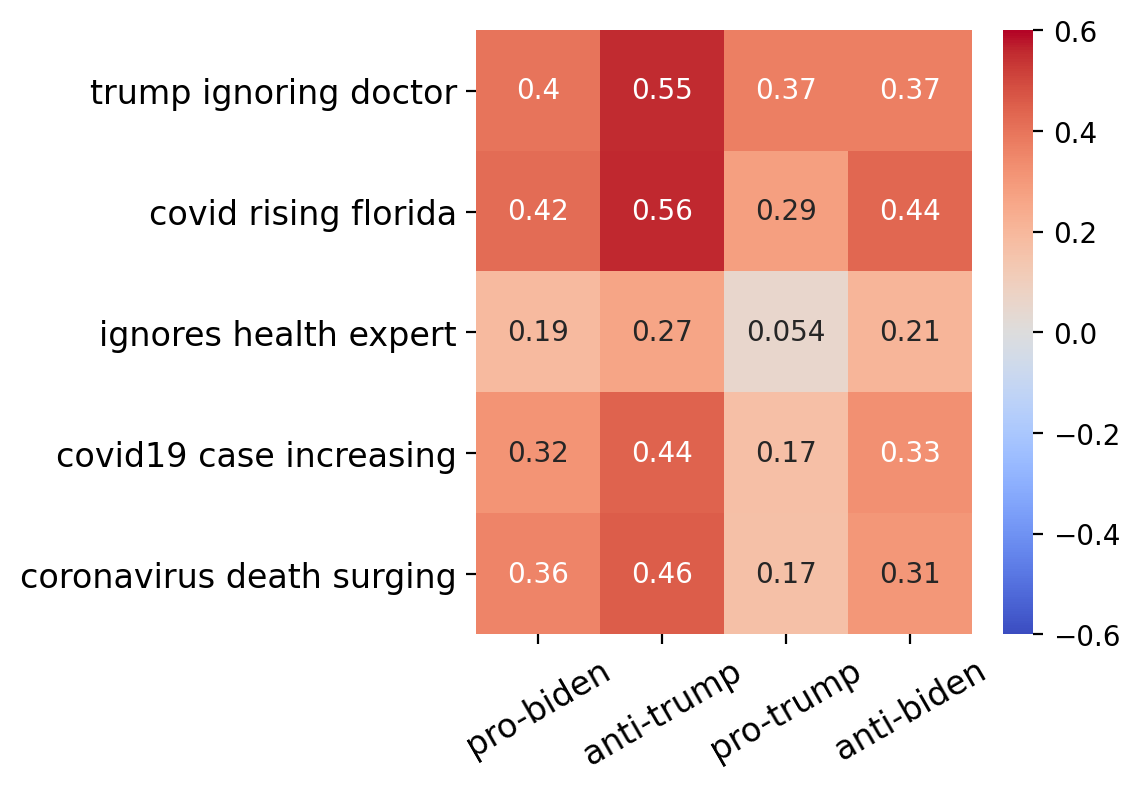
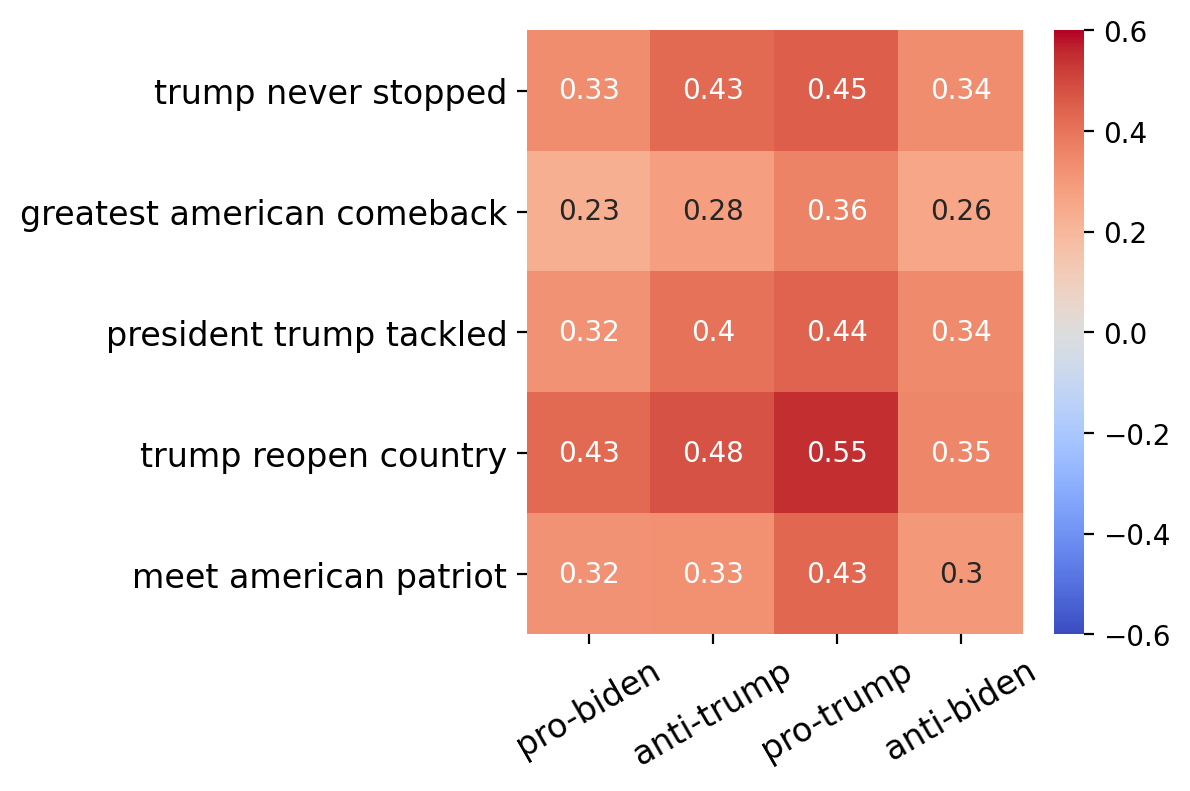
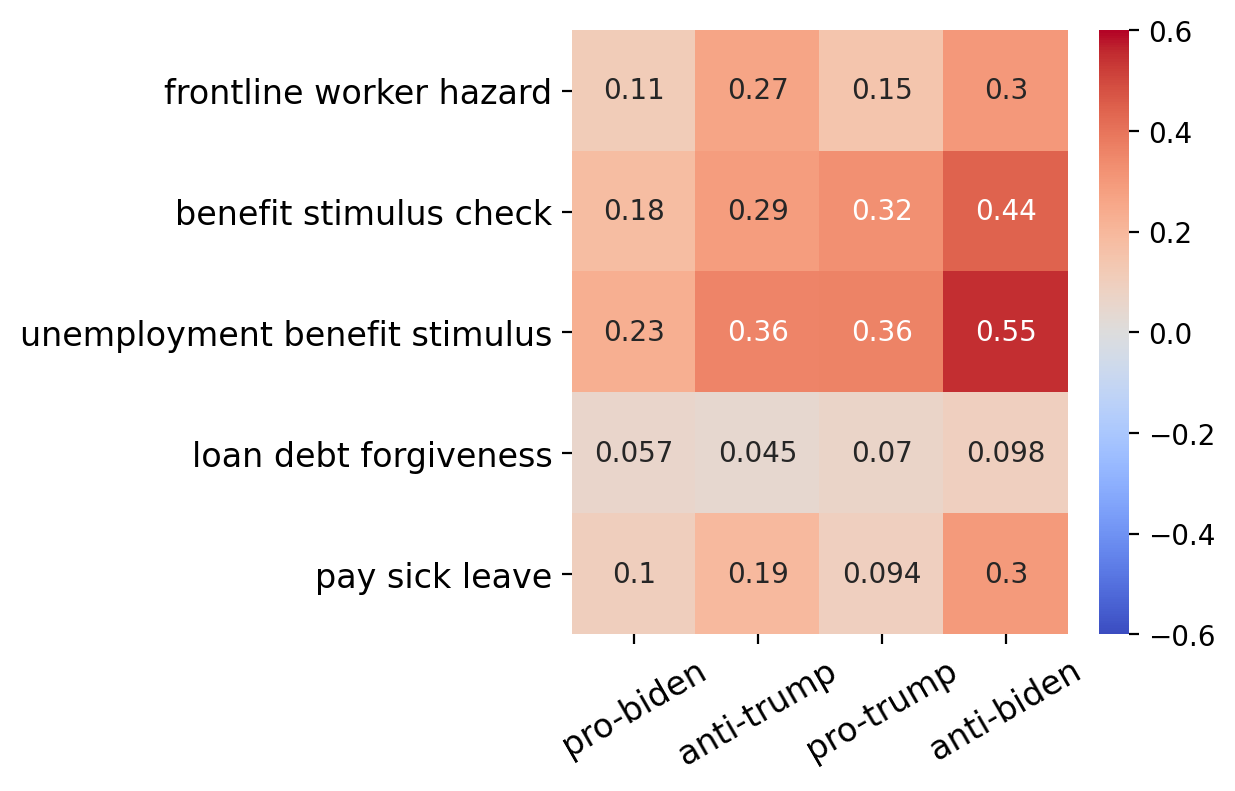
To analyze how do ads talk about an issue based on stances, i.e., pro trump vs. anti-biden ads on immigration e.g., “Trump will build the wall” vs. “Biden is weak on immigration”, we put a condition on meaningful words that characterize an issue. Then, we calculate the correlation between ads and the most frequent trigrams in each categorty (, where = trigrams generated from on issue and = ads related to each stance category on issue). To better understand how each stance represents messaging, we analyze their co-occurrence and convey this information in heatmaps. Each row in the heatmap captures the association strength between issue-specific trigrams (-axis) and all the stances (-axis). The heatmap cell colors represent the percentage of times trigrams appear in the same context. The heatmaps showing the correlation of trigrams and stances on ‘coronavirus’ issue are shown in Fig. 3. It demonstrates how trigrams are correlated to each stance category. Fig. 3(a) shows the top most frequent trigrams from pro-biden ads focusing on the ‘coronavirus’ issue and their Pearson correlation coefficients for each stance category. For example, there is a higher correlation between trigrams that focuses on Biden’s plan for tackling coronavirus by putting effort to develop vaccine, rebuilding country and pro-biden stance. On the other hand, anti-trump ads correlate more with the trigrams focusing on rising covid cases and deaths in Florida and Trump’s ignorance regarding health experts (Fig. 3(b)). Trump’s plan for reopening country is one of the prominent messages of pro-trump ads (Fig. 3(c)). From Fig. 3(d) we notice that anti-biden ads highly correlate with coronavirus stimulus. A more thorough qualitative examination of the content of these ads is left for future work, and instead we focus on their audience reach.
Audience Demographics
In this section, we focus on the audience of these ad campaigns. As Facebook Ads Library provides summary of demographic statistics on ‘impressions’ received by each ad, as a distribution over 3 genders (male, female, unknown) and 7 age groups. This metric describes the views of each ad, which may be different from users exposed to the ad, as the same user may be exposed multiple times. To answer RQ3, we analyze 1) Targeted demographics by the advertisers, 2) Ad impressions by the demographics.
Null Hypothesis, Alternate Hypothesis, T-test statistics P-value More females than males of all ages More females than males from all ages do not watch pro-biden ads. watch pro-biden ads. More females than males of all ages More females than males from all ages do not watch anti-trump ads. watch anti-trump ads. More males than females from age More males than females from age range 18-54 do not view pro-trump ads. range 18-54 view pro-trump ads. More males than females from age More males than females from age range 18-54 do not view anti-biden ads. range 18-54 view anti-biden ads. More females than males from older More females than males from older age (55+) do not watch pro-trump ads. age (55+) watch pro-trump ads. More females than males from older More females than males from older age (55+) do not watch anti-biden ads. age (55+) watch anti-biden ads.
Targeted Demographics
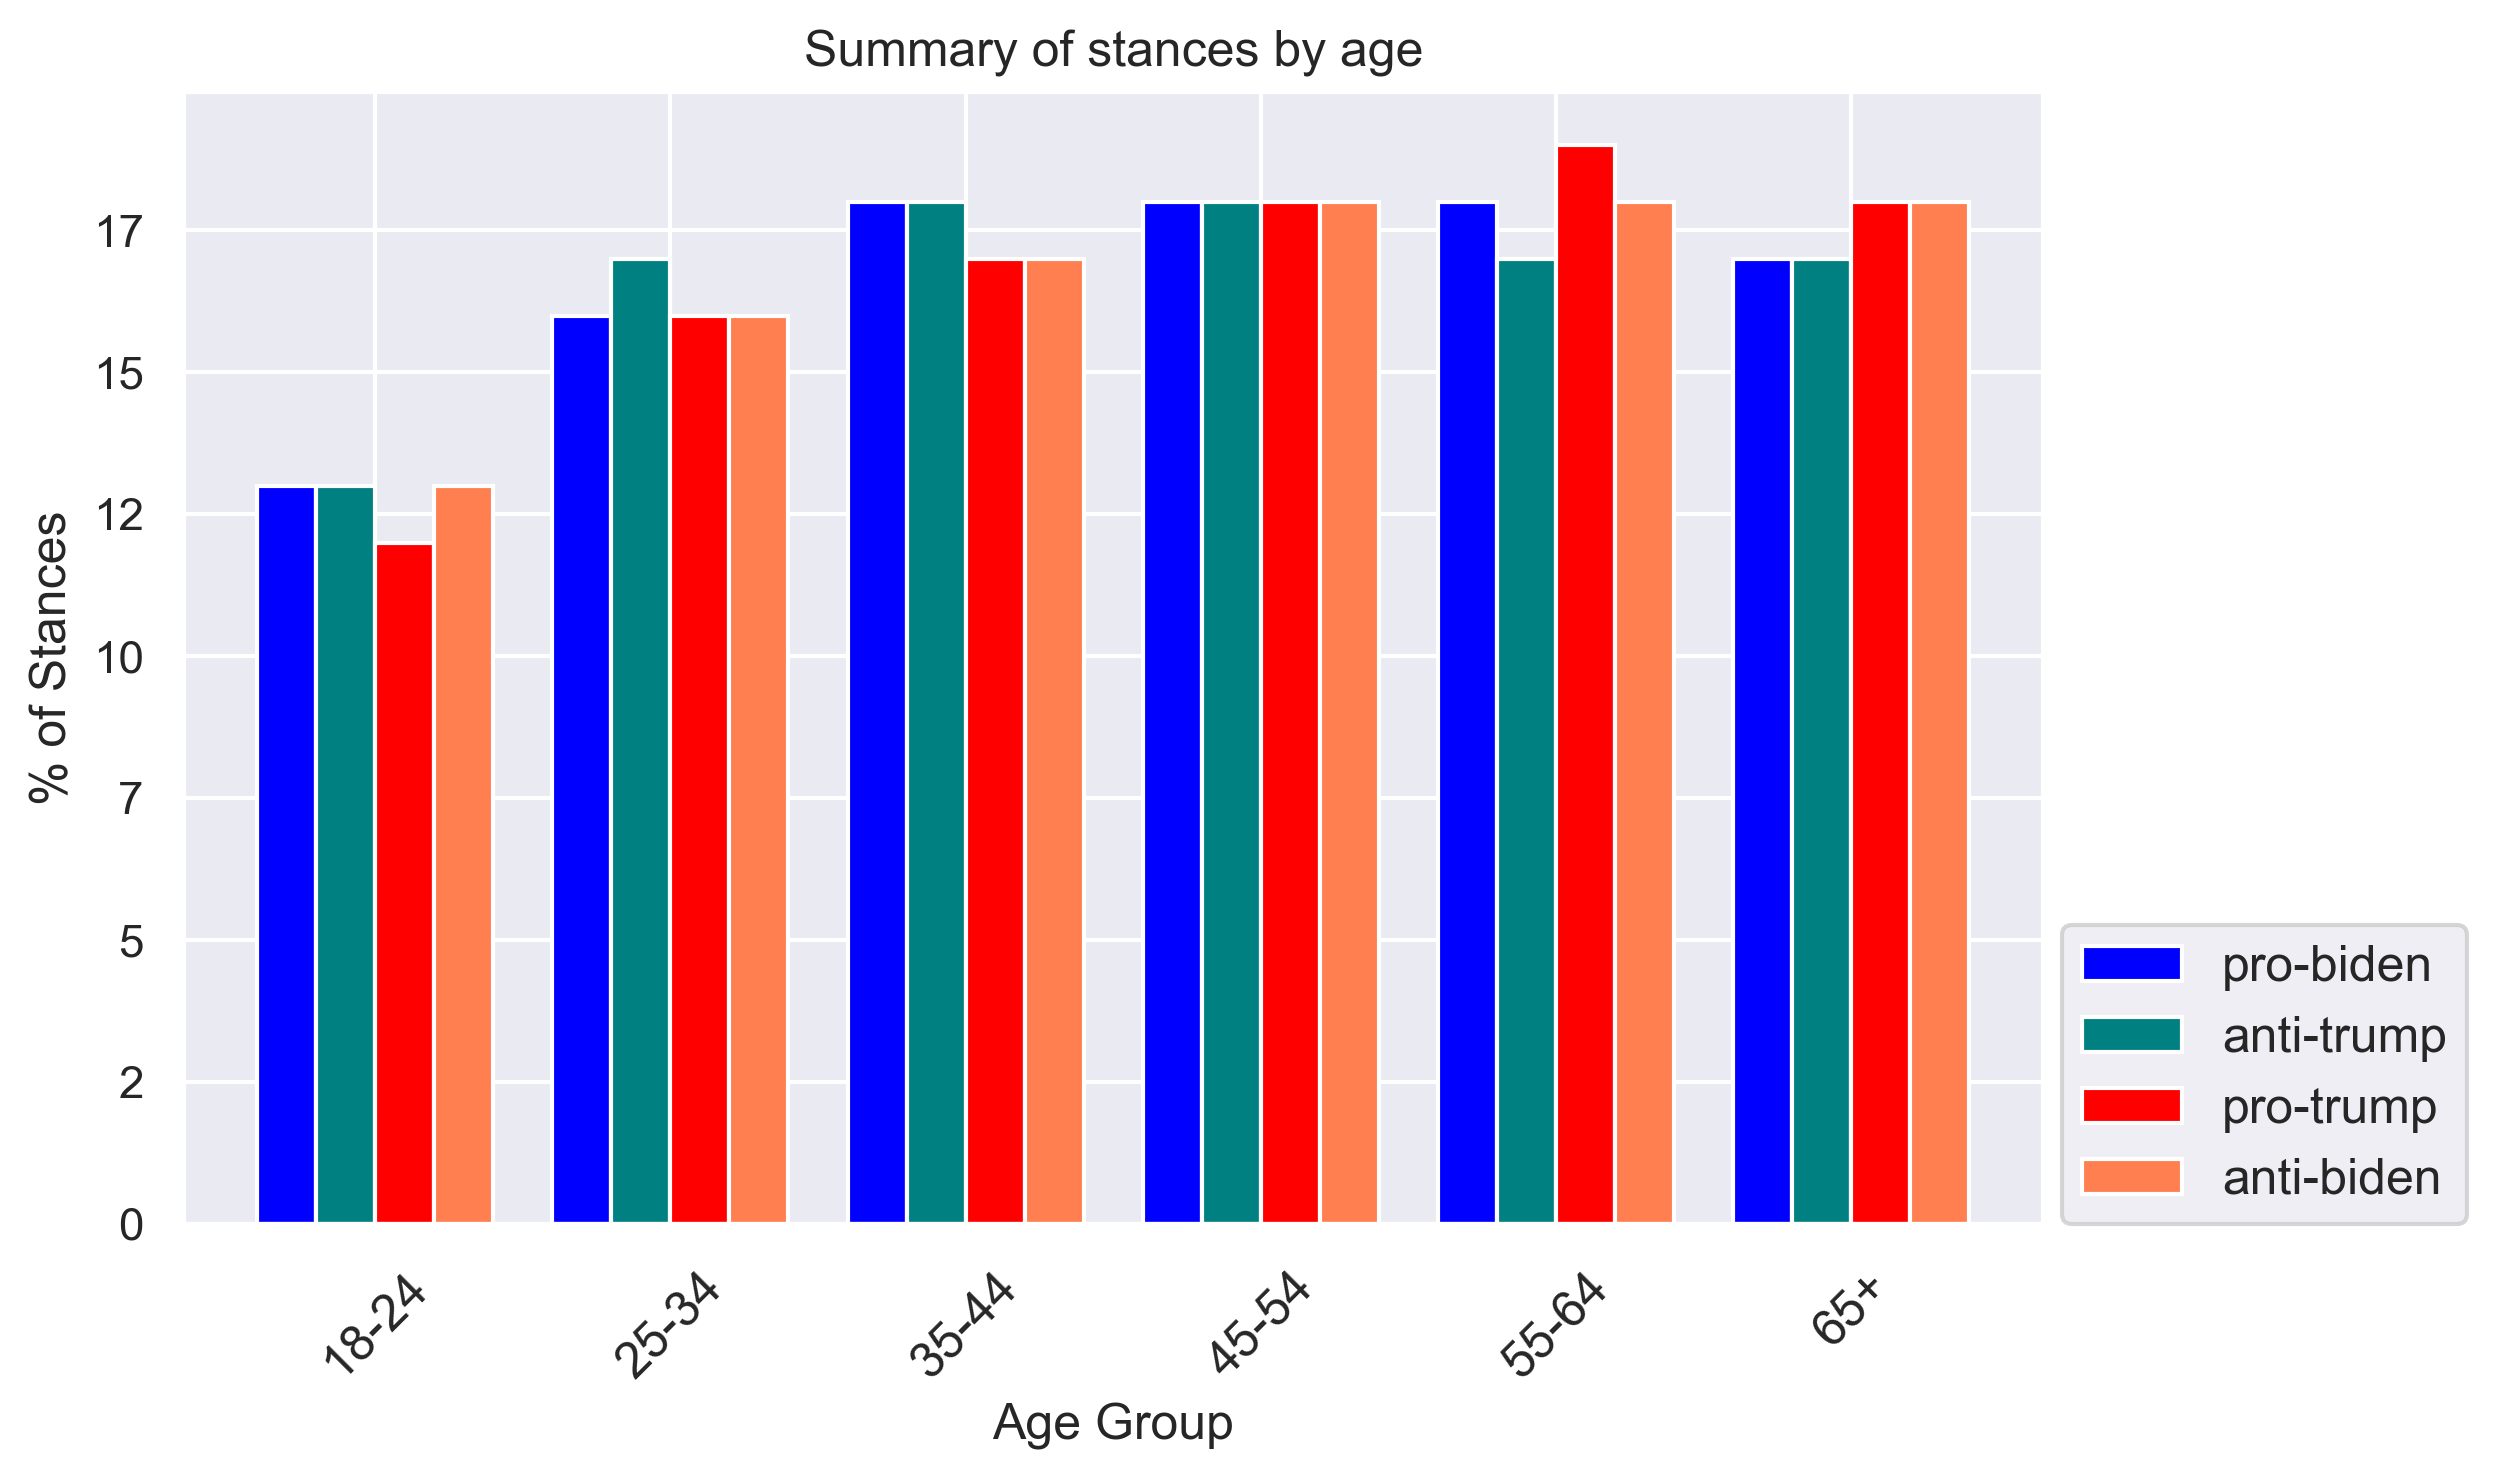
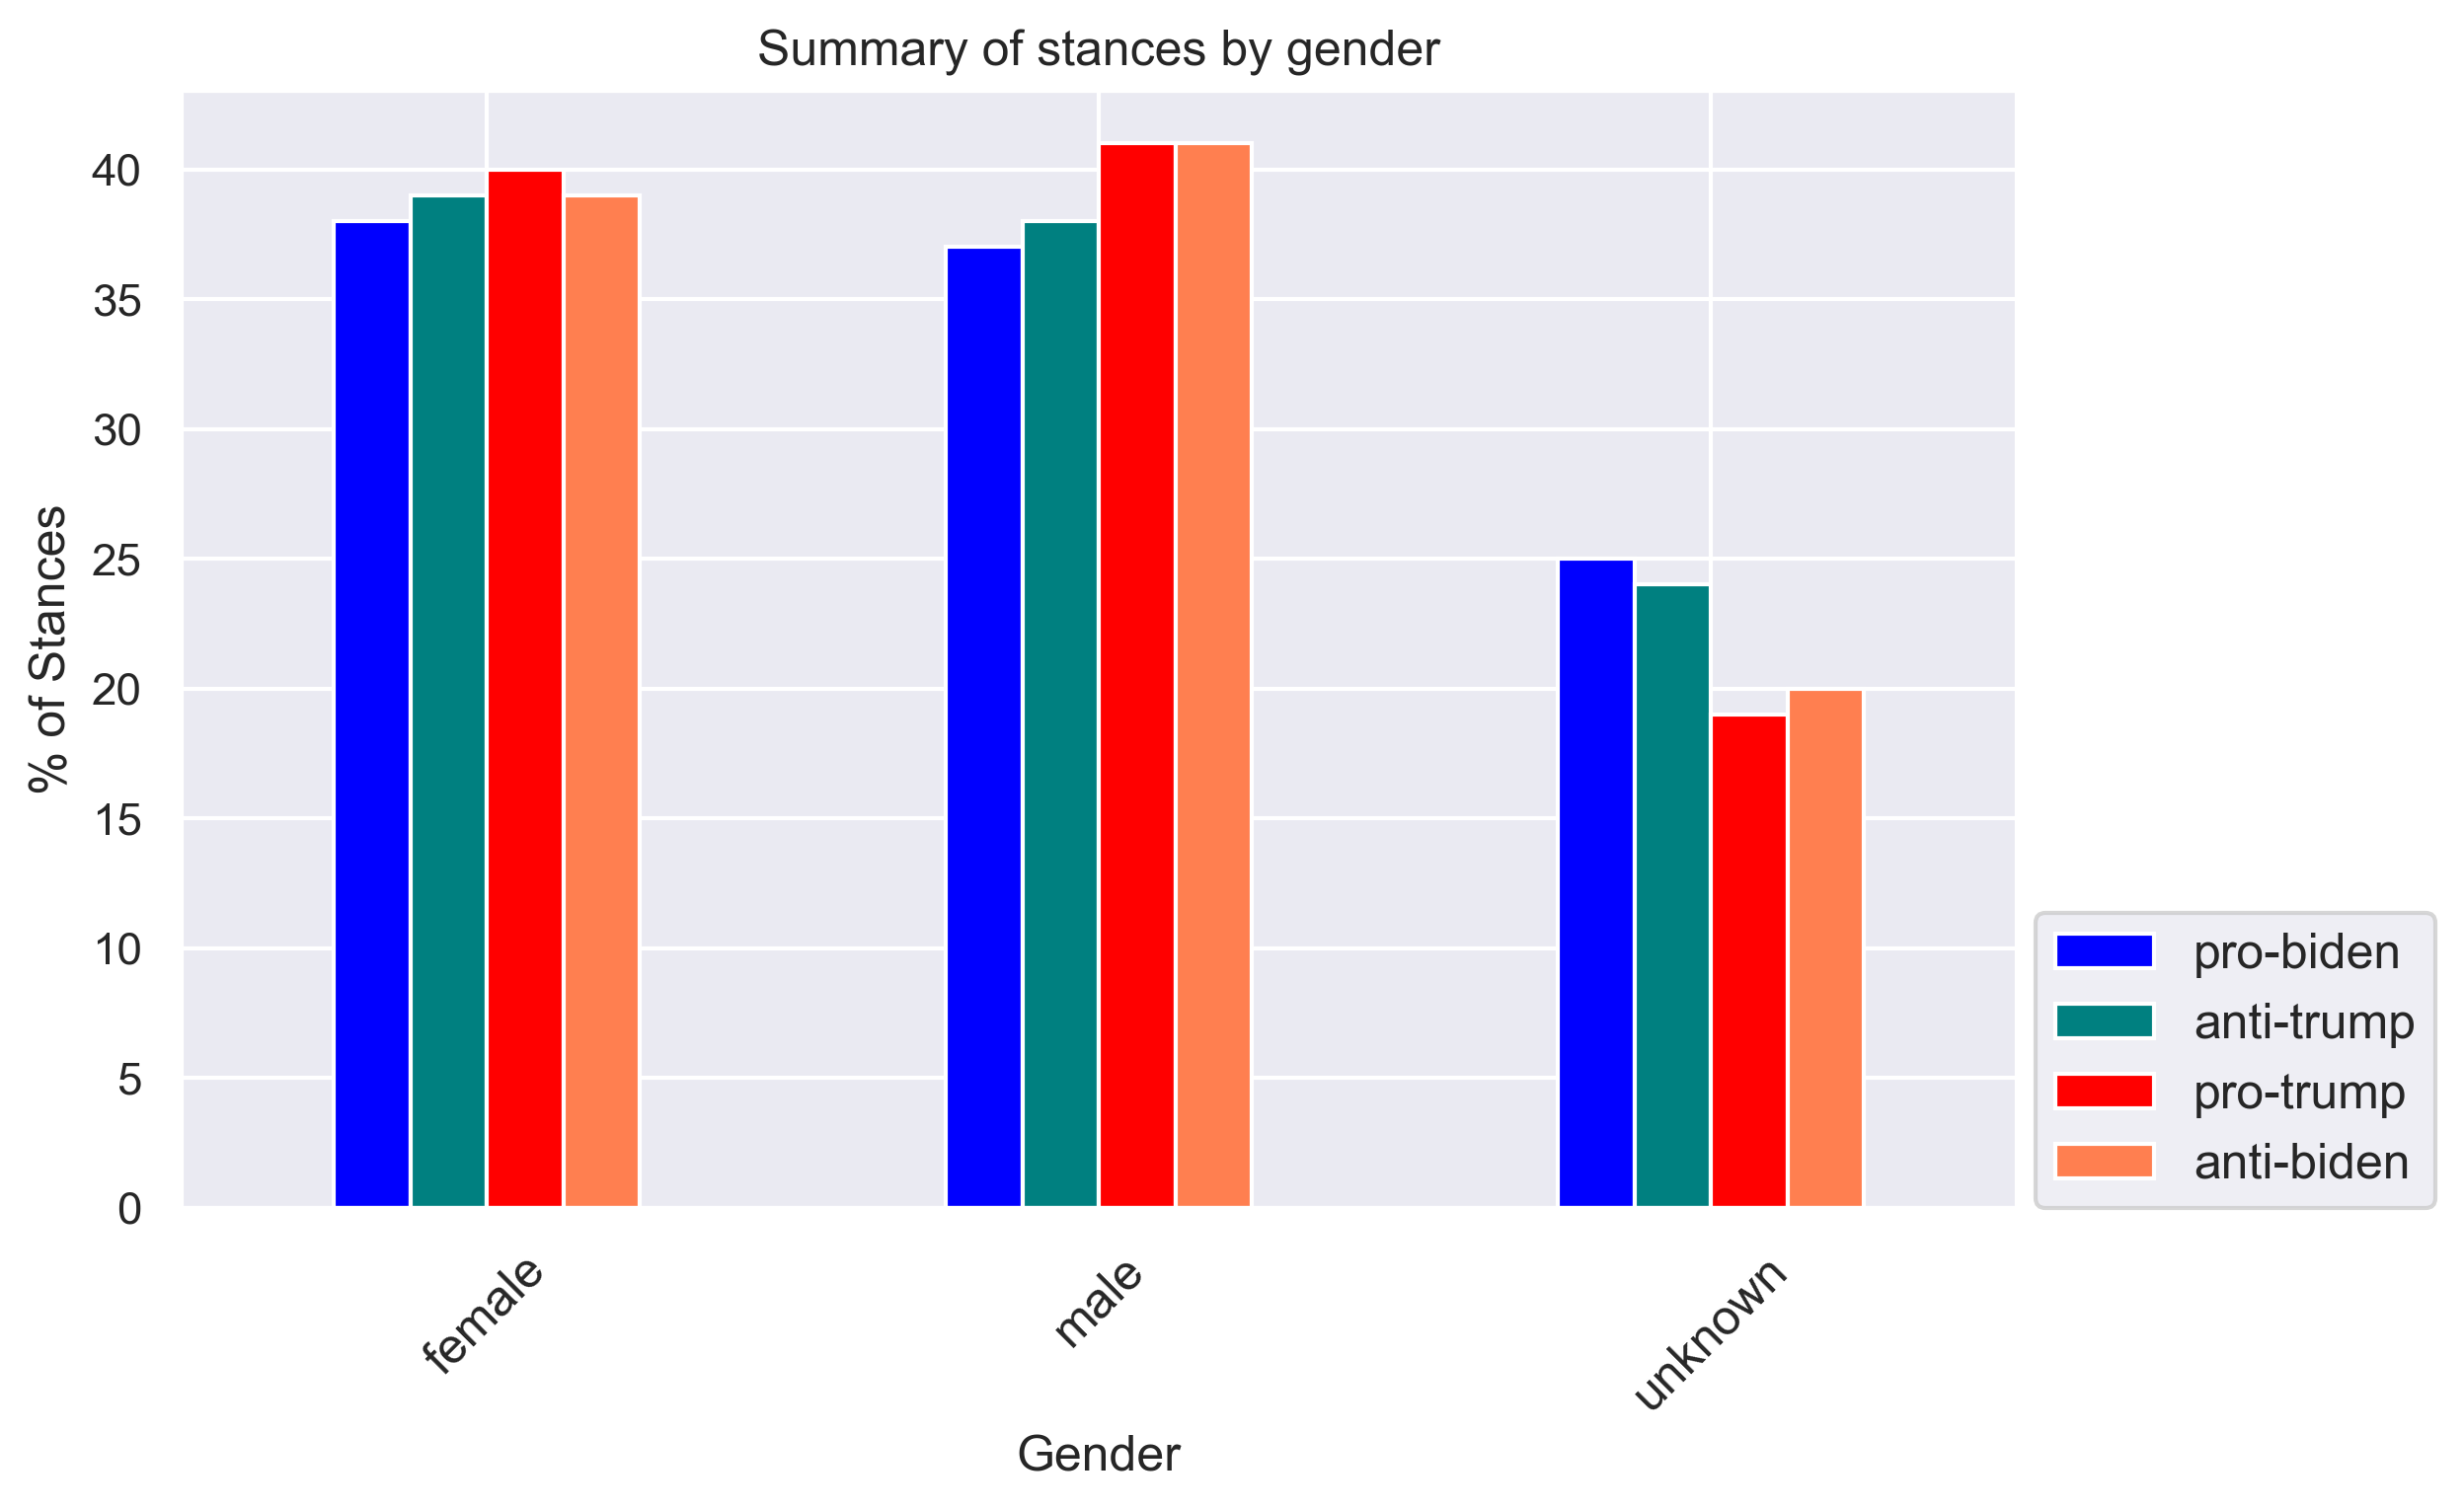
We have pro-biden ads, pro-trump, anti-biden, and anti-trump ads targeting different demographics. To answer the question “Is there any association between audience’s demographics and advertisers’ stances?”, we perform chi-square test of contingency (Cochran 1952). The chi-square test provides a method for testing the association between the row and column variables in a two-way table called contingency table. The null hypothesis assumes that there is no association between the variables, while the alternative hypothesis claims that some association does exist. The chi-square test statistic is computed as . The distribution of the statistic is denoted as , where is the number of degrees of freedom. , where represents the number of rows and represents the number of columns in the contingency table. The p-value for the chi-square test is the probability of observing a value at least as extreme as the test statistic for a chi-square distribution with degrees of freedom. To perform a chi-square test, we take age distribution over stance and gender distribution over stance separately to build contingency tables correspondingly. We choose value of significance level, . The p-value for both cases is , which is statistically significant and we reject the null hypothesis , indicating that there is some association between the audience’s demographics and advertisers’ stances. Fig. 4 shows the comparison of the percentages of stances by age group (age group has been dropped due to no activity) (Fig. 4(a)) and gender (Fig. 4(b)). We notice that the ads with pro-biden and anti-trump stances mostly target the age group , whereas pro-trump ads mainly target age rage and anti-trump ads focus age group. Interestingly age group is equally targeted by ‘’ and ‘’ ads, where (Fig. 4(a)). However, ads with pro-biden and anti-trump stances target the female population mostly, while pro-trump and anti-biden ads target the male population mostly (Fig. 4(b)). We can conclude that funding agencies supporting Biden in election targeting the age group and women and funding agencies supporting Trump in election targeting older people and men are not due to random variation.
Demographic Ad Impression
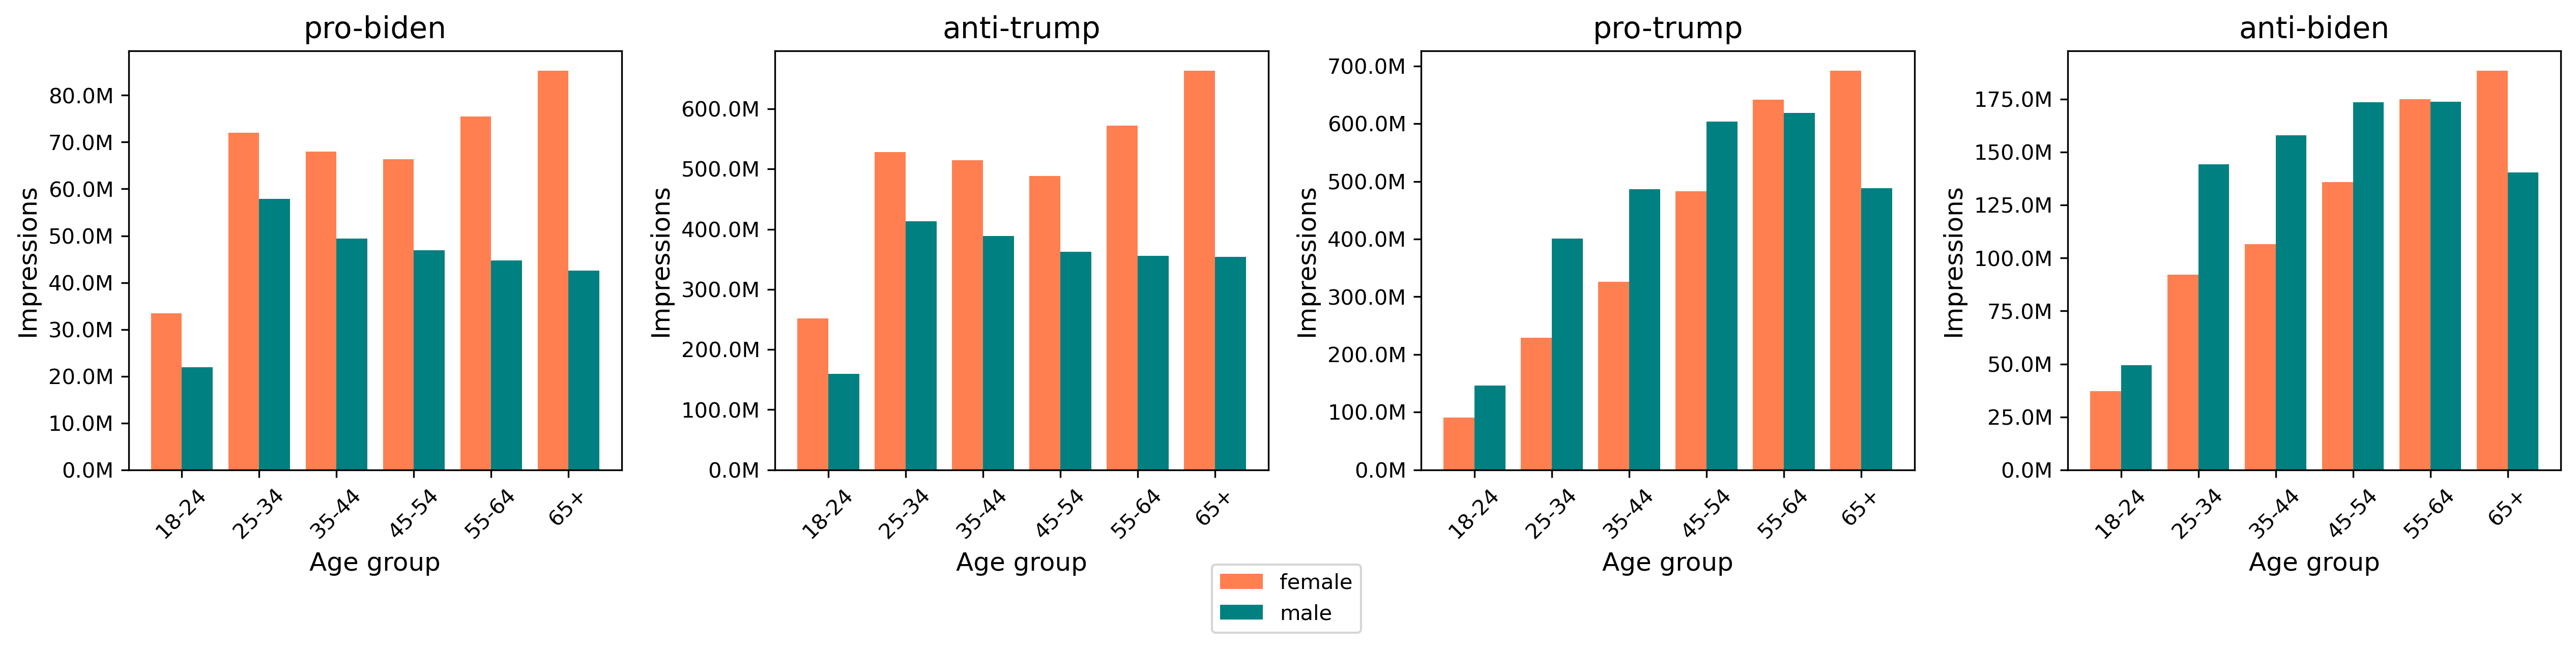
Among the impressions received by the ads we have collected, ads with pro-biden stance has impressions, for pro-trump, anti-biden , anti-trump has impressions. Fig. 5 shows the distribution of impressions over demographics (age group and unknown gender have been dropped because of having almost no activity). Considering all ads, pro-trump advertising has the majority of impressions and it is mostly viewed by younger male than female audiences. Both pro-trump and anti-biden ads have more views from males than females in age range . Fig. 5 shows that more women from all age groups, compared to men from all age groups, watch pro-biden and anti-trump ads. We note that the female audience of ads is even more skewed towards older age than males. We perform t-test (Student 1908) hypothesis testing to provide statistical evidence of our study. Table 5 shows the null hypothesis (), alternate hypothesis (), t-test statistics with p-value for each tested variables. In the t-test, our level of significance, . If , we accept ; otherwise we reject . No statistical significance is found when we test whether more females compared to males from older age watch pro-trump and anti-biden ads as p-value and we accept (last rows of Table 5). Results from top rows in Table 5 show that pro-biden and anti-trump ads are viewed mostly by females than males regardless of age group, whereas more males than females from age group tend to watch pro-trump and anti-biden ads (p-value and reject ).
State-wise Issue and Demographics
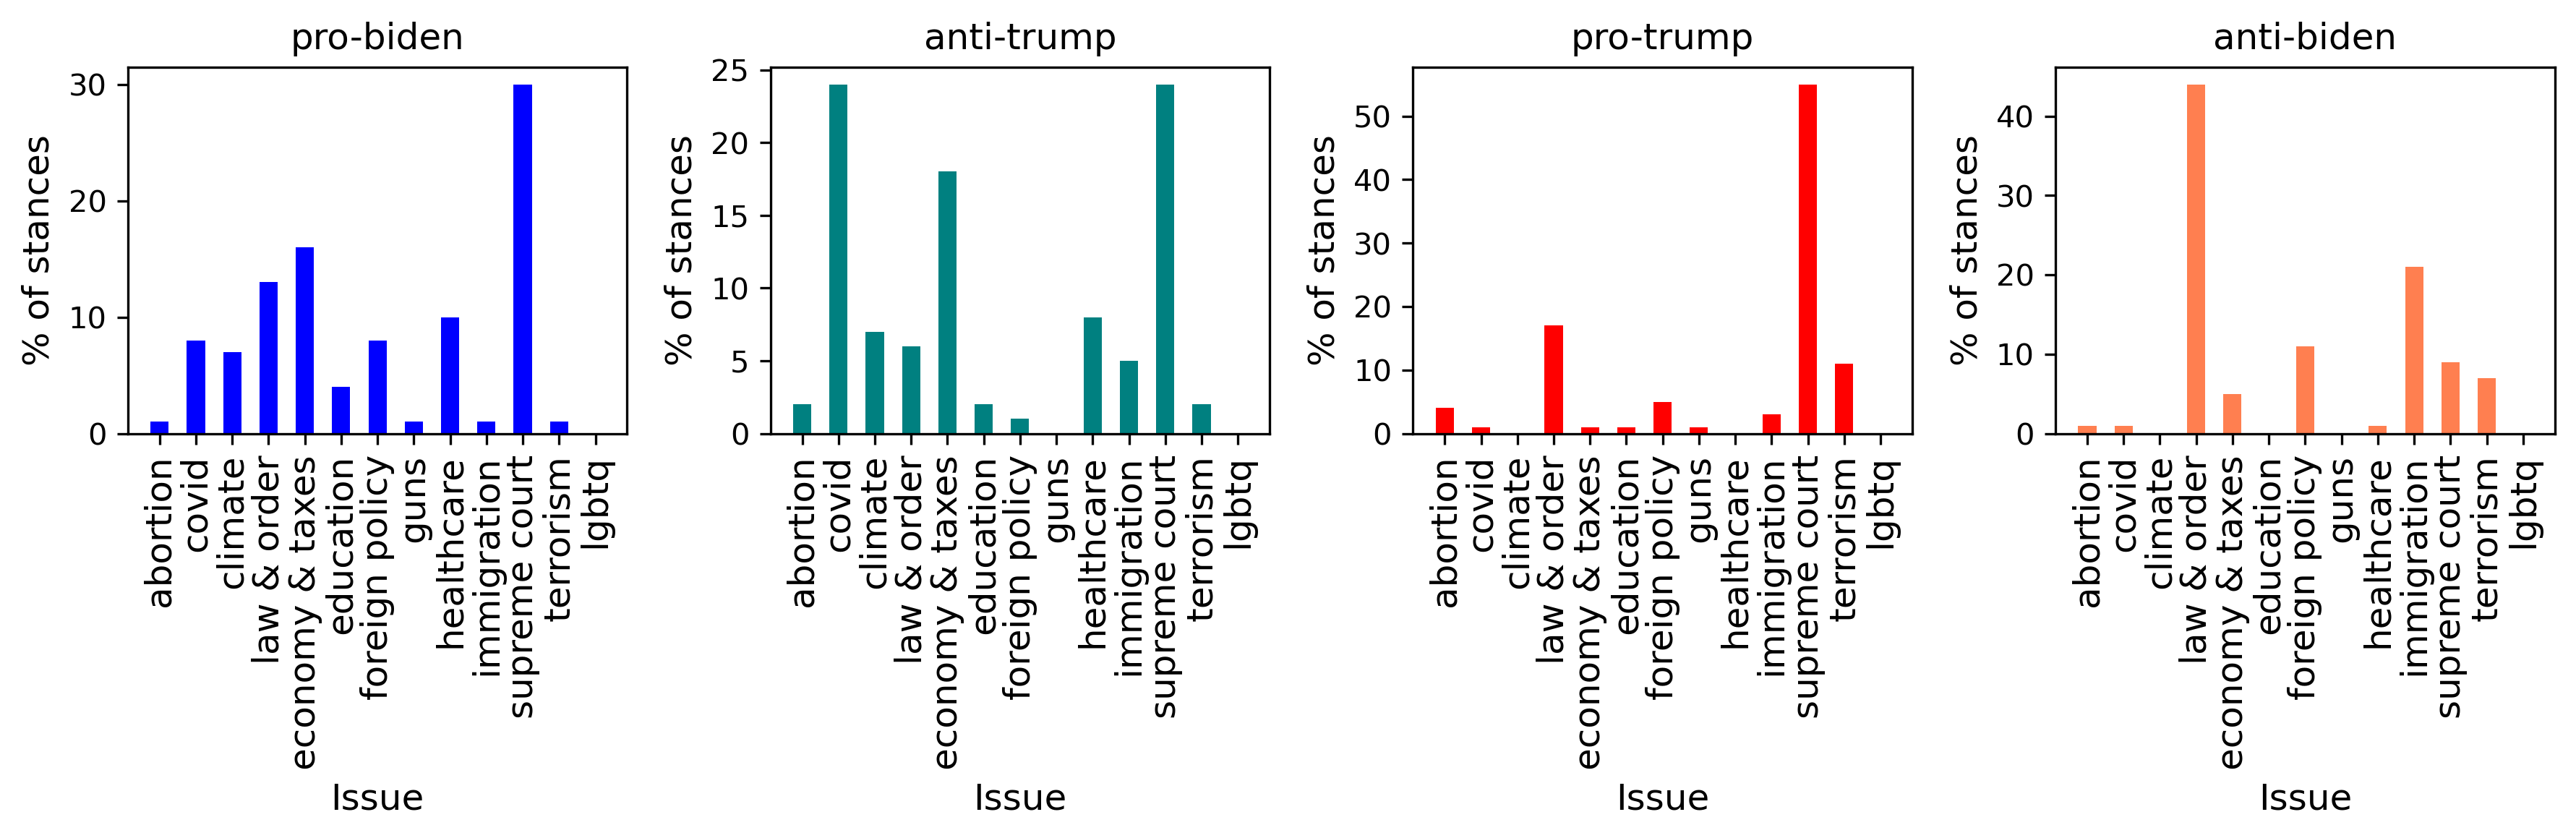
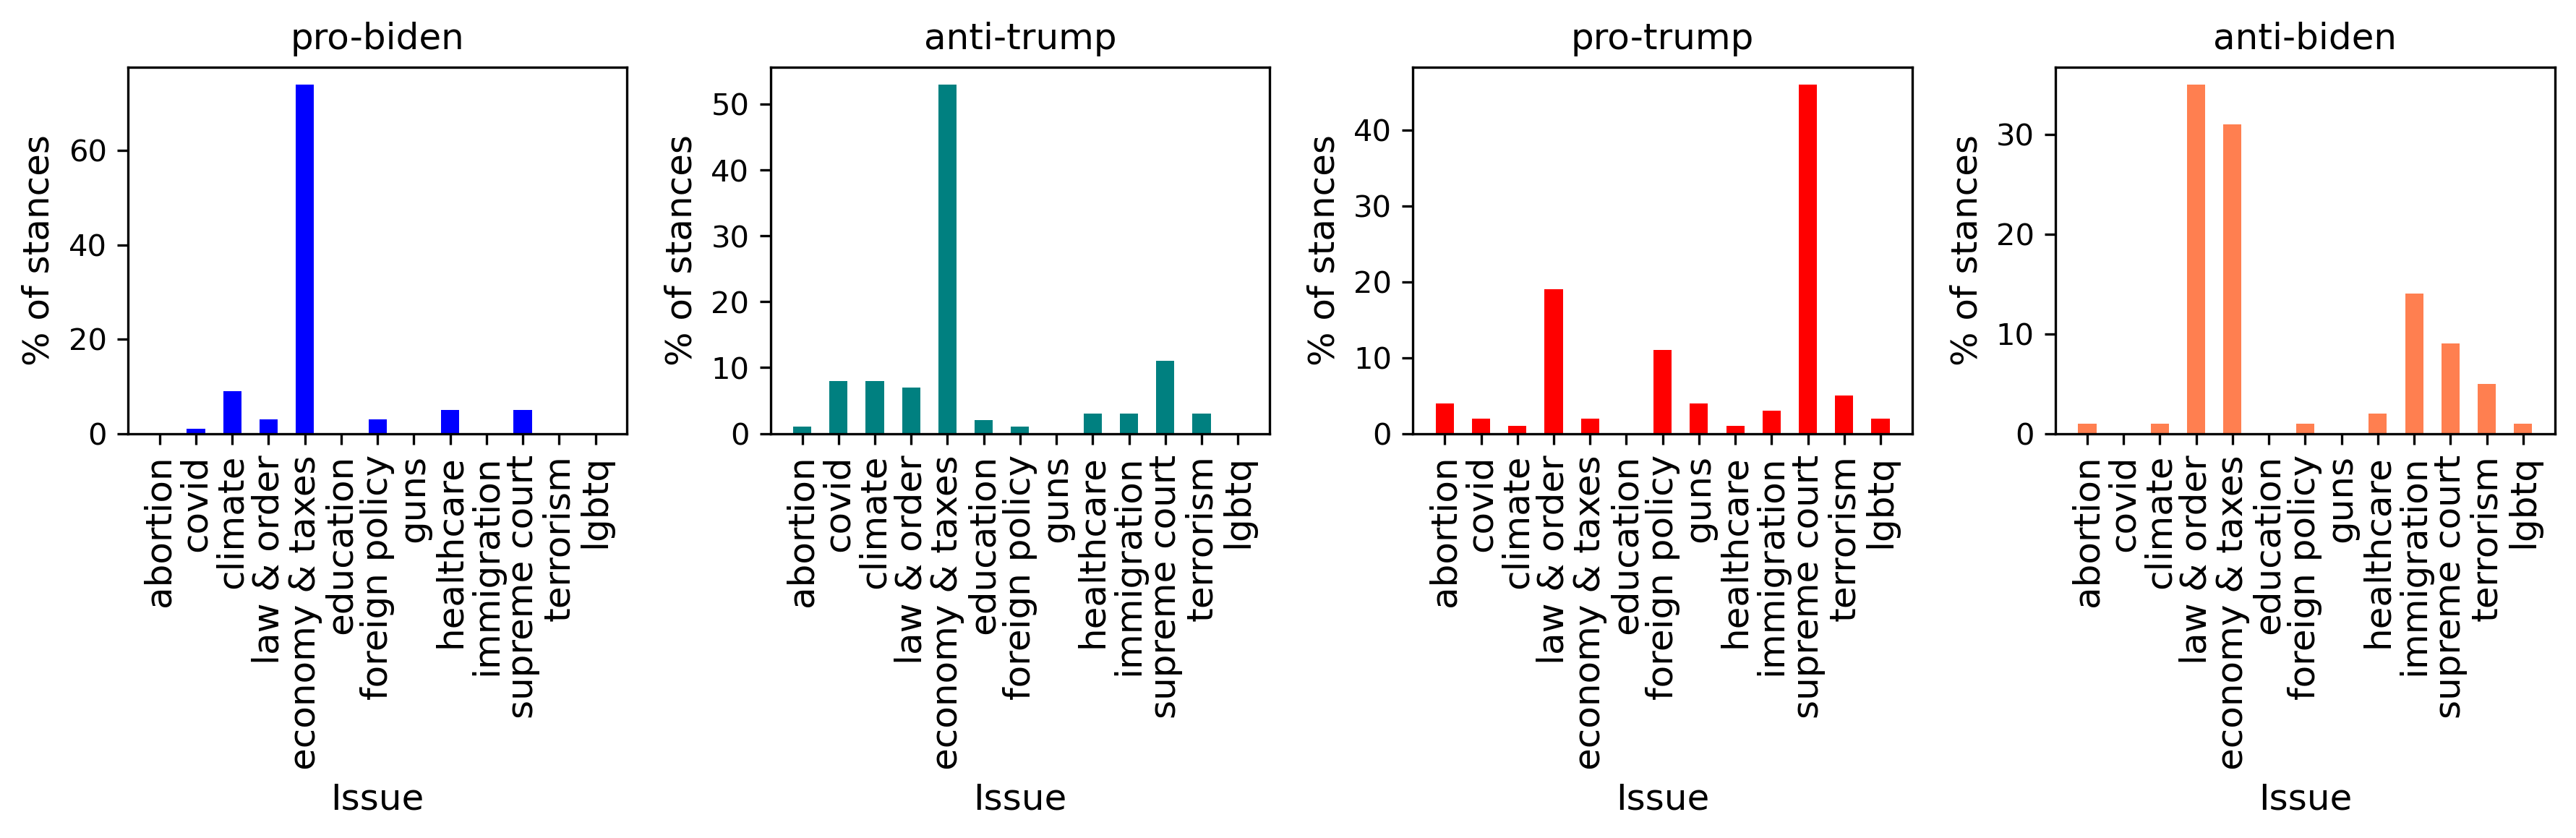
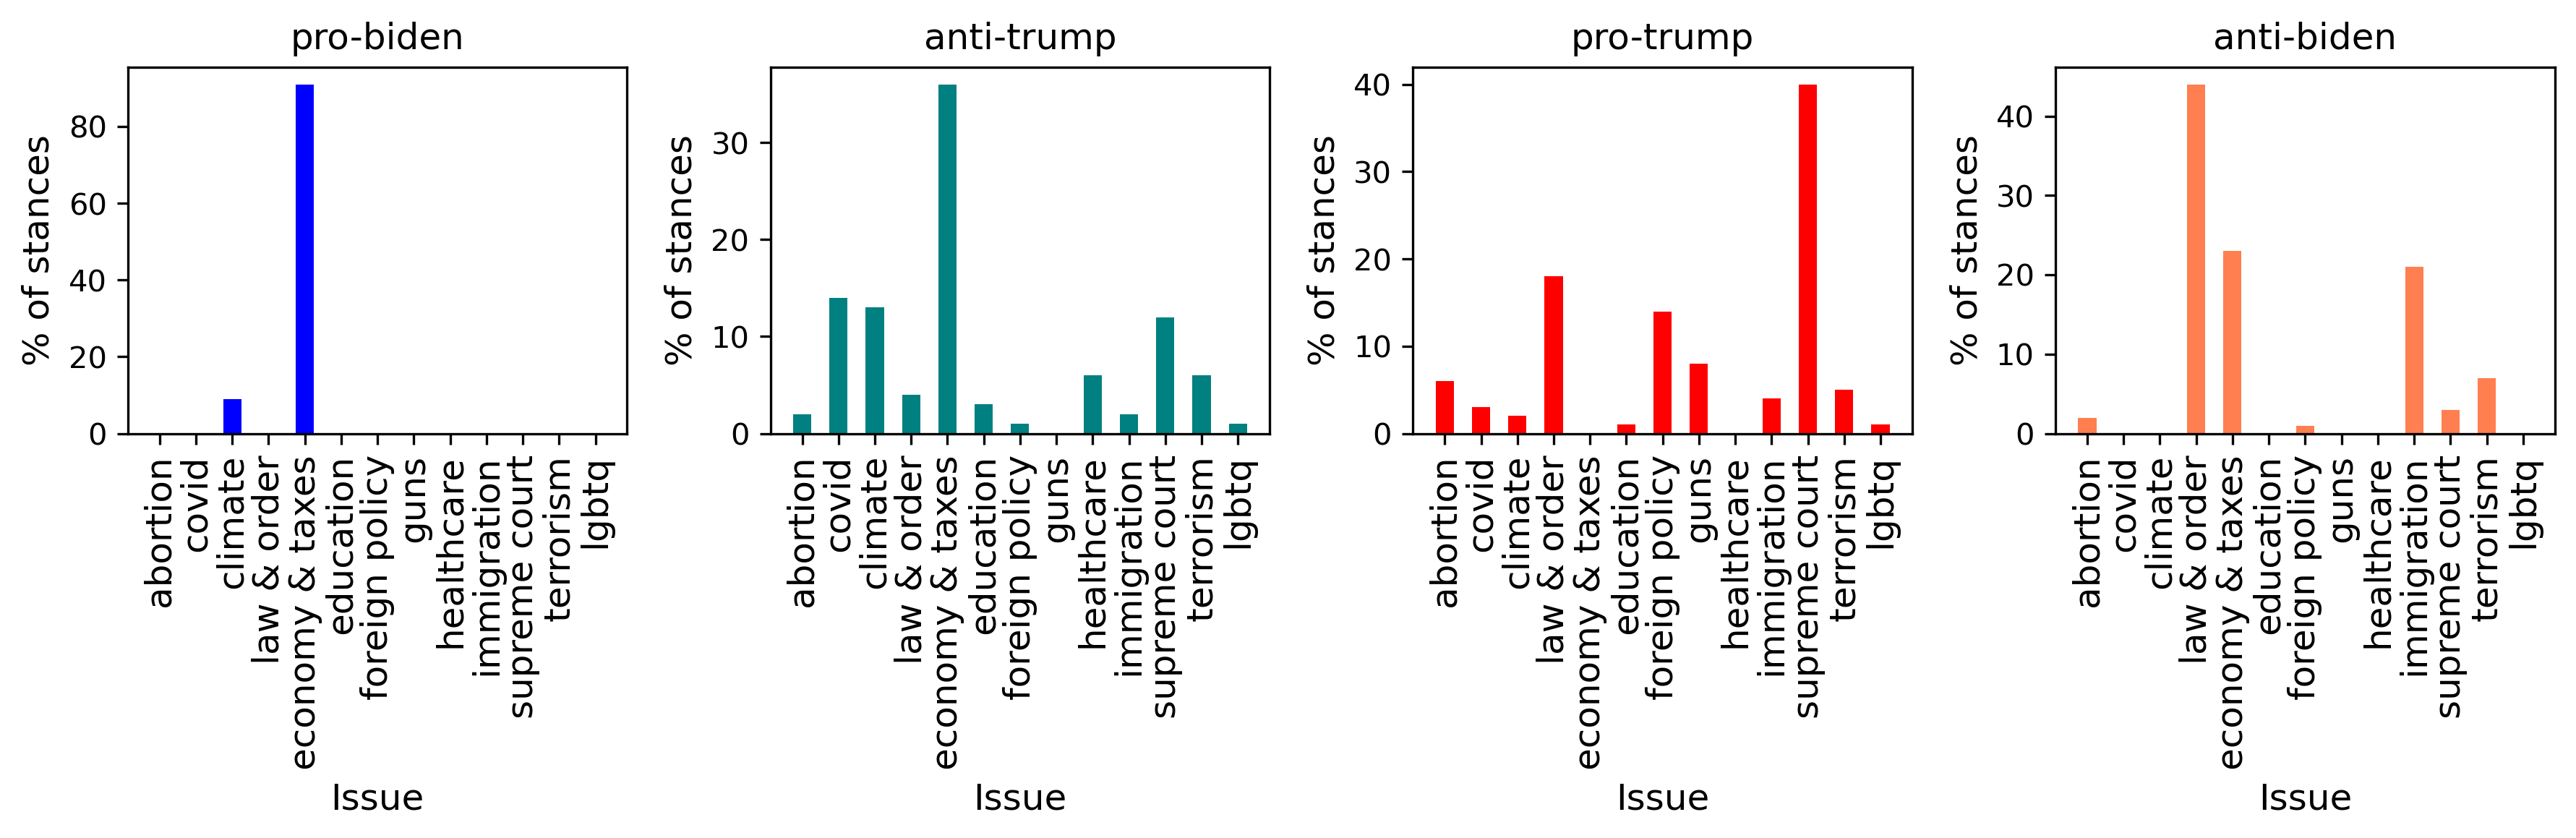
We investigate state-wise issue and demographic distribution over stances to answer RQ4. We use historical voting data666https://www.visualcapitalist.com/u-s-presidential-voting-history-by-state/ to determine red/blue/battleground status of the states. We consider battleground state Pennsylvania ( ads), blue state New York ( ads), and red state Idaho ( ads) to analyze their stances, issues, and corresponding demographics. To narrow down our analysis, we consider ads having regional impressions in these states. We perform chi-square test by taking issue distribution over stance to build contingency tables separately for PA, NY, and ID. We choose the value of significance level, , and our test results show that the p-value for all three states. Therefore, we reject the null hypothesis, indicating some association between advertisers’ issues and stances focusing on the region. Fig. 6(a) shows issue distribution over stances in the swing state PA. In PA, we notice the highest pro-biden stance on ‘supreme court’ issue, and a higher anti-trump issue on ‘covid’ and ‘supreme court’. We show issue distribution with stances in the blue state NY and red state ID in Fig. 6(b) and Fig. 6(c) correspondingly. Issue like ‘economy & taxes’ has more pro-biden and anti-trump stances both in NY and ID (Fig. 6(c)). On the other hand, anti-biden ads mostly focus on ‘law & order’ and ‘economy & taxes’ issues in New York (Fig. 6(b)). It’s noticeable that ‘supreme court’ is the most prominent issue in pro-trump ads in PA, NY, and ID. In addition, anti-biden stances are apparent in ads related to the ‘criminal justice reform, race, law & order’ issue for all three states.
To analyze age and gender distribution with stances based on the three states, we again perform chi-square test by taking age and gender distribution over stance to build contingency tables separately. Our test results show the p-value for age and gender in PA, NY, and ID. Therefore, we reject the null hypothesis, indicating some association between advertisers’ stances and demographics focusing on the region. In PA, pro-biden and anti-trump ads primarily target the younger population (). In contrast, pro-trump and anti-biden ads mainly target the people of in PA. We notice that ads with pro-trump and anti-biden stances target the age group in NY. Interestingly in ID, pro-biden ads are more prominent, and the target age group is . After analyzing gender distribution with stances, we notice that more men than women are targeted by pro-trump and anti-biden ads in all three states. In PA, both females and males are targeted equally by pro-biden and anti-trump ads. More females compared to males are targeted by anti-trump ads in NY. On the other hand, more female populations (60%) than males are targeted by pro-biden ads in Idaho.
Granger Causality with Polls
To start off, toward answering RQ5, we collect poll data of year from https://fivethirtyeight.com/.
We exclude from the analysis the period after November 2020.
We compute two time series:
(1) For poll data, we take the sum of average poll count of each presidential candidate for each day called .
(2) For ads, we calculate the total number of impressions of ‘’ and ‘’ ads, where for a given day, .
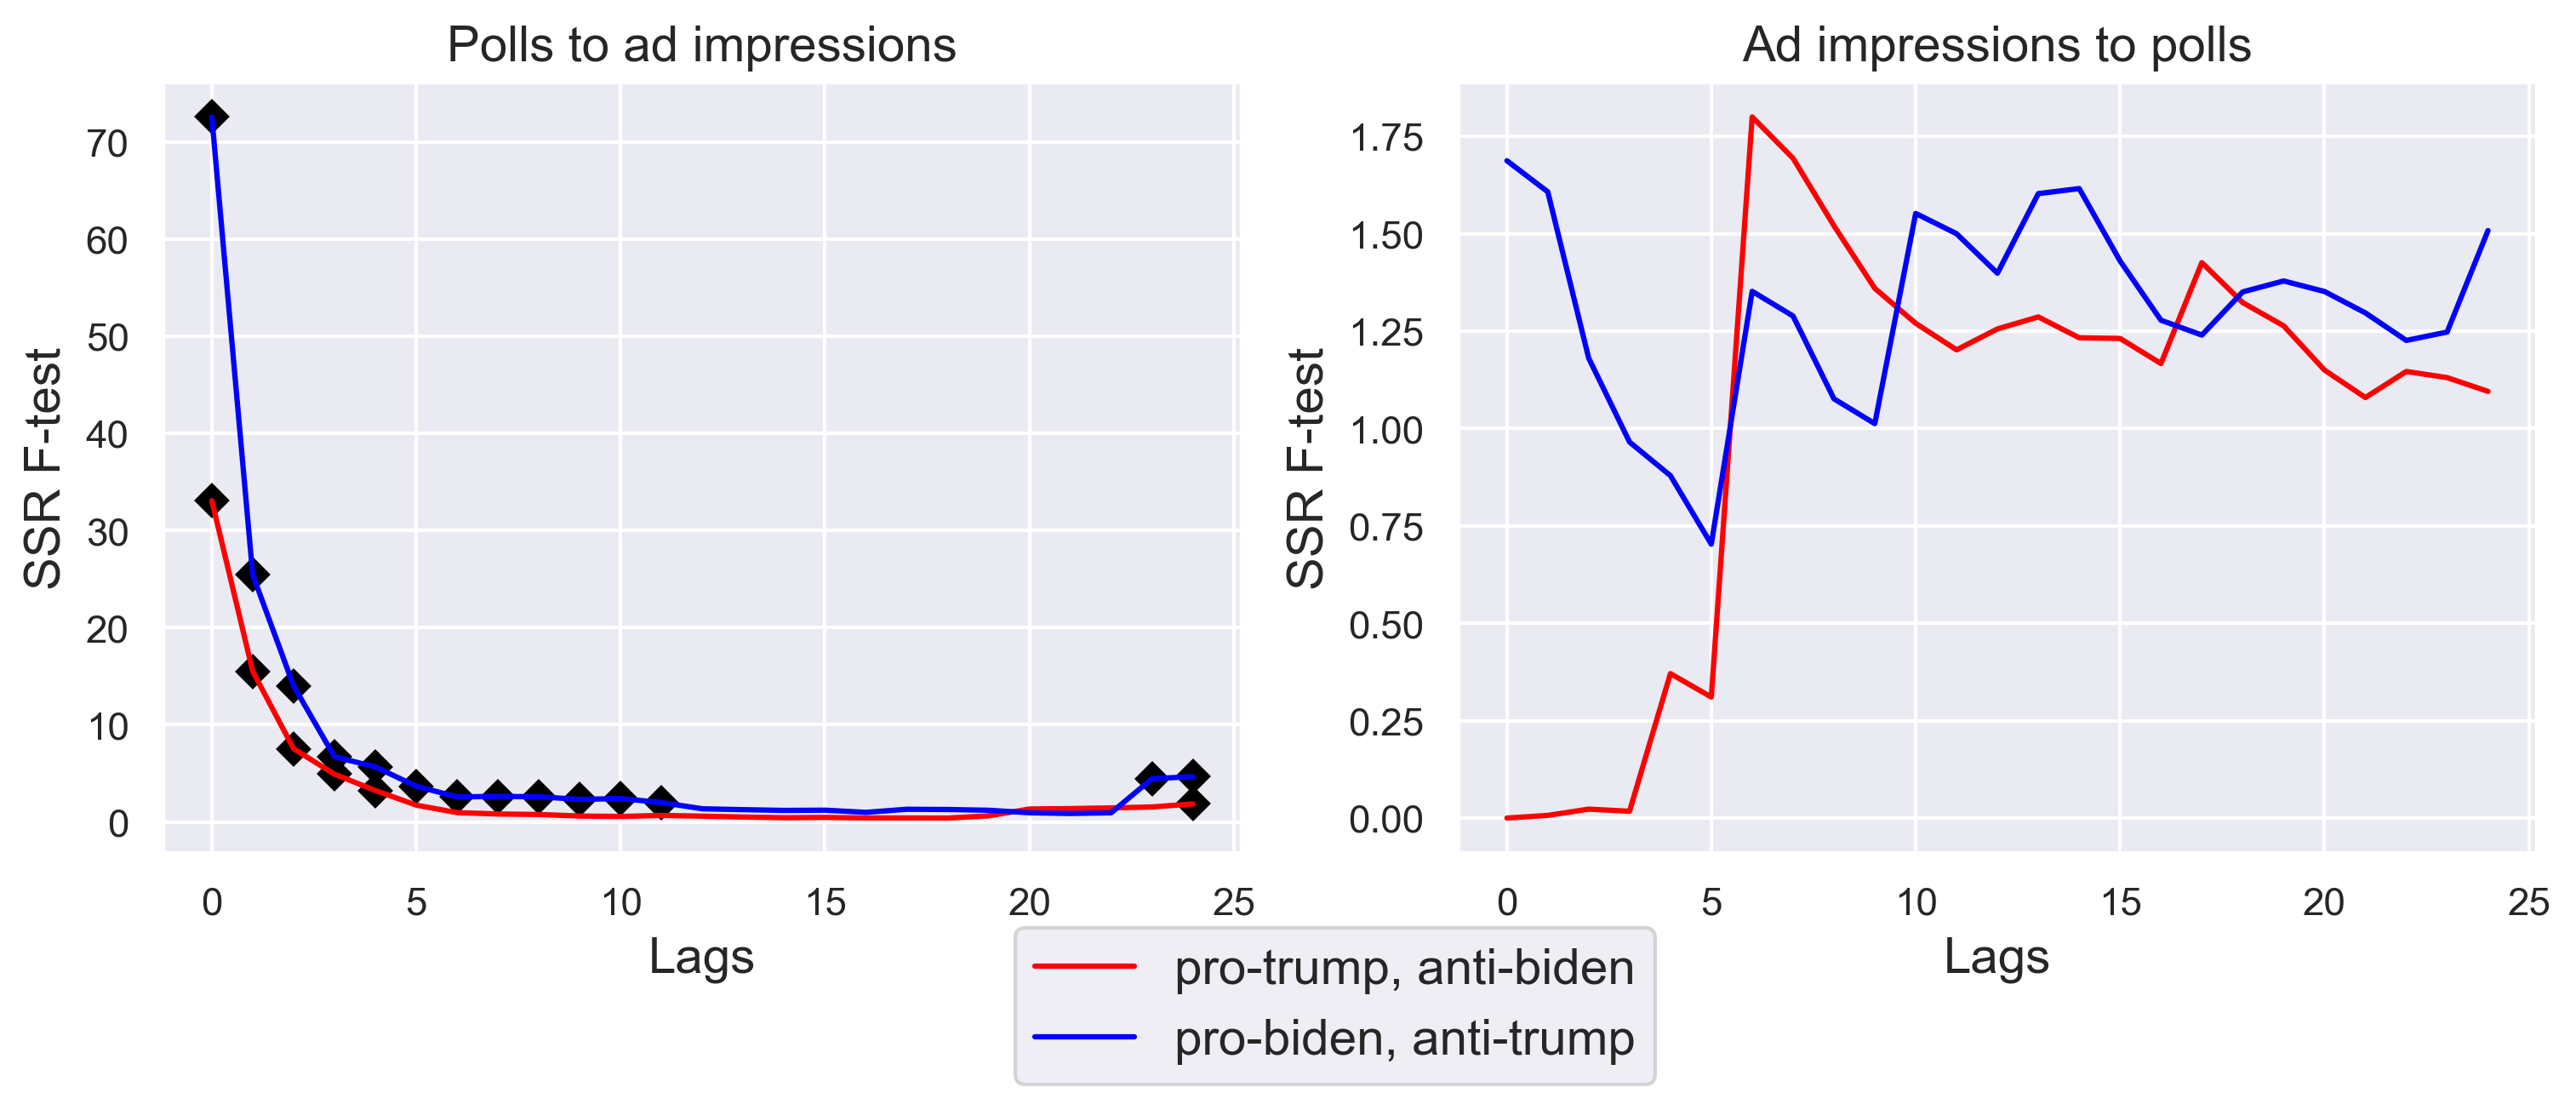
We compute the following two Granger causality tests with these two time series to check (1) Does Granger cause ? (2) Does Granger cause ? The null hypothesis assumed by the first test is that does not Granger cause and the alternative hypothesis is that Granger causes . For the second test, is does not Granger cause and = Granger causes . We reject if p-value is for these tests.
We report results for these two tests in Fig. 7. We notice a significant F-test for the hypothesis of Granger causes for ads with both stances (Left side of Fig. 7). Conversely, we find no significant Granger causality from ad impressions to polls (Right side of Fig. 7). Our finding from this analysis is when polls lean towards one candidate, Facebook ads sponsored by the advertisers supporting that candidate get more attention.
Conclusion
We suggest a weakly supervised approach for analyzing political campaigns on social media, and show the difference in the frequency of positive and negative ads and their main policy issue, as a function of the group targeted. By answering our research questions and providing statistical tests to discern the most significant findings, we inform empirical understandings of how polarized political environments are linked to the underlying funding structure for election ads. Though our approach is tailored for the specific use case, this can be extended to analyze any kind of ads on social media.
Ethical Impact
The data collected in the paper was made publicly available by Facebook Ads API and does not contain any personal information. Any qualitative result that we report is an outcome from a machine learning model that does not represent the authors’ personal views.
Acknowledgements
We are thankful to the anonymous reviewers for their insightful comments. This work was partially supported by Purdue Graduate School Summer Research Grant (to TI) and an NSF CAREER award IIS-2048001.
References
- Andreou et al. (2019) Andreou, A.; et al. 2019. Measuring the Facebook advertising ecosystem. In NDSS.
- Badawy, Ferrara, and Lerman (2018) Badawy, A.; Ferrara, E.; and Lerman, K. 2018. Analyzing the Digital Traces of Political Manipulation: The 2016 Russian Interference Twitter Campaign. In ASONAM.
- Belkin, Niyogi, and Sindhwani (2006) Belkin, M.; Niyogi, P.; and Sindhwani, V. 2006. Manifold regularization: A geometric framework for learning from labeled and unlabeled examples. JMLR.
- Capozzi et al. (2020) Capozzi, A.; et al. 2020. Facebook Ads: Politics of Migration in Italy. In ICSI.
- Capozzi et al. (2021) Capozzi, A.; et al. 2021. Clandestino or Rifugiato? Anti-immigration Facebook Ad Targeting in Italy. In CHI.
- Church and Hanks (1990) Church, K. W.; and Hanks, P. 1990. Word association norms, mutual information, and lexicography. Computational linguistics.
- Cochran (1952) Cochran, W. G. 1952. The 2 test of goodness of fit. The Annals of mathematical statistics.
- Cohen (1960) Cohen, J. 1960. A coefficient of agreement for nominal scales. EPM.
- Devlin et al. (2019) Devlin, J.; et al. 2019. BERT: Pre-training of Deep Bidirectional Transformers for Language Understanding. In HLT-NAACL.
- Durant and Smith (2006) Durant, K. T.; and Smith, M. D. 2006. Predicting the political sentiment of web log posts using supervised machine learning techniques coupled with feature selection. In KDWEB.
- Ferrara et al. (2020) Ferrara, E.; et al. 2020. Characterizing social media manipulation in the 2020 US presidential election. First Monday.
- Field, Kliger et al. (2018) Field, A.; Kliger, D.; et al. 2018. Framing and Agenda-setting in Russian News: a Computational Analysis of Intricate Political Strategies. In EMNLP.
- Field and Tsvetkov (2019) Field, A.; and Tsvetkov, Y. 2019. Entity-Centric Contextual Affective Analysis. In ACL.
- Giorgi et al. (2020) Giorgi, J. M.; et al. 2020. Declutr: Deep contrastive learning for unsupervised textual representations. arXiv:2006.03659.
- Granger (1988) Granger, C. W. 1988. Some recent development in a concept of causality. Journal of econometrics.
- Greene and Resnik (2009) Greene, S.; and Resnik, P. 2009. More than words: Syntactic packaging and implicit sentiment. In HLT-NAACL.
- Grover and Leskovec (2016) Grover, A.; and Leskovec, J. 2016. node2vec: Scalable Feature Learning for Networks. In KDD.
- Han and Shen (2016) Han, Y.; and Shen, Y. 2016. Partially Supervised Graph Embedding for Positive Unlabelled Feature Selection. In IJCAI.
- Hersh (2015) Hersh, E. D. 2015. Hacking the electorate: How campaigns perceive voters. Cambridge University Press.
- Hisano (2018) Hisano, R. 2018. Semi-supervised graph embedding approach to dynamic link prediction. In CompleNet.
- Hochreiter and Schmidhuber (1997) Hochreiter, S.; and Schmidhuber, J. 1997. Long short-term memory. Neural computation.
- Islam and Goldwasser (2022a) Islam, T.; and Goldwasser, D. 2022a. Twitter User Representation Using Weakly Supervised Graph Embedding. In ICWSM.
- Islam and Goldwasser (2022b) Islam, T.; and Goldwasser, D. 2022b. Understanding COVID-19 Vaccine Campaign on Facebook using Minimal Supervision. In IEEE Big Data.
- Iyyer et al. (2014) Iyyer, M.; et al. 2014. Political ideology detection using recursive neural networks. In ACL.
- Jensen (2017) Jensen, M. J. 2017. Social media and political campaigning: Changing terms of engagement? IJPP.
- Johnson and Goldwasser (2016) Johnson, K.; and Goldwasser, D. 2016. “All I know about politics is what I read in Twitter”: Weakly Supervised Models for Extracting Politicians’ Stances From Twitter. In COLING.
- Kingma and Ba (2014) Kingma, D.; and Ba, J. 2014. Adam: A method for stochastic optimization. arXiv:1412.6980.
- Klebanov, Beigman, and Diermeier (2010) Klebanov, B. B.; Beigman, E.; and Diermeier, D. 2010. Vocabulary choice as an indicator of perspective. In ACL.
- Kushin and Yamamoto (2010) Kushin, M. J.; and Yamamoto, M. 2010. Did social media really matter? College students’ use of online media and political decision making in the 2008 election. MCS.
- Lin et al. (2006) Lin, W.; et al. 2006. Which side are you on?: identifying perspectives at the document and sentence levels. In CoNLL.
- Loshchilov and Hutter (2018) Loshchilov, I.; and Hutter, F. 2018. Decoupled Weight Decay Regularization. In ICLR.
- Marozzo and Bessi (2018) Marozzo, F.; and Bessi, A. 2018. Analyzing polarization of social media users and news sites during political campaigns. SNAM.
- Meng et al. (2012) Meng, X.; et al. 2012. Entity-centric topic-oriented opinion summarization in twitter. In ACM SIGKDD.
- Mitchell et al. (2013) Mitchell, M.; et al. 2013. Open domain targeted sentiment. In EMNLP.
- Mohammad et al. (2016) Mohammad, S.; et al. 2016. Semeval-2016 task 6: Detecting stance in tweets. In SemEval.
- Pearson (1895) Pearson, K. 1895. Notes on Regression and Inheritance in the Case of Two Parents Proceedings of the Royal Society of London, 58, 240-242.
- Pennington, Socher, and Manning (2014) Pennington, J.; Socher, R.; and Manning, C. 2014. Glove: Global vectors for word representation. In EMNLP.
- Perozzi, Al-Rfou, and Skiena (2014) Perozzi, B.; Al-Rfou, R.; and Skiena, S. 2014. Deepwalk: Online learning of social representations. In KDD.
- Ratkiewicz et al. (2011) Ratkiewicz, J.; et al. 2011. Detecting and tracking political abuse in social media. In ICWSM.
- Recasens et al. (2013) Recasens, M.; et al. 2013. Linguistic models for analyzing and detecting biased language. In ACL.
- Reimers and Gurevych (2019) Reimers, N.; and Gurevych, I. 2019. Sentence-bert: Sentence embeddings using siamese bert-networks. arXiv:1908.10084.
- Ribeiro et al. (2019) Ribeiro, F. N.; et al. 2019. On microtargeting socially divisive ads: A case study of russia-linked ad campaigns on facebook. In ACM FAccT.
- Roy and Goldwasser (2020) Roy, S.; and Goldwasser, D. 2020. Weakly Supervised Learning of Nuanced Frames for Analyzing Polarization in News Media. In EMNLP.
- Schuster and Paliwal (1997) Schuster, M.; and Paliwal, K. K. 1997. Bidirectional recurrent neural networks. IEEE transactions on Signal Processing.
- Serrano et al. (2020) Serrano, J. C. M.; et al. 2020. The Political Dashboard: A Tool for Online Political Transparency. In ICWSM.
- Sharma, Ferrara, and Liu (2021) Sharma, K.; Ferrara, E.; and Liu, Y. 2021. Characterizing Online Engagement with Disinformation and Conspiracies in the 2020 US Presidential Election. arXiv:2107.08319.
- Silva et al. (2020a) Silva, M.; et al. 2020a. Facebook ad engagement in the russian active measures campaign of 2016. arXiv:2012.11690.
- Silva et al. (2020b) Silva, M.; et al. 2020b. Facebook Ads Monitor: An Independent Auditing System for Political Ads on Facebook. In WWW.
- Sindhwani and Melville (2008) Sindhwani, V.; and Melville, P. 2008. Document-word co-regularization for semi-supervised sentiment analysis. In IEEE ICDM.
- Stieglitz and Dang-Xuan (2013) Stieglitz, S.; and Dang-Xuan, L. 2013. Social media and political communication: a social media analytics framework. SNAM.
- Student (1908) Student. 1908. Probable error of a correlation coefficient. Biometrika.
- Subramanya and Bilmes (2008) Subramanya, A.; and Bilmes, J. 2008. Soft-supervised learning for text classification. In EMNLP.
- Talukdar et al. (2008) Talukdar, P.; et al. 2008. Weakly-supervised acquisition of labeled class instances using graph random walks. In EMNLP.
- Tang, Qu, and Mei (2015) Tang, J.; Qu, M.; and Mei, Q. 2015. PTE: Predictive Text Embedding Through Large-scale Heterogeneous Text Networks. In KDD.
- Tang et al. (2015) Tang, J.; et al. 2015. Line: Large-scale information network embedding. In WWW.
- Wattal et al. (2010) Wattal, S.; et al. 2010. Web 2.0 and politics: the 2008 US presidential election and an e-politics research agenda. MIS quarterly.
- Wu et al. (2020) Wu, Z.; et al. 2020. Clear: Contrastive learning for sentence representation. arXiv:2012.15466.
- Yang, Cohen, and Salakhudinov (2016) Yang, Z.; Cohen, W.; and Salakhudinov, R. 2016. Revisiting semi-supervised learning with graph embeddings. In ICML.
- Zhang et al. (2020) Zhang, Y.; et al. 2020. Minimally supervised categorization of text with metadata. In ACM SIGIR.
- Zhu and Ghahramani (2002) Zhu, X.; and Ghahramani, Z. 2002. Learning from Labeled and Unlabeled Data with Label Propagation. Technical report.