Self-supervised Graph Masking Pre-training for Graph-to-Text Generation
Abstract
Large-scale pre-trained language models (PLMs) have advanced Graph-to-Text (G2T) generation by processing the linearised version of a graph. However, the linearisation is known to ignore the structural information. Additionally, PLMs are typically pre-trained on free text which introduces domain mismatch between pre-training and downstream G2T generation tasks. To address these shortcomings, we propose graph masking pre-training strategies that neither require supervision signals nor adjust the architecture of the underlying pre-trained encoder-decoder model. When used with a pre-trained T5, our approach achieves new state-of-the-art results on WebNLG+2020 and EventNarrative G2T generation datasets. Our method also shows to be very effective in the low-resource setting.111Our code is available at https://github.com/Jiuzhouh/Graph-Masking-Pre-training.
1 Introduction
Graph-to-Text (G2T) generation (Gatt and Krahmer, 2018) is the task of generating natural language from graph-structured data. While there are several tasks that could leverage a G2T component Zhou et al. (2018); Ji et al. (2020); Chen et al. (2021) the direct generation of text description from knowledge graphs (KGs) have attracted a lot of attention due to its potential in providing a more accessible presentation of knowledge to non-experts Schmitt et al. (2020).
In parallel, Transformer-based (Vaswani et al., 2017) pre-trained language models (PLMs) such as BART (Lewis et al., 2019), and T5 (Raffel et al., 2019) have facilitated state-of-the-art (SotA) results on several tasks, including earlier SotA results for G2T (Ribeiro et al., 2020; Kale and Rastogi, 2020; Mager et al., 2020). It has been argued that their success, in part, is due to factual memorisation that guides the generation Ribeiro et al. (2020). Although PLMs benefit the G2T generation, the linearisation step required to use these models ignores the structural information of the graph (Wang et al., 2021), while explicitly modelling structured data could also lead to catastrophic forgetting of distributional knowledge (Ribeiro et al., 2021).
To address this, Wang et al. (2021) proposed adding extra positional embedding layers to capture the inter-dependency structures of input graphs. Ribeiro et al. (2021) proposed using a structure-aware adapter in PLMs to supplement the input with its graph structure. For table data, Xing and Wan (2021) considered the structure of the table input by predicting the surrounding cells for a cell in a table. However, these methods either change the design of the PLMs (limiting their use for other task settings) or require labelled training data to capture the graph structure information.
In this work, we propose self-supervised graph masking pre-training strategies to enhance the structure awareness of PLMs. To achieve this, we formulate several graph masking strategies to inject local and global awareness of the input structure into the PLM. Our method has two key advantages: (i) it does not require to introduce extra layers or change of architecture in the underlying PLM, and (ii) it pre-trains the PLMs in a self-supervised setting on graphs, without requiring labelled training data. Starting from an existing PLM, we further pre-train it with our approach, then the fine-tuning on downstream tasks is done as per usual.
| Pre-training Task | Input (Triples format: ) | Target Output |
|---|---|---|
| Triple Prediction | [<X>, 1], [S | New York City, P | country, O | United States, 2], [S | New York City, P | is Part Of, O | Manhattan, 2], [S | Manhattan, P | leader Name, O | Cyrus Vance Jr., 3], [S | Manhattan, P | is Part Of, O | New York, 3] | <X> [S | Asser Levy Public Baths, P | location, O | New York City] <Z> |
| Relation Prediction | [S | Asser Levy Public Baths, P | location, O | New York City, 1], [S | New York City, <Y>, O | United States, 2], [S | New York City, P | is Part Of, O | Manhattan, 2], [S | Manhattan, P | leader Name, O | Cyrus Vance Jr., 3], [S | Manhattan, P | is Part Of, O | New York, 3] | <Y> P | country <Z> |
| Triple Prediction + Relation Prediction | [<X>, 1], [S | New York City, P | country, O | United States, 2], [S | New York City, P | is Part Of, O | Manhattan, 2], [S | Manhattan, <Y>, O | Cyrus Vance Jr., 3], [S | Manhattan, P | is Part Of, O | New York, 3] | <X> [S | Asser Levy Public Baths, P | location, O | New York City] <Y> P | leader Name <Z> |
We conduct extensive experiments on three G2T generation datasets of diverse graphs. Our empirical findings highlight that our self-supervised strategies significantly outperform a strong underlying T5 baseline and achieve two new SotA results on two of the datasets WebNLG+2020 (Zhou and Lampouras, 2020) and EventNarrative (Colas et al., 2021). Additionally, we show our pre-training strategies are very efficient in utilising data and have a great potential for low-resource setting.
2 Self-Supervised Graph Masking
Our desiderata is to infuse structural knowledge into widely used pre-trained encoder-decoder Transformer models, without modifying the model architecture or relying on supervision signal. To achieve this, we propose three self-supervised learning tasks to further pre-train a T5-LARGE (Raffel et al., 2020) model prior to fine-tuning on G2T generation downstream tasks. In this section we first describe our graph linearisation step which prepares the data in the right format for T5 encoder while injecting some weak structural information into the input (§2.1), then we introduce our three graph masking pre-training tasks (§2.2).
2.1 Linearising a Graph
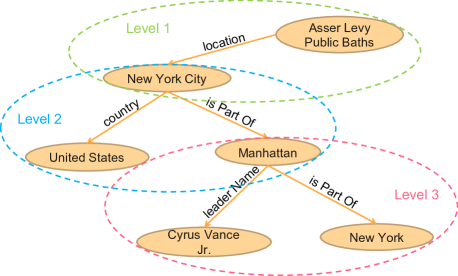
We linearise a graph into a set of triples in the format of [subject, predicate, object], representing [head entity, relation, tail entity] for every edge in a graph. Following Wang et al. (2021), we prepend , , tokens to further specialise each entity or relation with its role in a triple. Additionally, to provide a weak structural signal from the graph, we also augment every triple by a level marker , indicating the distance of its object entity from the root (the node that does not have a parent in the graph). This is similar to (Wang et al., 2021), noting the key difference in that they embed the tree level using an extra layer together with other positional embeddings, but we simply augment the linearised input without adding any extra layers. The final augmented triple has the following format: . For a visual example of this, see Appendix A.
2.2 Graph Masking Pre-training Strategies
The three self-supervised learning tasks are formulated as follows:
Triple Prediction (Triple). For a linearised graph, on each level we randomly mask one full triple and replace it with a mask token <X>, which is then used as the target for prediction. The masked triple can be seen as a sub-graph of the original graph. This is to encourage the model to automatically identify the most relevant parts of a full graph related to each of its sub-graph.
Relation Prediction (Relation). In this strategy, we focus on the relations within triples. We randomly mask one relation on each level with a mask token <Y>, and the model is tasked to predict the masked relation as the target. This task requires the model to leverage very local information (i.e., between a head and a tail) to predict the masked relation. Local cohesiveness is expected to translate into better translation of triples into text fragments.
Triple + Relation Prediction (Triple+Relation). This ultimate strategy combines both Triple and Relation Prediction tasks to leverage the benefits of both worlds. In this setting, the Triple Prediction task follows the same protocol as stated above, but for Relation Prediction, we only consider the relation in triples that are not connected with the masked triple. We randomly mask one triple with the mask token <X>. For the triples that do not have common subject or object with the masked triple, we also randomly mask one relation with the mask token <Y>. The model jointly learns to predict both the masked sub-graphs and relations at the same time.
In all pre-training tasks we also add a token <Z> as the end token in the target output. Table 1 summarises these three pre-training tasks via an example of each kind of graph masking strategy. Graph Masking Pre-training follows the standard cross-entropy loss, which is to minimise the negative log-likelihood of the masked part of the graph:
where is the masked part of the graph, is the unmasked part of the graph, is the number samples.
3 Experiments
In this section we outline the experimental setups (§3.1), followed by downstream G2T generation results in full (§3.2) and low-resource scenarios (§3.3). We also present a set of generated outputs from our models (§3.4), and finish by providing an analysis (§3.5) on the effect of pre-training data size, and an ablation on the role of input augmentation with level markers.
3.1 Experimental Setups
Tasks and Datasets. We evaluate on three G2T generation datasets: WebNLG+2020 (Zhou and Lampouras, 2020), DART (Nan et al., 2021), EventNarrative (Colas et al., 2021). WebNLG+2020222https://gitlab.com/shimorina/webnlg-dataset/-/tree/master/release_v3.0 contains a set of triples extracted from DBpedia (Auer et al., 2007) and text description for 16 distinct DBpedia categories. DART333https://github.com/Yale-LILY/dart is an open-domain heterogeneous structured dataset collected from different sources which cover a broad range of topics. EventNarrative444https://www.kaggle.com/datasets/acolas1/eventnarration is a large-scale, event-centric dataset extracted and paired from existing large-scale data repositories, including Wikidata, Wikipedia, and EventKG (Gottschalk and Demidova, 2018). See Appendix B for full data statistics.
Pre-training Datasets. For each pre-training strategy, we create the pre-training datasets on the graph side of the task training data with the right format.
Evaluation Metrics. We report the automatic evaluation using BLEU (Papineni et al., 2002), METEOR (Banerjee and Lavie, 2005), TER (Snover et al., 2006) which are used in the official WebNLG challenge (Gardent et al., 2017) and BERTScore (Zhang et al., 2020) which considers the semantic meanings of words or phrases.
| Data | Metric | T5 LARGE | SotA | Triple | Relation | Triple+ Relation |
|---|---|---|---|---|---|---|
| WebNLG | BLEU | 53.60 | 55.41 | 57.64 | 56.93 | 57.49 |
| METEOR | 39.52 | 41.90 | 42.24 | 41.94 | 42.19 | |
| TER | 41.48 | 39.20 | 38.86 | 39.42 | 39.08 | |
| BERTScore | 95.02 | - | 95.36 | 95.23 | 95.28 | |
| EventNar | BLEU | 34.31 | 35.08 | 38.27 | 38.36 | 38.08 |
| METEOR | 26.84 | 27.50 | 31.01 | 30.80 | 30.99 | |
| TER | 58.26 | - | 55.19 | 56.11 | 55.32 | |
| BERTScore | 93.02 | 93.38 | 95.24 | 95.07 | 95.21 | |
| DART | BLEU | 50.66 | 51.95 | 50.85 | 50.71 | 50.83 |
| METEOR | 40 | 41.07 | 40.31 | 40.23 | 40.37 | |
| TER | 43 | 42.75 | 43.23 | 43.68 | 43.51 | |
| BERTScore | 95 | 95 | 95.11 | 95.04 | 95.16 |
Baseline, SotA, Our Models. We use the T5-LARGE model as our baseline for fine-tuning. T5-large results are based on the published results Ribeiro et al. (2020). All our models further pre-train the vanilla T5-LARGE model and are further fine-tuned for G2T generation tasks as usual. We denote our configurations as Triple, Relation, Triple+Relation. SotA results for WebNLG and DART are from Clive et al. (2021), and for EventNarrative are based on Colas et al. (2022). Our implementation is based on the Huggingface Library (Wolf et al., 2019). Optimisation was done using Adam (Kingma and Ba, 2015) with a learning rate of 3e-5 and a batch size of 3 both in the pre-training and fine-tuning stages. We used a V100 16GB GPU for all experiments.
3.2 Graph-to-text Generation
Task Formulation. G2T generation follows the standard language modelling objective. Given an input graph , the model aims to generate ground-truth text . The objective is to maximise the likelihood of the ground-truth text, which is equivalent to minimise the negative log-likelihood as:
Results. Table 2 reports the results of fine-tuning the baseline, SotA and our models on three G2T generation tasks. For WebNLG, all of our strategies outperform both the baseline and SotA results. The performance difference among our three variants is statistically insignificant. Similarly, on EventNarrative all our models outperform SotA and baseline. For DART, the improvement over the baseline is not as significant as for the other two datasets, while our method matches SotA on BERTScore but falls behind on the other metrics. We speculate this to be reflective of the heterogeneous nature of DART, which has a large proportion of data with very limited relations (e.g., roughly 52% of DART contains only 7 types of relations). In this setting, the pre-training tasks cannot capture much useful structure information on this sparse data.
| Tr.Size | Model Setting | BLEU | METEOR | TER | BERTScore |
|---|---|---|---|---|---|
| 5% | w/o pre-training | 48.52 | 37.44 | 43.97 | 94.66 |
| same 5% for pre-training | 52.79 | 40.41 | 42.02 | 94.94 | |
| remaining 95% for pre-training | 50.69 | 39.06 | 42.97 | 94.72 | |
| 10% | w/o pre-training | 48.64 | 37.24 | 43.33 | 94.65 |
| same 10% data for pre-training | 53.56 | 40.45 | 41.19 | 95.03 | |
| remaining 90% data for pre-training | 52.57 | 39.75 | 42.17 | 94.75 | |
| 25% | w/o pre-training | 50.35 | 37.87 | 43.82 | 94.66 |
| same 25% data for pre-training | 56.04 | 41.57 | 39.38 | 95.24 | |
| remaining 75% data for pre-training | 55.93 | 41.46 | 39.78 | 95.20 |
3.3 Low-resource Setting
We investigated the performance of our methods in low-resource scenario. For this we used Triple as the pre-training strategy and k% (k=5, 10, 25) of WebNLG+2020 training data for downstream task fine-tuning. We tried two configurations to see if pre-training (still without using the labels) with the same training data would be better than pre-training on the non-overlapping training data: (1) used the same k% between pre-training and fine-tuning, (2) used 100-k% for pre-training and k% for fine-tuning. We compared the results of these two settings with the T5 LARGE which was only task fine-tunined (without additional pre-training). The results are shown in Table 3.
The models using pre-training significantly outperform the models without pre-training. For instance in 5% training scenario, the pre-trained model with Triple which used the same amount of data for both pre-training and fine-tuning outperforms T5 LARGE by a margin of 4 BLEU scores. This indicates that our graph masking pre-training strategies can effectively improve the performance of the underlying PLM in the low-resource scenario. With the increment of training data, the improvement effect of pre-training method is greater. Moreover, pre-training with the same training data leads to better results compared with using non-overlapping data. We speculate this happens since the model in this configuration is exposed to learn specific structural knowledge that will be used in the seen training data for fine-tuning downstream tasks. This also suggests a potential for our approach in multi-task learning, which we leave to future work. As the increase of training data, the gap of the performance of pre-training using different parts of data also decreases.
| Data | Time | BLEU | METEOR | TER | BERTScore |
|---|---|---|---|---|---|
| 100% | 10h | 57.64 | 42.24 | 38.86 | 95.36 |
| 75% | 7.5h | 56.92 | 41.98 | 39.07 | 95.29 |
| 50% | 5h | 56.78 | 41.96 | 39.90 | 95.18 |
| 25% | 2.5h | 56.73 | 41.85 | 40.13 | 95.21 |
| 5% | 0.5h | 56.40 | 41.28 | 40.24 | 95.12 |
3.4 Generated Samples
We demonstrate two qualitative examples of generated texts on WebNLG+2020 and EventNarrative test sets in Table 5.
For the WebNLG example, while T5 LARGE generates fluent texts but misses to cover the “recorded in” relation. Previous SotA model generates all information from the graph, but it breaks the order of arguments for “preceded By”. While our model can not only produce the sentences with correct information.
For the EventNarrative example, the “Russian” information in the reference does not exist in the graph, which should be inferred by the PLM. For T5 LARGE and previous SotA, neither can generate such information, while our model can generate this additional information without missing any information from the graph. See more generated samples in Appendix C.
| WebNLG+2020 | EventNarrative |
|---|---|
|
|
![[Uncaptioned image]](/html/2210.10599/assets/x2.png)
|
| Reference: The Velvet Underground Squeeze album was succeeded by the rock album Bootleg Series Volume 1: The Quine Tapes, recorded under record label Polydor Records in San Francisco. | Reference: The First Battle of Ignacewo was one of many clashes of the January Uprising. it took place on may 8, 1863, near the village of Ignacewo, Konin County, which at that time belonged to Russian empire’s Congress Poland. |
| T5-Large: The genre of Bootleg Series Volume 1: The Quine Tapes is rock music and was preceded by the album Squeeze The Velvet Underground. The album was released by Polydor Records. | T5-Large: The First Battle of Ignacewo was fought in Ignacewo, Konin County, Congress Poland, during the January Uprising. |
| Previous SotA: Squeeze The Velvet Underground was preceded by Bootleg Series Volume 1: The Quine Tapes, which was recorded in San Francisco and released by Polydor Records. The genre of the album is rock music. | Previous SotA: The First Battle of Ignacewo was one of the first battles of the January Uprising. It took place on January 6, 1863, near the village of Konin, in Congress Poland. |
| Graph Masking Pre-training+T5-Large: Bootleg Series Volume 1: The Quine Tapes, whose genre is rock music, were recorded in San Francisco and are signed to Polydor Records. They were preceded by the album Squeeze The Velvet Underground. | Graph Masking Pre-training+T5-Large: The First Battle of Ignacewo was one of battles of the January Uprising. It took place on January 11, 1863, near the village of Ignacewo, Konin County, Russian-controlled Congress Poland. |
3.5 Analysis
Effect of Pre-training Data Size. To explore how the size of the used pre-training data affects the performance of our strategies in downstream tasks, we experimented on WebNLG+2020 dataset using our Triple strategy. We used 5%, 10%, 25%, 50%, and 100% of the graph side of training data for pre-training, and the whole training data to fine-tune the models. We recorded the performance, and training duration in Table 4. As the amount of pre-training data decreased, the performance of the model also decreased slightly. However, even with using 5% of pre-training data and less than 30 minutes spent on pre-training, our method outperforms both the SotA and T5 LARGE models (Table 2) by a significant margin.
| Pre-training Tasks | BLEU | METEOR | TER | BERTScore |
|---|---|---|---|---|
| Triple | 57.64 | 42.24 | 38.86 | 95.36 |
| -w/o level marker | 56.48 | 41.77 | 39.94 | 95.17 |
| Triple+Relation | 57.49 | 42.19 | 39.08 | 95.28 |
| -w/o level marker | 56.28 | 41.70 | 39.72 | 95.24 |
| No pre-training | 54.86 | 40.62 | 40.58 | 95.09 |
| -w/o level marker | 53.60 | 39.52 | 41.48 | 95.02 |
Ablation. To show the contribution of input augmentation with level markers (§2.1), we experimented with Triple and Triple+Relation strategies on WebNLG+2020. We also report the results of using input augmentation with level marker during fine-tuning T5 LARGE. The results are shown in Table 6. We observe that the input augmentation with level markers brings improvement across all settings, even when it is only used during fine-tuning (last two rows of Table 6). We speculate this to be an indication that some useful positional information is augmented to the the linearised input through adding level markers.
4 Conclusion and Future Work
We proposed various self-supervised pre-training strategies to improve the structural awareness of PLMs without refining the architecture or relying on labelled data. Our graph masking strategies outperformed the strong PLM baseline and achieve new state-of-the-art results on WebNLG+2020 and EventNarrative datasets. We demonstrated that our approach is very efficient in utilising even a small pre-training or fine-tuning datasets. For future work, we will explore different graph masking strategies to adapt for different domains of graph.
5 Limitations
Since our method leverages the knowledge learned by pretrained language models, it is much more effective for use in scenarios where, unlike AMR graphs, the relations inside the graph correspond to meaningful words or morphemes. Additionally, we observed our method not to work well for the cases, like in E2E (Dusek et al., 2019), that the number of relations or entities are quite sparse.
6 Ethics Statement
Our model utilises existing pretrained language models and as such it could inherit the same ethical concerns involving these models - which are being discussed widely in the community. Our pretraining method itself does not exacerbate this issue.
References
- Auer et al. (2007) Sören Auer, Christian Bizer, Georgi Kobilarov, Jens Lehmann, Richard Cyganiak, and Zachary G. Ives. 2007. Dbpedia: A nucleus for a web of open data. In The Semantic Web, 6th International Semantic Web Conference, 2nd Asian Semantic Web Conference, ISWC 2007 + ASWC 2007, Busan, Korea, November 11-15, 2007, volume 4825 of Lecture Notes in Computer Science, pages 722–735. Springer.
- Banerjee and Lavie (2005) Satanjeev Banerjee and Alon Lavie. 2005. METEOR: an automatic metric for MT evaluation with improved correlation with human judgments. In Proceedings of the Workshop on Intrinsic and Extrinsic Evaluation Measures for Machine Translation and/or Summarization@ACL 2005, Ann Arbor, Michigan, USA, June 29, 2005, pages 65–72. Association for Computational Linguistics.
- Chen et al. (2021) Wenhu Chen, Ming-Wei Chang, Eva Schlinger, William Yang Wang, and William W. Cohen. 2021. Open question answering over tables and text. In 9th International Conference on Learning Representations, ICLR 2021, Virtual Event, Austria, May 3-7, 2021. OpenReview.net.
- Clive et al. (2021) Jordan Clive, Kris Cao, and Marek Rei. 2021. Control prefixes for text generation. CoRR, abs/2110.08329.
- Colas et al. (2022) Anthony Colas, Mehrdad Alvandipour, and Daisy Zhe Wang. 2022. GAP: A graph-aware language model framework for knowledge graph-to-text generation. CoRR, abs/2204.06674.
- Colas et al. (2021) Anthony Colas, Ali Sadeghian, Yue Wang, and Daisy Zhe Wang. 2021. Eventnarrative: A large-scale event-centric dataset for knowledge graph-to-text generation. In Proceedings of the Neural Information Processing Systems Track on Datasets and Benchmarks 1, NeurIPS Datasets and Benchmarks 2021, December 2021, virtual.
- Dusek et al. (2019) Ondrej Dusek, David M. Howcroft, and Verena Rieser. 2019. Semantic noise matters for neural natural language generation. In Proceedings of the 12th International Conference on Natural Language Generation, INLG 2019, Tokyo, Japan, October 29 - November 1, 2019, pages 421–426. Association for Computational Linguistics.
- Gardent et al. (2017) Claire Gardent, Anastasia Shimorina, Shashi Narayan, and Laura Perez-Beltrachini. 2017. The webnlg challenge: Generating text from RDF data. In Proceedings of the 10th International Conference on Natural Language Generation, INLG 2017, Santiago de Compostela, Spain, September 4-7, 2017, pages 124–133. Association for Computational Linguistics.
- Gatt and Krahmer (2018) Albert Gatt and Emiel Krahmer. 2018. Survey of the state of the art in natural language generation: Core tasks, applications and evaluation. J. Artif. Intell. Res., 61:65–170.
- Gottschalk and Demidova (2018) Simon Gottschalk and Elena Demidova. 2018. Eventkg: A multilingual event-centric temporal knowledge graph. In The Semantic Web - 15th International Conference, ESWC 2018, Heraklion, Crete, Greece, June 3-7, 2018, Proceedings, volume 10843 of Lecture Notes in Computer Science, pages 272–287. Springer.
- Ji et al. (2020) Haozhe Ji, Pei Ke, Shaohan Huang, Furu Wei, Xiaoyan Zhu, and Minlie Huang. 2020. Language generation with multi-hop reasoning on commonsense knowledge graph. In Proceedings of the 2020 Conference on Empirical Methods in Natural Language Processing, EMNLP 2020, Online, November 16-20, 2020, pages 725–736. Association for Computational Linguistics.
- Kale and Rastogi (2020) Mihir Kale and Abhinav Rastogi. 2020. Text-to-text pre-training for data-to-text tasks. In Proceedings of the 13th International Conference on Natural Language Generation, INLG 2020, Dublin, Ireland, December 15-18, 2020, pages 97–102. Association for Computational Linguistics.
- Kingma and Ba (2015) Diederik P. Kingma and Jimmy Ba. 2015. Adam: A method for stochastic optimization. In 3rd International Conference on Learning Representations, ICLR 2015, San Diego, CA, USA, May 7-9, 2015, Conference Track Proceedings.
- Lewis et al. (2019) Mike Lewis, Yinhan Liu, Naman Goyal, Marjan Ghazvininejad, Abdelrahman Mohamed, Omer Levy, Ves Stoyanov, and Luke Zettlemoyer. 2019. Bart: Denoising sequence-to-sequence pre-training for natural language generation, translation, and comprehension. arXiv preprint arXiv:1910.13461.
- Mager et al. (2020) Manuel Mager, Ramón Fernandez Astudillo, Tahira Naseem, Md Arafat Sultan, Young-Suk Lee, Radu Florian, and Salim Roukos. 2020. GPT-too: A language-model-first approach for AMR-to-text generation. In Proceedings of the 58th Annual Meeting of the Association for Computational Linguistics, pages 1846–1852, Online. Association for Computational Linguistics.
- Nan et al. (2021) Linyong Nan, Dragomir R. Radev, Rui Zhang, Amrit Rau, Abhinand Sivaprasad, Chiachun Hsieh, Xiangru Tang, Aadit Vyas, Neha Verma, Pranav Krishna, Yangxiaokang Liu, Nadia Irwanto, Jessica Pan, Faiaz Rahman, Ahmad Zaidi, Mutethia Mutuma, Yasin Tarabar, Ankit Gupta, Tao Yu, Yi Chern Tan, Xi Victoria Lin, Caiming Xiong, Richard Socher, and Nazneen Fatema Rajani. 2021. DART: open-domain structured data record to text generation. In Proceedings of the 2021 Conference of the North American Chapter of the Association for Computational Linguistics: Human Language Technologies, NAACL-HLT 2021, Online, June 6-11, 2021, pages 432–447. Association for Computational Linguistics.
- Papineni et al. (2002) Kishore Papineni, Salim Roukos, Todd Ward, and Wei-Jing Zhu. 2002. Bleu: a method for automatic evaluation of machine translation. In Proceedings of the 40th Annual Meeting of the Association for Computational Linguistics, July 6-12, 2002, Philadelphia, PA, USA, pages 311–318. ACL.
- Raffel et al. (2019) Colin Raffel, Noam Shazeer, Adam Roberts, Katherine Lee, Sharan Narang, Michael Matena, Yanqi Zhou, Wei Li, and Peter J Liu. 2019. Exploring the limits of transfer learning with a unified text-to-text transformer. arXiv preprint arXiv:1910.10683.
- Raffel et al. (2020) Colin Raffel, Noam Shazeer, Adam Roberts, Katherine Lee, Sharan Narang, Michael Matena, Yanqi Zhou, Wei Li, and Peter J. Liu. 2020. Exploring the limits of transfer learning with a unified text-to-text transformer. J. Mach. Learn. Res., 21:140:1–140:67.
- Ribeiro et al. (2020) Leonardo F. R. Ribeiro, Martin Schmitt, Hinrich Schütze, and Iryna Gurevych. 2020. Investigating pretrained language models for graph-to-text generation. CoRR, abs/2007.08426.
- Ribeiro et al. (2021) Leonardo F. R. Ribeiro, Yue Zhang, and Iryna Gurevych. 2021. Structural adapters in pretrained language models for amr-to-text generation. In Proceedings of the 2021 Conference on Empirical Methods in Natural Language Processing, EMNLP 2021, Virtual Event / Punta Cana, Dominican Republic, 7-11 November, 2021, pages 4269–4282. Association for Computational Linguistics.
- Schmitt et al. (2020) Martin Schmitt, Sahand Sharifzadeh, Volker Tresp, and Hinrich Schütze. 2020. An unsupervised joint system for text generation from knowledge graphs and semantic parsing. In Proceedings of the 2020 Conference on Empirical Methods in Natural Language Processing (EMNLP), pages 7117–7130, Online. Association for Computational Linguistics.
- Snover et al. (2006) Matthew G. Snover, Bonnie J. Dorr, Richard M. Schwartz, Linnea Micciulla, and John Makhoul. 2006. A study of translation edit rate with targeted human annotation. In Proceedings of the 7th Conference of the Association for Machine Translation in the Americas: Technical Papers, AMTA 2006, Cambridge, Massachusetts, USA, August 8-12, 2006, pages 223–231. Association for Machine Translation in the Americas.
- Vaswani et al. (2017) Ashish Vaswani, Noam Shazeer, Niki Parmar, Jakob Uszkoreit, Llion Jones, Aidan N. Gomez, Lukasz Kaiser, and Illia Polosukhin. 2017. Attention is all you need. In Advances in Neural Information Processing Systems 30: Annual Conference on Neural Information Processing Systems 2017, December 4-9, 2017, Long Beach, CA, USA, pages 5998–6008.
- Wang et al. (2021) Qingyun Wang, Semih Yavuz, Xi Victoria Lin, Heng Ji, and Nazneen Fatema Rajani. 2021. Stage-wise fine-tuning for graph-to-text generation. In Proceedings of the ACL-IJCNLP 2021 Student Research Workshop, ACL 2021, Online, JUli 5-10, 2021, pages 16–22. Association for Computational Linguistics.
- Wolf et al. (2019) Thomas Wolf, Lysandre Debut, Victor Sanh, Julien Chaumond, Clement Delangue, Anthony Moi, Pierric Cistac, Tim Rault, Rémi Louf, Morgan Funtowicz, and Jamie Brew. 2019. Huggingface’s transformers: State-of-the-art natural language processing. CoRR, abs/1910.03771.
- Xing and Wan (2021) Xinyu Xing and Xiaojun Wan. 2021. Structure-aware pre-training for table-to-text generation. In Findings of the Association for Computational Linguistics: ACL-IJCNLP 2021, pages 2273–2278, Online. Association for Computational Linguistics.
- Zhang et al. (2020) Tianyi Zhang, Varsha Kishore, Felix Wu, Kilian Q. Weinberger, and Yoav Artzi. 2020. Bertscore: Evaluating text generation with BERT. In 8th International Conference on Learning Representations, ICLR 2020, Addis Ababa, Ethiopia, April 26-30, 2020. OpenReview.net.
- Zhou and Lampouras (2020) Giulio Zhou and Gerasimos Lampouras. 2020. WebNLG challenge 2020: Language agnostic delexicalisation for multilingual RDF-to-text generation. In Proceedings of the 3rd International Workshop on Natural Language Generation from the Semantic Web (WebNLG+), pages 186–191, Dublin, Ireland (Virtual). Association for Computational Linguistics.
- Zhou et al. (2018) Hao Zhou, Tom Young, Minlie Huang, Haizhou Zhao, Jingfang Xu, and Xiaoyan Zhu. 2018. Commonsense knowledge aware conversation generation with graph attention. In Proceedings of the Twenty-Seventh International Joint Conference on Artificial Intelligence, IJCAI 2018, July 13-19, 2018, Stockholm, Sweden, pages 4623–4629. ijcai.org.
Appendix
Appendix A Level Marker Augmentation
A graph and linearised version of a level-augmented input is provided in Figure 1.
Appendix B Data Statistics
The data statistics for tasks used in the paper are summarised in Table 7.
| Dataset | Domain | Examples | Train/Dev/Test |
|---|---|---|---|
| WebNLG+2020 | 16 DBpedia Categories | 38,872 | 35,426/1,667/1,779 |
| EventNarrative | Events | 224,428 | 179,544/22,442/22,442 |
| DART | Wikipedia | 11,998 | |
| 15 DBpedia Categories | 27,731 | 62,659/6,980/12,552 | |
| Restaurant and Hotel Descriptions | 42,462 |
Appendix C Generated Samples
Table 8 illustrates two qualitative examples of generated texts on WebNLG+2020 and EventNarrative test sets.
For the WebNLG example, T5 LARGE misses to cover the “manufacturer” and “body Style” information. Although previous SotA and our model both can generate correct sentences, the output of our model shows a more complex syntactic structure. For the EventNarrative example, the sentences generated from T5 LARGE have a big difference with the reference sentences and do not cover all information from the graph. Previous SotA model misses to cover the “office contested” information, while the output from our model covers all information.
| WebNLG+2020 |
|---|
![[Uncaptioned image]](/html/2210.10599/assets/x4.png)
|
| Reference: The Pontiac Rageous was a car with a coupe body style manufactured by Pontiac. Assembled in both Michigan and Detroit, it went into production in 1997, ending in the same year. |
| T5-Large: The Pontiac Rageous is assembled in Detroit, Michigan. Its production began in 1997 and ended in 1997. The Pontiac Rageous is a 4 door, 5 passenger vehicle. |
| Previous SotA: The Pontiac Rageous is manufactured by Pontiac in Detroit, Michigan. Its production began in 1997 and ended in 1997. The Pontiac Rageous has a coupe body style. |
| Graph Masking Pre-training+T5-Large: Pontiac is the manufacturer of the Pontiac Rageous which has a coupe body style. The Pontiac Rageous is assembled in Detroit, Michigan and began production in 1997. |
| EventNarrative |
![[Uncaptioned image]](/html/2210.10599/assets/x5.png)
|
| Reference: The First Battle of Ignacewo was one of many clashes of the January Uprising. it took place on may 8, 1863, near the village of Ignacewo, Konin County, which at that time belonged to Russian empire’s Congress Poland. |
| T5-Large: The First Battle of Ignacewo was fought in Ignacewo, Konin County, Congress Poland, during the January Uprising. |
| Previous SotA: The First Battle of Ignacewo was one of the first battles of the January Uprising. It took place on January 6, 1863, near the village of Konin, in Congress Poland. |
| Graph Masking Pre-training+T5-Large: The First Battle of Ignacewo was one of battles of the January Uprising. It took place on January 11, 1863, near the village of Ignacewo, Konin County, Russian-controlled Congress Poland. |