Design and Modeling of a PVDF-TrFe Flexible Wind Energy Harvester
Abstract
This study presents the simulation, experimentation, and design considerations of a Poly(vinylidene fluoride co-trifluoroethylene)/ Polyethylene Terephthalate (PVDF-TrFe / PET), laser-cut, flexible piezoelectric energy harvester. It is possible to obtain energy from the environment around autonomous sensor systems, which can then be used to power various equipment. This article investigates the actuation means of ambient vibration, which is a good candidate for using piezoelectric energy harvester (PEH) devices. The output voltage characteristics were analyzed in a wind test apparatus. Finite element modeling (FEM) was done for von Mises stress and modal analysis. Resonance frequency sweeps, quality factors, and damping ratios of the circular plate were given numerically. For a PVDF-TrFe piezoelectric layer thickness of 18 µm and 1.5 mm radius, a damping ratio of 0.117 and a quality factor of 4.284 was calculated. was calculated as 984 mV from the wind setup and compared with the FEM outputs.
keywords:
PVDF-TrFe, Piezoelectricity, Wind Energy Harvesting, Finite Element Modeling, Vibration, Frequency Response1 Introduction
Microelectronics’ inclusion and rapid development have profoundly impacted human society in recent decades. The widespread availability of intelligent electronic devices paved a way for a surge of varied applications that may improve one’s quality of life in a variety of different ways. Concurrent advancements in microelectromechanical systems (MEMS) technologies have resulted in improved device performance with reductions in size, cost, and the amount of power they use. Together with advancements in the capacity of wireless transmission, the tendency toward devices that are both smaller and inexpensive makes it feasible to establish distributed networks. Such networks have the potential to serve a variety of functions. Observing temperature, light, and the position of individuals in commercial properties to regulate the environment in a manner that is more energy-efficient, detecting dangerous chemical agents in high-density areas, monitoring the formation of fatigue cracks on aircraft, monitoring the speed and pressure in vehicle tires, and a great deal more are all examples of the many applications of this technology. Numerous experts believe that very low-power embedded electronic devices will become ubiquitous, performing tasks ranging from factory automation to entertainment. However, the performance of such new advancements is reliant on the availability of reliable sources of energy in the near future. As Batteries and other types of energy sources that have a set capacity present a number of challenges due to their cost, size, and longevity, the device presented in the article, is intended to provide the necessary power for electronic devices by harvesting vibrational energy. Table (1) shows the comparison of macro and micro-scale energy harvesters from literature.
| Paper | Dimensions | Shape | Voltage Output |
|
|
|||||||||||||
|---|---|---|---|---|---|---|---|---|---|---|---|---|---|---|---|---|---|---|
| [1] Qian, F. et. al. |
|
|
|
0.193 mW | 78.35 rad/s | |||||||||||||
| [2] Li, X. et. al. | 110x22 mm |
|
|
|
|
|||||||||||||
| [3] Ramírez, J. M. et. al. |
|
|
6 V max. | 200 W | 4.7 Hz | |||||||||||||
| [5] Morimoto et. al. |
|
|
|
244 W | 126 Hz | |||||||||||||
| [6] Horowitz et. al. |
|
|
|
|
3.7 kHz | |||||||||||||
| [7] Wang et. al. | 2 | Nanowire |
|
|
3 MHz | |||||||||||||
| [8] Hu et. al. | 1.5×0.5 | Nanowire | 1.5 V |
|
Not given | |||||||||||||
| [10] Lin et. al. |
|
Nanowire | 8V |
|
Not given |
2 PVDF-TrFe Sensor Modeling
2.1 Material Search
The polymer PVDF-TrFe is selected for this application for various purposes. First of all, it can be stretched in both the longitudinal and the transverse directions, which allows it to be used to form a bi-oriented film [11]. If PVDF proves to be an excellent candidate for the fabrication of piezo films, the P(VDFTrFE) copolymer may also be poled [11]. This particular copolymer will crystallize immediately in beta form as a result of the replacement of a few of the VF2(CH2- CF2) molecules in the PVDF with VF3 (CH-CF3) molecules [11]. In the study of Mohammadi et al., Fourier transforms infrared spectroscopy was used to evaluate the influence of biaxial orientation and deformation rate on the microstructure of stretched PVDF samples, and wide-angle X-ray diffraction was used to confirm the findings of the FTIR analysis [12]. FTIR spectroscopy is a well-established method for determining whether or not there has been a shift in the amount of b-phase present in PVDF films. It has been demonstrated that an additional transition of the non-polar a phase into the polar b crystallites occurs when the stretching rate is 10–50 cm/min [12]. Polarized PVDF flms have fairly balanced piezoelectric activity in the flm plane, unlike uniaxially oriented PVDF flms, which have more signifcant piezoelectric coefcients [13]. This is because polarized PVDF flms are oriented in two orthogonal directions. The crystalline structure of PVDF is directly responsible for the material’s electrical characteristics [14-18]. Today, various different polar crystals have been described for PVDF. These modifcations are designated as b (form I), g (form III), d (form IV), and e (form V) [19]. Only when the stretch ratio is more than five is the melt-crystallized PVDF capable of being transformed into the b-phase [20]. In order to produce polar b-phase PVDF straightforwardly, one must either cast PVDF from solutions of hexamethyl phosphoric triamide or quench molten PVDF under high pressure. Both of these processes are required. Both of these methods produce the same result [20]. The electrical charge in the matching PVDF film is significantly lower than that in the 55 mol percent VDF copolymer, which has the biggest dielectric constant and the most considerable electric current [12]. An uncommon negative longitudinal piezoelectric effect was seen by Katsouras et al. in the ferroelectric polymer poly(vinylidene fluoride) (PVDF), as well as its copolymers with trifluoroethylene (P(VDF-TrFE)) [21]. It seems inconceivable that the polarization-biased electrostrictive contribution of the crystalline component is the only factor responsible for this event [21]. Electromechanical contact between crystalline lamellae and amorphous areas is the cause [105]. The so-called dimensional model, a commonly accepted explanation for the negative piezoelectric effect of PVDF, assumes that the dipoles are stiff and maintain their fixed moment and orientation even when the material is mechanically deformed [21]. According to Katsouras et al., applying a positive stress perpendicular to the chains mainly increases the distance between the chains. This is because the interactions between the chains, both van der Waals and electrostatic, are relatively weak. This dipole-induced piezoelectricity process has been verified using quantum mechanical simulations for single-crystalline polymers [22, 23]. P(VDF-TrFE) crystallizes into needle shaped domains, whereas PVDF films consist of massive lamellae, which spread outward from the center. Table (2) shows the superiority of PVDF-TrFE compared with other widely used piezoelectric materials in terms of voltage output KPI.
| Parameter | [26,28] | Quartz [30,31] | PZT4 [25,30,32] | PZT5H [24,27,30] | PVDF-TrFe [25,29] |
|---|---|---|---|---|---|
| [] | 13.06 | 51.98 | 25.12 | 19.71 | 456.79 |
As given in (1) and (2), the constant is directly proportional to the voltage output of the piezoelectric material. PVDF-TrFe has one order of magnitude higher constant than most piezoelectric materials.
| (1) |
| (2) |
2.2 Proposed Design
The device operates under wind vibration. Figure (1) presents an illustration of the device’s functionality and an image taken under optical microscope. Wind vibration deforms the piezoelectric plates and creates AC voltage and current. The power harvester can power up low-power electronics or charge electrical storage devices.
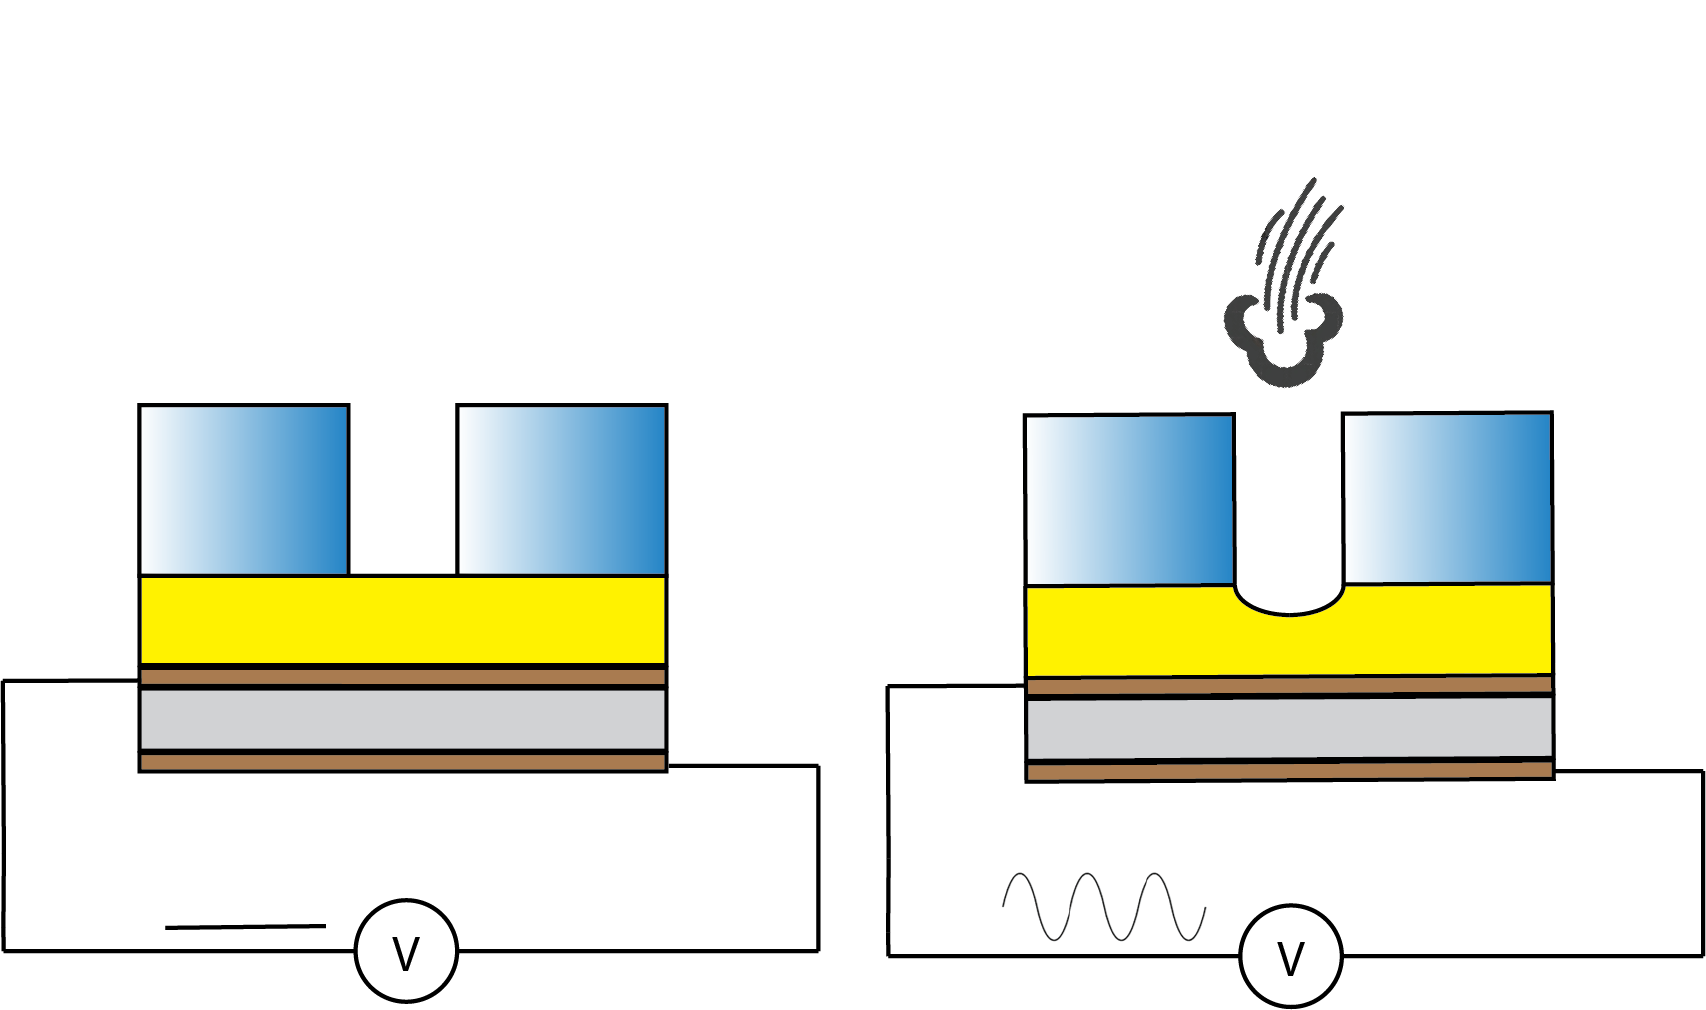
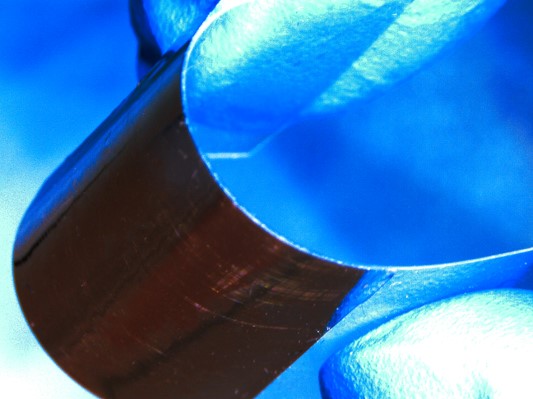
To fabricate the device, plain PET sheets were cut to 10 mm by 10 mm using a mechanical cutter. The sheets had a thickness of 140 m and were laser-cut to create 3 mm in diameter circular perforations. The PET was then covered with a double-sided tape measuring 65 microns in thickness, and PolyK PVDF film adhered to the sheet. In addition, the tape served as the harvester’s structural layer, shifting the piezoelectric layers away from the neutral axis.
2.3 Sensor Modeling
To model the sensor, an electromechanical equivalent circuit was used. In the circuit, there is a capacitor in the electrical domain and spring and mass elements in the mechanical domain [33].
| (3) |
where is the ratio of PVDF’s relative permittivity to the permittivity of a vacuum, is the thickness of PVDF, and is the radius of the top electrode.With a normal plate deflection shape function of (x) [34]:
| (4) |
where is the normalized version of the radial coordinate. The axisymmetric plate deflection is given by w()=(x), where is the static plate deflection at the center of the clamped plate. , the piezoelectric coupling integral, and , the strain energy integral, can be calculated using the formulas [33]:
| (5) |
| (6) |
where v is the effective Poisson’s ratio of the composite plate and M is the piezoelectric bending moment supplied by the piezoelectric material [35]:
| (7) |
is the transverse piezoelectric coefficient. is the applied voltage. In addition, z is the distance between the midplane of the active PVDF layer and the neutral plane. Notably, the piezoelectric coupling integral is only calculated across the electrode region (normalized radial coordinate 0 to), whereas the strain energy integral is calculated throughout the entire radius. The location of the composite plate structure’s neutral plane z, is determined by the following:
| (8) |
The subscripts represent the thin plate layers from the harvester’s base in ascending order. is Young’s Modulus, Poisson’s ratio equals , and each layer’s central axis is . Similarly, the flexural rigidity, D [36], and effective mass per unit area, of the composite plate are:
| (9) |
| (10) |
represents the density, while represents the height of each layer. When solving (13) for the mechanical compliance, one obtains:
| (11) |
Solving gives the following equation for the electromechanical coupling ratio:
| (12) |
The circular plate formula [34] is used to determine the natural frequency:
| (13) |
where is the vibration mode (01) eigenvalue. The mass of the composite disk as a whole, . In addition, the shape function is utilized to calculate the modal mass:
| (14) |
| (15) |
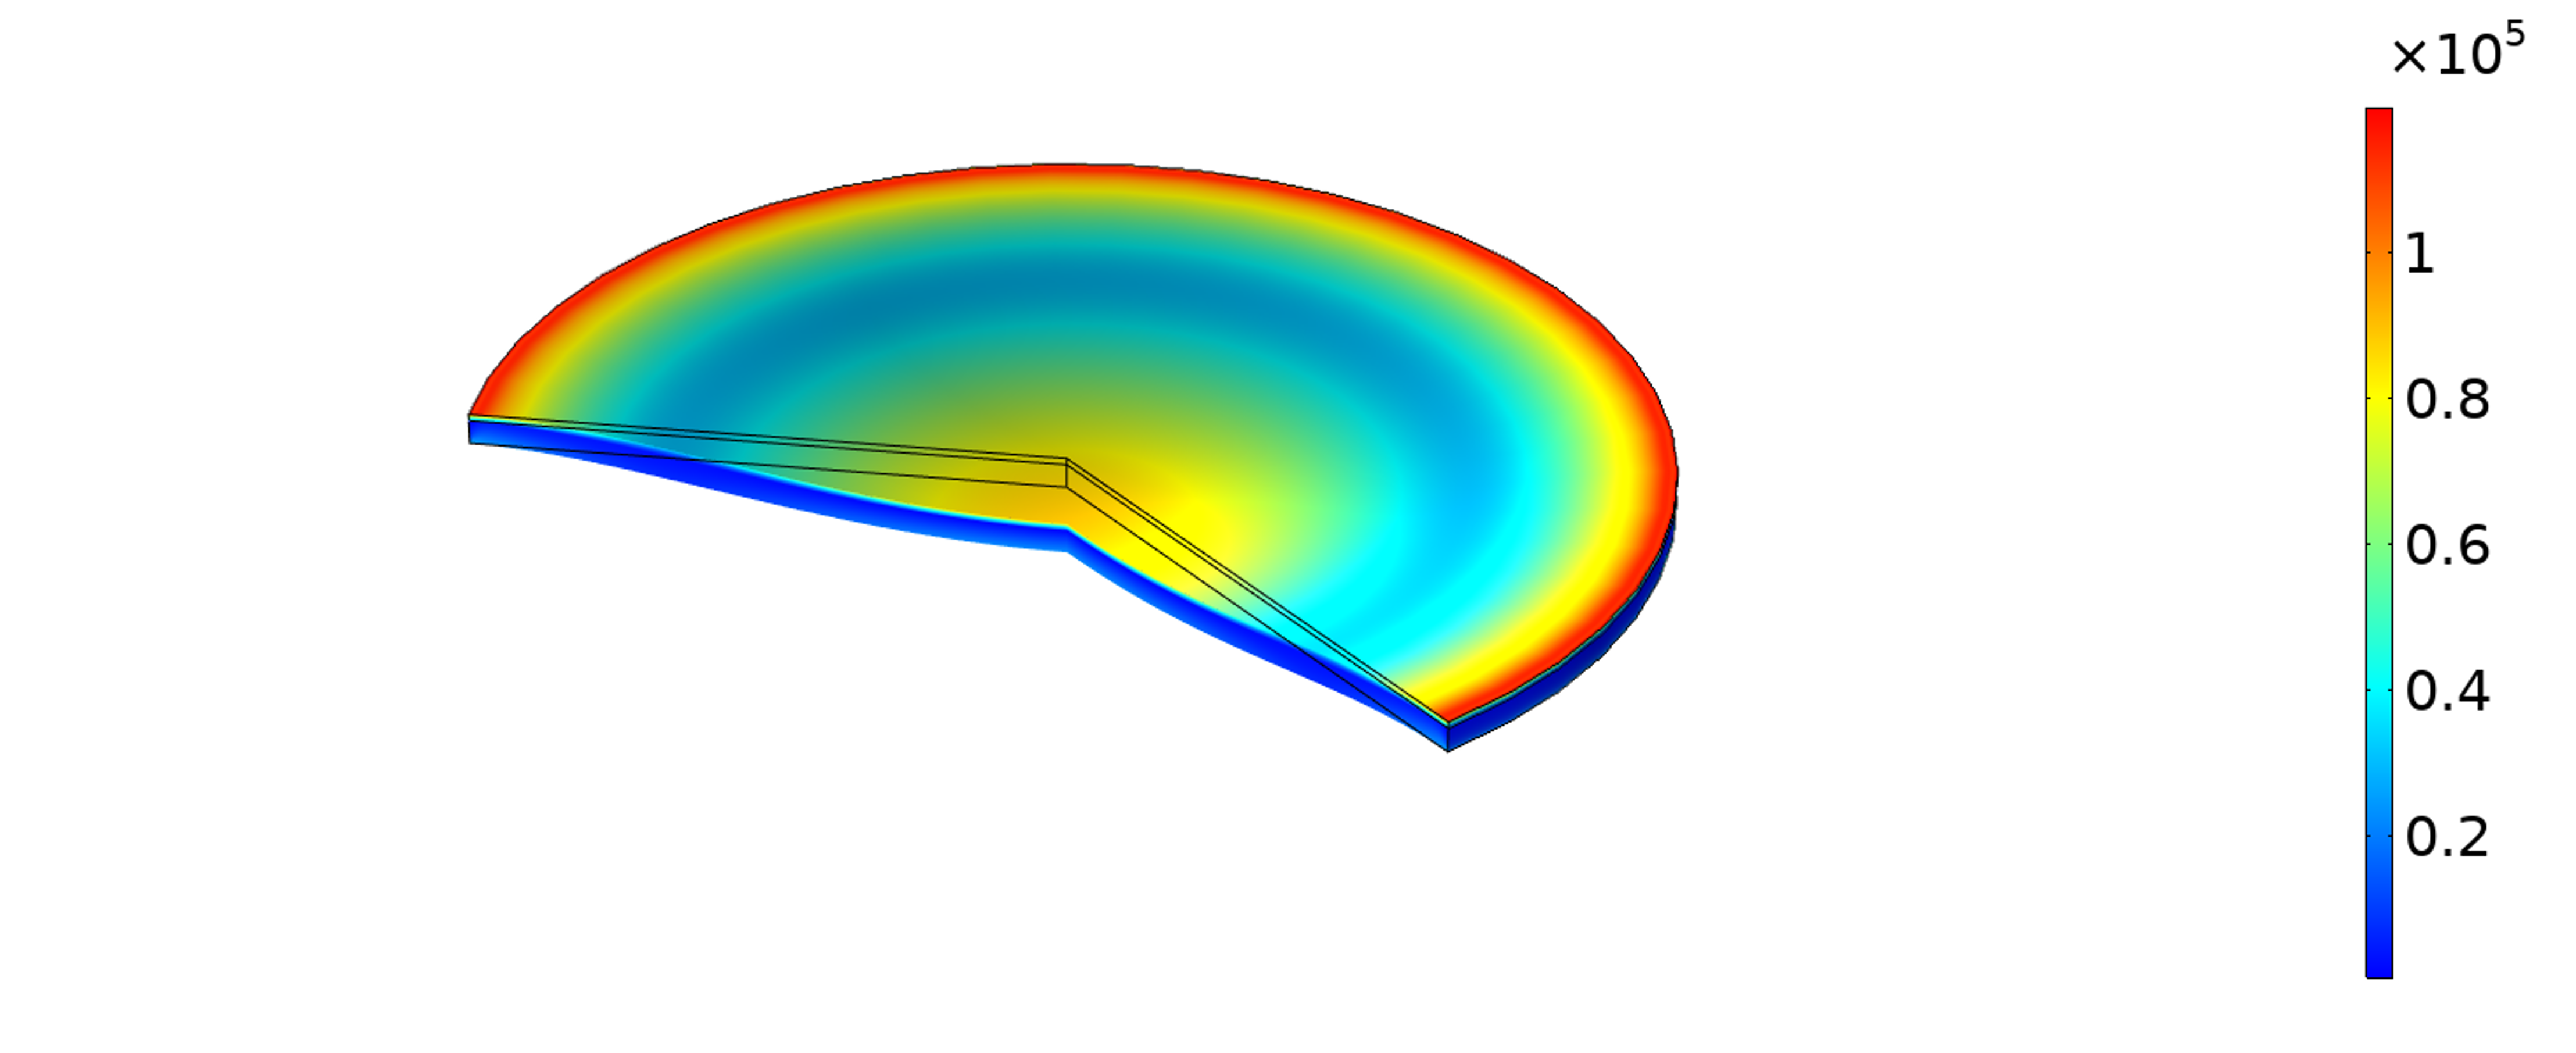
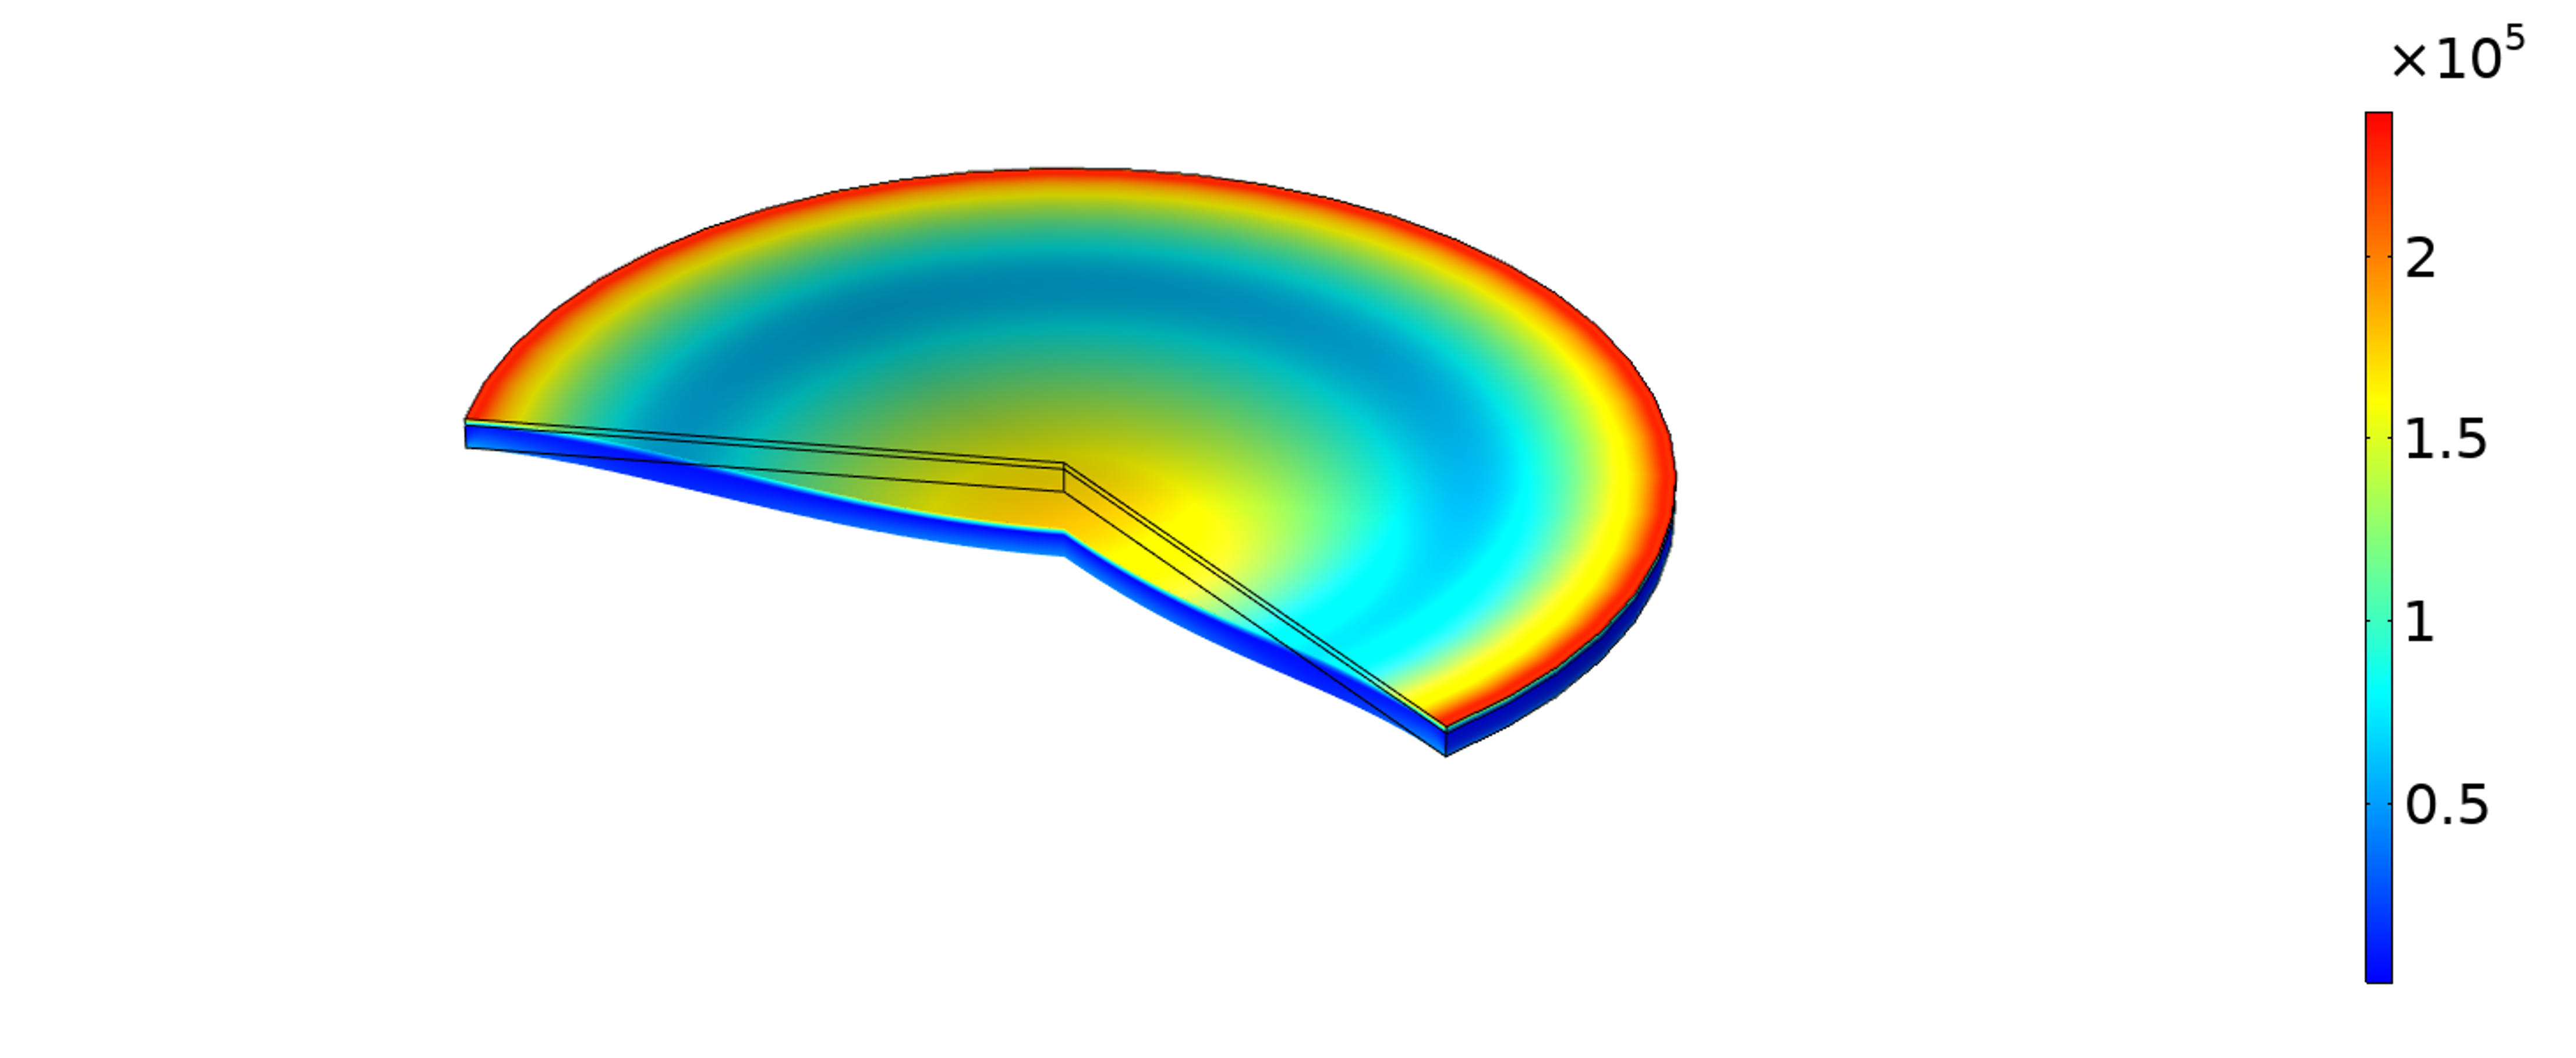
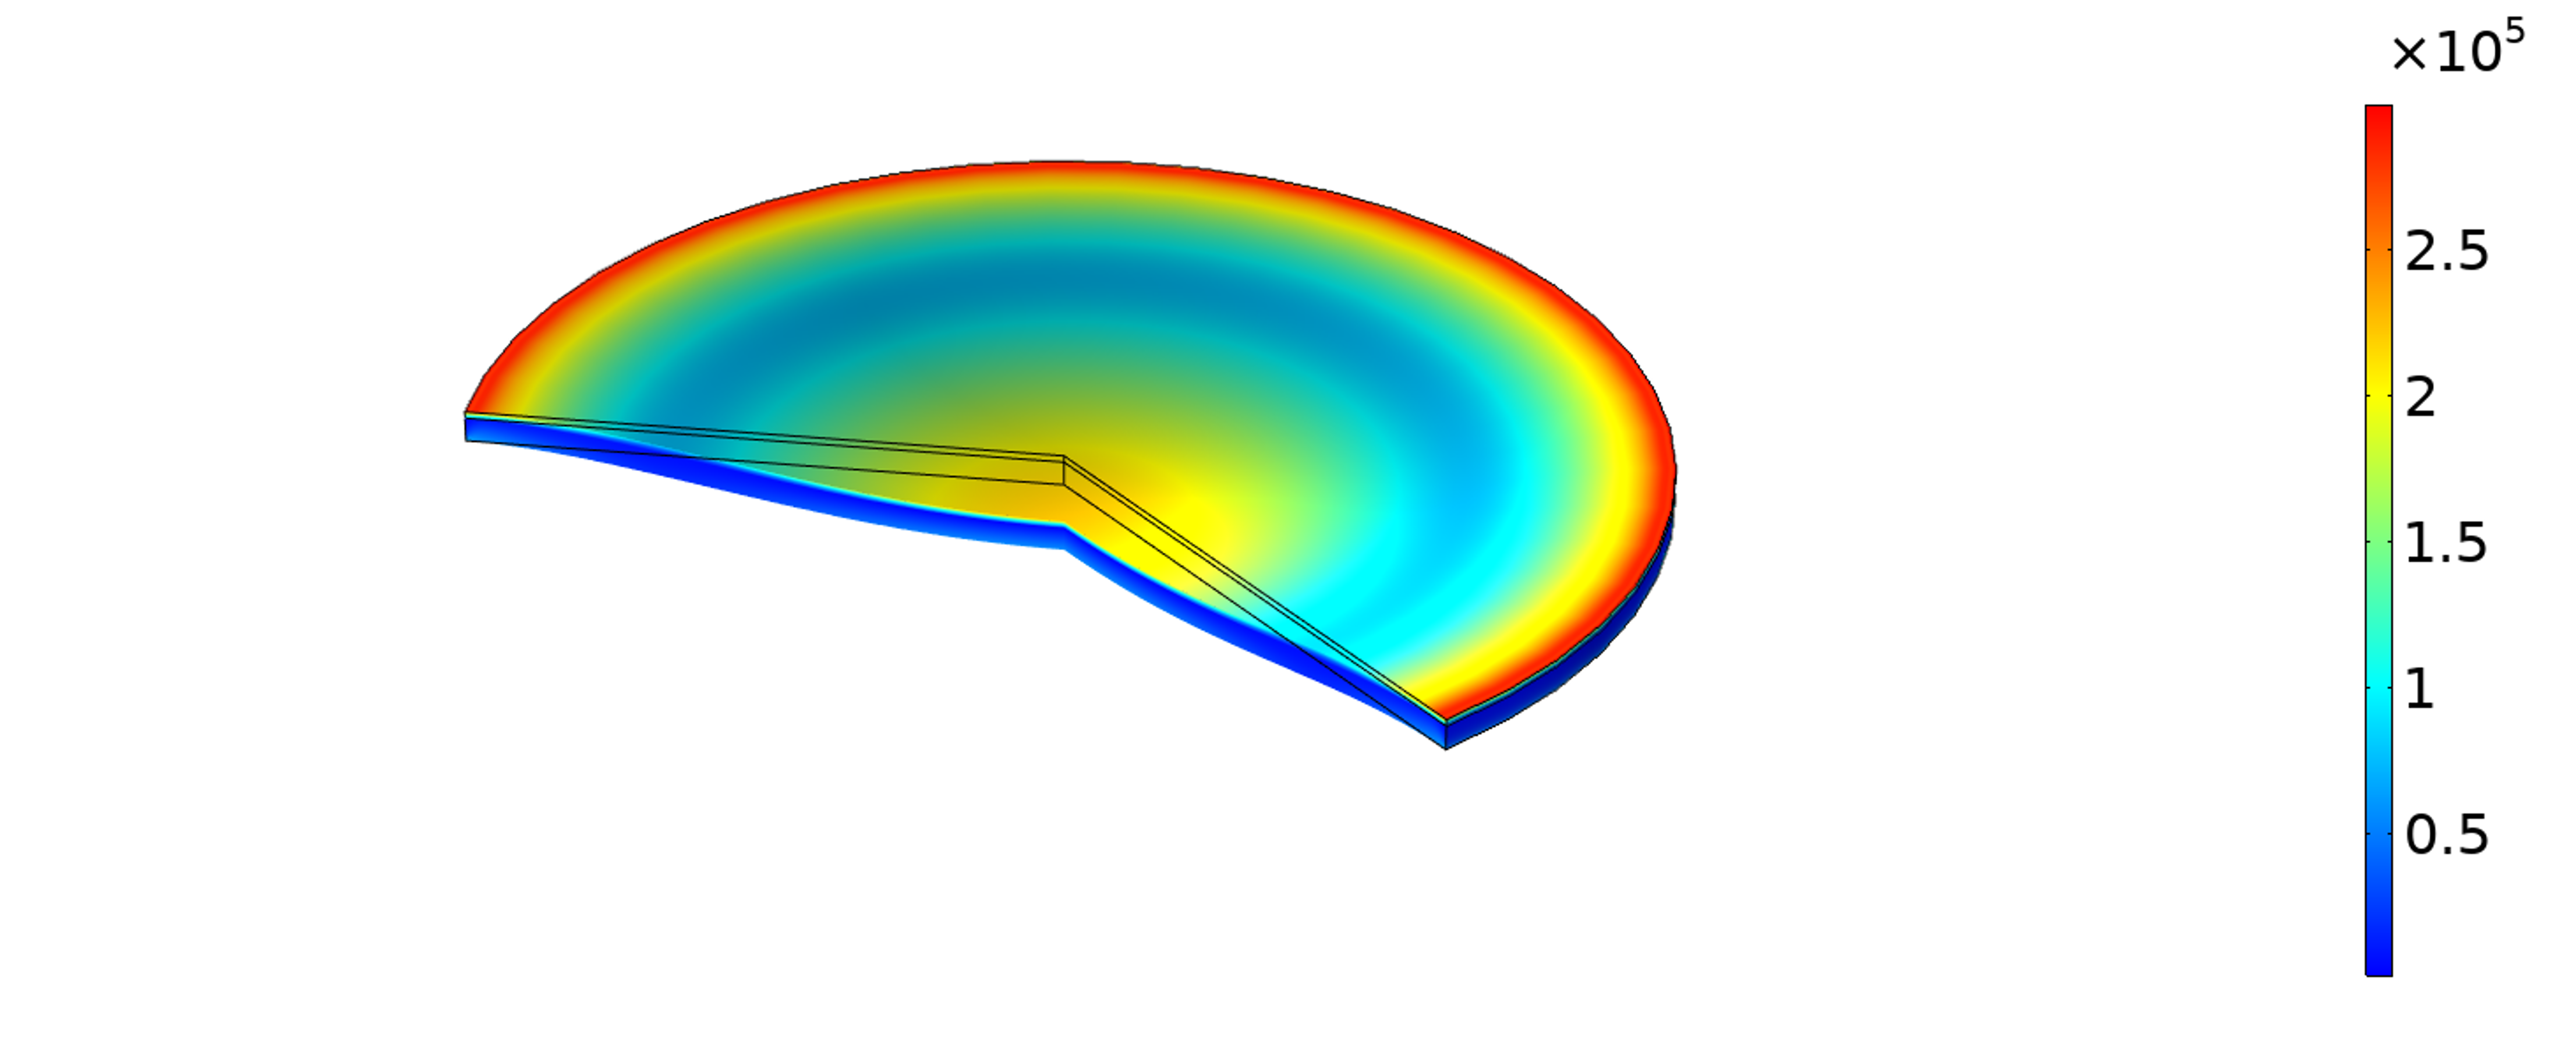
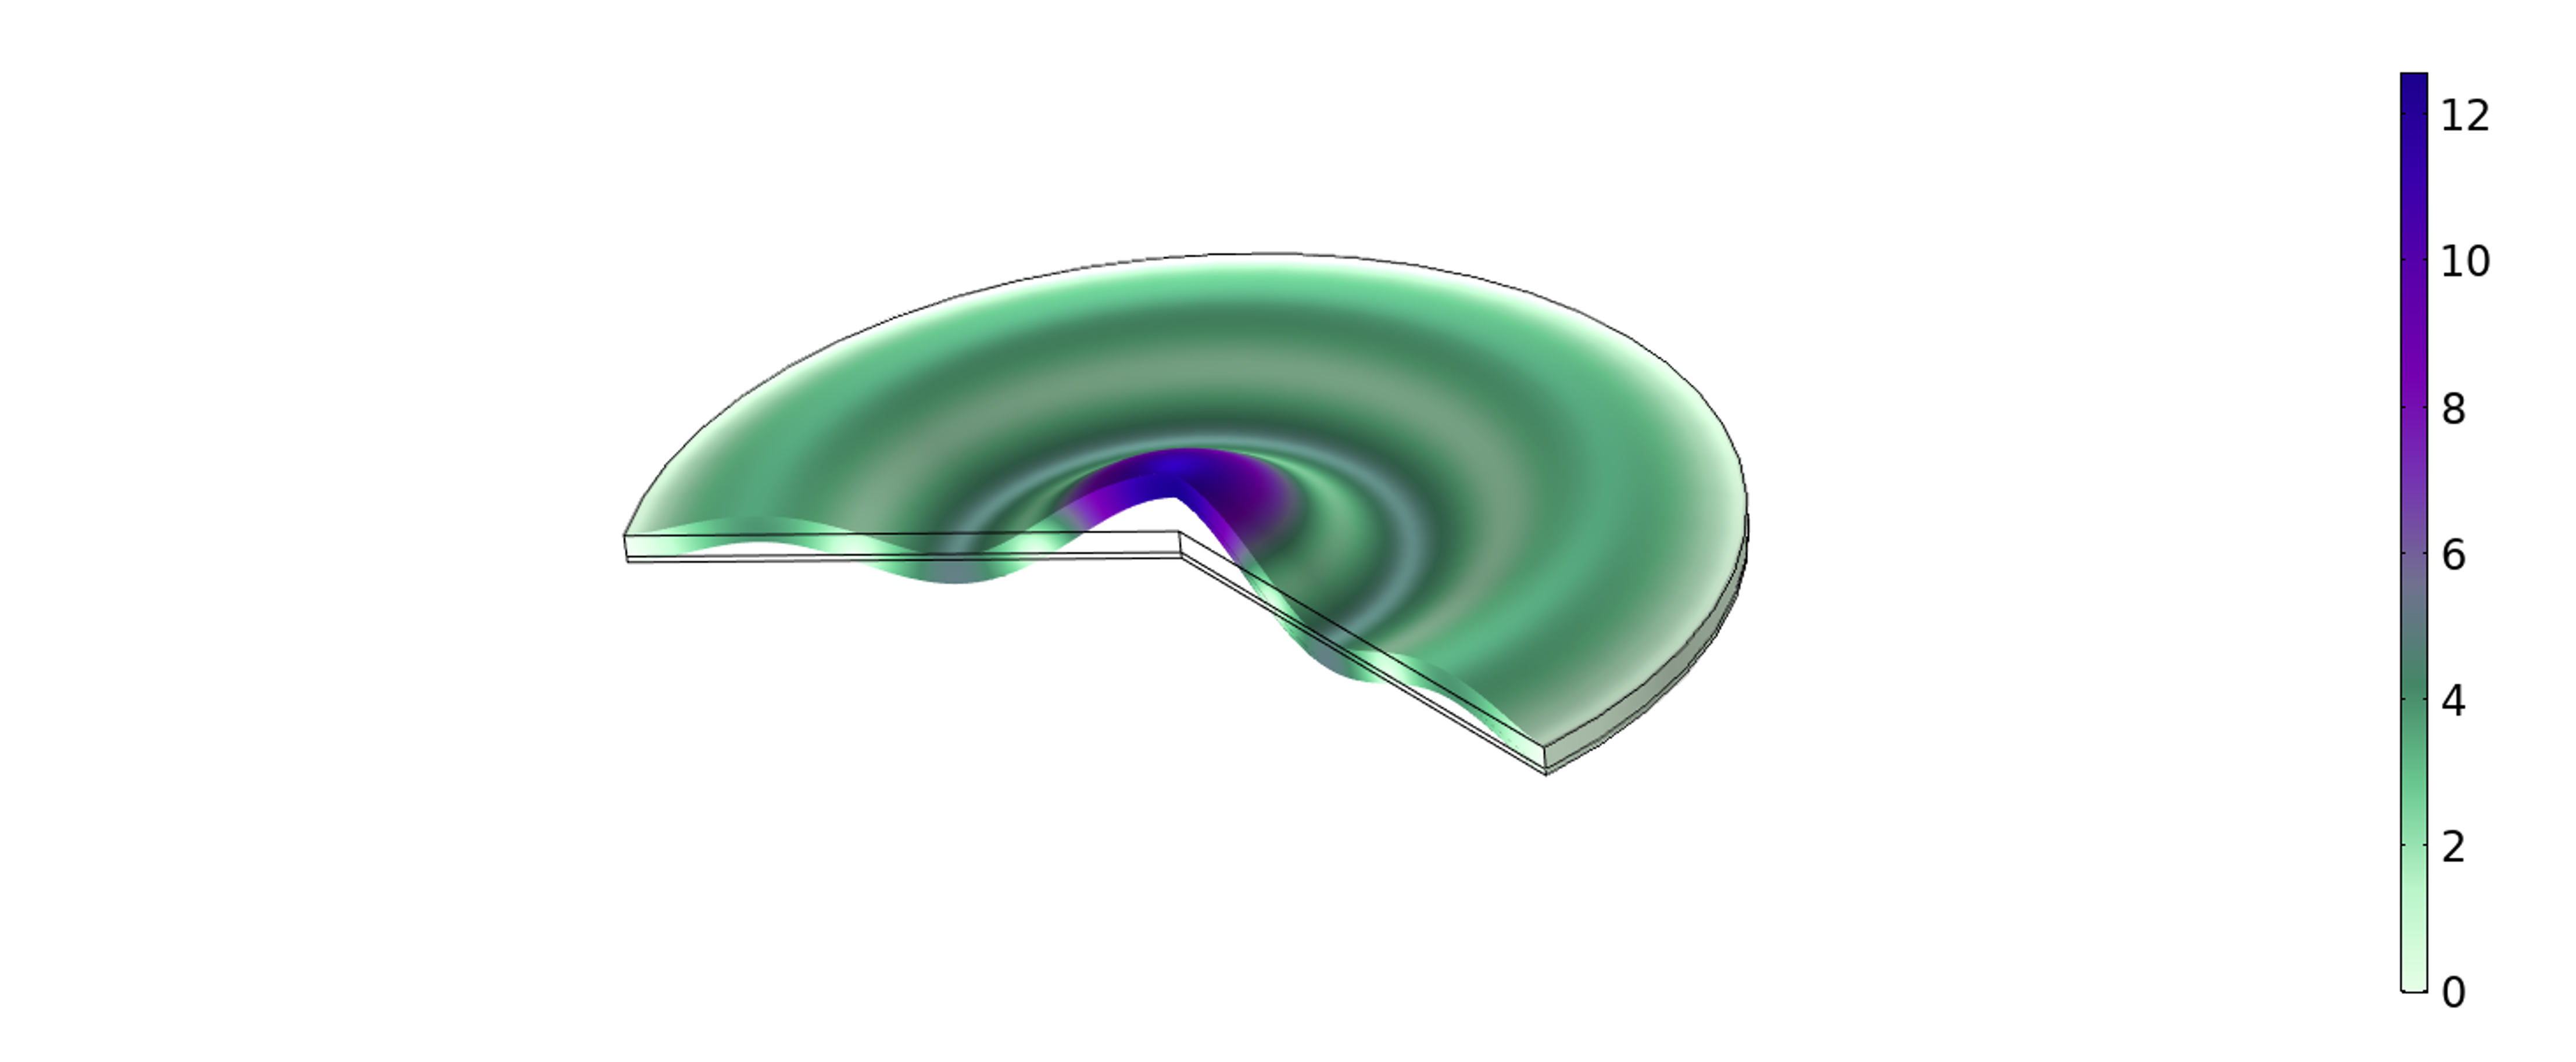
where the densities of the various layers are and respectively. The Finite element modeling of the device was made using COMSOL®. Von Mises stress analysis is given in figure (2).
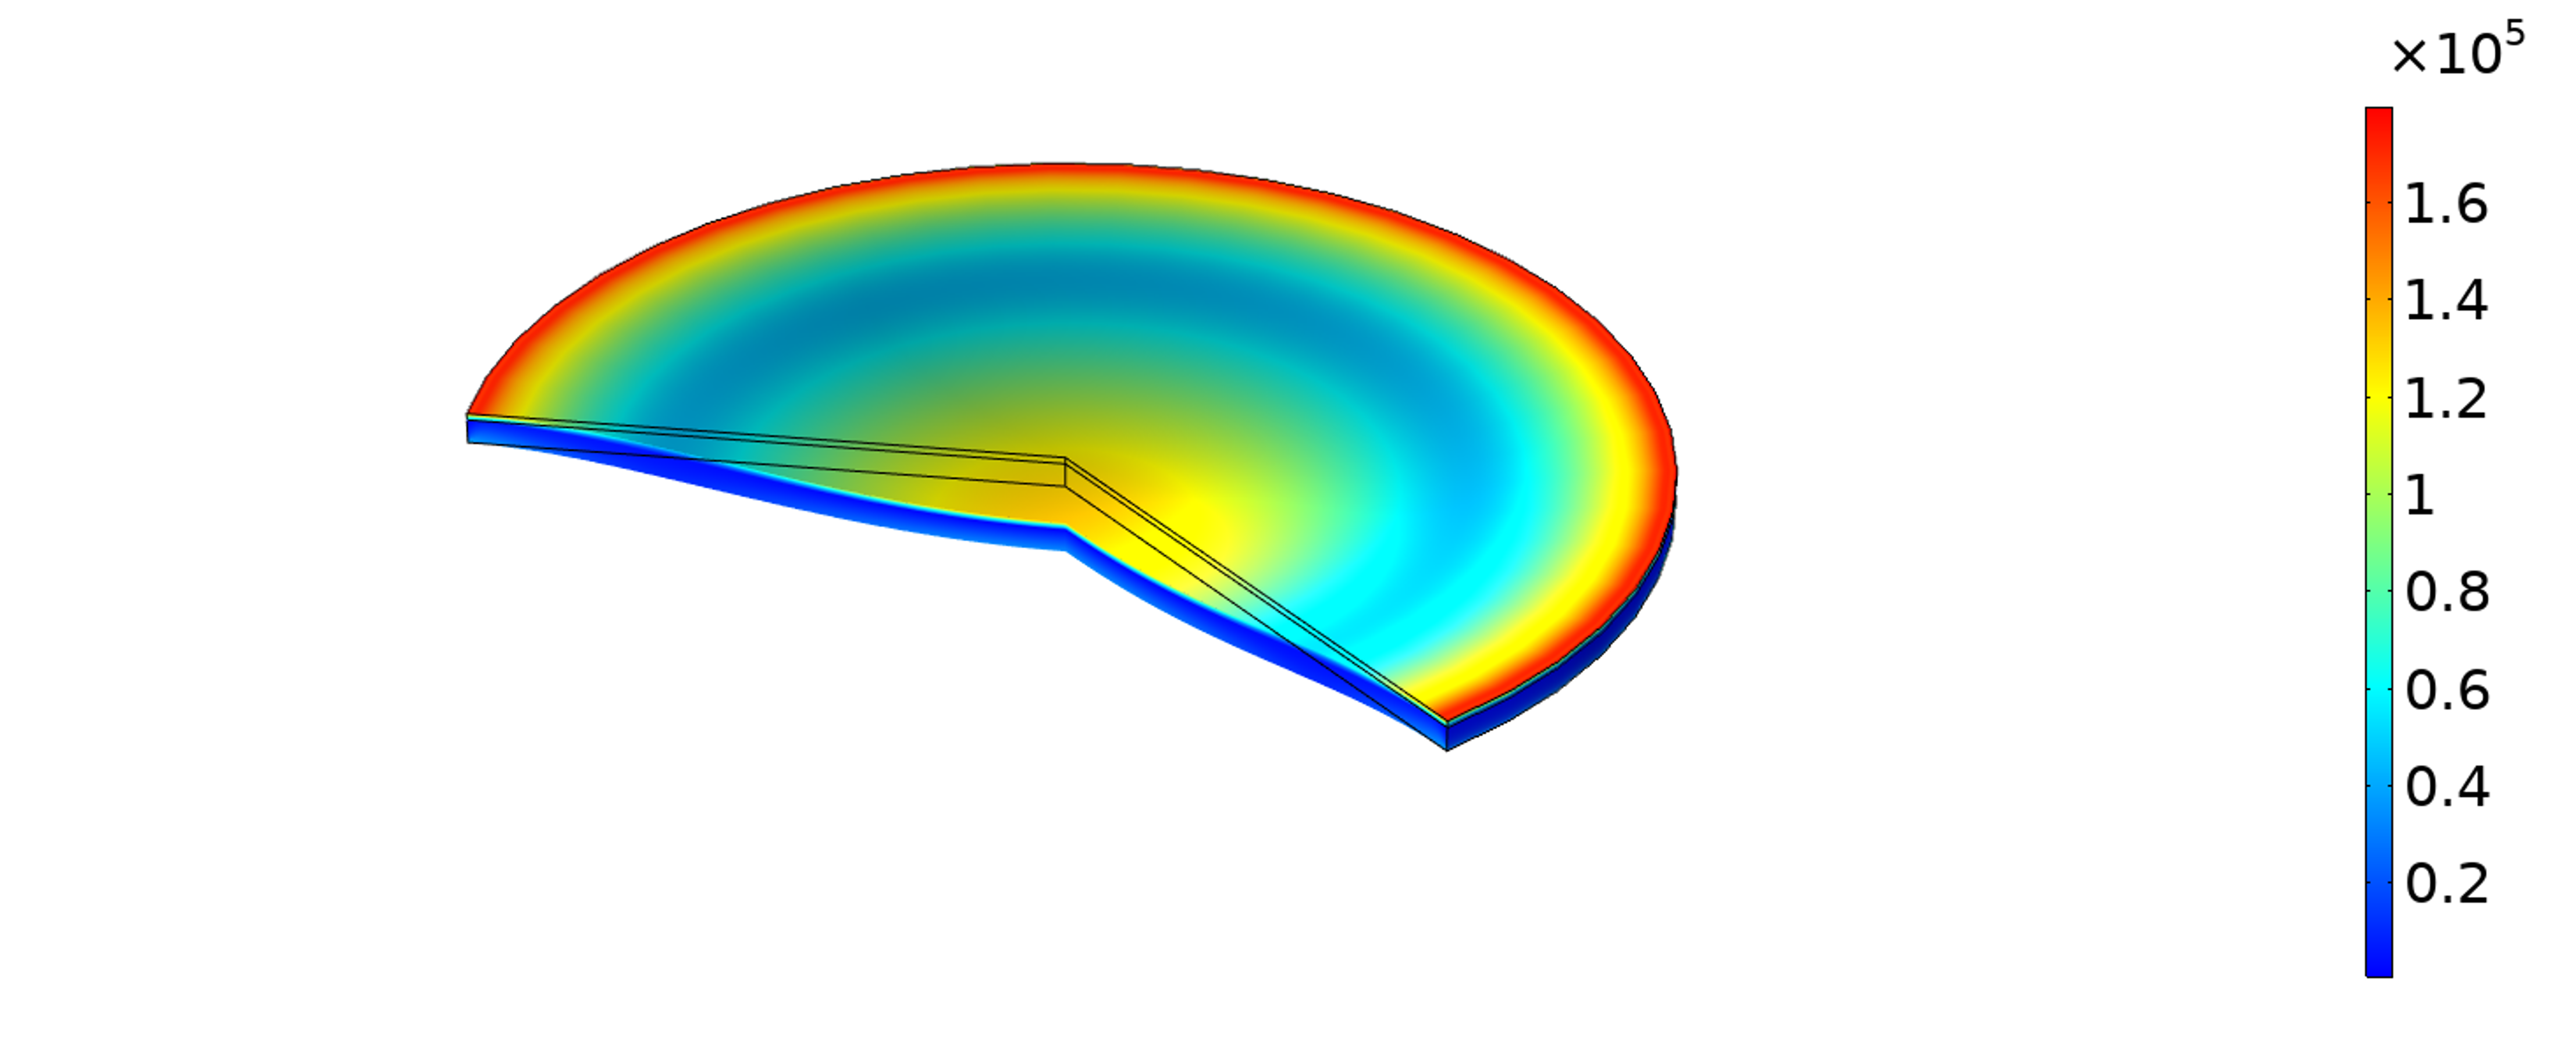
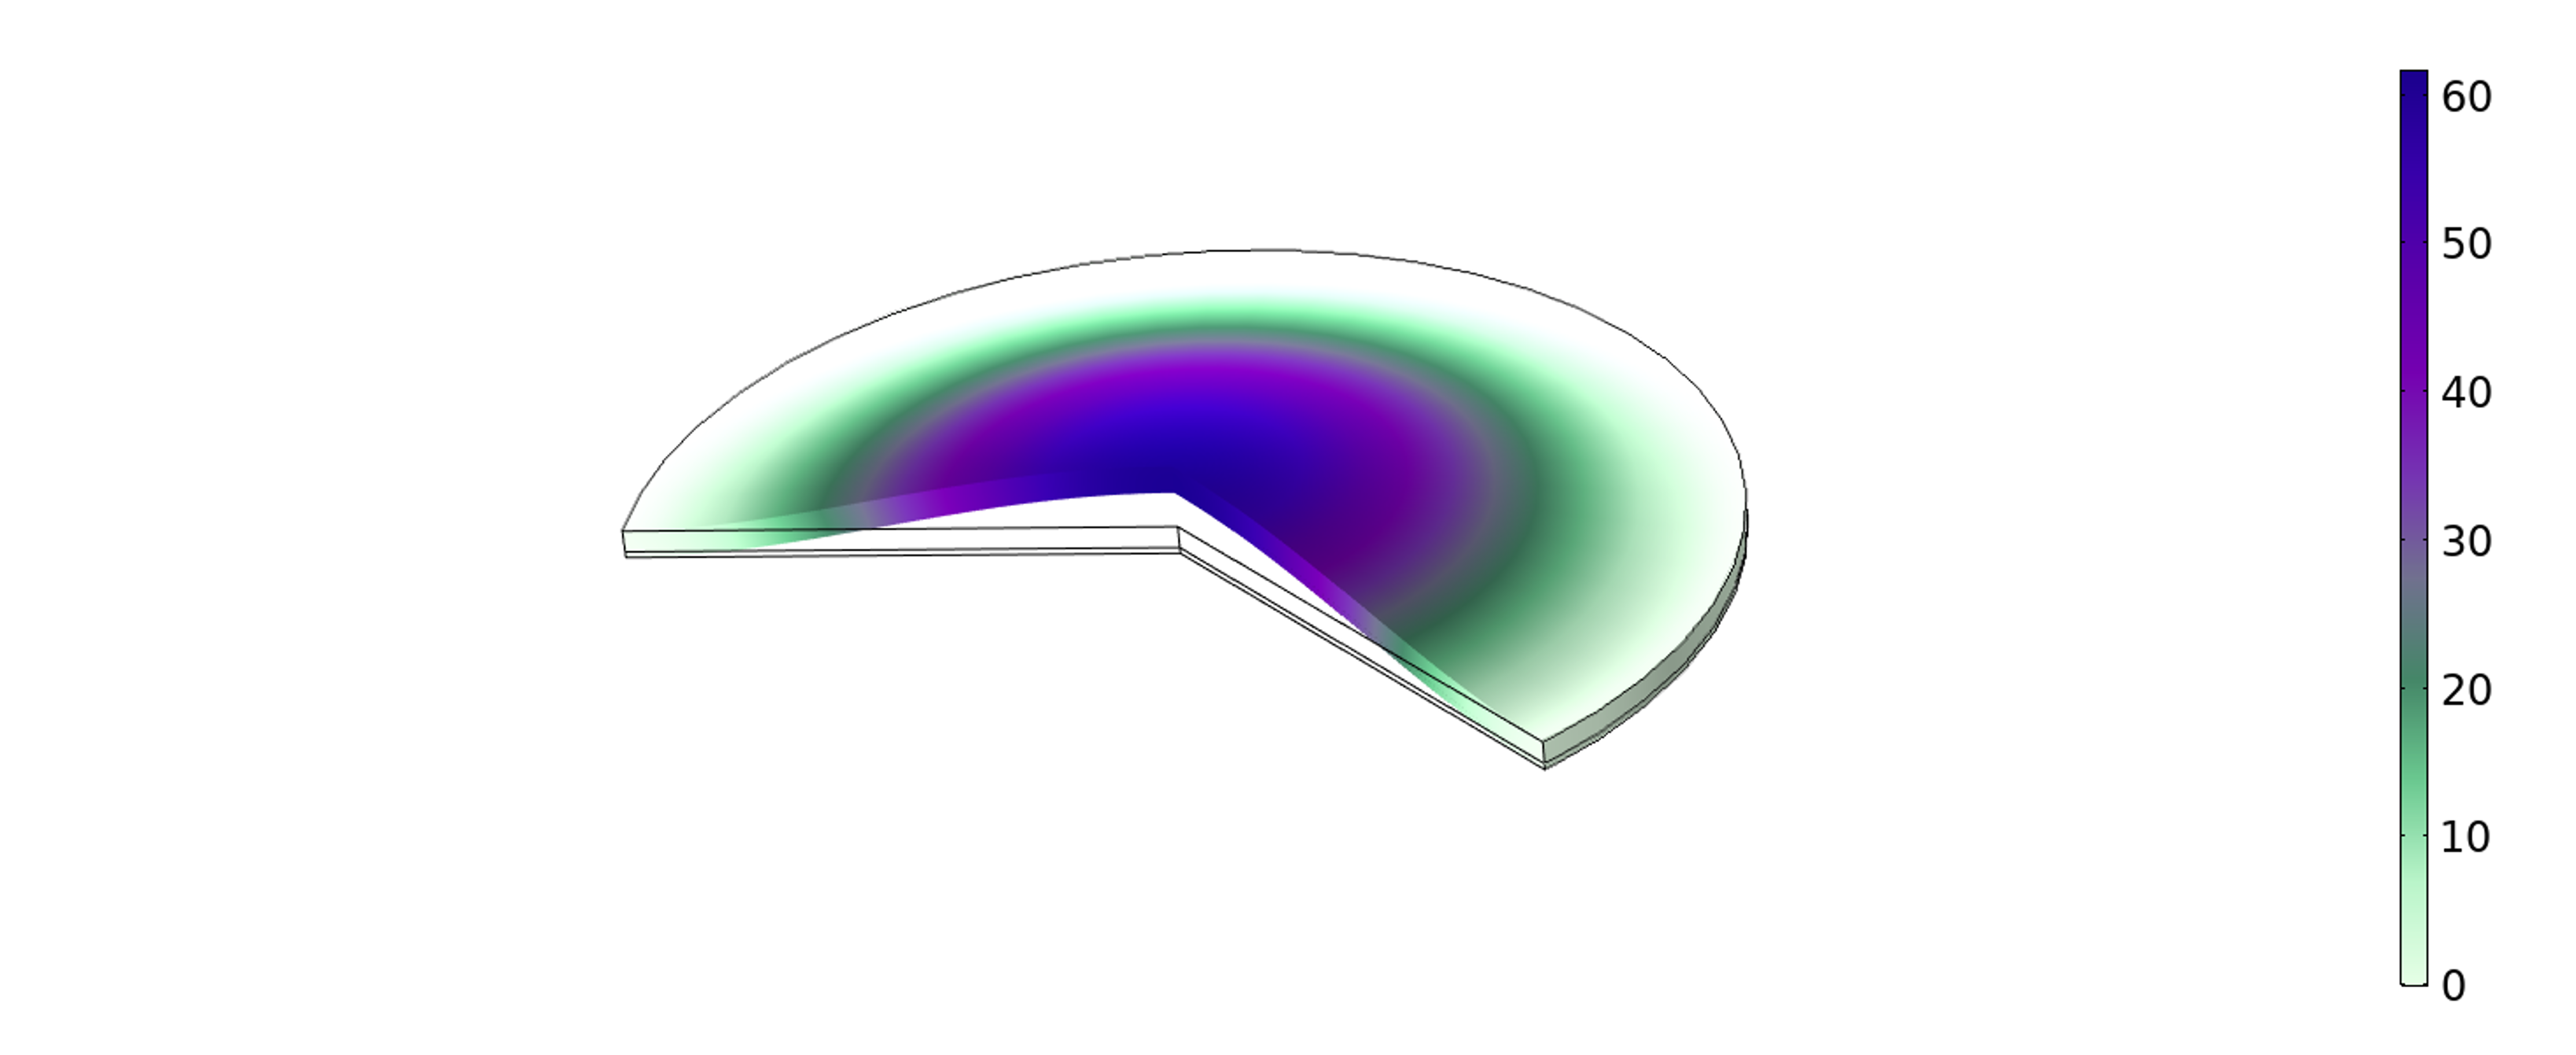
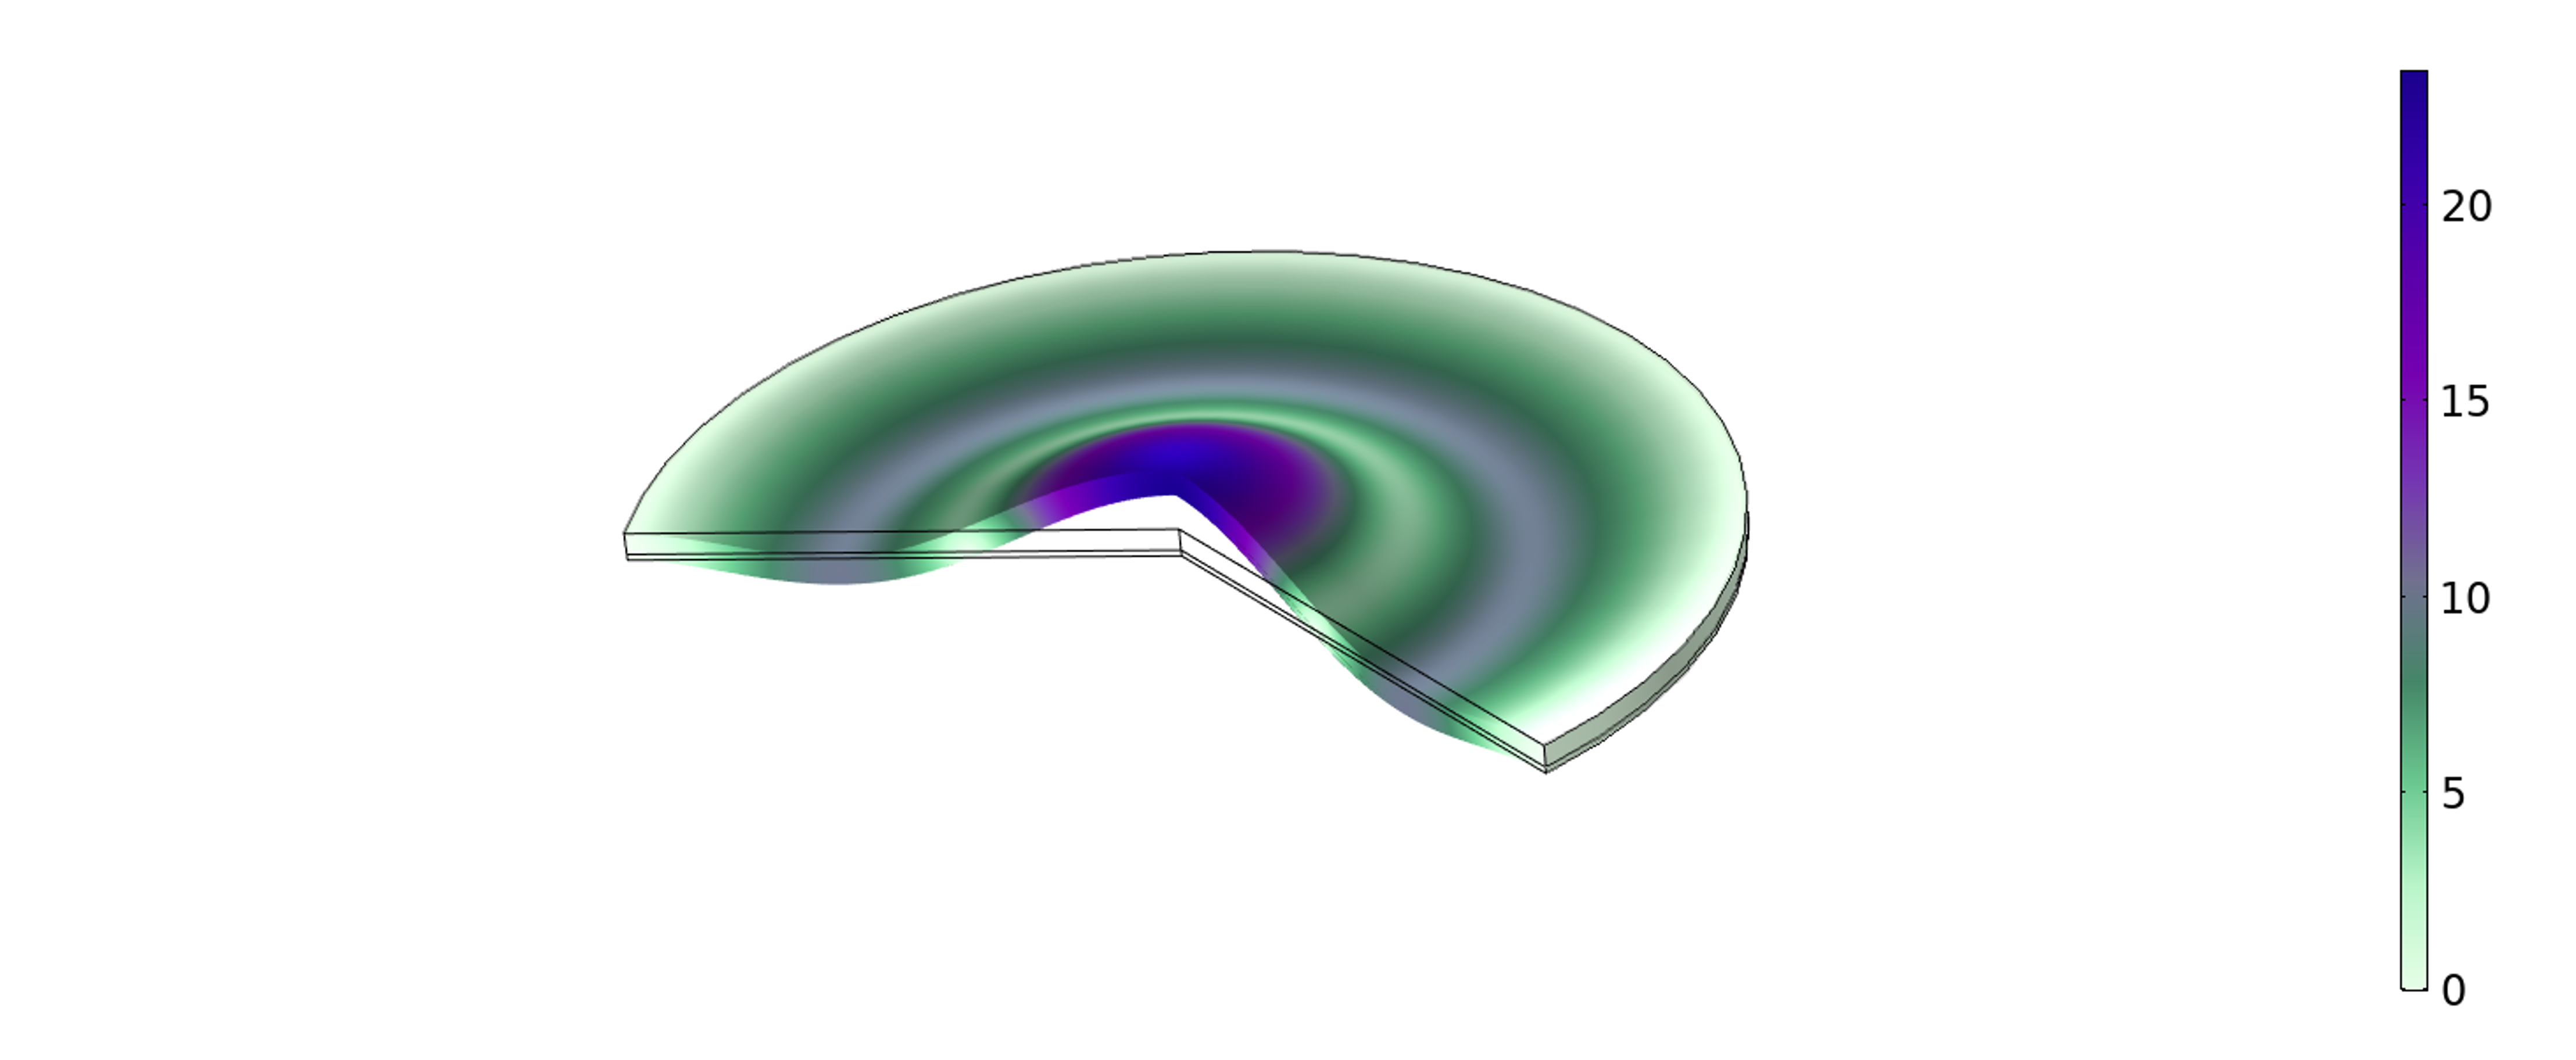
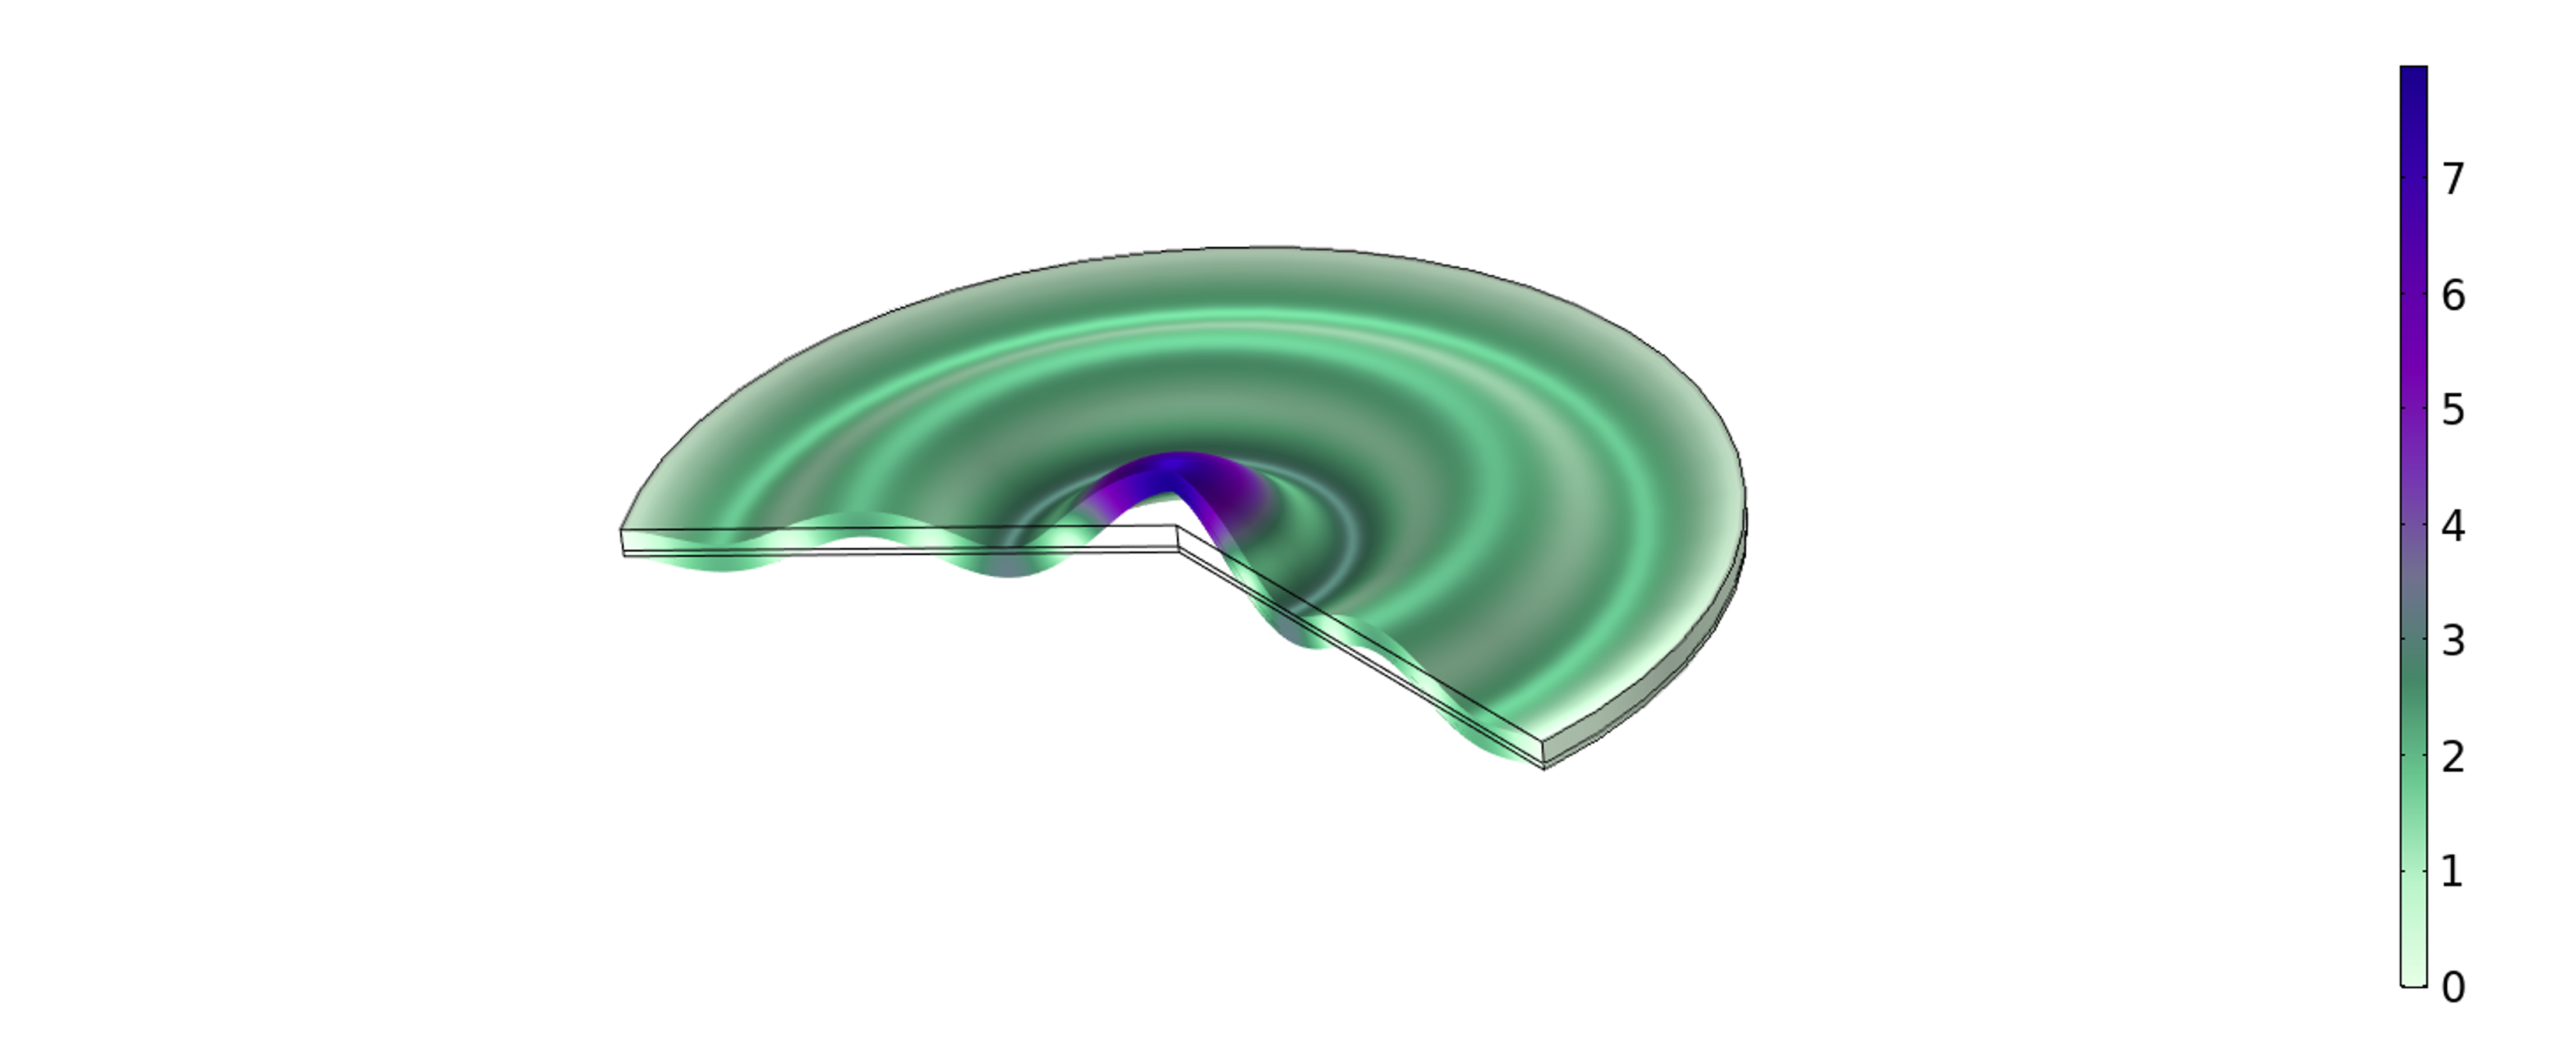
To visualize the modal frequencies of the circular plate, a FEM model for modal analysis is given in figure (3).
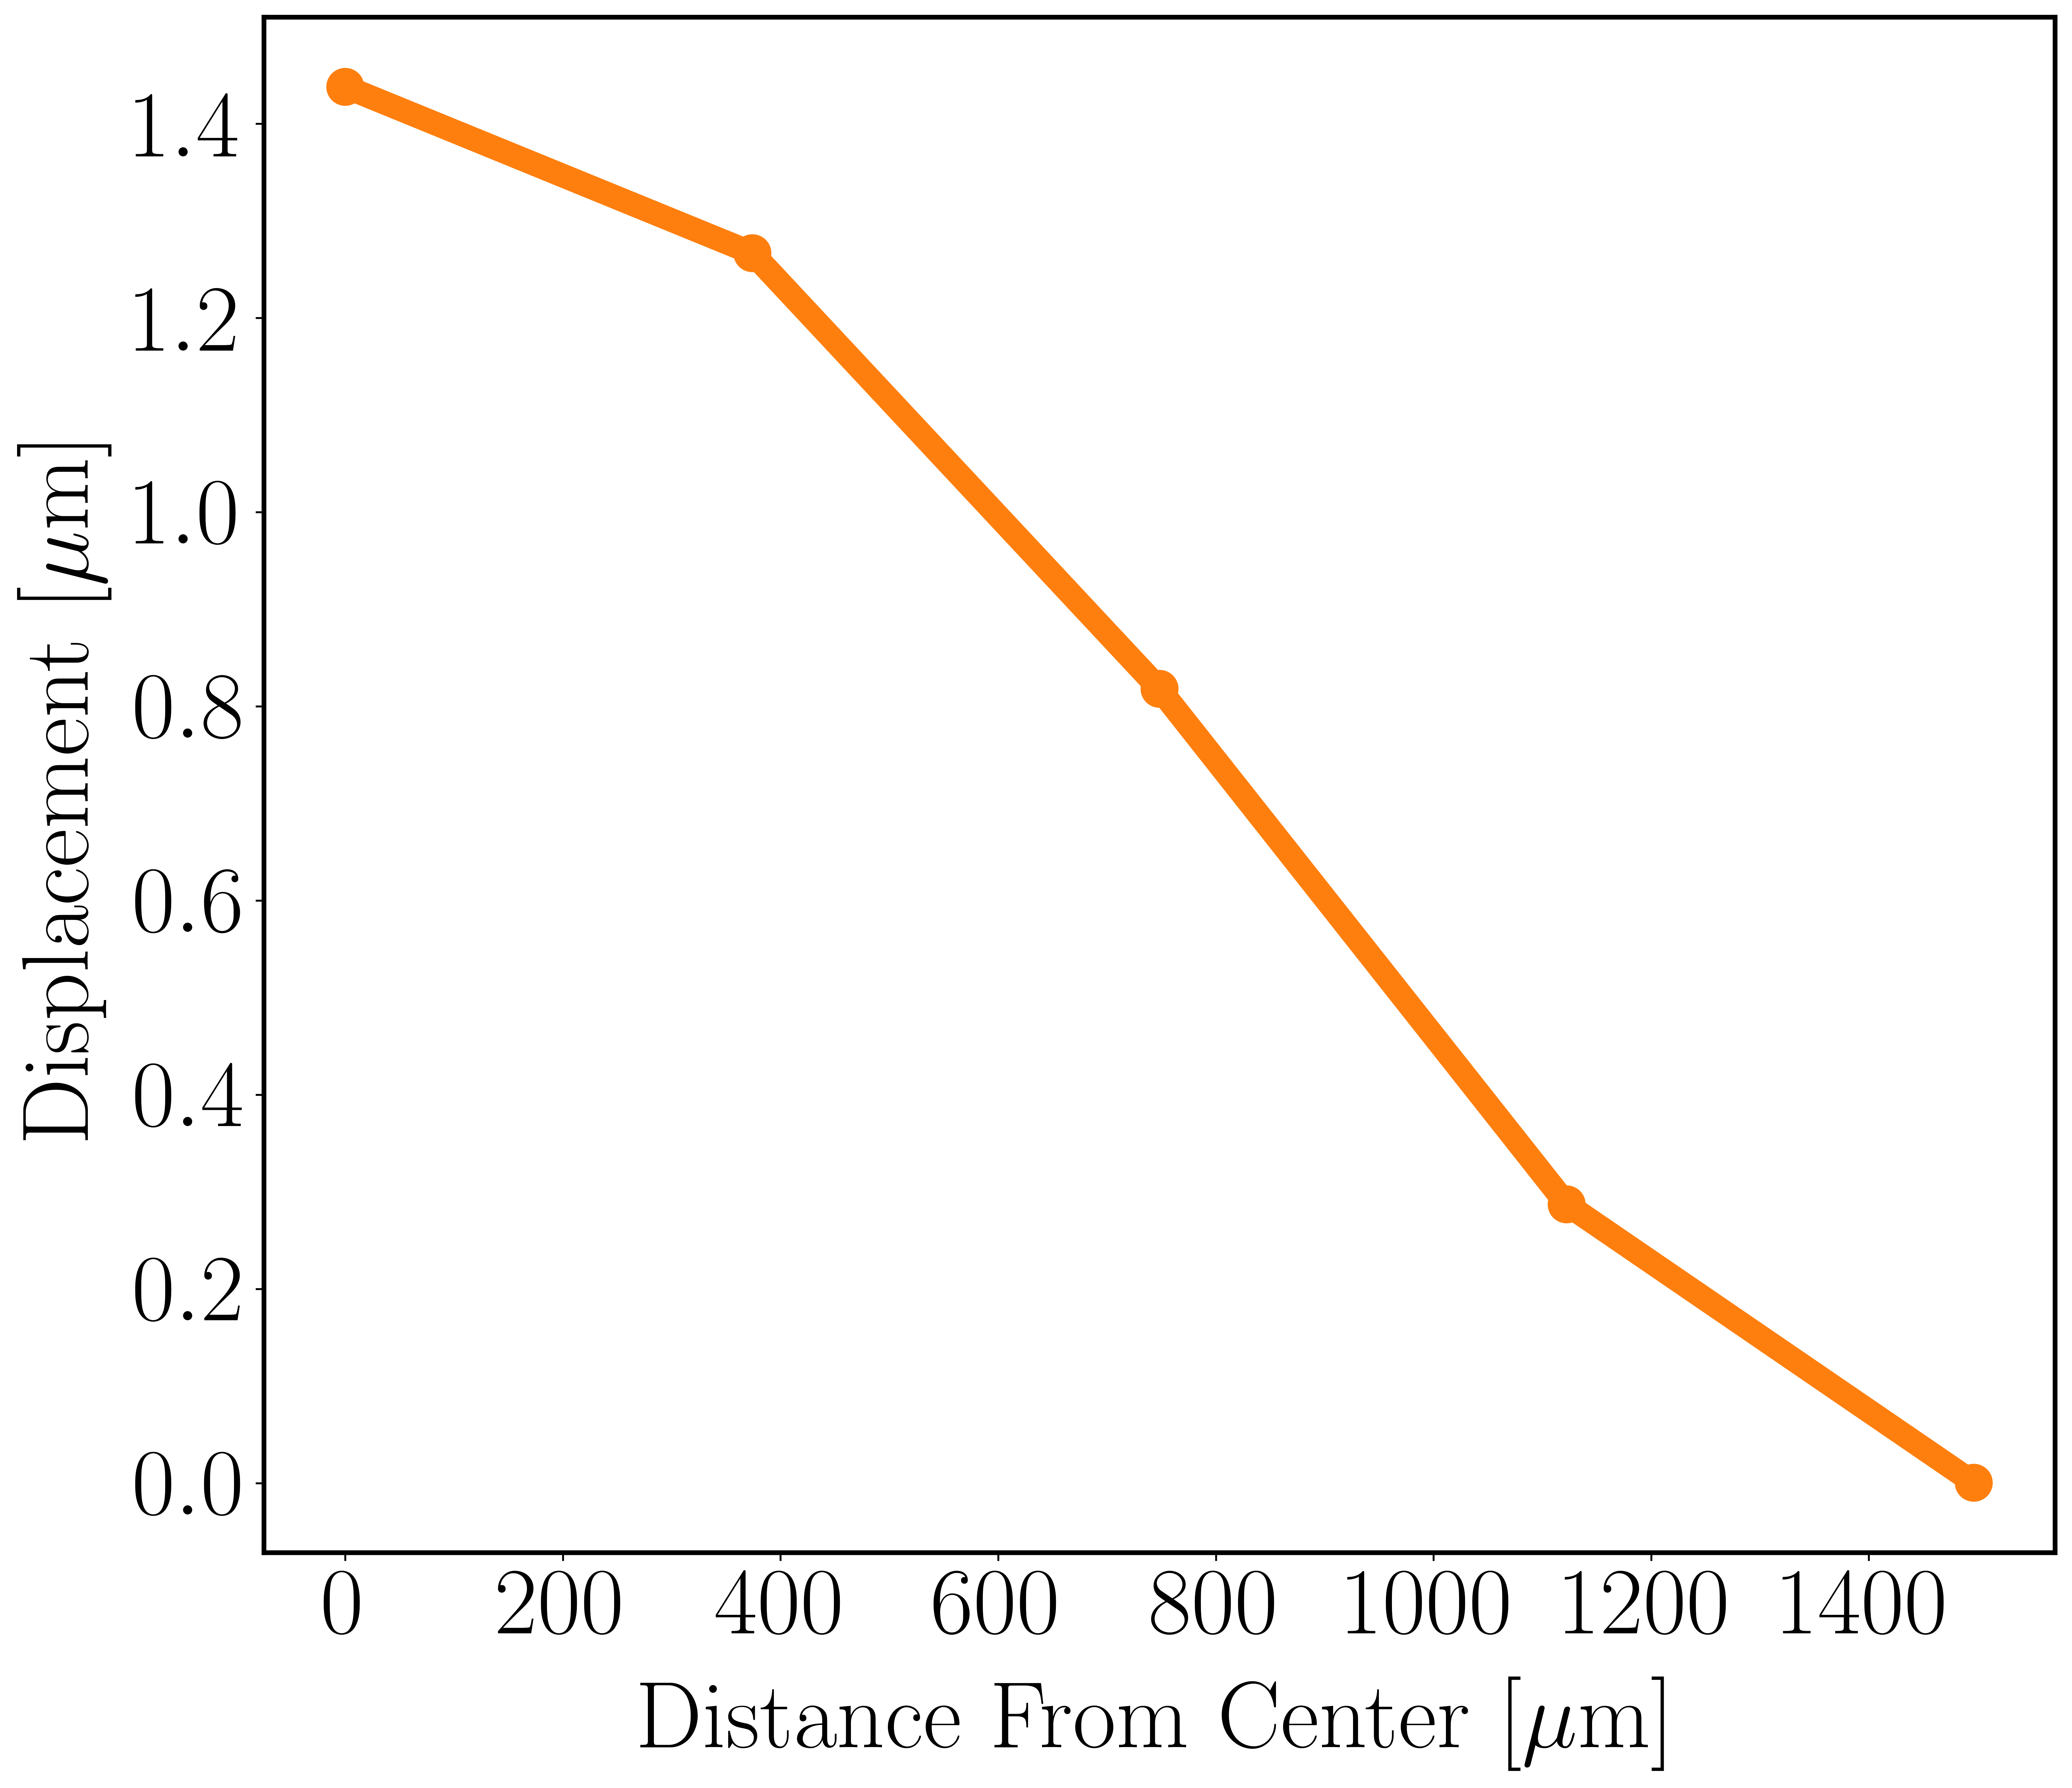
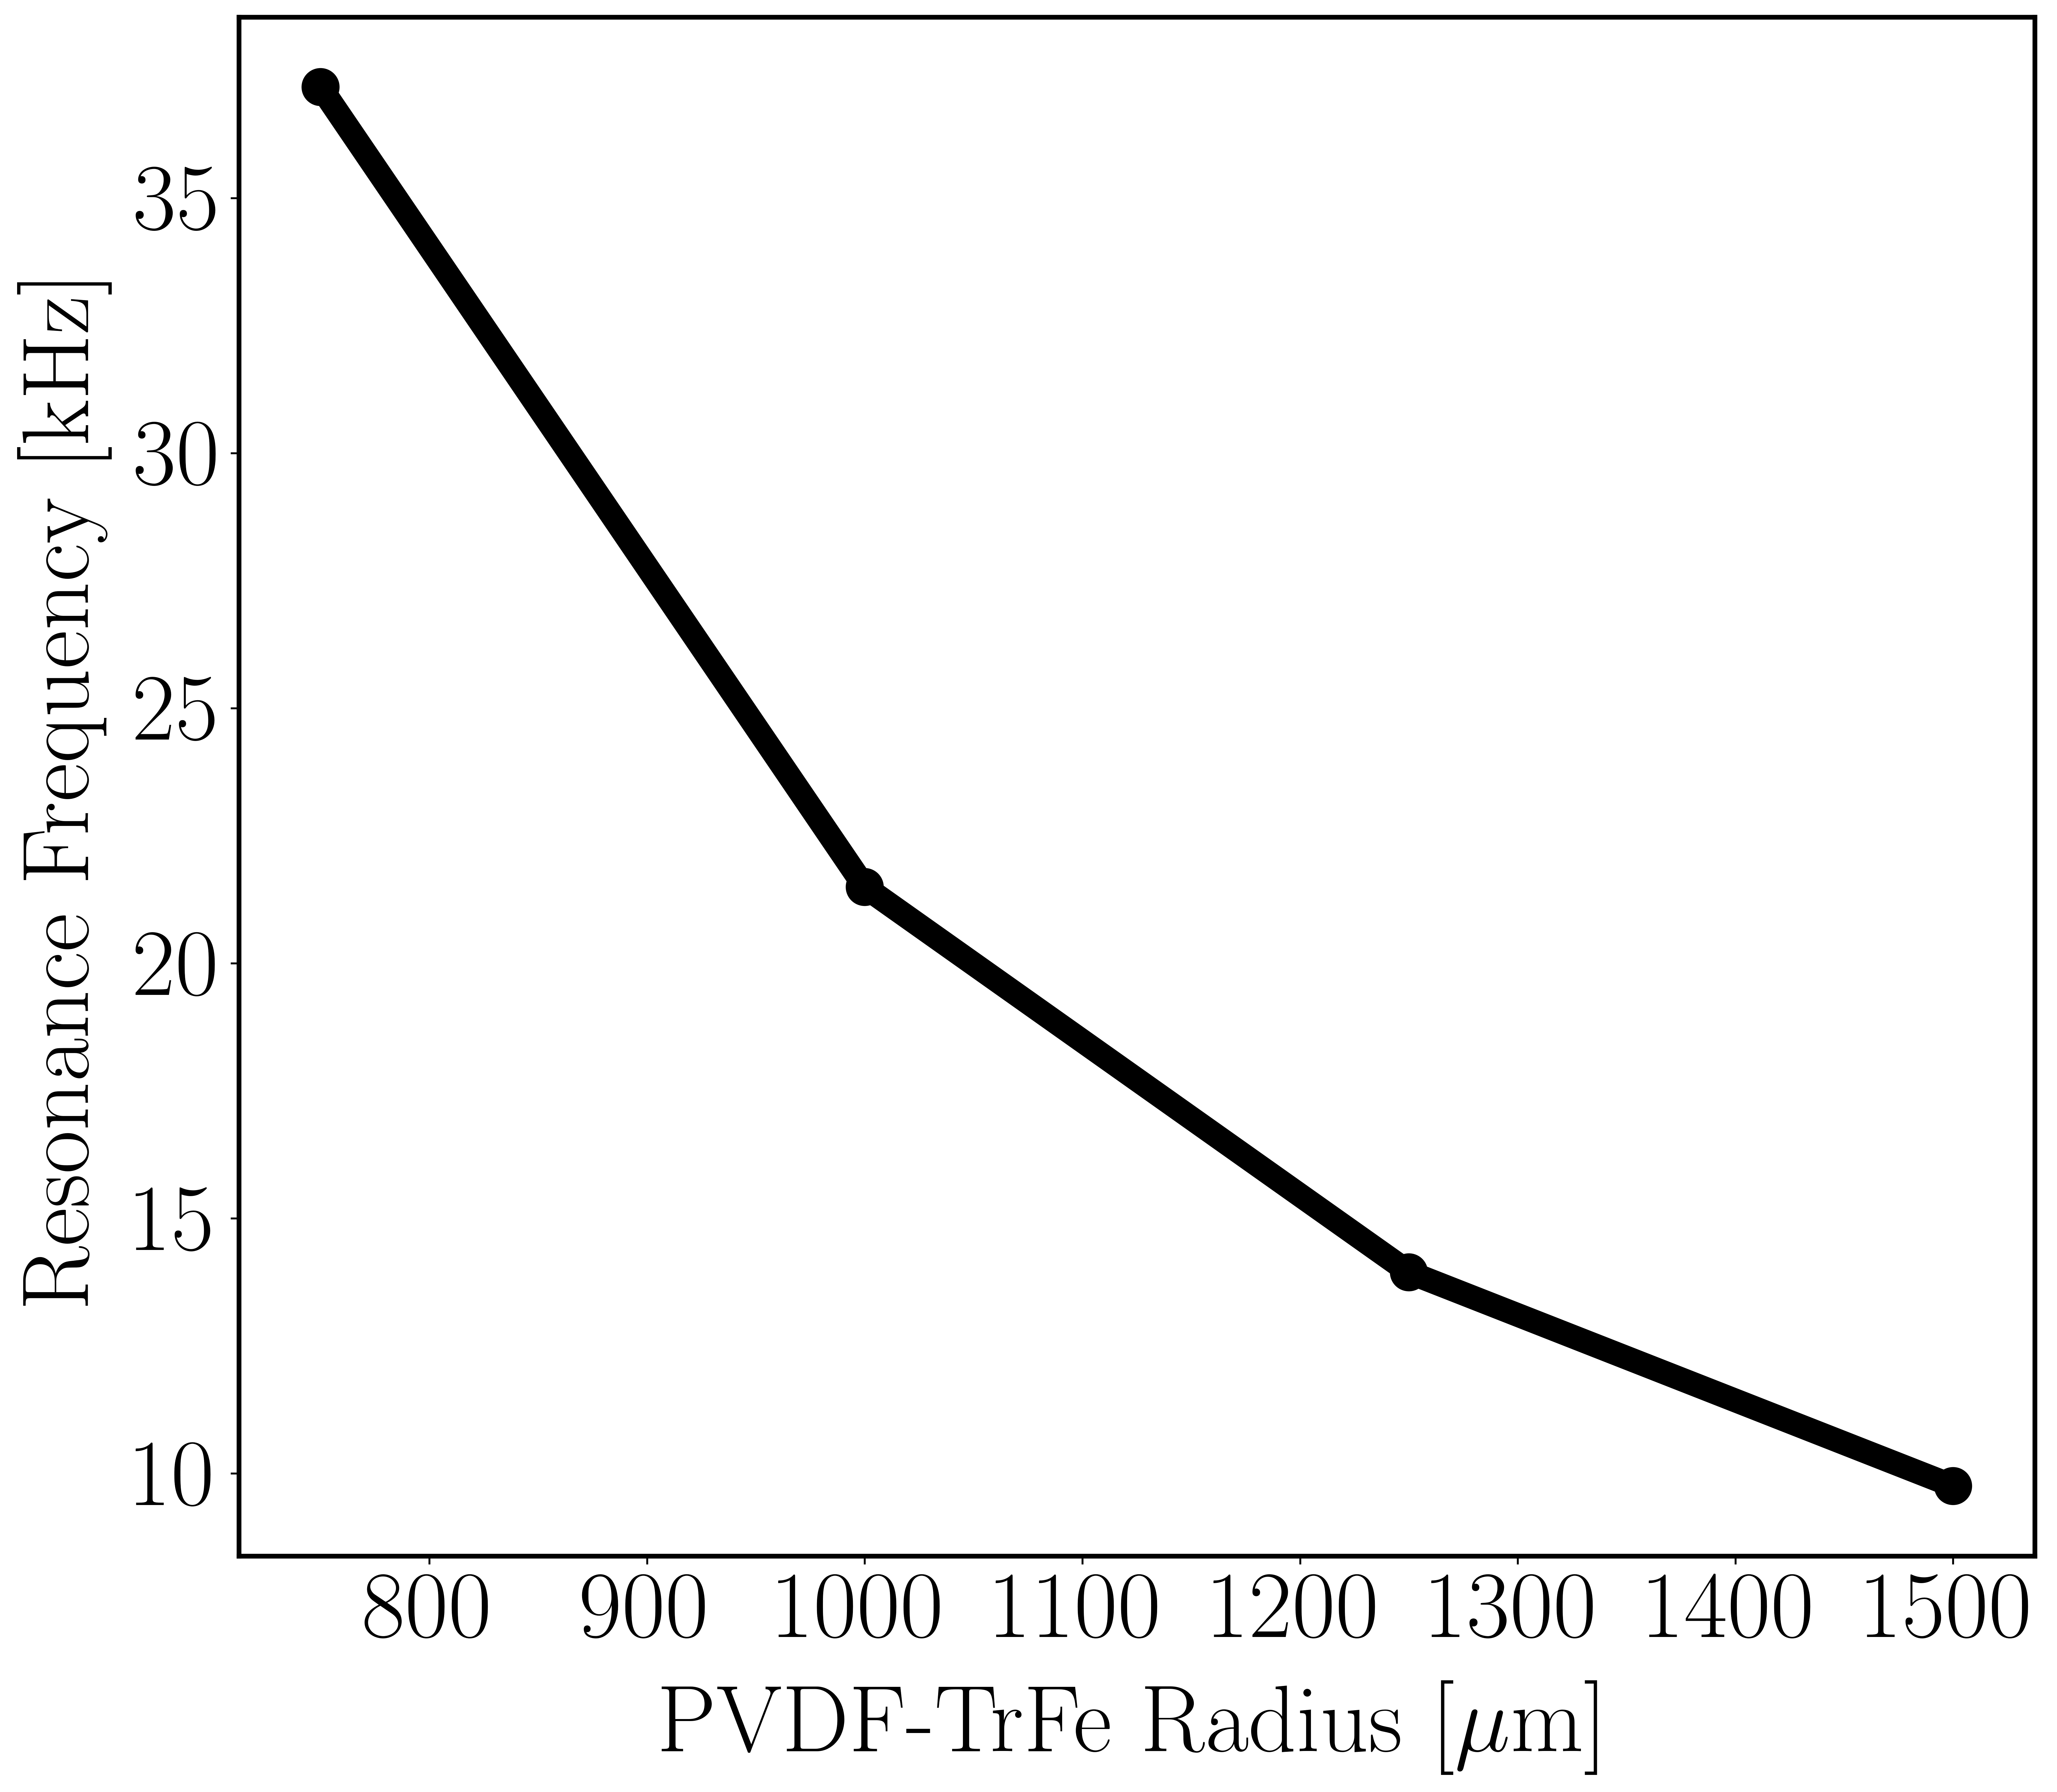
The voltage output plot of the circular plate is given in figure (LABEL:fig:fig6). The simulation was run for increasing radius values for 400 Pa pressure input. For different parametric measurements, mechanical properties of the device for optimization are given in figure (4).
The frequency response of the circular plate is given in figure (5). Phase change, amplitude, damping ratio, and quality factor values are given.
3 Results and Discussion
The experimental platform was constructed as depicted in figure (6) with the device under test . The configuration included a 4-wire Pulse Width Modulation (PWM) fan, an Arduino Uno, a dry air source, and an Adafruit BMP280 pressure sensor breakout board.
A code was built to sense pressure from serial pins dynamically. The Serial Peripheral Interface (SPI) protocol was utilized for communication. Using 3D-printed components, a novel test setup was built. Dry air was directed toward the fan’s rotating propeller, which generates pressure fluctuations by generating intervals. The frequency of these intervals was determined by adjusting the fan’s PWM frequency and operating voltage. PEH was attached close to the fan, so these variations could vibrate it to generate alternating voltage. The maximum wind speed recorded was 20 meters per second. The fan’s rotational speed was confirmed using a tachometer.
Figure (7) depicts the sensor’s voltage output under wind load without any external circuit connection, and the comparison of FEM values against values taken from the wind setup for voltage.
4 Conclusion
In this study, mechanical and electrical characteristics of a piezoelectric wind energy harvester are given. The properties of the output voltage were examined using a wind test instrument. For von Mises stress and modal analysis, finite element modeling (FEM) was used. The circular plate’s resonance frequency sweeps, quality factors, and damping ratios were given numerically. For a PVDF-TrFe piezoelectric layer with a thickness of 18 m and a radius of 1.5 mm, the damping ratio and quality factor were calculated to be 0.117 and 4.284, respectively. was determined to be 984 mV based on the wind configuration and compared to the FEM outputs.
Acknowledgment
B.K. did the experiments and wrote the paper. L.B. supervised the research and gave feedback for publication.
References
- [1] Qian, F., Hajj, M. R., Zuo, L. (2020). Bio-inspired bi-stable piezoelectric harvester for broadband vibration energy harvesting. Energy Conversion and Management, 222, 113174. doi:10.1016/j.enconman.2020.113174
- [2] Li, X., Yu, K., Upadrashta, D., Yang, Y. (2019). Multi-branch sandwich piezoelectric energy harvester: mathematical modeling and validation. Smart Materials and Structures, 28(3), 035010. doi:10.1088/1361-665x/aaf8bf
- [3] Ramírez, J. M., Gatti, C. D., Machado, S. P., Febbo, M. (2018). A piezoelectric energy harvester for rotating environment using a linked E-shape multi-beam. Extreme Mechanics Letters. doi:10.1016/j.eml.2018.12.005
- [4] Toprak, A., Tigli, O. (2014). Piezoelectric energy harvesting: State-of-the-art and challenges. Applied Physics Reviews, 1(3), 031104. doi:10.1063/1.4896166
- [5] Morimoto, K., Kanno, I., Wasa, K., Kotera, H. (2010). High-efficiency piezoelectric energy harvesters of c-axis-oriented epitaxial PZT films transferred onto stainless steel cantilevers. Sensors and Actuators A: Physical, 163(1), 428–432. doi:10.1016/j.sna.2010.06.028
- [6] Horowitz, S. B., Sheplak, M., Cattafesta, L. N., Nishida, T. (2006). A MEMS acoustic energy harvester. Journal of Micromechanics and Microengineering, 16(9), S174–S181. doi:10.1088/0960-1317/16/9/s02
- [7] X. Wang, J. Song, J. Liu, and Z. L. Wang, Science 316(5821), 102–105 (2007).
- [8] Y. Hu, Y. Zhang, C. Xu, L. Lin, R. L. Snyder, and Z. L. Wang, Nano Lett. 11(6), 2572–2577 (2011).
- [9] Y. Hu, C. Xu, Y. Zhang, L. Lin, R. L. Snyder, and Z. L. Wang, Adv. Mater. 23(35), 4068–4071 (2011).
- [10] L. Lin, Y. Hu, C. Xu, Y. Zhang, R. Zhang, X. Wen, and Z. Lin Wang, Nano Energy 2(1), 75–81 (2013).
- [11] Ueberschlag, P. (2001), ”PVDF piezoelectric polymer”, Sensor Review, Vol. 21 No. 2, pp. 118-126. https://doi.org/10.1108/02602280110388315
- [12] Mohammadi, B., Yousefi, A. A., Bellah, S. M. (2007). Effect of tensile strain rate and elongation on crystalline structure and piezoelectric properties of PVDF thin films. Polymer Testing, 26(1), 42–50. doi:10.1016/j.polymertesting.2006.08.003
- [13] G.T. Davis, in: T.T. Wang, J.M. Herbert, A.M. Glass (Eds.), Production of Ferroelectric Polymer Films. The Applications of Ferroelectric Polymers, Blackie and Sons Ltd, Glasgow, USA, 1988 (Chapter 3).
- [14] R.G. Kepler, R.A. Anderson, Ferroelectricity in polyvinylidene fluoride, J. Appl. Phys. 49 (1978) 1232.
- [15] A.J. Lovinger, Poly(vinylidene fluoride), in: D.C. Bassett (Ed.), Developments in Crystalline Polymers, Applied Science Publishers, London, 1982 (Chapter 5).
- [16] R. Hayakawa, Y. Wada, Piezoelectricity and related properties of polymer films, Adv. Polym. Sci. 11 (1973) 1.
- [17] M.G. Broadhurst, G.T. Davis, J.E. McKinney, R.E. Collins, Piezoelectricity and pyroelectricity in Poly(vinylidene fluoride)— a model, J. Appl. Phys. 49 (10) (1978) 4992.
- [18] C.K. Purvis, P.L. Taylor, Piezoelectricity and pyroelectricity in poly(vinylidene fluoride): influence of the lattice structure, J. Appl. Phys. 54 (1983) 1021.
- [19] A. Salimi, A.A. Yousefi, FTIR studies of b-phase crystal formation in stretched PVDF films, Polym. Testing 22 (2003) 699.
- [20] M. Schwartz, Encyclopedia of Smart Materials, vols. 1–2, Wiley, New York, 2002, p. 811.
- [21] Katsouras, I., Asadi, K., Li, M. et al. The negative piezoelectric effect of the ferroelectric polymer poly(vinylidene fluoride). Nature Mater 15, 78–84 (2016). https://doi.org/10.1038/nmat4423
- [22] Lindner, M. et al. Charged cellular polymers with ferroelectric behaviour. IEEE Trans. Dielectr. Electr. Insul. 11, 255-263 (2004).
- [23] Bystrov, V. S. et al. Molecular modeling of the piezoelectric effect in the ferroelectric polymer poly(vinylidene fluoride) (PVDF). J. Mol. Model. 19, 3591-3602 (2013).
- [24] H.A. Kunkel, S. Locke, B. Pikeroen, IEEE Trans. Ultrason. Ferroelect. Freq. Control 37 (1990) 316.
- [25] Tian, W., Ling, Z., Yu, W., Shi, J. (2018). A Review of MEMS Scale Piezoelectric Energy Harvester. Applied Sciences, 8(4), 645. doi:10.3390/app8040645
- [26] Machado, R.; Santos, V.B.D.; Ochoa, D.A.; Cerdeiras, E.; Mestres, L.; García, J.E. Elastic, dielectric and electromechanical properties of (Bi0.5Na0.5)TiO3-BaTiO3 piezoceramics at the morphotropic phase boundary region. J. Alloys Compd. 2017, 690, 568–574.
- [27] Sappati, K., Bhadra, S. (2018). Piezoelectric Polymer and Paper Substrates: A Review. Sensors, 18(11), 3605. doi:10.3390/s18113605
- [28] Ueyama, T., Yamana, S., Kaneko, N. (1987). Sintering Properties of BaTiO3Green Sheets with High Packing Density. Japanese Journal of Applied Physics, 26(S2), 139. doi:10.7567/jjaps.26s2.139
- [29] Piezotech, “Piezoelectric films technical information.”
- [30] Evans, Jared. (2014). Piezoelectric-Based, Self-Sustaining Artificial Cochlea.
- [31] Yan, Xikang Wen, Jiapeng. (2020). Study on factors influencing the performance of reactive powder concrete. IOP Conference Series: Earth and Environmental Science. 510. 052075. 10.1088/1755-1315/510/5/052075.
- [32] Binh, Do Chebanenko, Valerii Duong, Le Kirillova, Evgenia Thang, Pham Solov’ev, A.. (2020). Applied theory of bending vibration of the piezoelectric and piezomagnetic bimorph. Journal of Advanced Dielectrics. 10. 10.1142/S2010135X20500071.
- [33] S. E. SHELTON, “Piezoelectric Micromachined Ultrasound Transducers for Air-coupled Applications,” University of California Davis, 2014.
- [34] J. N. Reddy, Theory and Analysis of Elastic Plates and Shells vol. 1: Taylor and Francis, 2007.
- [35] P. Muralt, N. Ledermann, J. Paborowski, A. Barzegar, S. Gentil, B. Belgacem, S. Petitgrand, A. Bosseboeuf, and N. Setter, ”Piezoelectric micromachined ultrasonic transducers based on PZT thin films,” IEEE Trans. Ultrason., Ferroelectr., Freq. Control, vol. 52, pp. 2276-2288, 2005.
- [36] Y. LU, “Piezoelectric Micromachined Ultrasonic Transducers for Fingerprint Sensing,” University of California Davis, 2015.