Fluorite-related iridate Pr3IrO7: Crystal growth, structure, magnetism, thermodynamic, and optical properties
Abstract
Spin-orbit coupling in heavy 5 metal oxides, in particular, iridates have received tremendous interest in recent years due to the realization of exotic electronic and magnetic phases. Here, we report the synthesis, structural, magnetic, thermodynamic, and optical properties of the ternary iridate Pr3IrO7. Single crystals of Pr3IrO7 have been grown by the KF flux method. Structural analysis shows that Pr3IrO7 crystallizes in an orthorhombic phase with symmetry. The electron energy loss spectroscopy study indicates that Pr is in a 3+ valence state, which implies a 5+ oxidation state of Ir. Magnetization data measured at high and low magnetic fields do not exhibit any bifurcation between and , however, a weak hump in is observed at 10.4 K. The specific heat data reveal two maxima at 253 K and 4.8 K. The optical conductivity spectrum shows 24 infrared-active phonon modes and reveals an insulating behavior with an optical gap of size 500 meV. During cooling down, the temperature-dependent reflectivity spectrum reveals eight extra phonon modes below the structural phase transition ( 253 K). An anomaly is observed at around in the temperature evolution of infrared-active mode frequencies suggesting the presence of significant spin-phonon coupling in the system.
pacs:
75.47.Lx, 75.40.Cx, 78.20.-e, 78.30.-j1 Introduction
In recent years, iridates have drawn much attention due to a variety of exotic properties arising from the presence of spin-orbit coupling (SOC), on-site Coulomb (), and crystal field () interactions of comparable strength [1, 2]. As compared to the 3 transition metal oxides, iridates exhibit a large SOC and smaller due to the heavy and extended nature of the 5 orbitals, respectively. In iridates, the comparable energy strength of SOC, , and creates a fragile balance between interactions that are predicted to host the novel topological phases i.e., Mott insulator, Weyl semimetal and axion insulator [3, 4, 5, 6]. Experimentally and theoretically, these interactions have been extensively studied in the context of tetravalent Ir4+ (5) within the single particle scenario, where the strong SOC splits the Ir states into a completely filled = 3/2 band and a half-filled = 1/2 band, which lies close to the Fermi energy. This half-filled = 1/2 band further splits into a lower (filled) and an upper (empty) Hubbard band due to the presence of small , thus leading to a = 1/2 Mott state [7, 8, 9]. In contrast, the Ir5+ ions have four 5 electrons, the = 3/2 band is expected to be fully filled and the = 1/2 band to be empty, leading to a nonmagnetic = 0 state in the strong SOC limit. However, recent theoretical and experimental studies have shown strong evidence against the SOC driven = 0 state [10, 11, 12, 13, 14, 15]. The magnetism in the Ir5+ = 0 picture under strong SOC is thus debatable.
Generally, the 5 Ir based ternary oxide materials with chemical composition IrO7 ( = rare-earth metal) belong to the family of pentavalent (Ir5+) iridates. These materials basically belong to the class of the defect-fluorite structure with orthorhombic symmetry in which the Ir5+ ions form IrO6 octahedra and are arranged in one-dimensional chains along the axis [16, 17, 18]. Previously, the structural, magnetic and thermal properties for IrO7 ( = Pr, Nd, Sm, and Eu) compounds have been studied in the polycrystalline form, in addition, a single crystal study of Pr3IrO7 is reported for the electrocatalyst properties [17, 18, 19]. The specific heat data for (Pr, Nd, Sm and Eu)3IrO7 exhibit a thermal anomaly at 261, 342, 420, 485 K, respectively, which has been later assigned to a structural phase transition [17, 18]. It was reported that among these materials only Nd3IrO7 reveals an antiferromagnetic (AFM) transition at around 2.6 K [17].
In the present work, we report the synthesis and characterization of Pr3IrO7 single crystals. Molten KF flux method has been used to grow the Pr3IrO7 single crystals, which were characterized by Laue x-ray diffraction, electron energy loss spectroscopy, magnetization, specific heat, and infrared reflectivity measurements. The obtained magnetization data show a weak hump at 10.4 K and a continuous rise below 5.6 K with lowering the temperature. The data measured at low and high fields do not exhibit any bifurcation between and either. Our specific heat results exhibit two maxima at 253 K and 4.8 K. The infrared reflectivity measurements show several infrared-active phonon modes, and the low reflectivity value in the low-frequency range implies an insulating behavior for Pr3IrO7. The temperature evolution of the phonon modes clearly reveal a change across the structural phase transition and a hump around .
2 Experimental Details
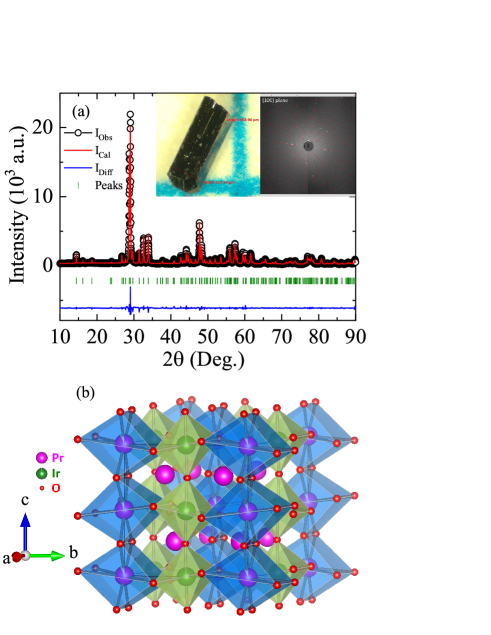
High-quality ingredient powder materials Pr6O11 and IrO2 with a phase purity of more than 99.99% (M/s Sigma-Aldrich) were mixed in their stoichiometric ratios with a slight excess of IrO2 and ground well. A pre-heat treatment was performed for the starting material Pr6O11 at 800∘C for 8 hours to remove any residual atmospheric moisture. The powder mixture was subsequently pelletized and sintered in air at temperatures 950 - 1130∘C for several days with intermediate grindings. Single crystals of Pr3IrO7 were grown by KF flux method using polycrystalline sample (slight excess of IrO2) and KF flux in a ratio of 1:200. For the crystal growth, the sample was heated at 1100∘C for 4 hours and slowly cooled to 850∘C at a rate of 2∘C/hour. Many small crystals were found at the wall of the Pt-crucible [left inset of Fig. 1(a)]. The crystals were removed from the residual KF by rinsing them out with water. The structure and chemical composition of Pr3IrO7 samples were analysed using powder x-ray diffraction (XRD) and energy dispersive analysis of x-ray (EDX) using a ZEISS Crossbeam 550/550L scanning electron microscope with an Oxford detector. To check the purity of the crystals, powder XRD was performed on the powder of the crystals using a Rigaku diffractometer (Model: Miniflex 600) with Cu radiation in 2 range 10∘ to 90∘ with a step of 0.02∘. The XRD data were analysed by Rietveld refinement using the FULLPROF program. To further check the purity of the crystals, x-ray Laue diffraction experiments were performed, confirming the high crystallinity of the crystals.
The transmission electron microscopy including electron energy-loss spectroscopy (EELS) was carried out with a JEOL NEOARM F200 instrument, equipped with a Gatan OneView camera and a Continuum S EELS spectrometer. The EELS analysis was done at 200 keV beam energy in the DualEELSTM mode. DC magnetization data were collected from 1.8 K to 300 K using a superconducting quantum interference device (SQUID, Quantum Design) magnetometer MPMS. Specific heat data were measured in the temperature range from 1.8 K to 300 K using Quantum Design PPMS DynaCool with a heat pulse relaxation method. The temperature-dependent reflectance measurements were carried out in the temperature range 300 - 5.4 K and frequency range 126 - 20000 cm-1 using a CryoVac Konti cryostat attached to a Bruker Vertex v80 Fourier transform infrared spectrometer and an infrared microscope (Bruker Hyperion). A thin silver layer was evaporated on half of the crystal, which served as reference to obtain the absolute reflectivity. The frequency resolution was set to 2 cm-1 in the far-infrared range, while a resolution of 4 cm-1 was chosen for the higher-frequency range. For the analysis, the measured reflectivity spectrum was extrapolated in the low- and high-energy regime by Lorentz fitting and x-ray optic volumetric data, respectively [20]. Note that a power-law interpolation with an integer = 3 was used to cover the region between measured reflectivity and calculated high-energy extrapolated data. The so-obtained reflectivity spectrum was used to obtain the real part of the optical conductivity ) and the loss function -Im(1/) using the Kramers-Kronig relations and a Lorentz model was used to fit the optical spectra using the RefFIT program [21].
3 Results and Discussions
3.1 Structural Analysis
The room-temperature XRD pattern of Pr3IrO7 together with the Rietveld refinement is shown in Fig. 1 (a). The refinement analysis confirms that Pr3IrO7 is in a single phase and crystallises in an orthorhombic phase with symmetry (space group 63). The unit cell parameters , and are found to be 10.97 Å, 7.42 Å and 7.53 Å, resp., which match the reported values [17]. We have confirmed the crystallographic planes for Pr3IrO7 single crystal through Laue diffraction, which insures that Pr3IrO7 crystals are in a unique crystalline domain [right inset of Fig. 1(a)]. Fig. 1 (b) shows the schematic representation of the crystal structure of Pr3IrO7, where the Ir cations are six-fold coordinated and form one-dimensional chains of the corner-sharing IrO6 octahedra along the axis. The Pr cations are eight-fold coordinated and form a chain of eightfold-distorted Pr(1)O8 cubes, which simultaneously share the edges with the chains of IrO6 octahedra. The remaining Pr(2) cations lie in between the Pr(1)O8 pseudocubes and IrO6 octahedra [17].
3.2 Electron Energy Loss Spectroscopy
In this class of oxide materials, understanding the valence state of rare-earth/transition metals is very important, since they play an important role governing the electronic, magnetic, and optical properties. As precursors, Pr6O11 and IrO2 are used for the sample preparation. In Pr6O11, Pr exists in a mixed valence state of 3+/4+, i.e., 3+ for Pr2O3 and 4+ PrO2 [22]. In order to understand the Pr cationic charge state in Pr3IrO7, electron energy loss spectroscopy (EELS) measurements have been performed on fine powder of Pr3IrO7 single crystals. The Pr2O3 material with phase purity of 99.9% was used as reference sample for the Pr 3+ charge state. The low loss spectra of the Dual EELS have been used for precise calibration of the zero-point. To process the EELS data, a power-law background fitting has been used. Furthermore, the spectra have been recorded as line scans for five different regions of each sample and analyzed. Fig. 2 (a) and (b) show the Pr and edge absorption spectra for Pr2O3 and Pr3IrO7, respectively.
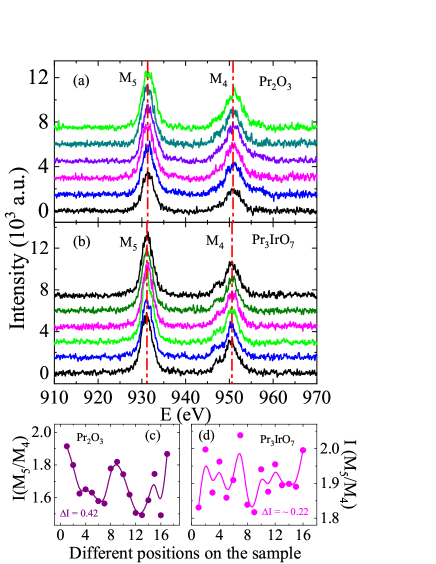
The white lines of Pr correspond to the electronic transitions between the initial state 3 and the unoccupied 4 orbitals. For Pr2O3, the white lines are observed around 931.3 eV and 950.8 eV, respectively. A shoulder is present on the left side of the Pr edge, which is indicative for the Pr 3+ valence state [22, 23, 24, 25]. As evident in Fig. 2, the line shape and peak position of the -edge for Pr3IrO7 are similar to the -edge spectra of Pr2O3. A small chemical shift in the Pr and edge is observed, which amounts to 0.16 eV and 0.23 eV, resp., toward the low energy side, however, the shift is small. A shoulder is also found for Pr3IrO7 on the left side of the Pr edge. For the Pr 4+ valence state, the two peaks have been previously reported on the right side of both Pr and edges around 935 eV and 955 eV. These are distinctly absent for the present Pr3IrO7 sample, which also suggests that Pr is in a 3+ valence state [23, 24]. Furthermore, we have analyzed all the other recorded regions of each sample (not shown). We have found similar types of signatures i.e., a similar amount of chemical shift in Pr edges, the absence of two peaks on the right side of both Pr and edges, and the presence of a shoulder on the left side of Pr edge. Additionally, we have further looked at the intensity ratio for both Pr2O3 and Pr3IrO7 materials in Fig. 2 (c) and (d), respectively. The intensity ratio for Pr2O3 shows no systematic variation at different position of the sample, and the change in lies between 1.5 to 2 according to Fig. 2(c). For Pr3IrO7, we observe a complete fluctuation in ratio [see Fig. 2 (d)], however, these fluctuations lie in the same range as for Pr2O3. Similar types of variation have been found in for other regions of the Pr3IrO7 sample (not shown). These results imply that Pr is in 3+ valence state, which points to a 5+ charge state of Ir.
3.3 Magnetization study
Fig. 3 shows the temperature-dependent dc magnetization data for Pr3IrO7, measured for the magnetic field orientation at 0.5, 1, 2, and 5 kOe magnetic fields by following zero field-cooled (ZFC) and field-cooled (FC) protocols. As evident in the Fig. 3, the magnetic moment in the field of 0.5 kOe increases with decreasing temperature and exhibits a broad (weak) hump in the particular temperature range of 22 K to 5.6 K and centered around 10.4 K. Upon further cooling the magnetization increases continuously from 5.6 K to the lowest measured temperature. For a spin-glass behavior, the magnetization is expected to exhibit a bifurcation between and and an anomaly in across the glassy temperature, which shifts to lower temperature with increasing the field [11]. Our does not show any such bifurcation between and in the whole temperature range, which rules out the possibility of a glassy phase. The left inset of Fig. 3 depicts the low-temperature ZFC magnetization data for H = 0.5 kOe, which clearly shows the presence of a hump around 10.4 K and a prominent change around 5.6 K, as highlighted by the arrow. The data measured at higher magnetic fields (1, 2, and 5 kOe) reveal that the weak hump becomes more prominent with increasing magnetic field (Fig. 3). As evident in the high field data, with increasing the field the moment below 5.6 K increases continuously and exhibits a clear change in curvature of in that particular temperature regime.
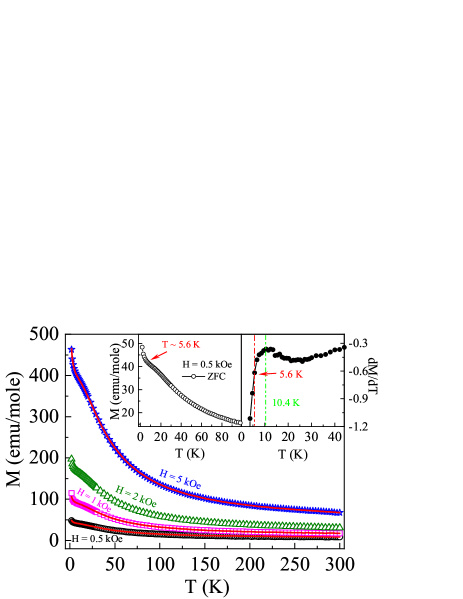
For a more detailed analysis, we have plotted the first derivative of the magnetization (d/d) in the right inset of Fig. 3 for 0.5 kOe field data. The d/d data distinctly show a sharp drop below 5.6 K, and a clear change in the curvature of at in the temperature range of 22 K to 5.6 K. This weak hump in could be associated with the magnetic degree of freedom, which leads to a significant deviation in magnetic susceptibility from the Curie-Weiss behavior at low temperature [see Fig. 4 (c)]. It is interesting to note that a similar type of weak hump in magnetization data has been seen for other Pr based perovskites PrBO3 (B = transition metals) at low temperature where the rare-earth spins order in an AFM arrangement [27, 28, 29, 30]. The continuous increase in magnetization below could be associated with a minor paramagnetic (PM) impurity phase consisting of non-interacting and isolated Pr or Ir moments. To obtain further insight into the low-temperature magnetic state of Pr3IrO7, we have measured at low fields 25 and 50 Oe [see Figs. 4 (a) and (b), respectively]. The data at the low field also exhibit a continuous increase in moment across the same temperature ( 5.6 K), as observed in high field measurements, however, the weak hump around 10.4 K is not clearly visible. The notable observations in the data occur at low field, namely, (i) no change in the temperature, where the magnetization continuously increases, (ii) increase in magnetic moment with increasing fields, and (iii) no hysteresis between and .
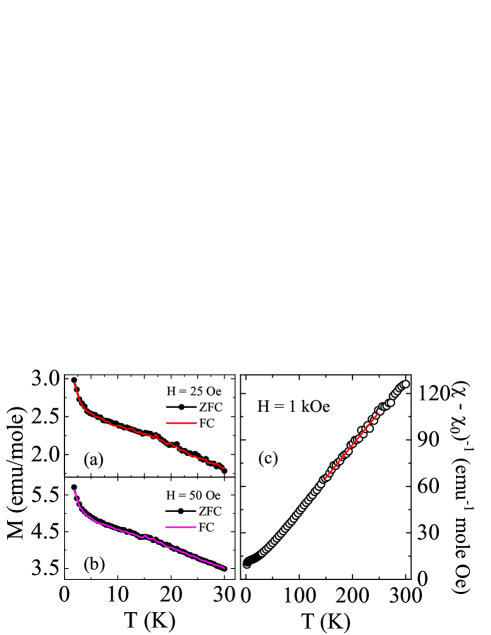
Fig. 4 (c) depicts the temperature-dependent inverse magnetic susceptibility ( = H/M), which is deduced from the data (Fig. 3). The data have been analyzed using a modified Curie-Weiss (CW) law in the temperature range 150 - 248 K [26], according to
| (1) |
where , , and are the temperature-independent magnetic susceptibility, the Curie constant, and Curie-Weiss temperature, respectively. The vs T plot shows a linear behavior in the high temperature regime [see Fig. 4 (c)]. The fitting of with Eq. (1) gives = 9.510-3 emu/mole, = 2.36 emu K/mole, and = - 5.7 K. The magnitude of is close to . The negative sign of and its magnitude suggest AFM type interactions in Pr3IrO7. From the obtained Curie constant , the effective paramagnetic moment () is calculated and found to be 4.34 , and hence 2.5 /Pr, which is low compared to the theoretically expected moment () value 3.58 , where the Lande factor and the value for Pr3+ (4) electronic configuration are 4/5 and 4, respectively. The observed low moment () implies that the four -electrons of Ir5+ (5 electronic state) occupy completely = 3/2 quartet state, which means = 0 for the Ir5+ state. This low moment () discrepancy with expected moment has been seen in other Pr-based ternary oxide Pr3MO7 (M = Nb, Ta and Sb) materials [16].
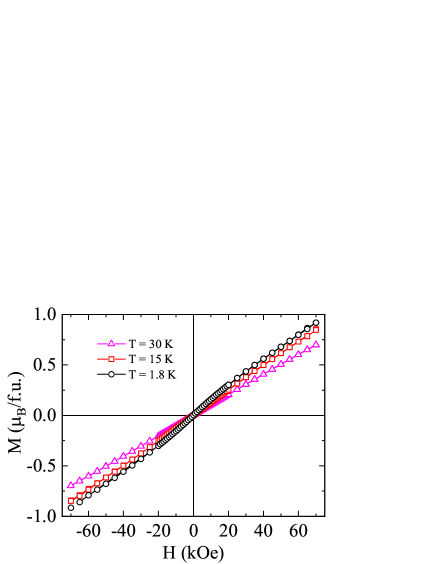
The magnetic field-induced magnetic behavior in Pr3IrO7 below and above was characterized in terms of the isothermal magnetization as a function of magnetic field () for at various temperatures in the field range of 70 kOe, and the results are shown in Fig. 5. It is evident that the data do not show any sign of saturation for all temperatures up to the maximum applied field, i.e., 70 kOe. Accordingly, the data above exhibit a linear behavior like PM. In contrast, the curve at 1.8 K exhibits a linear behaviour up to about 20 kOe, and above this field the data show a slight deviation from the linearity with field. Furthermore, the absence of any hysteresis in the curve at 1.8 K suggests that the magnetic ground state is neither a ferromagnetic nor spin-glass but could be AFM type. The magnetic moment at 1.8 K and 70 kOe is found to be 0.92 ; this value is low compared to the expected moment (), which is calculated as , where and are 4/5 and 4 for Pr3+ (4) electronic configuration. This low values of the magnetization and the in Pr3IrO7 may be due to the crystal field splitting of the Pr3+ ion because of the site symmetry of Pr(1) and Pr(2) ions [16, 31], which needs to be understood through microscopic probe.
3.4 Specific heat capacity
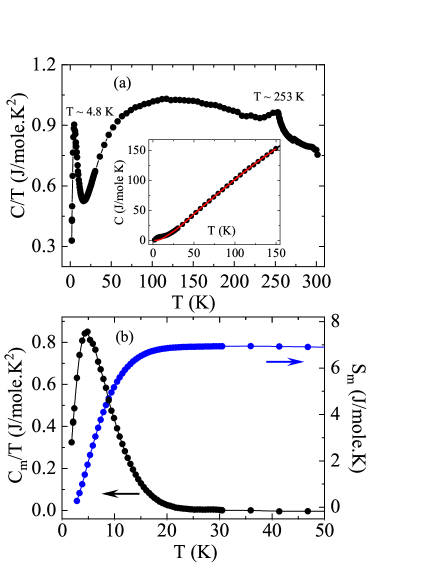
For a better understanding of the thermodynamic behavior in the vicinity of the observed weak hump in the data, the specific heat capacity as a function of temperature has been measured down to 1.8 K. Fig. 6 shows the obtained specific heat capacity in the form of a vs plot. The data exhibit two maxima/peaks: one in the high temperature ( 253 K) and one in the low temperature ( 4.8 K) regime. The latter could be related to the weak hump of (that manifest the maxima at 10.4 K), however, the small shift in temperature is not clear at the moment. A similar low-temperature change in data is also present in a previous study but it has not been discussed so far [17]. The observed high-temperature maxima around 253 K is close to the reported value of the Pr3IrO7 polycrystalline sample, where it was related to a structural phase transition from orthorhombic to monoclinic [17, 18].
Furthermore, the magnetic contribution () to the total heat capacity is calculated by subtracting its lattice (phonon) contribution () from . The is determined by fitting of the data from 30 to 150 K using a combined Debye-Einstein model ( = + ). The and terms are given as [32, 11]
| (2) |
| (3) |
where is the universal gas constant, and and are the Debye and Einstein temperature, respectively. The and coefficients are the weighting factors corresponding to acoustic and optical phonons (Debye and Einstein coefficients), respectively. The data can be fitted well with one Debye and three Einstein (1D + 3E) terms of lattice specific heat and is represented by a solid line in the inset of Fig. 6 (a). The obtained is extrapolated down to 1.8 K for . From the combined fitting, the Debye and Einstein temperatures , , and are found to be 94.6 K, 493.7 K, 201.6 K, and 728 K, resp., and the associated weighing factors , , , and are fixed in the ratio of 1, 5, 3, and 2, respectively. The total sum of coefficients + matches well with the total number of atoms in the formula unit in Pr3IrO7. The obtained magnetic specific heat () is shown in the left panel of Fig. 6 (b) in the form of a plot. The magnetic specific heat shows a clear broad peak around 4.8 K, which is close to where the weak magnetic hump is observed in the data.
To understand this further through the change in entropy, the magnetic entropy is calculated by integrating with according to
| (4) |
The change in magnetic entropy with temperature is shown in the right panel of Fig. 6 (b). Accordingly, almost saturates at 6.9 J/mole K above 22.2 K, which is close to the the temperature ( 22 K) below which the magnetization shows a change in its curvature. We have calculated the expected entropy change due to the Pr3+ ions with = 4 and found it to be 18.2 J/(mole K) [ ln(2 + 1)]. The obtained is low and about 37.9% of the theoretical value. This lower value of may be due to the higher alignment of crystal field effect levels around 22 K.
-
Atoms Wyckoff positon representation Pr(1) Pr(2) Ir O(1) O(2) O(3)
3.5 Optical Conductivity
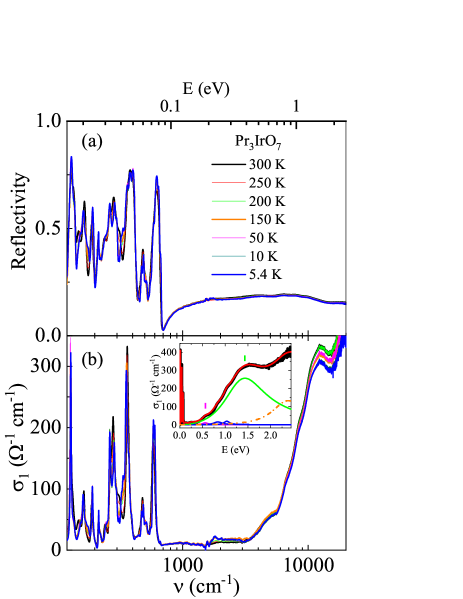
For the characterization of the electronic and vibrational properties of Pr3IrO7, we carried out reflectivity measurements in the infrared frequency range. The temperature-dependent reflectivity spectrum over the whole measured frequency range is shown in Fig. 7 (a) at various temperatures, while the corresponding optical conductivity is displayed in Fig. 7 (b). Pr3IrO7 crystallises in an orthorhombic phase with symmetry. According to the factor group analysis for the structure symmetry, the irreducible representation of optical active phonons is given as
| (5) |
where () indicates the infrared-active (Raman-active) modes. Theoretically, 32 infrared-active phonons are expected for Pr3IrO7 due its structure symmetry, see Table 1. Note that all Pr, Ir and O atoms in Pr3IrO7 are involved in these lattice vibrations. From the room temperature low-energy optical conductivity spectrum , two main observations can be made: First, the overall low value of in the far-IR region, which signals the insulating character of Pr3IrO7. Second, 24 IR-active transverse phonon modes can be resolved and noted in Table 2. In analogy to the related compound Gd3NbO7 [33] the modes above 190 cm-1 can be ascribed to stretching and bending vibrations of IrO6 octahedra, and the modes below 190 cm-1 can be assigned to translational modes of the Pr3+ and Ir5+ ions.
The onset of electronic excitations in the optical conductivity spectrum [see inset of Fig. 7 (b)] is located at around 0.5 eV, which can serve as an estimate of the optical gap, 500 meV. The size of is comparable to that in the honeycomb-type iridates Na2IrO3 and -Li2IrO3 with Ir 5 electronic configuration [34, 35]. The high-energy spectrum shows weak Lorentz contributions located at 0.56 eV, 0.83 eV, and 1.03 eV and a stronger contribution 1.43 eV. In analogy to other iridates [42, 43, 44, 35, 36], these excitations can be ascribed to on-site and inter-site transitions between = 1/2 and = 3/2 states, which could show additional splittings due to octahedral distortion. The Lorentz term at 2.4 eV can be attributed to charge-transfer excitations between the Ir 5 and O 2 orbitals.
| Transverse phonon frequencies | Longitudinal phonon frequencies | ||||
|---|---|---|---|---|---|
| K | K | K | K | K | K |
| 128.4 | 128.4 | 128.7 | 132.8 | 134.1 | 134.4 |
| 133.0 | 135.8 | 135.3 | 140.6 | 140.6 | 141.1 |
| 148.1 | 151.6 | 153.2 | 151.2 | 153.0 | 154.2 |
| 163.6 | 161.4 | 161.4 | 173.1 | 170.2 | 166.9 |
| 188.8 | 167.5 | 169.6 | 195.8 | 174.8 | 175.4 |
| 193.6 | 177.9 | 177.2 | 204.2 | 178.9 | 179.7 |
| 212.9 | 189.9 | 191.5 | 215.3 | 197.2 | 198.5 |
| 218.6 | 202.5 | 201.7 | 219.5 | 203.4 | 204.2 |
| 240.3 | 213.6 | 214.3 | 242.9 | 215.5 | 216.5 |
| 265.5 | 218.4 | 221.4 | 269.4 | 221.4 | 222.5 |
| 279.9 | 229.8 | 232.0 | 291.4 | 231.2 | 233.3 |
| 295.5 | 240.2 | 243.4 | 302.4 | 244.3 | 245.0 |
| 314.1 | 263.6 | 263.6 | 325.1 | 271.0 | 270.5 |
| 362.7 | 283.1 | 284.8 | 429.3 | 293.1 | 293.4 |
| 366.1 | 297.2 | 297.1 | 451.4 | 305.1 | 304.6 |
| 391.5 | 306.7 | 311.0 | 468.0 | 325.6 | 327.5 |
| 454.2 | 323.2 | 324.7 | 495.5 | 339.7 | 340.0 |
| 478.9 | 337.1 | 335.6 | 519.2 | 391.9 | 391.0 |
| 506.7 | 358.4 | 357.3 | 541.0 | 431.5 | 426.0 |
| 545.0 | 373.6 | 373.4 | 591.0 | 455.8 | 451.1 |
| 564.2 | 394.7 | 394.1 | 633.0 | 472.0 | 477.1 |
| 579.8 | 455.1 | 454.1 | 657.0 | 495.2 | 495.2 |
| 595.8 | 471.1 | 471.7 | 670.7 | 508.0 | 506.9 |
| 664.6 | 483.8 | 485.6 | 713.7 | 520.7 | 524.0 |
| 504.4 | 504.8 | 540.6 | 537.2 | ||
| 517.3 | 517.1 | 557.0 | 556.6 | ||
| 542.0 | 536.6 | 590.5 | 593.5 | ||
| 569.9 | 554.6 | 634.4 | 637.1 | ||
| 585.3 | 586.6 | 660.6 | 660.3 | ||
| 601.2 | 605.0 | 675.8 | 679.6 | ||
| 628.3 | 636.2 | 689.8 | 696.8 | ||
| 664.7 | 667.4 | 715.9 | 717.2 |
It is furthermore intriguing to compare the high-energy spectrum of Pr3IrO7 with that of insulating Li2RuO3, where Ru4+ has a electron configuration similar to Ir5+ (5), however, with a smaller SOC and higher -value [37]. Interestingly, for Li2RuO3 one observes a similar gap size 600 meV, and the excitations around 0.95 eV and 1.46 eV are slightly blueshifted in energy [37], which might be due to the different SOC strength. In addition, it has been seen in a local probe study that the Ir5+ systems exhibit higher angular strength of the SOC, , compared to the Ir4+ state [38]. Therefore, in the context of SOC, more investigations employing theoretical calculations are required to understand the electronic excitations in the strong SOC limit in Ir5+-based oxides.
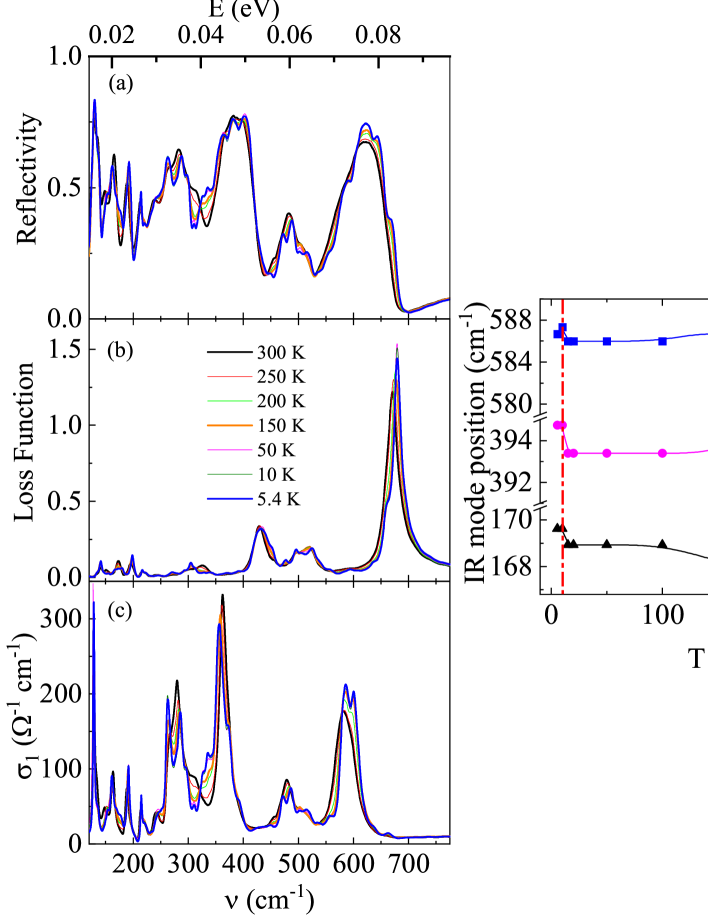
Furthermore, we checked the possible impact of the structural phase transition at 253 K and the magnetic ordering at on the vibrational and electronic excitations. The temperature-dependent reflectivity spectrum of Pr3IrO7 is shown in Fig. 8 (a) at various temperatures in the far-infrared range, since here the pronounced changes occur. With decreasing temperature, we observe several changes, namely the appearance of eight additional transverse IR modes at 167.5 (20.7), 177.9 (22.0), 229.8 (28.5), 306.7 (38.0), 337.1 (41.7), 471.1 (58.4), 517.3 (64.1), 628.3 (77.8) cm-1 (meV) around 250 K in the far-infrared range (Table 2), a large change in the observed modes in the frequency range 290 - 350 cm-1 (especially for the 314.1 cm-1 mode), and the IR modes become sharper at low temperature. These changes are also clearly seen in temperature-dependent conductivity spectrum of the far-infrared regime as shown in Fig. 8 (c). The observed additional modes around 250 K are probably due to the structural phase transition which was previously reported [17, 18] and also seen in the above-described heat capacity data [see Fig. 6 (a)]. Fig. 8 (b) shows temperature-dependent loss function in the far-infrared range. The eigenfrequencies of the longitudinal optical phonon modes appear as maxima in the loss function [45]. We found 24 longitudinal phonon modes at room temperature and eight extra modes below the structural phase transition temperature 253 K, see Table 2, which further confirms the observed extra phonon modes as seen in the optical conductivity spectrum. Like the reflectivity and conductivity spectrum, the temperature-dependent loss function exhibits a large change in the longitudinal modes in the frequency range 285 - 350 cm-1. Moreover, an additional phonon mode around 371.0 cm-1 is seen in the loss function spectrum compared to conductivity spectrum. The temperature-dependent spectrum in the higher energy region is shown in the Fig. 7 (b). Obviously, the observed Lorentz contributions ( 0.56 eV, 0.83 eV, 1.03 and 1.43 eV) do not show any noticeable change with lowering the temperature. Fig. 8 (d) shows the frequency position of three selected phonon modes as a function of temperature. The frequency of the modes at 579.8 and 391.5 cm-1 show an abrupt increase around 250 K, which we attribute to the structural phase transition occurring at this temperature. All three selected modes show an anomaly at around , where a weak hump is observed in the magnetization data. It is well known that the Dzyaloshinskii-Moriya interaction (DMI) mainly occurs due to the distortions of IrO6 octahedra which are induced by the presence of strong SOC in iridates [39]. In recent studies, it has been shown that spin-phonon coupling occurs due to the bending of Ir-O-Ir bonds which is mainly mediated by the DMI [40, 41]. For Ln3IrO7 (Ln = Pr, Nd, Sm and Eu), it has been reported that both tilt of the IrO6 octahedra and distortion in the Ir-Ln-O slab increase at the low temperature [18]. Therefore, the observed an anomaly for the IR phonon modes around underlines the importance of spin-phonon coupling in Pr3IrO7.
4 Conclusion
In summary, the structural, magnetic, thermodynamic, and optical properties are studied in detail for single-crystalline Pr3IrO7 ternary iridate. The structural analysis shows that Pr3IrO7 crystallizes in the orthorhombic phase with symmetry. The electron energy loss spectroscopy measurements reveal a 3+ oxidation state for Pr, hence 5+ oxidation state of Ir in Pr3IrO7. As a consequence, it represents the ideal system to study the magnetic and electronic evolution of Pr rare-earth. Our magnetic and specific heat results suggest a possible weak low-temperature AFM state for Pr3IrO7. Based on the reflectivity data analysis, we conclude an insulating electronic structure for Pr3IrO7 with an optical gap 500 meV. The temperature-dependent reflectivity spectrum shows eight extra phonon modes below 250 K, which can be attributed to a structural phase transition. Furthermore, several phonon modes reveal an anomaly in the temperature dependence of their frequency position at 10.4 K, where a weak hump is observed in the magnetization data, indicative for sizeable spin-phonon coupling in the system.
References
References
- [1] Witczak-Krempa W, Chen G, Kim Y B, and Balents L, 2014 Annual Rev. of Condens. Matter Physics. 5, 57
- [2] Rau J G, Lee E K H, and Kee H Y, 2015 Annual Rev. of Condens. Matter Physics. 7, 195
- [3] Pesin D, and Balents L, 2010 Nat. Phys. 6, 376.
- [4] Wan X, Turner A M, Vishwanath A, and Savrasov S Y, 2011 Phys. Rev. B 83, 205101.
- [5] Ueda K, Kaneko R, Ishizuka H, Fujioka J, Nagaosa N and Tokura Y, 2018 Nat. Comm. 9, 3032.
- [6] Ueda K, Fukuda H, Kaneko R, Fujioka J, and Tokura Y, 2020 Phys. Rev. B 102, 245131.
- [7] Kim B J, Jin H, Moon S J, Kim J Y, Park B G, Leem C S, Yu J, Noh T W, Kim C, Oh S J, Park J H, Durairaj V, Cao G, and Rotenberg E, 2008 Phys. Rev. Lett. 101, 076402
- [8] Kim B J, Ohsumi H, Komesu T, Sakai S, Morita T, Takagi H, and Arima T, 2009 Science 323, 1329
- [9] Moon S J, Jin H, Kim K W, Choi W S, Lee Y S, Yu J, Cao G, Sumi A, Funakubo H, Bernhard C, and Noh T W. 2008 Phys. Rev. Lett. 101, 226402
- [10] Kharkwal K C, Roy R, Kumar H, Bera A K, Yusuf S M, Shukla A K, Kumar K, Kanungo S, and Pramanik A K, 2020 Phys. Rev. B 102, 174401
- [11] Gondh S, Patidar M M, Kumar K, Saravanan M P, Ganesan V, and Pramanik A K, 2021 Phys. Rev. B 104, 014401
- [12] Garg C, Roy D, Lonsky M, Manuel P, Cervellino A, Müller J, Kabir M, and Nair S, 2021 Phys. Rev. B 103, 014437
- [13] Dey T, Majumder M, Orain J C, Senyshyn A, Prinz-Zwick M, Bachus S, Tokiwa Y, Bert F, Khuntia P, Büttgen N, Tsirlin A A, and Gegenwart P, 2017 Phys. Rev. B 96, 174411
- [14] Nag A, Middey S, Bhowal S, Panda S K, Mathieu R, Orain J C, Bert F, Mendels P, Freeman P G, Mansson M, Ronnow H M, Telling M, Biswas P K, Sheptyakov D, Kaushik S D, Siruguri V, Meneghini C, Sarma D D, Dasgupta I, and Ray S, 2016 Phys. Rev. Lett. 116, 097205
- [15] Cao G, Qi T F, Li L, Terzic J, Yuan S J, DeLong L E, Murthy G, and Kaul R K, 2014 Phys. Rev. Lett. 112, 056402
- [16] Vente J F, Helmholdt R B, and Ijdo D J W, 2004 J. Solid State Chem. 108, 18
- [17] Nishimine H, Wakeshima M, and Hinatsu Y, 2004 J. Solid State Chem. 739, 177
- [18] Nishimine H, Doi Y, Hinatsu Y, and Sato M, 2007 J. Ceramic Soc. Jpn. 115, 577
- [19] Wang Y, Liu S, Qin Q, Liu H, Zhang L, Wei T, Li H, and Liu X, 2021 Sci. China Mater. 64, 2193
- [20] Tanner D B, 2015 Phys. Rev. B 91, 035123
- [21] Kuzmenko A B, 2005 Rev. Sci. Instruments 76, 083108
- [22] Kumar H, Kharkwal K C, Kumar K, Asokan K, Banerjee A, and Pramanik A K, 2020 Phys. Rev. B 101, 064405
- [23] Richter J, Brauna A, Harveyb A S, Holtappelsa P, Graulea T, and Gauckler L J, 2008 Physica B 403, 87
- [24] López-Cartes C, Bernal S, Calvino J J, Cauqui M A, Blanco G, Pérez-Omil J A, Pintado J M, Helveg S, and Hansen P L, 2003 Chem. Commun. 5, 644
- [25] Abel J, 2012 Corrélations compositions chimiques- structures d’oxydes mixtes (Ce/Zr) à base de Pr4+/Pr3+ et propriétés de réductibilité, Ph.D. Thesis, Institut de Chimie de la Matière Condensée de Bordeaux, France
- [26] Kumar H, Dhaka R S, and Pramanik A K, 2017 Phys. Rev. B 95, 054415
- [27] Kumar Anil, Warshi M. Kamal, Sagdeo Archna, Krzystyniak Matthew, Rudic Svemir, Adroja D T, Silva Ivan da, and Sagdeo P R, 2021 Phys. Rev. B 104, 035101
- [28] Venugopal R B, Vittal P B, Narsinga R G, Chou F C, Suresh B D, 2015 Advanced Mat. Res. 1086 96
- [29] Mendivil, L F, Alvarado-Rivera, J, Verdín E, Díaz J A, Mata J, Conde A, and Durán A, 2020 Appl. Phys. A 126 574
- [30] Mendivil, L F, Alvarado-Rivera, J, Tavizon G, Verdín E, Arenas-Alatorre J, and Durán A, 2020 J Mater Sci. Mater Electron 32 24484
- [31] Zhou Z X, Cao G, McCall S, Crow J E, Guertin R P, Mielke C H and Rickel D G, 2002 Philosophical Magazine B 82 1401
- [32] Ghara S, Ter-Oganessian N V, and Sundaresan A, 2017 Phys. Rev. B 95, 094404
- [33] Ptak M, Pilarek B, Watras A, Godlewska P, Szczygiel I, and Hanuza J, 2019 J. Alloys and Compounds 810, 151892
- [34] Comin R, Levy G, Ludbrook B, Zhu Z H, Veenstra C N, Rosen J A, Singh Y, Gegenwart P, Stricker D, Hancock J N, van der Marel D, Elfimov I S, and Damascelli A, 2012 Phys. Rev. Lett. 109, 266406
- [35] Hermann V, Ebad-Allah J, Freund F, Pietsch I M, Jesche A, Tsirlin A A, Deisenhofer J, Hanfland M, Gegenwart P, and Kuntscher C A, 2017 Phys. Rev. B 96, 195137
- [36] Hermann V, Ebad-Allah J, Freund F, Jesche A, Tsirlin A A, Gegenwart P, and Kuntscher C A, 2019 Phys. Rev. B 99, 235116
- [37] Yun S, 2020 Studies on Transition metal dimers in Li2RuO3, Ph.D. Thesis, Seoul National University , South Korea
- [38] Laguna-Marco M A, Kayser P, Alonso J A, Martínez-Lope M J, Veenendaal M van, Choi Y, and Haskel D, 2015 Phys. Rev. B 91, 214433
- [39] Bhatti I N, Rawat R, Banerjee A, Pramanik A K, 2014 J. Phys.: Condens. Matter. 27, 016005
- [40] Son J, Park B C, Kim C H, Cho H, Kim S Y, Sandilands L J, Sohn C, Park J G, Moon S J and Noh T W, 2019 Npj Quantum Mater. 4, 17
- [41] Kumar H, Sathe V G, and Pramanik A K, J. Magn. Magn. Mater 478 148 (2019)
- [42] Li Y, Foyevtsova K, Jeschke H. O., Valenti R, 2015 Phys. Rev. B 91, 161101
- [43] Kim B. H., Shirakawa T, Yunoki S., 2016 Phys. Rev. Lett. 117, 187201
- [44] Li Y, Winter S. M., Jeschke H. O., Valenti R, 2017 Phys. Rev. B 95, 045129
- [45] Klingshirn C F, 2012 Semiconductor Optics, Springer Berlin, Heidelberg.