11email: marcin.marculewicz21@xmu.edu.cn, marcin.marculewicz@gmail.com 22institutetext: University of Białystok, Faculty of Physics, Ciołkowskiego 1L Street, 15-245 Białystok, Poland 33institutetext: Nicolaus Copernicus Astronomical Center, Polish Academy of Sciences, Bartycka 18, PL-00-716 Warsaw, Poland
Deep absorption in SDSS J110511.15+530806.5
Abstract
Aims. We study the origin of the anomalous deep absorption in a spectrum of the SDSS J110511.15+530806.5 distant quasar (z=1.929) obtained by the Sloan Digital Sky Survey in Data Release 7 of the optical catalog. We aim to estimate the velocity of absorbing material, and we show that this material considerably affects our measurements of the black hole (BH) mass in massive quasars with the use of common virial mass estimators.
Methods. The spectral shape of the quasar was modeled assuming that the accretion disk emission is influenced by a hot corona, warm skin, and absorbing material located close to the nucleus. The whole analysis was undertaken with XSPEC models and tools. The overall spectral shape was represented with the AGNSED model, while the deep absorption is well described by two Gaussians.
Results. The observed spectrum and the fitting procedure allowed us to estimate the BH mass in the quasar as , the nonzero BH spin is , and the accretion rate is . The velocities of the detected absorbers lie in the range of 6330-108135 km s-1. When we consider that absorption is caused by the C IV ion, one absorber is folding toward the nucleus with a velocity of 73887 km s-1. We derived a BI index of about 20300 km s-1 and a mass outflow rate up to 38.5% of the source accretion rate.
Conclusions. The high absorption observed in SDSS J110511.15+530806.5 is evidence of fast winds that place the source in the group of objects on the border with UFO (ultra-fast outflows), strong broad absorption line (BAL), and fast failed radiatively accelerated dusty outflow (FRADO). This absorption affects the BH mass measurement by two orders of magnitude as compared to virial mass estimation.
Key Words.:
galaxies: active - galaxies: nuclei - quasars: general - quasars: individual: SDSS J110511.15+530806.51 Introduction
Quasars (QSOs) are the brightest active galactic nuclei (AGN) and contain a supermassive black hole (SMBH) in their centers. They are powered by accreting matter that feeds the central engine. It is widely accepted that the mass of the SMBH in quasars is (e.g., Greene & Ho 2004). It is important to know the BH masses when quasar phenomena are to be understood. The most reliable technique is reverberation mapping (hereafter RM). It is based on the study of the gas dynamics that surrounds the BH (e.g., Blandford & McKee 1982; Peterson 1993, 2004; Bentz & Manne-Nicholas 2018; Shen et al. 2019). Most often, the gas located in the line-emitting region, such as the broad line region (BLR), is used in this technique because strong lines that are broadened by the Doppler effect are observed in the optical/UV spectra of many quasars. By measuring the time lags between emission in the continuum and in observed lines, we can directly estimate the size of the BLR and correlate this size with the quasar luminosity . Furthermore, assuming that the line velocity corresponds to the virial velocity of the BLR, the virial mass of the central SMBH can be derived taking our ignorance of the structure and geometry of the line-emitting clouds into account.
The modification of this method is the single-epoch (SE) virial BH mass estimator (see Shen 2013, for a review), which uses the relation previously that was determined through RM measurements. Assuming that this relation is universal, we can estimate the BLR size at any time for a source whose luminosity is known. This parameter combination with calibration coefficients allows us to estimate the BH mass using only the line measurement. Thus, these methods are powerful and frequently used because their approximation works very well, but they are expensive in terms of the number of high-resolution spectroscopic data needed, and are used on a case-by-case basis (and for only a few objects). However, the future development of the Black Hole Mapper111Black Hole Mapper: www.sdss.org/dr14/future/bhm/ project will increase our knowledge and will help us to constrain the SMBH mass range well.
An alternative less expensive but nondynamic method is the continuum spectral fit method. It is based on the well-grounded model of continuum emission from an accretion disk that surrounds an SMBH (e.g., Shakura & Sunyaev 1973; Novikov & Thorne 1973). The nondynamic term here is used in the context that we do not need any gas velocity measurements. Only time-averaged continuum spectra are used and fit with the accretion disk emission model. One of the most important parameters in this model is the mass of the BH. Marculewicz & Nikolajuk (2020) showed that the continuum-fit method works well for calculations of the BH masses of weak emission-line quasars (WLQ). We have shown that the masses of weak emission-line quasars that were determined on the bases of the full width at half maximum (FWHM) of the H line are underestimated. According to our analysis, both methods, the RM and the SE, give BH masses that are underestimated by four to five times when FWHM is lower than km s-1 in these types of objects. In the above paper, we proposed an alternative equation to provide a more precise constraint of the BH masses in these types of objects. The continuum emission model we used for our analysis was composed of an accretion disk component together with starlight and emission from a dusty torus.
In this paper, we apply the continuum-fit method of BH mass estimation to the peculiar quasar SDSS J110511.15+530806.5 (hereafter J1105), which exhibits deep absorption in the optical/UV domain. The source was first identified by Sloan Digital Sky Survey (SDSS) Data Release 6 obtained on September 17, 2007. The BH mass in this quasar reported by Shen et al. (2011) is solar masses, indicating that this object is a behemoth with an enormous mass. Notwithstanding, Shen et al. (2011) indicated that the mass may be erroneous, and these virial masses for individual objects have to be interpreted with caution (Shen et al. 2008). Considering all of this and taking the conclusions of our previous paper (Marculewicz & Nikolajuk 2020) into account, we used a phenomenological model of disk emission with a hot corona and warm skin affected by absorbing gas to fit the continuum spectrum of J1105 that was obtained by the SDSS Data Release 7 (Abazajian et al. 2009) to constrain the BH mass in this quasar.
The second step in our analysis aims to explain the deep absorption that is visible in the optical/UV spectrum of J1105. We modeled this unusual absorption and discuss eventual scenarios of the origin of the absorbing material in this peculiar quasar. The paper is organized as follows: section 2 consists of the source description and a summary of our knowledge of the origin of absorption in QSOs. Section 3 presents the data reduction, model description, and analysis procedure we used to fit a model to the observations. Results are presented in Sec 5, and final conclusions are given in Sec 6. We computed the luminosity distances using the standard cosmological model with = 70 km s-1 Mpc-1, = 0.7, and = 0.3 (Spergel et al. 2007).
2 SDSS J110511.15+530806.5 (J1105)
We searched the Shen et al. (2011) catalog for the sources with the most massive SMBHs. The catalog represents the properties of the 105,783 quasars in the SDSS Data Release 7 quasar catalog (Abazajian et al. 2009). It contains the continuum and emission line measurement of H , H , Mg II, and C IV. We present recent results for J1105, which aroused our curiosity not only through its high BH mass, but also through peculiar spectral absorbing features in the optical/UV domain. J1105 has not been studied extensively. Any publicly available data were mainly taken from a wider sample of objects, and no particular attention was focused on the J1105 quasar. We are the first to study J1105 individually. We searched for data of this quasar that were obtained at other energy ranges, but found none. Any possible X-ray detections by the ROSAT, INTEGRAL, or Swift missions show an offset of about 3 degrees, which is not acceptable as a point-source detection. Nevertheless, we have tried to detect the source from the field of view of these satellites, but we failed because for each observation, source detection was impossible at the significance level of a statistical detection above the huge background emission. Therefore, we failed to obtain any limits for source emission in the X-ray band.
2.1 Source description
| RA | Dec | E(B-V) | ||
| (J2000.0) | (J2000.0) | [mag] | ||
| 166.296486∘ | 53.135186∘ | 0.027 | 0.0087 |
J1105 lies in the Ursa Major constellation at a comoving radial distance of Mpc. Its redshift based on the spectrum, , is (Meusinger et al. 2016). The Galactic extinction measured in V and K filter toward J1105 is = 0.027 mag and = 0.003 mag (Schlafly & Finkbeiner 2011).
The observed spectrum of the quasar was corrected for Galactic reddening with an extinction law. This extinction curve is usually parameterized in terms of the amount of interstellar absorption at V color, , and a measure of the relative extinction between B and V band, . The value of varies from 2.6 to 5.5 in the measurements of the diffuse interstellar medium (Cardelli et al. 1989; Fitzpatrick 1999). The mean value is 3.1, and we used this to calculate . The value was taken from the NED222The NASA/IPAC Extragalactic Database (NED): ned.ipac.caltech.edu based on the dust map created by Schlegel et al. (1998). According to this, the color excess toward J1105 quasar is 0.0087. We present the source position and reddening in Table 1. The measured mass of its SMBH is , and the Eddington accretion rate is (Shen et al. 2011).
The monochromatic source luminosity was reported by Chen et al. (2018) to be [erg s-1]. To obtain the bolometric luminosity, the correction factor should be taken into account, as described by Netzer (2019),
| (1) |
When the Balmer continuum and the Fe II lines are included in the observed , the obtained bolometric luminosity is = 46.106 [erg s-1] (i.e., , ). Without information on whether the Balmer continuum and/or the Fe II lines were included in the luminosity at 3000Å, we obtain = 46.225 [erg s-1] (i.e., , ).
J1105 was classified as a strongly reddened narrow-line quasar. Jiang et al. (2013) argued that this unusual reddening law is based on the speculative assumption of an exotic dust grain size distribution that lacks large grains. Meusinger et al. (2016) studied J1105 and indicated that the reddening of the quasar is steeper than in the Small Magellanic Cloud, and perhaps even steeper than for the galaxy IRAS 14026+4341. The authors were also unable to determine a good reddening or extinction solution for J1105.
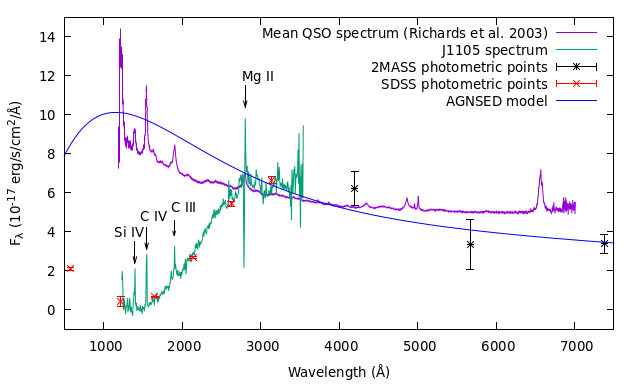
The spectrum of J1105 extracted by us from SDSS Data Release 7 (green line) in comparison with the mean QSO spectrum (purple line; Richards et al. 2003) is presented in Fig. 1. The figure clearly shows the significant absorption of the J1105 spectrum, the nature of which is not yet known. Photometric data of the earlier SDSS Data Release 6 (Adelman-McCarthy et al. 2008) are shown as red points clearly follow this trend. In addition, the black points are photometric points from the 2MASS survey (Skrutskie et al. 2006). We aim to explain this unusual absorption on the way from the source to the observer in this paper.
2.2 Examination and evaluation of the absorption
Absorption lines are visible in a significant number of QSO spectra. Quasars can be divided into BAL sources and narrow absorption line (NAL) sources based on their line widths. The NALs are associated with line velocities of just a few hundred km s-1(e.g., Wild et al. 2008); BAL QSOs have higher line velocities (a few thousand to even tens of thousand km s-1 (Stone & Richards 2019). About 60% of the QSO spectra exhibit the NAL features (e.g., Vestergaard 2003), whereas BALs are detected in only 20% of the sources (e.g., Knigge et al. 2008).
Strong quasar absorption line systems have two main origins: (1) intervening material along the line of sight (e.g., galaxies), and (2) gas associated with the central engine of the quasar (e.g., winds from the accretion disk, galactic-scale outflow or inflow, nearby dwarf galaxies, and molecular clouds). Because of their properties, BAL QSOs appear to be associated with outflowing matter, whereas NAL systems represent intrinsic or intervening absorbing material.
Stone & Richards (2019) suggested the division of NALs with regard to the velocity of the absorbed matter. They distinguished between intervening absorption, regarding the number density per unit redshift (), and intrinsic absorption, regarding the number density per unit velocity (, ). However, the idea that an NAL is represented by intrinsic or intervening material is still debated. Moreover, Stone & Richards (2019) classified the quasar absorption line systems depending on the exact values of their velocities. Systems within 3000 km s-1 are called associated absorption lines (AALs). Systems with a velocity separation km s-1 are dominated by intrinsic material in the form of winds blowing from the QSO. Systems with a velocity km s-1 are disconnected from the quasar (see references therein).
The mean balnicity index (BI), which is the sum of the equivalent width of all contiguous BAL troughs across the observed velocities, was calculated for C IV or Si IV absorption doublets. It ranges from 1000 to 4000 km s-1 in more than 21000 BAL quasars (SDSS catalogs; e.g., Gibson et al. 2009; Allen et al. 2011; Pâris et al. 2018). Higher values were reported for BAL quasars by Rankine et al. (2020), showing that BI = 6007 km s-1 for SDSS J140440.85+632705.9 and 9896 km s-1 for J105931.96+463638.9. The strongest absorbers indicate BI 23 000 km s-1 (Pâris et al. 2018).
The purpose of this work is to describe the exceptional nature of the high-mass quasar J1105. The high absorption that has not been observed before caught our attention. In the section below, we specify the absorbing gas velocity and discuss whether the observed absorption is associated with or disconnected from the quasar. The velocity of the absorbing material is derived assuming that the absorber is a large-scale wind, and the shift is caused by the Doppler effect using the relativistic formula
| (2) |
where is the speed along the line of sight, and is the speed of light. Furthermore, taking into account that the absorption is modeled by the Gaussian function, we were able to estimate the ion column densities, , of the absorbers. In an optically thin regime, for a fixed value of the ionization parameter and metallicity inside the absorber (Saez et al. 2021), we have
| (3) |
where b and r stand for parameters of the blue and red C IV/Mg II doublet, respectively, is an oscillator strength taken from Griesmann & Kling (2000) and Morton (2003), and is the equivalent width of the fitted absorbing Gaussian function.
When the gas velocity is measured, the interaction of the outflow with the surrounding material can be estimated using the commonly known formula
| (4) |
where is the mass outflow rate, and is the radial dependence of the optical thickness of the flow. In the simplest example, the flow is Compton thick at all radii, hence . We discuss all these physical parameters in the context of quasar J1105 in Sec. 5.
3 Data and analysis method
We extracted the spectrum of J1105 at visible wavelengths from Data Release 7 of the SDSS optical catalog (Abazajian et al. 2009) (see Fig. 1). The observed spectrum of the object was corrected for Galactic reddening with the extinction law of Cardelli et al. (1989); Fitzpatrick (1999). The value is taken from the NED database based on the dust map created by Schlegel et al. (1998). The spectrum of J1105 in comparison with the mean QSO spectrum shows extraordinary absorption in the range from up to Å.
As a first step to explain the absorption, we used different extinction laws for Milky Way dust and grains. Czerny et al. (2004) assumed different carbon grain and silicate dust temperatures in galaxies, and they showed that the different grain radii may explain various extinction curves for AGNs. Their study mainly considered amorphous carbon grains as an explanation for red quasars. On the other hand, Wickramasinghe & Hoyle (1998) postulated that microdiamonds may exist in the interstellar medium, and thus the excess of the interstellar extinction at the UV can be observed. Unfortunately, none of the examined laws of extinction for the spectrum of J1105 studied by us worked for an explanation of the deep and broad absorption.
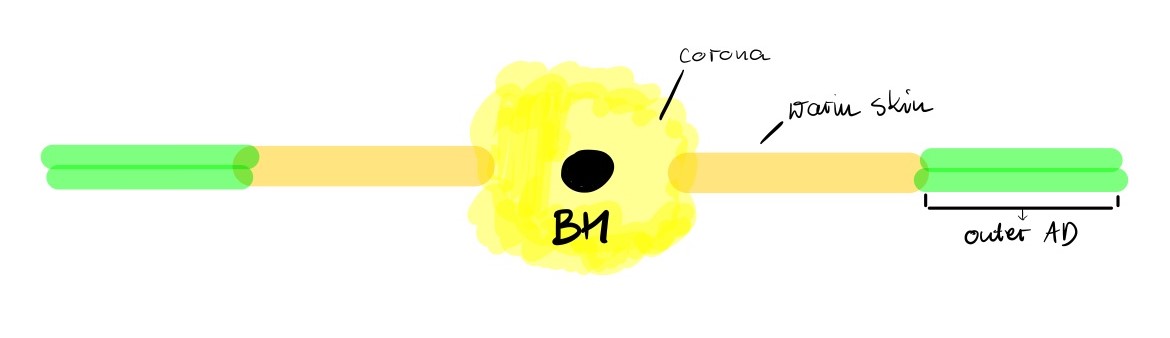
As a second step, we decided to search the location of the absorbing gas, with the assumption that the quasar presents typical emission as an active galactic nucleus. To do this, the continuum spectrum of the source can be described with absorbed emission of a geometrically thin accretion disk with the inner hot corona and the warm skin. Because the emission from a hot corona and warm skin is observed in the X-ray domain, we find a phenomenological model of the continuum emission only in the XSPEC fitting package. Therefore, we decided to model the spectrum of J1105 and its global absorption using XSPEC tools v12.10.1. The XSPEC package is a command-driven, interactive, spectral-fitting program, designed to be completely detector independent so that it can be used for any spectrometer (Arnaud 1996). For the active quasar engine, we used a standard geometry of the inner hot corona, warm skin, and the outer accretion disk, as presented in Fig. 2. This geometry is not yet fully confirmed because we do not know the physical mechanism that can separate the warm skin in the radial direction. A slab geometry of the warm skin and cold accretion disk in a vertical direction is often considered because it can be created in a magnetically supported disk, as shown by Gronkiewicz & Różańska (2020), but the available spectral models to work with the data are still simpler and do not take vertical heating of the warm skin into account.
One of the most plausible models available in XSPEC is the AGNSED model (Kubota & Done 2018). It describes the emission from all regions presented in Fig. 2 without any assumption about eventual gas heating. The modeled emitted spectrum can be adapted to the source parameters, and then eventually absorbed by the line-of-sight material. In the subsection below, we present the method and describe the model in full.
4 Modeling with XSPEC
From raw SDSS data, we reconstructed data for XSPEC compliance. We generated spectra for XSPEC and response matrices following standard procedures using ftflx2xsp to create a spectral (PHA) file and dummy response (RSP) file. This allowed us to model and fit J1105 using models available in XSPEC. For the purpose of fitting the model to the data, we binned the optical spectrum before transforming it into XSPEC, even though it did not influence the overall shape, and only emission lines were reduced to the level of the continuum. The binning procedure created bins between 30-100 Å depending on the spectral window. The final spectrum ready for XSPEC analysis had 26 bins, which is sufficient for our research goal.
Our basic emission model was AGNSED. It is dedicated to reflect the intrinsic spectrum of QSOs. Here, the flow is assumed to be radially stratified, emitting as a standard disk blackbody from to , as warm Comptonization from to , and then makes a transition to the hard X-ray emitting hot Comptonization component from to (innermost stable orbit radius). The outer accretion disk is optically thick and geometrically thin, as described by the Novikov-Thorne equations (Novikov & Thorne 1973). For the warm Comptonizing region, the AGNSED model adopts the passive-disk scenario tested by Petrucci et al. (2018). The inner hot corona is optically thin and emits energy in the hard Comptonized end of the spectrum.
The AGNSED model depends on many source parameters: BH mass, , accretion rate given in units of Eddington accretion rate, inclination angle , dimensionless BH spin , two coronal temperatures and , photon indices of the two Comptonized media and , and on the geometrical parameters: radius of the hot corona , radius of the warm skin , outer accretion disk radius , and , which is an upper limit of the scattering for the hot Comptonization component and is usually equal to . All these distances are given in units of gravitational radius . Furthermore, we fixed the distance in Mpc, the source redshift , and fit the normalization of the overall model. In addition, the newest version of the model allows us to switch the parameter for the reprocessing. When the reprocess parameter is 0, the radiation coming from the hot corona is not reprocessed by the warm skin and the outer cold disk. When this parameter is 1, the hard X-ray flux from the hot corona is added to the local warm skin and cold disk flux, assuming a reflected albedo, and depending on the distance from the BH through the purely geometrical formula (see Eq. 5 in Kubota & Done 2018). The seed photon temperature for the hot Comptonization was calculated internally. The AGNSED model does not take the color temperature correction into account because it does not calculate atmospheres.
The intrinsic QSO spectrum is absorbed by many regions, including absorption in our Galaxy. We used the redden model for the reddening in the Milky Way, as described by Cardelli et al. (1989) and given by the typical E(B-V) parameter. Furthermore, the photoelectric absorption in our Galaxy was taken into account with the phabs model with the equivalent hydrogen column density as the only model parameter.
After the two main absorptions in our Galaxy were taken into account, we were left with the possibility of adding additional clouds to study the distribution of the intrinsic absorption regions in J1105. We modeled each absorbing medium with a Gaussian function in order to find the relative velocity (i.e., redshift) of each region. Each Gaussian function is represented by three parameters: the energy in keV, the width in keV, and the line depth , which is the optical depth in the line center.
To summarize, our total model fit to the data is redden*phabs*AGNSED*gabs(N), where N is the number of absorbing Gaussian functions required by our data. A close examination of the quasar spectrum indicated that at least two absorbers are required, that is, N=2. In this case, our total model has 23 parameters, and we decided to fix some of them to make our analysis plausible. We fixed E(B-V) for the J1105 quasar to 0.0087. Furthermore, we estimated measured in the Milky Way 333NASA’s HEASARC NHI column density calculator :
heasarc.gsfc.nasa.gov/cgi-bin/Tools/w3nh/w3nh.pl
toward J1105 as cm-2. In addition, the outer radius of the accretion disk was fixed in our fitting procedure, while the radii of the hot corona and the warm skin were derived in the fitting procedure. Because we lack X-ray data of J1105, we also fixed the temperatures of the hot corona and warm skin and the hot corona photon index. The warm corona photon index stayed free as it can be influenced by fixed reddening and Galactic absorption. Finally, both the distance to the source and its redshift were fixed during the fitting procedure. We kept the reprocessing parameter equal to 1 and the albedo equal to 0.3 in our analysis. After fixing these parameters, we fit the data with 14 free parameters, which provides us with 12 degrees of freedom.
5 Results
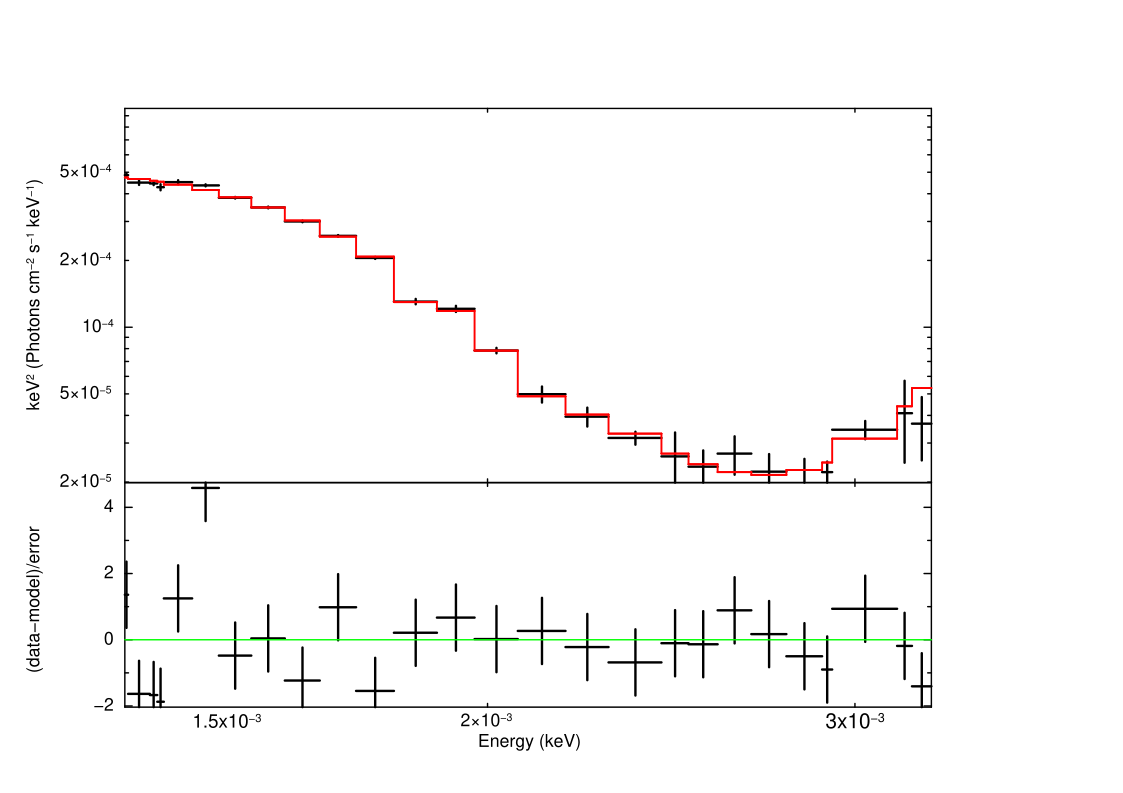
The overall parameters of our best-fit model redden*phabs*AGNSED*gabs(1)*gabs(2) are given in Table 2. The fixed values are clearly marked, and all errors were computed by XSPEC during the standard fitting process. The best-fit model versus data in the range of observational points is shown in Fig. 3 together with the residuals, which are plotted in the bottom panel. Because we used dummy responses, the figure is made in physical units. We did not consider photometric points taken from the SDSS or 2MASS surveys in our fitting procedure. Three arguments explain this approach. First, the SDSS optical photometric points lie within the errors on the SDSS spectrum, and they are very well represented by the SDSS spectrum. Including them would not improve our fit. Second, the photometric point lying at 580 Å (in the rest frame of the quasar) does not have observational errors, and these could be very large and significantly distort the results. Finally, the 2MASS points show a significant effect of radiation from molecular-dust tori. Thus, the IR points require a good fit with a torus model. Most likely, there are two sources, and additional components in the best-fit model would need to be added. However, Fig. 1 shows that the number of photometric points and their spectral energy distribution coverage in the IR is too small. Modeling these points (we have only three) would therefore increase the errors of the final results. Profit will not be significant in the face of increasing parameter uncertainty.
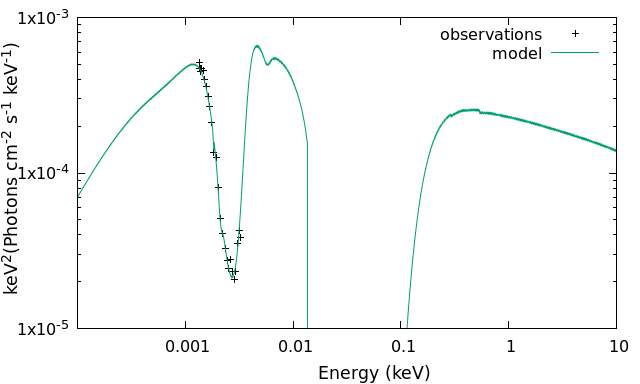
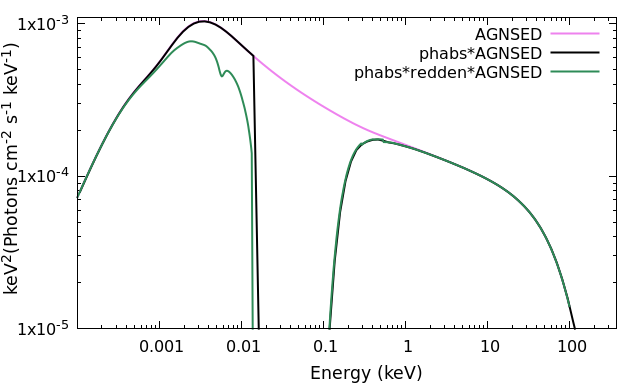
The unfolded best-fit model versus data for the broad range of energies is presented in Fig. 4 by a green line, where different absorption dips are visible. The data from the SDSS cover only one strong dip, so that in order to illustrate the origin of this dip, we present the decomposition into individual spectral components in Fig. 5. The emission by the central nucleus is shown by the pink line. The strong dip between 0.01-0.1 keV is caused by photoelectric absorption in our Galaxy, and finally, reddening diminishes the energy between 0.001-0.01 keV, producing a small dip around 0.006 keV in the final spectrum, which is given by the green line. This plot clearly shows that the dip covered by the SDSS data of J1105 is purely modeled by two Gaussian functions. The reduced for the best fit is 1.64 for 12 degrees of freedom. We analyzed a similar approach with only one Gaussian function (i.e., N=1) to describe the deep absorption. However, the reduced value was very high - 84.020 for 8 degrees of freedom (when the model did not contain Gaussian components and all of the parameters were free). On the other hand, a further increase in the number of Gaussian functions does not significantly decrease the reduced . Adding a third or fourth Gaussian function reduces the /dof values by less than 10%.
| Model | Parameter | Fitted value |
|---|---|---|
| component | and unit | and error |
| \addstackgap[.5] redden | E(B-V) | 0.0087 (fixed) |
| \addstackgap[.5] phabs | [cm-2] | (fixed) |
| \addstackgap[.5] AGNSED | [] | |
| \addstackgap[.5] | ||
| \addstackgap[.5] | cos | |
| \addstackgap[.5] | ||
| \addstackgap[.5] | [keV] | 100 (fixed) |
| \addstackgap[.5] | [keV] | 0.50 (fixed) |
| \addstackgap[.5] | 2.20 (fixed) | |
| \addstackgap[.5] | ||
| \addstackgap[.5] | [] | |
| \addstackgap[.5] | [] | |
| \addstackgap[.5] | [] | 100000 (fixed) |
| \addstackgap[.5] | [] | = |
| \addstackgap[.5] | [Mpc] | 5075 (fixed) |
| \addstackgap[.5] | 1.929(fixed) | |
| \addstackgap[.5] | normalization | |
| \addstackgap[.5] gabs(1) | [keV] | |
| \addstackgap[.5] | [keV] | |
| \addstackgap[.5] | ||
| \addstackgap[.5] gabs(2) | [keV] | |
| \addstackgap[.5] | [keV] | |
| \addstackgap[.5] |
5.1 Central engine of J1105
We have no observations in X-ray or -ray, thus the obtained parameters that describe the hot corona and the warm skin are not reliably defined. Therefore, we fixed the parameters of the hot corona as , keV, and the temperature of the warm skin, keV, as typical values estimated for quasars of similar SMBH mass (e.g., PG 1211+143, Janiuk et al. 2001; PG 1048+213, Done et al. 2012; Mrk 509, Petrucci et al. 2013; RX J0439.6-5311, Jin et al. 2017; PG 1115+407, Kubota & Done 2018; Ark 120, Porquet et al. 2018).
The photon index of the warm skin in J1105 from our fitting procedure is . It is similar to the indices seen for PG 1115+407, where = 3.06 (Kubota & Done 2018) or for narrow-line type 1 QSO RX J0439.6-5311 with = 2.72 (Jin et al. 2017).
The transition radius between the corona and the warm skin from our fitting is . By comparison, for BLS1 PG 1048+213 (Done et al. 2012), but lower values are found in other sources: 15.1-41.8 in PG 1448+273 (Ding et al. 2021) and 10 in PG 1211+143 (Janiuk et al. 2001).
The radius at which the existence of the warm skin ends in J1105, . For individual AGNs, this value can be lower. The beginning radius of the reflection component is estimated as for Ark 120 (Porquet et al. 2018). This radius is for Mrk 509 and for the lower-mass NGC 5548 (Kubota & Done 2018). Czerny et al. (2003) set at about in the case of mean quasars. Thus, it is worth noting that the description of the corona/warm skin for J1105 is well established and comparable with literature studies.
5.2 Absorbing clouds in J1105
Our result indicates that the deep absorption in J1105 could be explained by two Gaussian functions, which may describe absorption on two different clouds. All fitting parameters in the rest frame are given in Table 3. The minima of the Gaussian functions for J1105 in the rest frame are at Å, and Å with and , receptively. The absorption described by the first gabs(1) dominates and has a strength of nearly 90% of the whole recess. The origin of this deep absorption in the J1105 is unclear. Here we focus on several possible scenarios depending on two assumed interpretations of the observed features.
In the beginning, we assume the presence of two systems. The proximity to the C IV doublet (1548, 1551Å) suggests that these lines might cause the observed absorption. When we assume that the global absorption in J1105 is caused by the extended clouds that absorb C IV, then we are able to establish their shifts , and . The negative value of means that the absorbing material moves toward us. Corresponding velocities for C IV absorbers computed with the use of Eq. (2) are given in the fifth column of Table 3.
With the use of the C IV line, the first cloud may indicate the presence of intrinsic absorption with an outflowing velocity of about km s-1. The second redshifted cloud would rather be associated gas falling toward the quasar nucleus with a speed of km s-1, most probably connected with the FRADO proposed by Czerny et al. (2018). This outflow participates in the formation of the BLR and finally falls onto the accretion disk. Nevertheless, the speed of the FRADO is about 1000 km s-1 Naddaf et al. (2021); Czerny & Hryniewicz (2011), one order of magnitude lower than our second component. The speed of the FRADO modeled by these authors is only the lower limit, however, because the acceleration of the material by the line-driving mechanism is not taken into account in the computations, even when the lines are commonly observed in the quasar spectra. The FRADO can be a possible interpretation of the observed absorption in J1105. Therefore, further calculations should be made to solve it.
| N | Rest | Rest | C IV (1548, 1551 Å) | Mg II (2796, 2803 Å) | |||
| [keV] | [Å] | [Å] | [km s-1] | [cm-2] | [km s-1] | [cm-2] | |
| (1) | (2) | (3) | (4) | (5) | (6) | (7) | (8) |
When we assume that the absorption in J1105 is caused by C IV, the BI computed based on the blueshifted lines alone is equal to 20300 km s-1. This value is higher than the BI of the strongest absorbers detected so far (Pâris et al. 2018), but not impossible because at least 13 sources out of 21877 reported by these authors have a BI in the range of 20300-23758 km s-1.
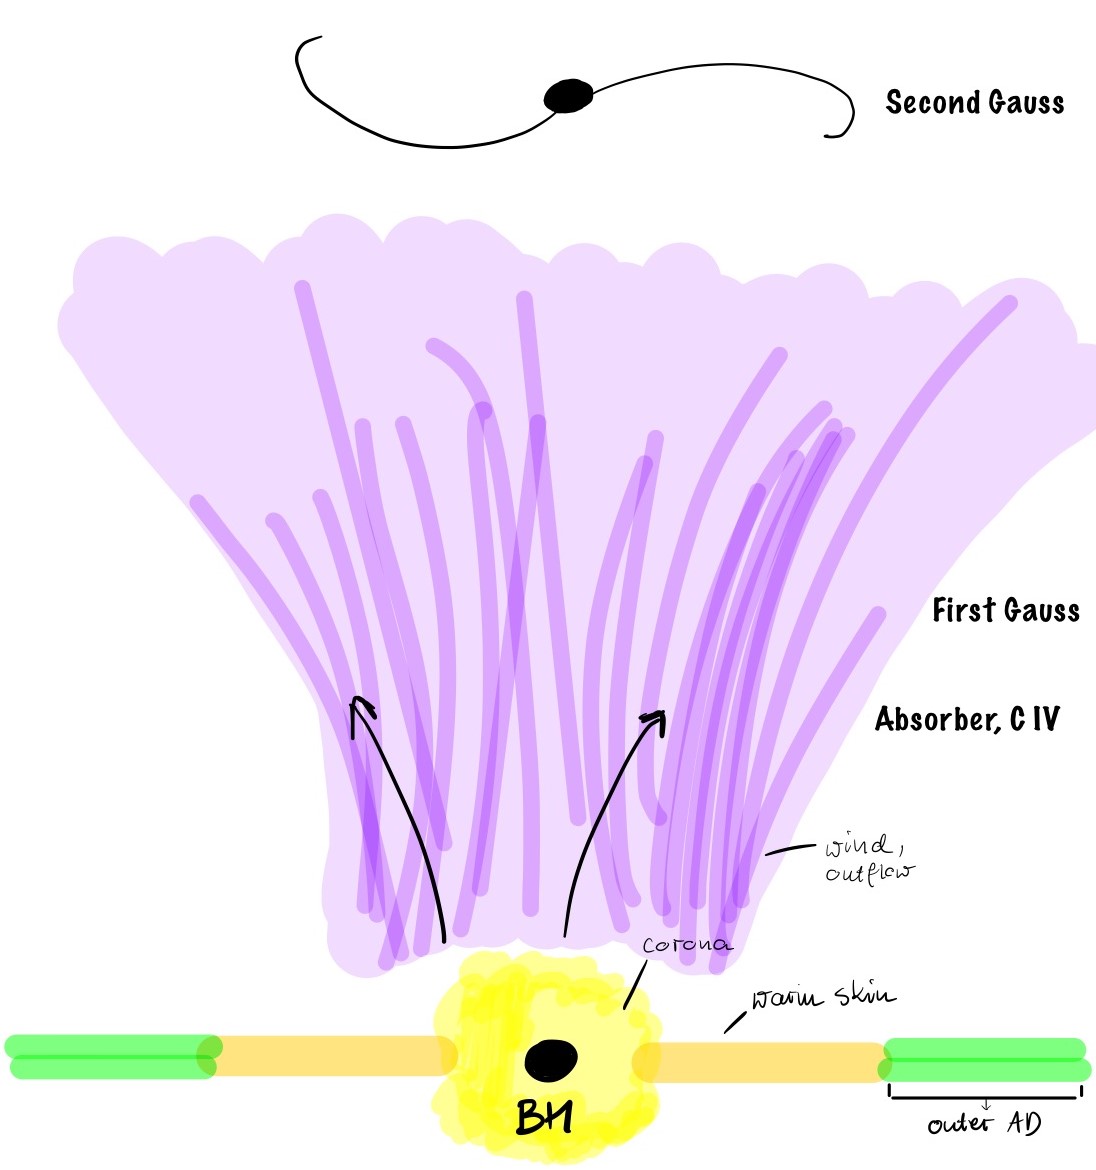
On the basis of our study, it is difficult to estimate the location of the absorbing material. We can only propose the scenario that the first Gaussian arises during absorption of radiation from the central engine by the wind that gives a rise to BAL and falls back onto the accretion disk as FRADO, while the second Gaussian can arise as absorption on a more distant gas cloud or dwarf galaxy, but still at the redshift of the observed quasar. We present the illustration of this scenario in Fig. 6.
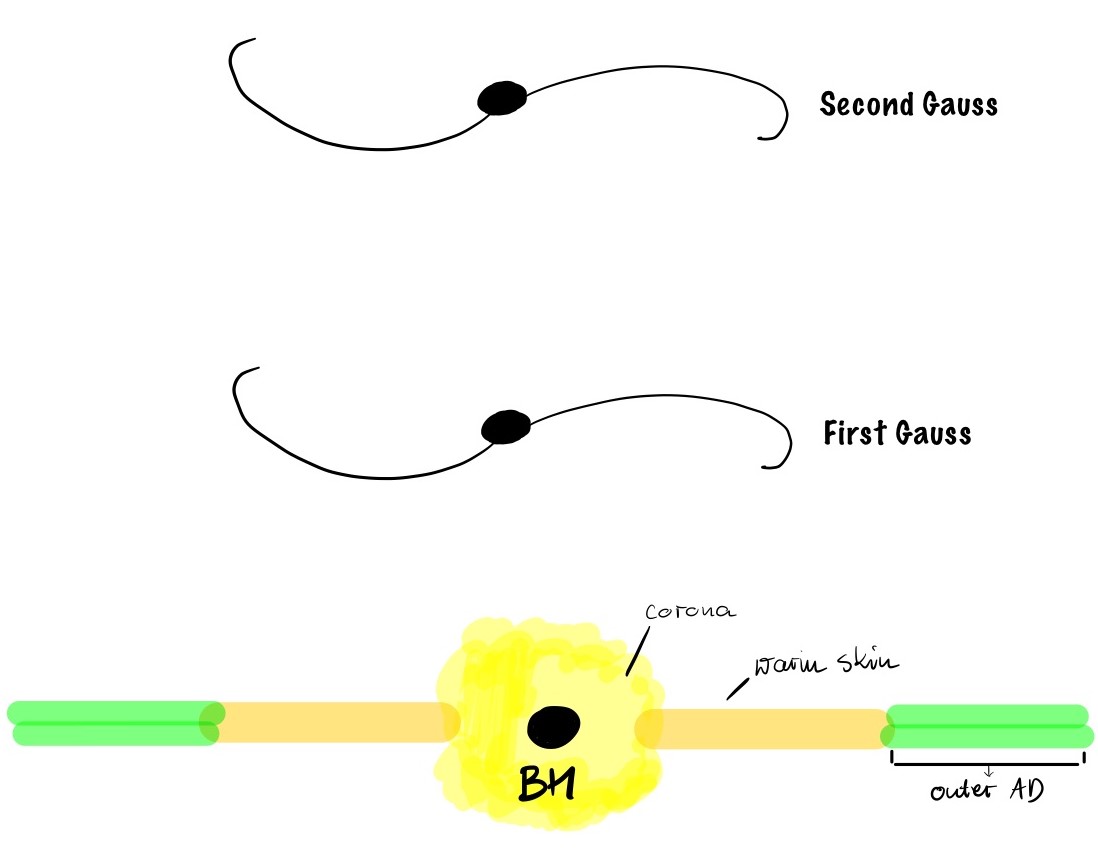
Next, we assumed that both systems exhibit absorption in Mg II (2796, 2803 Å), which is the second readily absorbed doublet. Then their , and for the first and second absorber, respectively. The corresponding velocities are listed in the seventh column of Table 3. If the deep absorption in J1105 is caused by the Mg II alone, then the situation is more clear. According to the high velocities, two absorbing clouds would be related to intervening systems that lie along the line of sight to the observer. These clouds may be associated with dwarf galaxies detached from the quasar and located on the way toward the observer, as illustrated in Fig. 7.
We have developed an algorithm to numerically compute the of the absorbing features we fit in the unfolded best-fit model. The results for two Gaussian functions are presented in the fourth column of Table 3. Next, the values were used to estimate the ionic column densities of the absorbing systems, following Eq. (3). The ion column densities are high, as expected for the deep absorption in J1105. This would imply that the total column density of the absorbing gas is high, suggesting that the source may be covered by gas with a high optical depth that should be seen in the X-ray spectrum as Compton-thick emission. X-ray detection is needed to solve this issue in future studies.
5.3 Black hole mass in J1105
The fitting procedure performed by us in this paper allowed for an indirect estimation of the SMBH mass and accretion rate because both quantities are free parameters in the AGNSED model implemented in XSPEC. We obtained and . These two values lie within a few from the values and reported by Shen et al. (2011). The authors pointed out that the two estimated values were obtained using the relation between the BH mass or accretion rate and the FWHM and luminosity of a given emission line (), and they are to be treated with caution.
Recently, it was reported by Mejía-Restrepo et al. (2018) in the case of type 1 AGN and by Marculewicz & Nikolajuk (2020) for WLQ that the and values in the relation mentioned above are biased. The reason is the poorly known geometry and dynamic of the BLR clouds that produce the emission lines. In addition, strong absorption may influence the detection of emission line profiles, and hence their velocities.
The observed narrow emission lines in J1105 (see Fig. 1) most likely originate in the narrow line region (e.g., FWHM(C IV) km s-1 ; Shen et al. 2011). Therefore, the emission lines from the BLR were never observed, and we can only assume that they may reach velocities comparable to our winds described in the section above. With this crude assumption, we may suspect that BLR lines may reach velocities of km s-1. According to the formulas used in Mejía-Restrepo et al. (2018, see Fig.2 for illustration), this means that the real BH mass is two orders of magnitude lower than the so-called virial mass reported by Shen et al. (2011). Follwing Mejía-Restrepo et al. (2018), we adopted a virial factor , that is, the ratio of to the SE virial mass estimator, that is inversely proportional to the FWHM for all lines, and it is 1 for FWHM km s-1 in case of Mg II.
We obtain this BH mass, two orders of magnitude lower than the virial mass, from our continuum-fitting method. This result only fits in the case of our fastest wind reported in Table 3, and it clearly indicates the correctness of the work made by authors who aimed to find the proper relation between the SE virial mass estimation and . Even though our method does not use the FWHM (line) to calculate or , the total model depends on many parameters, and our BH mass estimation is just an exemplary exercise and may deliver different results, while X-ray data will be available for J1105 in the near future.
5.4 Mass outflow rates
The outflow velocities obtained by us have rather high values, therefore they may produce a huge mass outflow from the quasar into the intergalactic medium. Following the commonly used procedure, we computed overall mass outflow rates for J1105 based on the measured bolometric luminosities, given in Sec. 2.1, and the velocities reported in Table 3. We describe our results in Table 4. We note that our continuum-fitting method allows us to compute the total luminosity from a measured accretion rate, which in case of a typical accretion efficiency between 0.06-0.08 is erg s-1, that is, an order of magnitude higher than the bolometric luminosity measured from a monochromatic source luminosity at 3000Å (see Sec. 2.1).
Nevertheless, we lack information about the radiation that is released when accretion interacts with wind, therefore we should treat this value with caution. We adopted the value of calculated from the luminosity at 3000Å as more realistic, but we recall that the bolometric luminosity taken from the value of the accretion rate produces a mass outflow of about 106.81 yr-1 for the stronger C IV(1) absorber (visible at 1516 Å). Tombesi et al. (2012) observed 42 local radio-quiet AGNs and constrained the mass outflow rates between 0.01 and 1 yr-1, which is slightly lower than those of J1105. The first indication is that the difference may come from the redshift, that is, the local radio-quiet sample versus z = 1.929 of J1105. This conclusion can be confirmed by the recent results obtained from 14 QSOs in the redshift range of 1.41–3.91, which indicates that outflows with higher mass outflow rates reached even yr-1 in case of APM 08279+5255, classified as BALQSO with [] (Chartas et al. 2021, Table 9). All 14 reported quasars have measured mass outflow rates in the range from yr-1, which is consistent with our result. This indicates similarities with J1105 regarding the redshift and value of the outflow.
| Absorber | N | [erg s-1] | [ yr-1] |
|---|---|---|---|
| \addstackgap[.5] C IV | 1 | 46.106 | |
| \addstackgap[.5] | 46.225 | ||
| \addstackgap[.5] | 2 | 46.106 | |
| \addstackgap[.5] | 46.225 | ||
| \addstackgap[.5] Mg II | 1 | 46.106 | |
| \addstackgap[.5] | 46.225 | ||
| \addstackgap[.5] | 2 | 46.106 | |
| \addstackgap[.5] | 46.225 |
The typical value of the mass outflow rate for sources accreting below or close to the Eddington limit is 5-10% (where is the mass accretion rate in yr-1) for both UFOs and non-UFOs (Tombesi et al. 2012). Taking into account our fitted value of the accretion rate of J1105 (, which corresponds to yr-1), we achieved a huge mechanical power 1.7-38.5% in case of three outflows (C IV(1), Mg II(1), and Mg II(2) from Table 4) observed in our quasar. This mechanical power may cause a significant feedback impact on the surrounding medium. We conclude here that highly absorbed quasars may produce massive outflows, which may reach velocities comparable to UFOs. Nevertheless, observations of J1105 in the X-ray domain are needed to confirm this statement.
Massive outflows were also detected in the past on the basis of observations of neutral gas in H I absorption, indicating yr-1 (Morganti et al. 2005) and in starburst-driven super-winds in ultraluminous IR galaxies (ULIRG), which in general show a mass outflow range between yr-1 (Rupke et al. 2005; Netzer 2013; Tombesi 2016). The origin of these outflows was explained based on the fast winds, which are strong evidence of the interaction between radio jets and the surrounding interstellar medium. In the future development of J1105 with new observations in all energy domains, we can verify the presence of a jet-driven outflow.
6 Discussion and conclusions
We analyzed the absorbed optical/UV spectrum of the SDSS J110511.15+530806.5 quasar, which was not extensively observed in the past. Our analysis was made assuming that the central engine consists of an accretion disk and an eventual warm corona, but we lacked points in the X-ray domain. This was done to explain the deep absorption in the considered quasar when the continuum model has to be fitted first. Our approach assumed that this deep absorption can be explained by two broad Gaussian functions in addition to the AGNSED model that is available in the XSPEC fitting package. First, we checked that this deep absorption, which is not observed in other quasars, cannot be explained by different extinction laws for the Galaxy dust and grains.
In order to explain the observed absorption, we modeled the intrinsic emission from the source nucleus. In the case of J1105, the intrinsic radiation of the central engine was analyzed as the sum of emission from an accretion disk, warm skin, and hot corona components with the standard XSPEC model. The fit parameters that describe the corona and warm skin in the case of our quasar should be treated with caution, however, because even though they are comparable with the literature studies of similar objects, we lack X-ray observations of J1105. The overall spectral shape of J1105 in X-ray domain is needed to place final constraints on its central engine parameters.
In the next step of our analysis, the deep absorption was represented by two Gaussian functions that reflect two absorbing systems presented on the way toward an observer. Further conclusions depend on the ion by which we identify the two absorbers. With the use of the C IV line, the first and dominant Gaussian function represents an outflow toward us with a speed of about 6330 km s-1. This wind may be associated with intrinsic absorption that is typically observed in QSOs and is caused by a distant wind originating from an accretion disk or disk and jet interaction. The speed of the second absorber is high, about 74000 km s-1, and speaks for gas moving toward the center of the quasars. Most probably, this is connected with the FRADO proposed by Czerny et al. (2018). This outflow participates in the formation of the BLR and finally falls onto the accretion disk. Nevertheless, the speed of the FRADO is about 1000 km s-1 (Naddaf et al. 2021; Czerny & Hryniewicz 2011), one order of magnitude lower than in the case of the velocity found in this paper. On the other hand, the speed of the FRADO modeled by the above authors is only a lower limit because the acceleration of the absorbing gas by the line-driving mechanism was not taken into account in their computations (Naddaf et al. 2021, private com.). Simulations show that line-driven winds may accelerate gas to huge velocities (Proga et al. 2000), and our measurement may be physically possible. Further theoretical achievement in estimating the FRADO velocities that includes line-driven acceleration may solve this issue in the near future.
Based on the Mg II line, both velocities point out the intervening systems with the quasar gas moving toward us with speeds of about 108000 and 74000 km s-1 for the first and second absorber, respectively. Fast winds like this produce a high mass outflow rate that in the case of our fastest wind reaches 38.5% of the disk accretion rate derived from the fit. This massive outflow may cause a significant feedback impact on the surrounding medium. We conclude here that highly absorbed quasars may produce massive outflows, which may reach velocities comparable to those of UFOs. Tombesi et al. (2013) examined a Seyfert 1 sample with velocities in the range , exactly the values obtained for J1105 in the case of an Mg II absorber. This might suggest that the UFO concept is a plausible explanation of the abnormal properties of the SDSS spectrum of J1105.
The massiveness of the outflow detected in this paper manifests itself at mass outflow rates up to yr-1 computed on the basis of the bolometric luminosity measurements for J1105, and even up to yr-1 for the bolometric luminosity computed from the accretion rate obtained from the continuum fitting analysis. A high mass outflow rate is seen in more ULIRGs, which show outflows rates ranging from 10 to 1000 yr-1 (e.g., Rupke et al. 2005). Additionally, Netzer (2013) indicated that some of the ULIRGs have outflow velocities exceeding 1000 km s-1 and mass outflow rates 1200 yr-1. The origin of these winds is still unknown, but in the case of ULIRG sources, it is often interpreted as an interaction of the jet with the surrounding interstellar medium.
The ion column densities in the two absorbers are high, as expected for the deep absorption in J1105. For example, Saez et al. (2021) indicated that the values of the logarithms of the column density of CIV in BAL QSO PG 2112+059 are in the range 15.38-15.81, and they varied over 13 years. Additionally, when they assumed that the absorber was seen partially and the covering factor of the absorber was 60%, then the mean log of the absorber was even higher and equal to 16.12. We did not consider any partial covering in our analysis so far. This point will be included when better spectra are available from future monitoring of the source. For , the ion column density is also high in the J1105 quasar. However, seen in the system B of HS 1603+3820 quasar is (Dobrzycki et al. 2007) and is comparable within the 1 error with the value obtained in this paper for the J1105 quasar.
When we take into account that the absorption is caused by the C IV doublet, the BI is equal to 20300 km s-1for the quasar considered in this paper. This value is as high as the BI seen in the strongest BAL QSOs. In the SDSS quasar catalog DR14 (Pâris et al. 2018), only 0.06% (13/21877) of the BAL quasars have this index lying between 20300 and 23758 km s-1. Future observations of the absorbing features in J1105 may prove our hypothesis that the quasar has an extremely strong BAL.
The continuum-fitting method allowed us to estimate the BH mass and accretion rate in J1105. We obtained and , values that differ from previous estimations. The BH mass is two orders of magnitude lower than previously reported (Shen et al. 2011, ). Moreover, the accretion rate obtained by us shifts the quasar toward bright objects that radiate away 20% of their accretion power. These results need to be confirmed by future studies with X-ray data of J1105.
The BH mass of J1105 we found needs special attention. We showed that the fasted wind velocity detected by us, that is, km s-1, can be attributed to the BLR, therefore the virial factor examined by Mejía-Restrepo et al. (2018) is about . This virial index means that the real BH mass is exactly two orders of magnitude lower than the virial mass found with RM and SE measurements. This is what we obtained here, and this result confirms the hypothesis that BH mass estimations based on lines are affected by the presence of wind and should be corrected according to formulas given by Mejía-Restrepo et al. (2018) in the case of normal AGNs and by Marculewicz & Nikolajuk (2020) in case of WLQ. This result is also intriguing from another point of view. It indicates that the strong absorption, however, is due to the fast wind and not to the presence of a dwarf galaxy along the line of sight of the J1105 quasar.
We take the following message for the future from our studies. The explanation of the origin of the absorption may lie in new X-ray, optical, UV, infrared, and radio observations, which we are planning to conduct.
Particularly the Hubble Space Telescope or James Webb Space Telescope would be very helpful to deliver the best-resolution data from distant sources such as the quasar presented in this paper. With the use of new data, it would be important to determine whether the outflow of J1105 is caused similarly to the H I outflow by the mechanism that indicates the interaction between radio jets and the surrounding interstellar medium. It is necessary to determine how the outflow mass rate in J1105 relates to the global paradigm of deep unusual absorption with high-velocity winds. In the future development of J1105 and with new observations, we will be able to determine whether X-ray and/or radio observations contain an indication of the influence of a jet-driven outflow. It would be possible to determine the properties of the central engine and the BH mass with the correct virial factor in highly absorbed quasars if we collected a sample of these objects.
Acknowledgements.
We would like to thank the anonymous referee for useful comments that improved the clarity of the paper. We also thank Bożena Czerny, Krzysztof Hryniewicz, and Raj Prince for helpful feedback and discussions. AR was partially funded by National Science Center grant Nr. 2021/41/B/ST9/04110. This publication makes use of data from the Sloan Digital Sky Survey (SDSS) and the NASA/IPAC Extragalactic Database (NED).References
- Abazajian et al. (2009) Abazajian, K. N., Adelman-McCarthy, J. K., Agüeros, M. A., et al. 2009, ApJS, 182, 543
- Adelman-McCarthy et al. (2008) Adelman-McCarthy, J. K., Agüeros, M. A., Allam, S. S., et al. 2008, ApJS, 175, 297
- Allen et al. (2011) Allen, J. T., Hewett, P. C., Maddox, N., Richards, G. T., & Belokurov, V. 2011, MNRAS, 410, 860
- Arnaud (1996) Arnaud, K. A. 1996, in Astronomical Society of the Pacific Conference Series, Vol. 101, Astronomical Data Analysis Software and Systems V, ed. G. H. Jacoby & J. Barnes, 17
- Bentz & Manne-Nicholas (2018) Bentz, M. C. & Manne-Nicholas, E. 2018, ApJ, 864, 146
- Blandford & McKee (1982) Blandford, R. D. & McKee, C. F. 1982, ApJ, 255, 419
- Cardelli et al. (1989) Cardelli, J. A., Clayton, G. C., & Mathis, J. S. 1989, ApJ, 345, 245
- Chartas et al. (2021) Chartas, G., Cappi, M., Vignali, C., et al. 2021, ApJ, 920, 24
- Chen et al. (2018) Chen, Z.-F., Huang, W.-R., Pang, T.-T., et al. 2018, ApJS, 235, 11
- Czerny & Hryniewicz (2011) Czerny, B. & Hryniewicz, K. 2011, A&A, 525, L8
- Czerny et al. (2018) Czerny, B., Karas, V., Li, Y.-R., et al. 2018, in XXXVIII Polish Astronomical Society Meeting, ed. A. Różańska, Vol. 7, 264–266
- Czerny et al. (2004) Czerny, B., Li, J., Loska, Z., & Szczerba, R. 2004, MNRAS, 348, L54
- Czerny et al. (2003) Czerny, B., Nikołajuk, M., Różańska, A., et al. 2003, A&A, 412, 317
- Ding et al. (2021) Ding, N., Gu, Q., Tang, Y., et al. 2021, A&A, 650, A183
- Dobrzycki et al. (2007) Dobrzycki, A., Nikolajuk, M., Bechtold, J., et al. 2007, A&A, 476, 1205
- Done et al. (2012) Done, C., Davis, S. W., Jin, C., Blaes, O., & Ward, M. 2012, MNRAS, 420, 1848
- Fitzpatrick (1999) Fitzpatrick, E. L. 1999, PASP, 111, 63
- Gibson et al. (2009) Gibson, R. R., Jiang, L., Brandt, W. N., et al. 2009, ApJ, 692, 758
- Greene & Ho (2004) Greene, J. E. & Ho, L. C. 2004, ApJ, 610, 722
- Griesmann & Kling (2000) Griesmann, U. & Kling, R. 2000, ApJ, 536, L113
- Gronkiewicz & Różańska (2020) Gronkiewicz, D. & Różańska, A. 2020, A&A, 633, A35
- Janiuk et al. (2001) Janiuk, A., Czerny, B., & Madejski, G. M. 2001, ApJ, 557, 408
- Jiang et al. (2013) Jiang, P., Zhou, H., Ji, T., et al. 2013, AJ, 145, 157
- Jin et al. (2017) Jin, C., Done, C., & Ward, M. 2017, MNRAS, 468, 3663
- Knigge et al. (2008) Knigge, C., Scaringi, S., Goad, M. R., & Cottis, C. E. 2008, MNRAS, 386, 1426
- Kubota & Done (2018) Kubota, A. & Done, C. 2018, MNRAS, 480, 1247
- Marculewicz & Nikolajuk (2020) Marculewicz, M. & Nikolajuk, M. 2020, ApJ, 897, 117
- Mejía-Restrepo et al. (2018) Mejía-Restrepo, J. E., Lira, P., Netzer, H., Trakhtenbrot, B., & Capellupo, D. M. 2018, Nature Astronomy, 2, 63
- Meusinger et al. (2016) Meusinger, H., Schalldach, P., Mirhosseini, A., & Pertermann, F. 2016, A&A, 587, A83
- Morganti et al. (2005) Morganti, R., Tadhunter, C. N., & Oosterloo, T. A. 2005, A&A, 444, L9
- Morton (2003) Morton, D. C. 2003, ApJS, 149, 205
- Naddaf et al. (2021) Naddaf, M.-H., Czerny, B., & Szczerba, R. 2021, ApJ, 920, 30
- Netzer (2013) Netzer, H. 2013, The Physics and Evolution of Active Galactic Nuclei (Cambridge University Press; 1 edition)
- Netzer (2019) Netzer, H. 2019, MNRAS, 488, 5185
- Novikov & Thorne (1973) Novikov, I. D. & Thorne, K. S. 1973, in Black Holes (Les Astres Occlus), 343–450
- Pâris et al. (2018) Pâris, I., Petitjean, P., Aubourg, É., et al. 2018, A&A, 613, A51
- Peterson (1993) Peterson, B. M. 1993, PASP, 105, 247
- Peterson (2004) Peterson, B. M. 2004, in IAU Symposium, Vol. 222, The Interplay Among Black Holes, Stars and ISM in Galactic Nuclei, ed. T. Storchi-Bergmann, L. C. Ho, & H. R. Schmitt, 15–20
- Petrucci et al. (2013) Petrucci, P. O., Paltani, S., Malzac, J., et al. 2013, A&A, 549, A73
- Petrucci et al. (2018) Petrucci, P. O., Ursini, F., De Rosa, A., et al. 2018, A&A, 611, A59
- Porquet et al. (2018) Porquet, D., Reeves, J. N., Matt, G., et al. 2018, A&A, 609, A42
- Proga et al. (2000) Proga, D., Stone, J. M., & Kallman, T. R. 2000, ApJ, 543, 686
- Rankine et al. (2020) Rankine, A. L., Hewett, P. C., Banerji, M., & Richards, G. T. 2020, MNRAS, 492, 4553
- Richards et al. (2003) Richards, G. T., Hall, P. B., Vanden Berk, D. E., et al. 2003, AJ, 126, 1131
- Rupke et al. (2005) Rupke, D. S., Veilleux, S., & Sanders, D. B. 2005, ApJS, 160, 115
- Saez et al. (2021) Saez, C., Brandt, W. N., Bauer, F. E., et al. 2021, MNRAS, 506, 343
- Schlafly & Finkbeiner (2011) Schlafly, E. F. & Finkbeiner, D. P. 2011, ApJ, 737, 103
- Schlegel et al. (1998) Schlegel, D. J., Finkbeiner, D. P., & Davis, M. 1998, ApJ, 500, 525
- Shakura & Sunyaev (1973) Shakura, N. I. & Sunyaev, R. A. 1973, A&A, 500, 33
- Shen (2013) Shen, Y. 2013, Bulletin of the Astronomical Society of India, 41, 61
- Shen et al. (2008) Shen, Y., Greene, J. E., Strauss, M. A., Richards, G. T., & Schneider, D. P. 2008, ApJ, 680, 169
- Shen et al. (2019) Shen, Y., Grier, C. J., Horne, K., et al. 2019, ApJ, 883, L14
- Shen et al. (2011) Shen, Y., Richards, G. T., Strauss, M. A., et al. 2011, ApJS, 194, 45
- Skrutskie et al. (2006) Skrutskie, M. F., Cutri, R. M., Stiening, R., et al. 2006, AJ, 131, 1163
- Spergel et al. (2007) Spergel, D. N., Bean, R., Doré, O., et al. 2007, ApJS, 170, 377
- Stone & Richards (2019) Stone, R. B. & Richards, G. T. 2019, MNRAS, 488, 5916
- Tombesi (2016) Tombesi, F. 2016, Astronomische Nachrichten, 337, 410
- Tombesi et al. (2012) Tombesi, F., Cappi, M., Reeves, J. N., & Braito, V. 2012, MNRAS, 422, L1
- Tombesi et al. (2013) Tombesi, F., Cappi, M., Reeves, J. N., et al. 2013, MNRAS, 430, 1102
- Vestergaard (2003) Vestergaard, M. 2003, ApJ, 599, 116
- Wickramasinghe & Hoyle (1998) Wickramasinghe, N. C. & Hoyle, F. 1998, Ap&SS, 259, 379
- Wild et al. (2008) Wild, V., Kauffmann, G., White, S., et al. 2008, MNRAS, 388, 227