How does thermal pressurization of pore fluids affect 3D strike-slip earthquake dynamics and ground motions?
Abstract
Frictional heat during earthquake rupture raises the pressure of fault zone fluids and affects the rupture process and its seismic radiation. Here, we investigate the role of two key parameters governing thermal-pressurization of pore fluids – hydraulic diffusivity and shear-zone half-width – on earthquake rupture dynamics, kinematic source properties and ground-motions. We conduct 3D strike-slip dynamic rupture simulations assuming a rate-and-state dependent friction law with strong velocity-weakening coupled to thermal-pressurization of pore fluids. Dynamic rupture evolution and ground-shaking are densely evaluated across the fault and Earth surface to analyze variations of rupture parameters (slip, peak slip-rate PSR, rupture speed Vr, rise time Tr), correlations among rupture parameters, and variability of peak ground velocity (PGV).
Our simulations reveal how variations in thermal-pressurization affect source properties. We find that mean slip and Tr decrease with increasing hydraulic diffusivity, whereas mean Vr and PSR remain almost constant. Mean slip, PSR and Vr decrease with increasing shear-zone half-width, whereas mean Tr increases. Shear-zone half-width distinctly affects the correlation between rupture parameters, especially for parameter pairs slip-Vr, PSR-Vr and Vr-Tr. Hydraulic diffusivity has negligible effects on these correlations. Variations in shear-zone half-width primarily impact Vr, which then may affect other rupture parameters. We find negative correlation between slip and PSR, in contrast to simpler dynamic rupture models, whereas trends for other parameter pairs are in agreement. Mean PGVs decrease faster with increasing shear-zone half-width than with hydraulic diffusivity, whereas ground-motion variability is similarly affected by both parameters. Our results show that shear-zone half-width affects rupture dynamics, kinematic rupture properties and ground-shaking more strongly than hydraulic diffusivity. We interpret the importance of shear-zone half-width based on the characteristic time of diffusion.
Introduction
Most rocks in the upper crust are porous and are likely to contain small amounts of fluids, and fault zones often are privileged paths for fluid transport in the crust. Pore fluids can affect the stress and strain conditions of rocks before, during and after an earthquake (Sibson,, 1973, 1977, 1980; Lamb,, 2006; Madden et al.,, 2022). Frictional heat produced in the slip zone during earthquake rupture can cause thermal expansion, flow and pressurization of pore fluids impacting the stress conditions on the fault and in the surrounding rocks (Sibson,, 1973, 1980; Lachenbruch,, 1980; Mase and Smith,, 1984, 1987; Andrews,, 2002). Thermal pressurization of pore fluids (TP) is considered a dominant dynamic weakening mechanism affecting earthquake rupture nucleation, propagation and arrest. The TP mechanism operates as follows: thermal expansion and confinement of fluids within a rock matrix of lower thermal expansivity produces a stark increase of pore fluid pressure; this decreases effective normal stress, which in turn lowers fault frictional strength, thereby enhancing fault dynamic weakening during earthquake rupture (Andrews,, 2002; Suzuki and Yamashita,, 2006; Bizzarri and Cocco, 2006a, ; Bizzarri and Cocco, 2006b, ; Noda and Lapusta,, 2010; Garagash,, 2012; Viesca and Garagash,, 2015; Brantut et al.,, 2019; Badt et al.,, 2020). The resulting extreme reduction of fault strength may prevent co-seismic melting and resolve the so-called heat-flow paradox (Lachenbruch and Sass,, 1980; Andrews,, 2002; Di Toro et al.,, 2011; Acosta et al.,, 2018; Badt et al.,, 2020).
TP effects may play a significant role in modulating the magnitude of induced or triggered earthquakes in georeservoirs, governed by pressure change and fluid flow (e.g. Galis et al.,, 2017). Fluid-saturated clay-rich fault materials present in subduction zone environments may promote earthquake rupture propagation and slip due to pressurisation of pore fluid and low permeability of surrounding materials, resulting in dynamic weakening behaviour and low breakdown work (Hirono et al.,, 2016; Aretusini et al.,, 2021). TP may also govern subduction dynamics, as suggested by geological signatures found in exhumed ancient subduction thrusts, including fluidization of comminuted material and increase in the volume of fluid inclusions by frictional heating (Ujiie et al.,, 2010). TP effects may lead to slip-weakening distances ranging from 0.03 to 0.22 m for subduction thrusts, which indicates high radiated energy and fast stress release (Ujiie et al.,, 2010). TP may also explain why stable creeping parts of the fault become unstable during coseismic slip, as observed during the 2011 Tohoku Oki earthquake (Mitsui et al.,, 2012; Noda and Lapusta,, 2013).
Theoretical and numerical studies suggest that TP may also affect earthquake rupture properties such as stress drop and fracture energy. Andrews, (2002) shows that the stress drop associated with TP rises with increasing rupture propagation distance, and may eventually dominate over the frictional induced stress drop. Recently, Perry et al., (2020) demonstrated that enhanced dynamic weakening due to TP is consistent with the observationally inferred magnitude-invariance of stress drop. Simulations of earthquake sequences on rate-and-state faults with TP suggest that major faults operate at low overall shear stress levels, while the peak stress at the rupture front is consistent with static friction coefficients of (Noda et al.,, 2009). Viesca and Garagash, (2015) hypothesize that TP may explain the observed distinct transition in scaling of fracture energy with earthquake size, which implies different fault weakening processes for large and small earthquakes. Moreover, the seismologically inferred increase in fracture energy with earthquake magnitude may also be explained with TP (Abercrombie and Rice,, 2005; Rice,, 2006; Viesca and Garagash,, 2015; Perry et al.,, 2020). In dynamic earthquake rupture simulations, TP facilitates rupture propagation and activation of fault branches, and increases rupture speed and slip rate (Urata et al.,, 2014; Schmitt et al.,, 2015).
Lambert et al., (2021) examined why large earthquakes occur at lower levels of stress than their expected static strength using numerical seismic-cycle modeling. They tested two competing hypotheses: (1) faults are quasi-statically strong but experience significant weakening during earthquake rupture, and (2) faults are persistently weak because of pore fluid overpressure. They found that the former produces sharper self-healing pulse-like ruptures, larger dynamic stress changes and larger radiated energy than that inferred for megathrust earthquakes, whereas the latter produces crack-like ruptures. Therefore, their findings suggest two possibilities: either large earthquakes do not propagate as self-healing pulses, or the radiated energy is substantially underestimated for megathrust earthquakes. Their results raise questions about earthquake rupture physics for large events and their weakening mechanisms.
Acosta et al., (2018) performed laboratory experiments to investigate the role of flash heating and TP on dynamic weakening of faults. They observed that loss in fault strength is due to flash heating under dry and low pressure (1 MPa) conditions, whereas at high fluid pressure (25 MPa) flash heating is inhibited and TP becomes important. Badt et al., (2020) tested the mechanical response of faults under elevated confining and pore pressures in laboratory experiments and suggest that the magnitude and rate of weakening increases as the sample permeability decreases with limited frictional heat production. Their experiments support the hypothesis that TP is an active dynamic weakening mechanism during earthquake rupture at least in the early stages of fault slip.
Seismic radiation and near-field ground-motion characteristics depend on earthquake rupture dynamics. Observations of strong ground motions show intricate variations depending on parameters like source-to-site distance, earthquake magnitude and faulting style, hypocenter position, azimuth with respect to fault plane and rupture direction, and more (Youngs et al.,, 1995; Rodriguez-Marek et al.,, 2011; Imtiaz et al.,, 2015; Vyas et al.,, 2016; Gallovič,, 2017; Crempien and Archuleta,, 2018). The question is how TP may modulate the intensity and spectral properties of near-fault ground motions. For instance, a higher spectral velocity response at long periods ( 10 s) observed at receivers near the northern portion of the main fault of the Mw 7.6 1999 Chi-chi, Taiwan earthquake, compared to recordings at receivers near the southern portion of fault, has been attributed to TP (Andrews,, 2005). Hence, here we investigate the effect of TP on rupture dynamics and ground-motion properties.
Several numerical implementations have been proposed to include TP in dynamic earthquake rupture modeling based on the theoretical foundations of the conservation of fluid mass and energy, Fourier’s law and Darcy’s law (Andrews,, 2002; Bizzarri and Cocco, 2006a, ; Bizzarri and Cocco, 2006b, ; Noda et al.,, 2009; Noda and Lapusta,, 2010; Schmitt et al.,, 2015). However, no detailed investigation exists on how TP influences dynamic and kinematic properties and ground motion characteristics associated with earthquake rupture. In this study, we perform a parametric sensitivity analysis using 3D dynamic rupture modeling with a strong velocity-weakening rate-and-state friction law and TP to examine and quantify the influence of TP on kinematic rupture characteristics, such as fault slip, peak slip rate (PSR), rupture speed (Vr) and rise time (Tr). Correlation among these kinematic rupture parameters has been previously analyzed using numerical models that did not incorporate TP (e.g., Oglesby and Day,, 2002; Guatteri et al.,, 2003; Schmedes et al.,, 2010, 2013; Mai et al.,, 2018). Here, we examine how TP alters such correlations. Additionally, we investigate the effects of TP on earthquake ground-motion properties.
Computational method and model setup
We perform 3D dynamic rupture modeling of strike-slip earthquakes accounting for TP. The 3D benchmark parametrization by Ulrich et al., (2020) forms the basis for these simulations. In this section, we provide details on the fault friction law, the TP model, the numerical method and the parameter space explored.
Frictional properties
We adopt a strong velocity-weakening rate-and-state friction law (Dunham et al.,, 2011) that replicates the large friction reduction observed in laboratory experiments at co-seismic slip rates (Di Toro et al.,, 2011). The shear strength of the fault is the product of the friction coefficient and effective normal stress :
| (1) |
The friction coefficient is a function of slip velocity () and a state variable ():
| (2) |
The state variable evolves according to the following equation:
| (3) |
where the steady-state value of the state variable is
| (4) |
The steady state friction coefficient depends on as
| (5) |
with a low-velocity steady-state friction coefficient given by
| (6) |
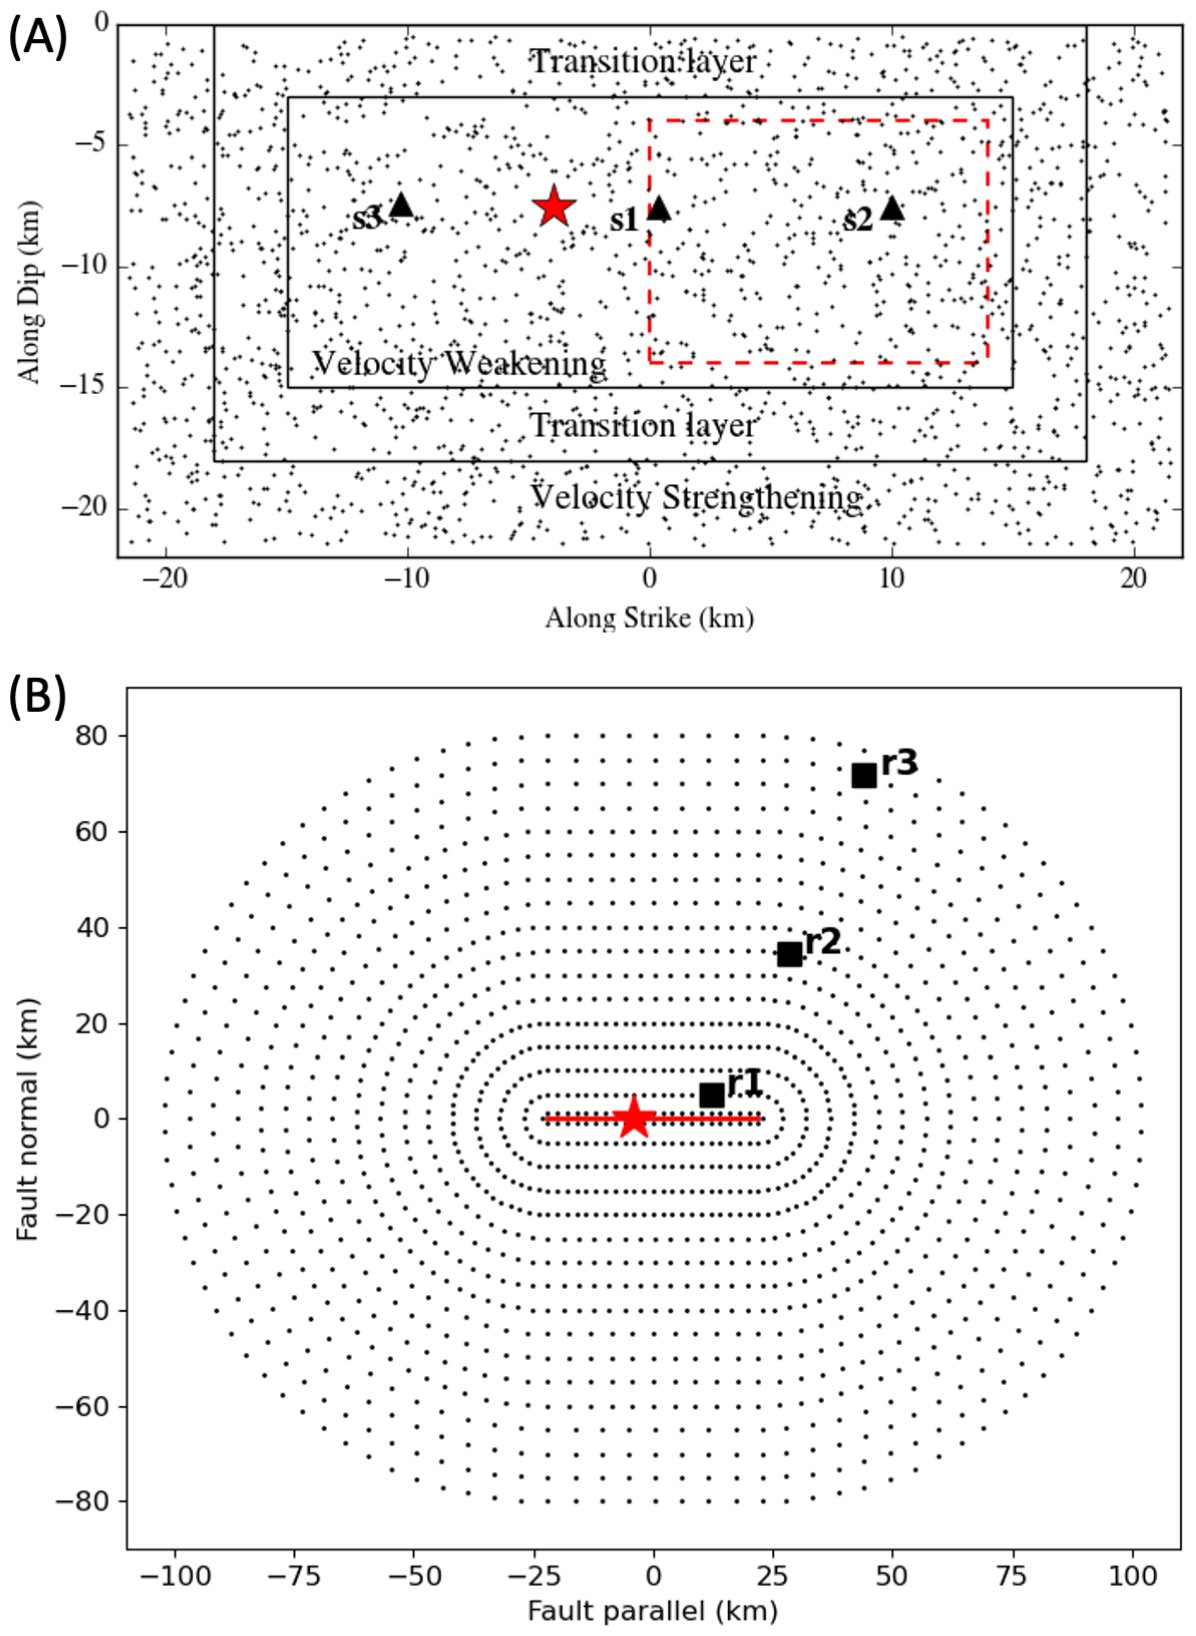
The reference friction coefficient (), reference slip velocity (), direct effect parameter (), state evolution effect parameter (), fully-weakened friction coefficient (), weakening slip velocity () and state evolution distance () are chosen as constant over the central region of the fault, a rectangular velocity-weakening asperity (see Figure 1 and Table 1). The frictional behaviour transitions to velocity-strengthening in the surrounding region (Figure 1A), over a transition zone with a width () of 3 km, and allows a gradual arrest of the rupture in all simulations. Rupture is inhibited by increasing the direct effect parameter up to and the weakening slip velocity up to via the following spatial distributions:
| (7) |
| (8) |
where
| (9) |
| (10) |
defines a right-handed coordinate system in which is the strike direction and the vertical upwards direction, such that is in the center of the fault and at the ground surface. In this study, we assume = 15 , = 3 , = 0.01 and = 0.95.
Thermal pressurization
To include TP effects, we solve the 1D diffusion equations for temperature () and pore pressure () in direction normal to the fault (Noda and Lapusta,, 2010):
| (11) |
| (12) |
where is the thermal diffusivity, the volumetric heat capacity, the shear strength, the slip velocity, the shear-zone half-width, the hydraulic diffusivity and the pore pressure increase per unit increase in temperature. The 1D approximation is valid since dynamic rupture time scales are short compared to the time scales of diffusion along the fault (Zhu et al.,, 2020). We follow Noda and Lapusta, (2010), Noda et al., (2009) and Andrews, (2002) in assuming that the shear strain rate has a Gaussian profile in the fault-normal direction, while Bizzarri and Cocco, 2006a ; Bizzarri and Cocco, 2006b assumed a uniform profile.
We set as constant in the velocity-weakening region and increasing by in the velocity-strengthening region, with the following spatial distribution:
| (13) |
where and
| (14) |
Laboratory experiments and previous numerical simulations accounting for TP suggest that from to and from to (Kranz et al.,, 1990; Andrews,, 2002; Wibberley,, 2002; Wibberley and Shimamoto,, 2005; Noda et al.,, 2009; Schmitt et al.,, 2015; Noda and Lapusta,, 2010; Perry et al.,, 2020; Lambert et al.,, 2021). Here, we vary the values of both parameters as indicated in Table 1. The and ranges in Table 1 allow rupture to propagate over entire fault as mostly subshear (only local supershear occurs) with smooth arrest providing realistic rupture process and preventing very high temperatures (T 1200 K).
Numerical method and discretisation
We use the open source software SeisSol, based on the Arbitrary high-order accurate DERivative Discontinuous Galerkin method (ADER-DG)(Dumbser and Käser,, 2006; Pelties et al.,, 2014; Uphoff et al.,, 2017), to solve the coupled dynamic rupture and 3D wave propagation problem including TP effects. We use a 4th-order accurate numerical scheme with basis functions of polynomial order 3. The fault is planar and of size . The computational domain is a box of size centered on the fault. It is discretized by an unstructured mesh of 13.6 million tetrahedral elements, with element edge lengths of 1500 m in most of the domain and refined to 200 m close to the fault. Our simulations resolve the seismic wavefield with frequencies up to 3.5 Hz close to fault and nearly 0.5 Hz in the more coarsely meshed regions. We store rupture parameters at 2000 randomly distributed on-fault receivers (Figure 1A) and ground velocity time series at 1516 surface receivers distributed along a set of Joyner-Boore distances (, Figure 1B). With these settings, simulating 55 seconds of rupture process and wave propagation requires around 3.6 hours on Haswell cores of the Shaheen II supercomputer at KAUST.
A spectral implementation of thermal pressurization for 3D Discontinuous Galerkin dynamic rupture methods
Implementations of TP for dynamic rupture modeling vary in efficiency and flexibility. Explicit Finite Difference (FD) schemes are simple to implement and allow for heterogeneous properties, such as diffusivity, within the bulk. Noda et al., (2009) discretized spatial derivatives on a 1D grid orthogonal to the fault using a central difference scheme, and time derivatives using a simple explicit Euler scheme. However, such FD methods require small time steps and large memory due to the interpolation between major time steps, which involves storing the slip history at all sub-time steps. The spectral method (Noda and Lapusta,, 2010) allows for larger time steps, has excellent error properties and is memory efficient. However, it is restricted to homogeneous TP parameters along the direction normal to the fault. The spectral implementation can exploit the symmetry of the diffusion equation for similar material parameters on both sides of the fault.
Here, we couple a semi-analytic, stable, precise and efficient spectral diffusion solver introduced by Noda and Lapusta, (2010) with 3D dynamic rupture modeling in the HPC-empowered ADER-DG software SeisSol using a truncated Fourier expansion to evaluate the second-order space derivatives. The approximation related to truncation is very accurate: the heat source is assumed to have a Gaussian profile and the Fourier spectrum of a Gaussian decays rapidly. We first pre-calculate the inverse Fourier coefficients using a trapezoidal rule. Next, we calculate the current shear stresses and slip and the corresponding shear heat source in the spectral domain. For the next time-step, temperature and pressure are then updated in the wavenumber domain. Lastly, we recover temperature and pore pressure in the space domain by inverse Fourier transformation using the pre-calculated coefficients.
In contrast to finite-element (FE) methods, the basis functions here are non-zero over the whole domain leading to a global approach. We implement the update scheme for this TP solver coupled to strongly rate-dependent friction dynamic rupture following Kaneko et al., (2008). We observe lower computational overhead when comparing SeisSol’s spectral TP implementation to an FE TP approach, and comparable computational overhead to an FD TP solver, in comparison to respective SeisSol, FEM or FD simulations without TP. Similar to Noda and Lapusta, (2010), we assume that the heat source remains constant during a time-step, which we expect to limit accuracy. Li and Greengard, (2007) show how to construct a fourth order accurate spectral method for the heat equation which may be an interesting avenue for future TP implementations in dynamic rupture solvers.
Verification of the 3D TP implementation in SeisSol
While analytical solutions are available for a shear heating zone of zero thickness (Rice,, 2006) or for a short-term constant heat input under constant slip rate (Noda and Lapusta,, 2010), more complex 3D dynamic rupture simulations with TP have to be verified without available analytical references. Here, we verify the 3D TP implementation in SeisSol by running the most recent Southern California Earthquake Center (SCEC) dynamic rupture community benchmark TPV105-3D (Harris et al.,, 2011, 2018; Gabriel et al.,, 2020). Conducting an earlier 2D TP benchmark (TPV105-2D from 2011) revealed important physical challenges, such as the occurrence of high temperatures implying wide-spread frictional melting, and numerical challenges, including lack of accuracy and large differences between results with different time integration schemes.
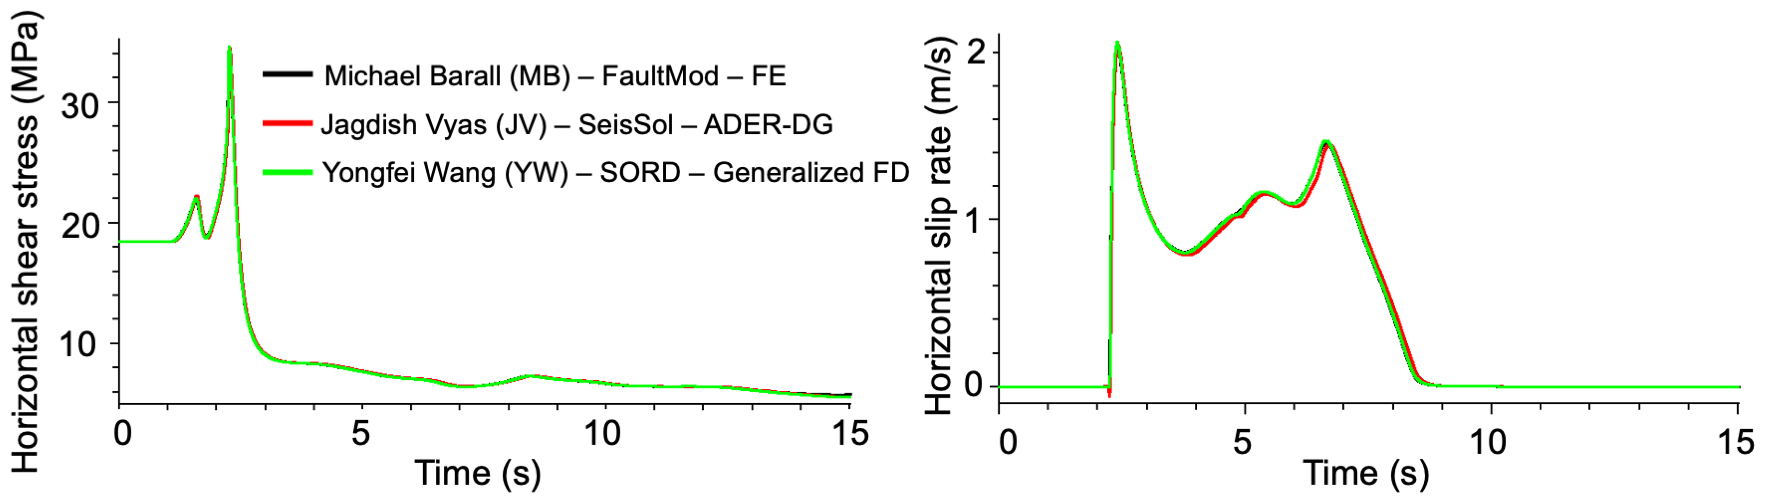
We compare the SeisSol solution for the TPV105-3D benchmark exercise against other dynamic rupture codes. Figure 2 shows a comparison for horizontal shear stress and slip rates computed using three different simulation methods as part of the SCEC TPV105-3D benchmark exercise. Three dynamic rupture codes accounting for TP (FaultMod, SeisSol and SORD) using different numerical schemes (FE, ADER-DG and generallized FD, respectively) for modeling rupture dynamics are compared. The SeisSol solution (JV) achieves excellent agreement with FaultMod (MB) and SORD (YW) (Figure 2).
The 3D benchmark settings form the basis of the rupture simulations performed here. The benchmark setup (Ulrich et al.,, 2020) identifies a relatively narrow (with respect to observational uncertainties) parameter range to realise realistic earthquake ruptures on a single, planar fault. It requires a velocity-strengthening transition layer at shallow depth to limit localised supershear rupture and spatially varying hydraulic diffusivity aligned with the rate-and-state parameters for smooth rupture stopping to aid realistic ground motion analysis. The chosen parameter values prevent unrealistically high temperatures (T1200 K) that would imply melting. It features spatially heterogeneous TP characteristics, prevents high frictional energy at shallow depths and sets shear traction at 41% of normal traction. The challenges in defining physically plausible 3D benchmark parameters due to the strong trade-offs of rupture nucleation, smooth rupture termination without reaching fault ends, rapid dynamic weakening effects, realistic heat production, and fault stress and strength initial conditions motivate the analysis in this study.
TP influence on rupture characteristics and ground shaking
We analyze the temporal evolution of selected rupture parameters and of ground velocity, and statistically analyse them to better understand TP effects on earthquake rupture and ground motion.
Rupture parameter evolution and statistics
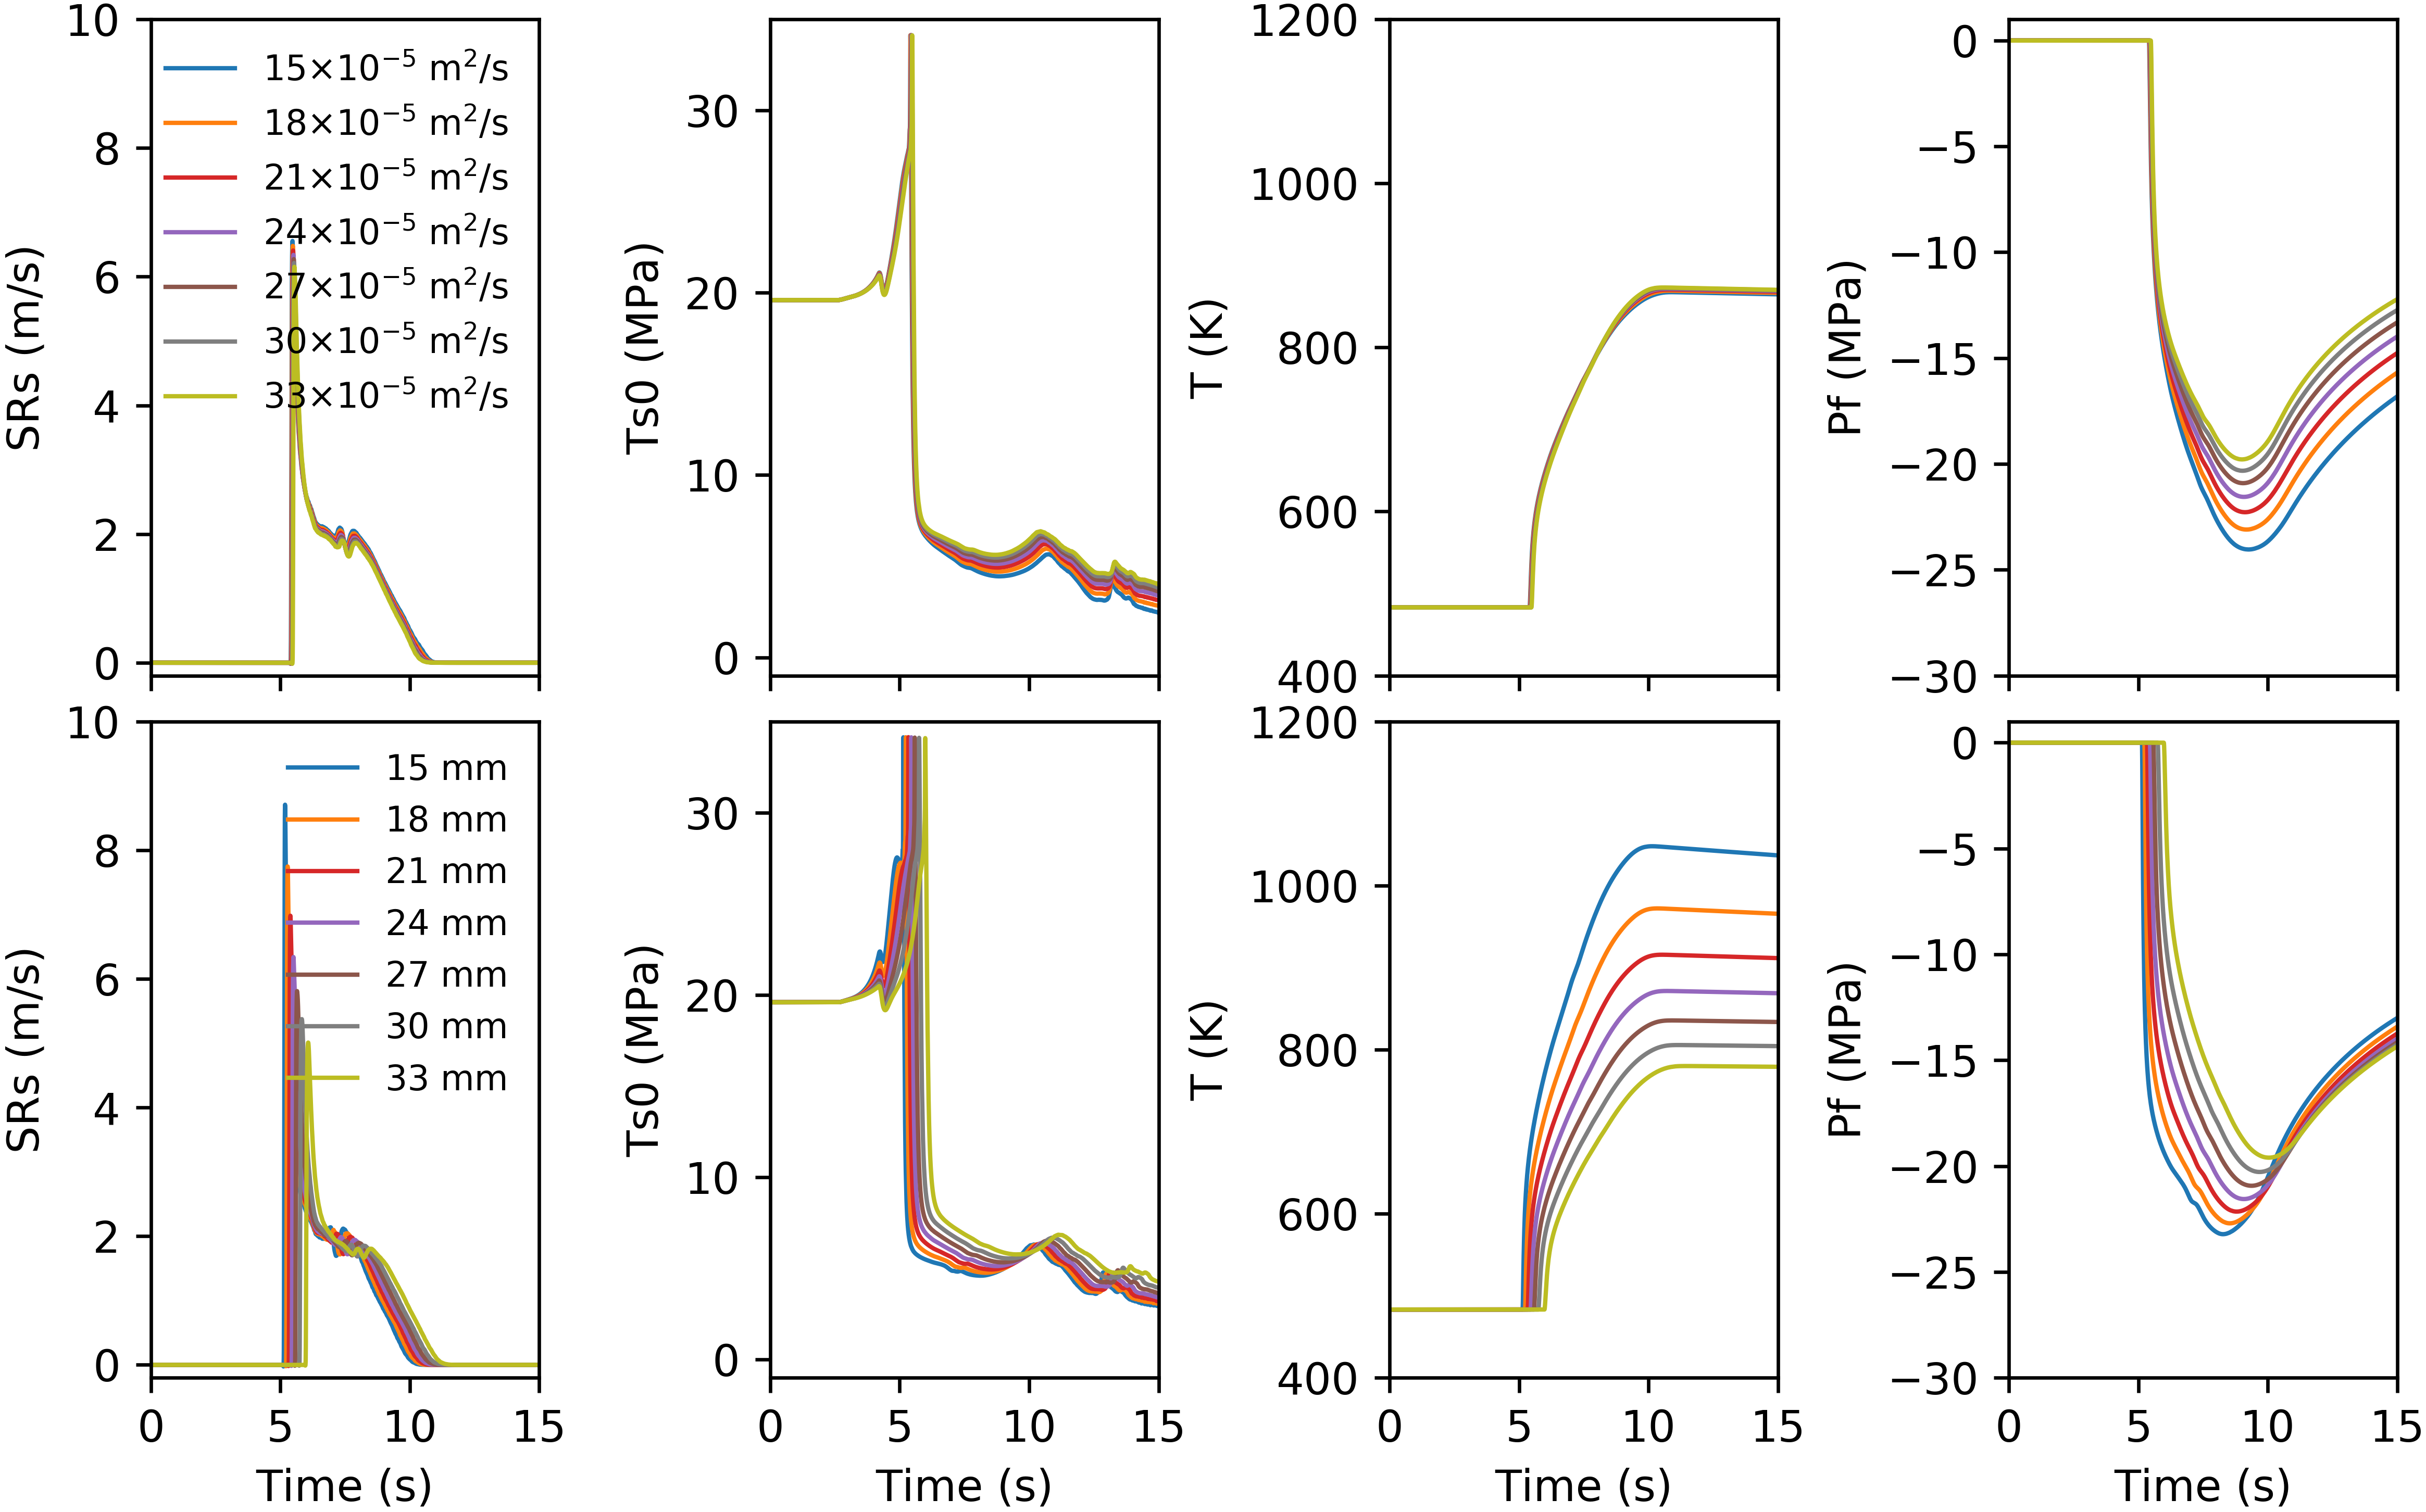
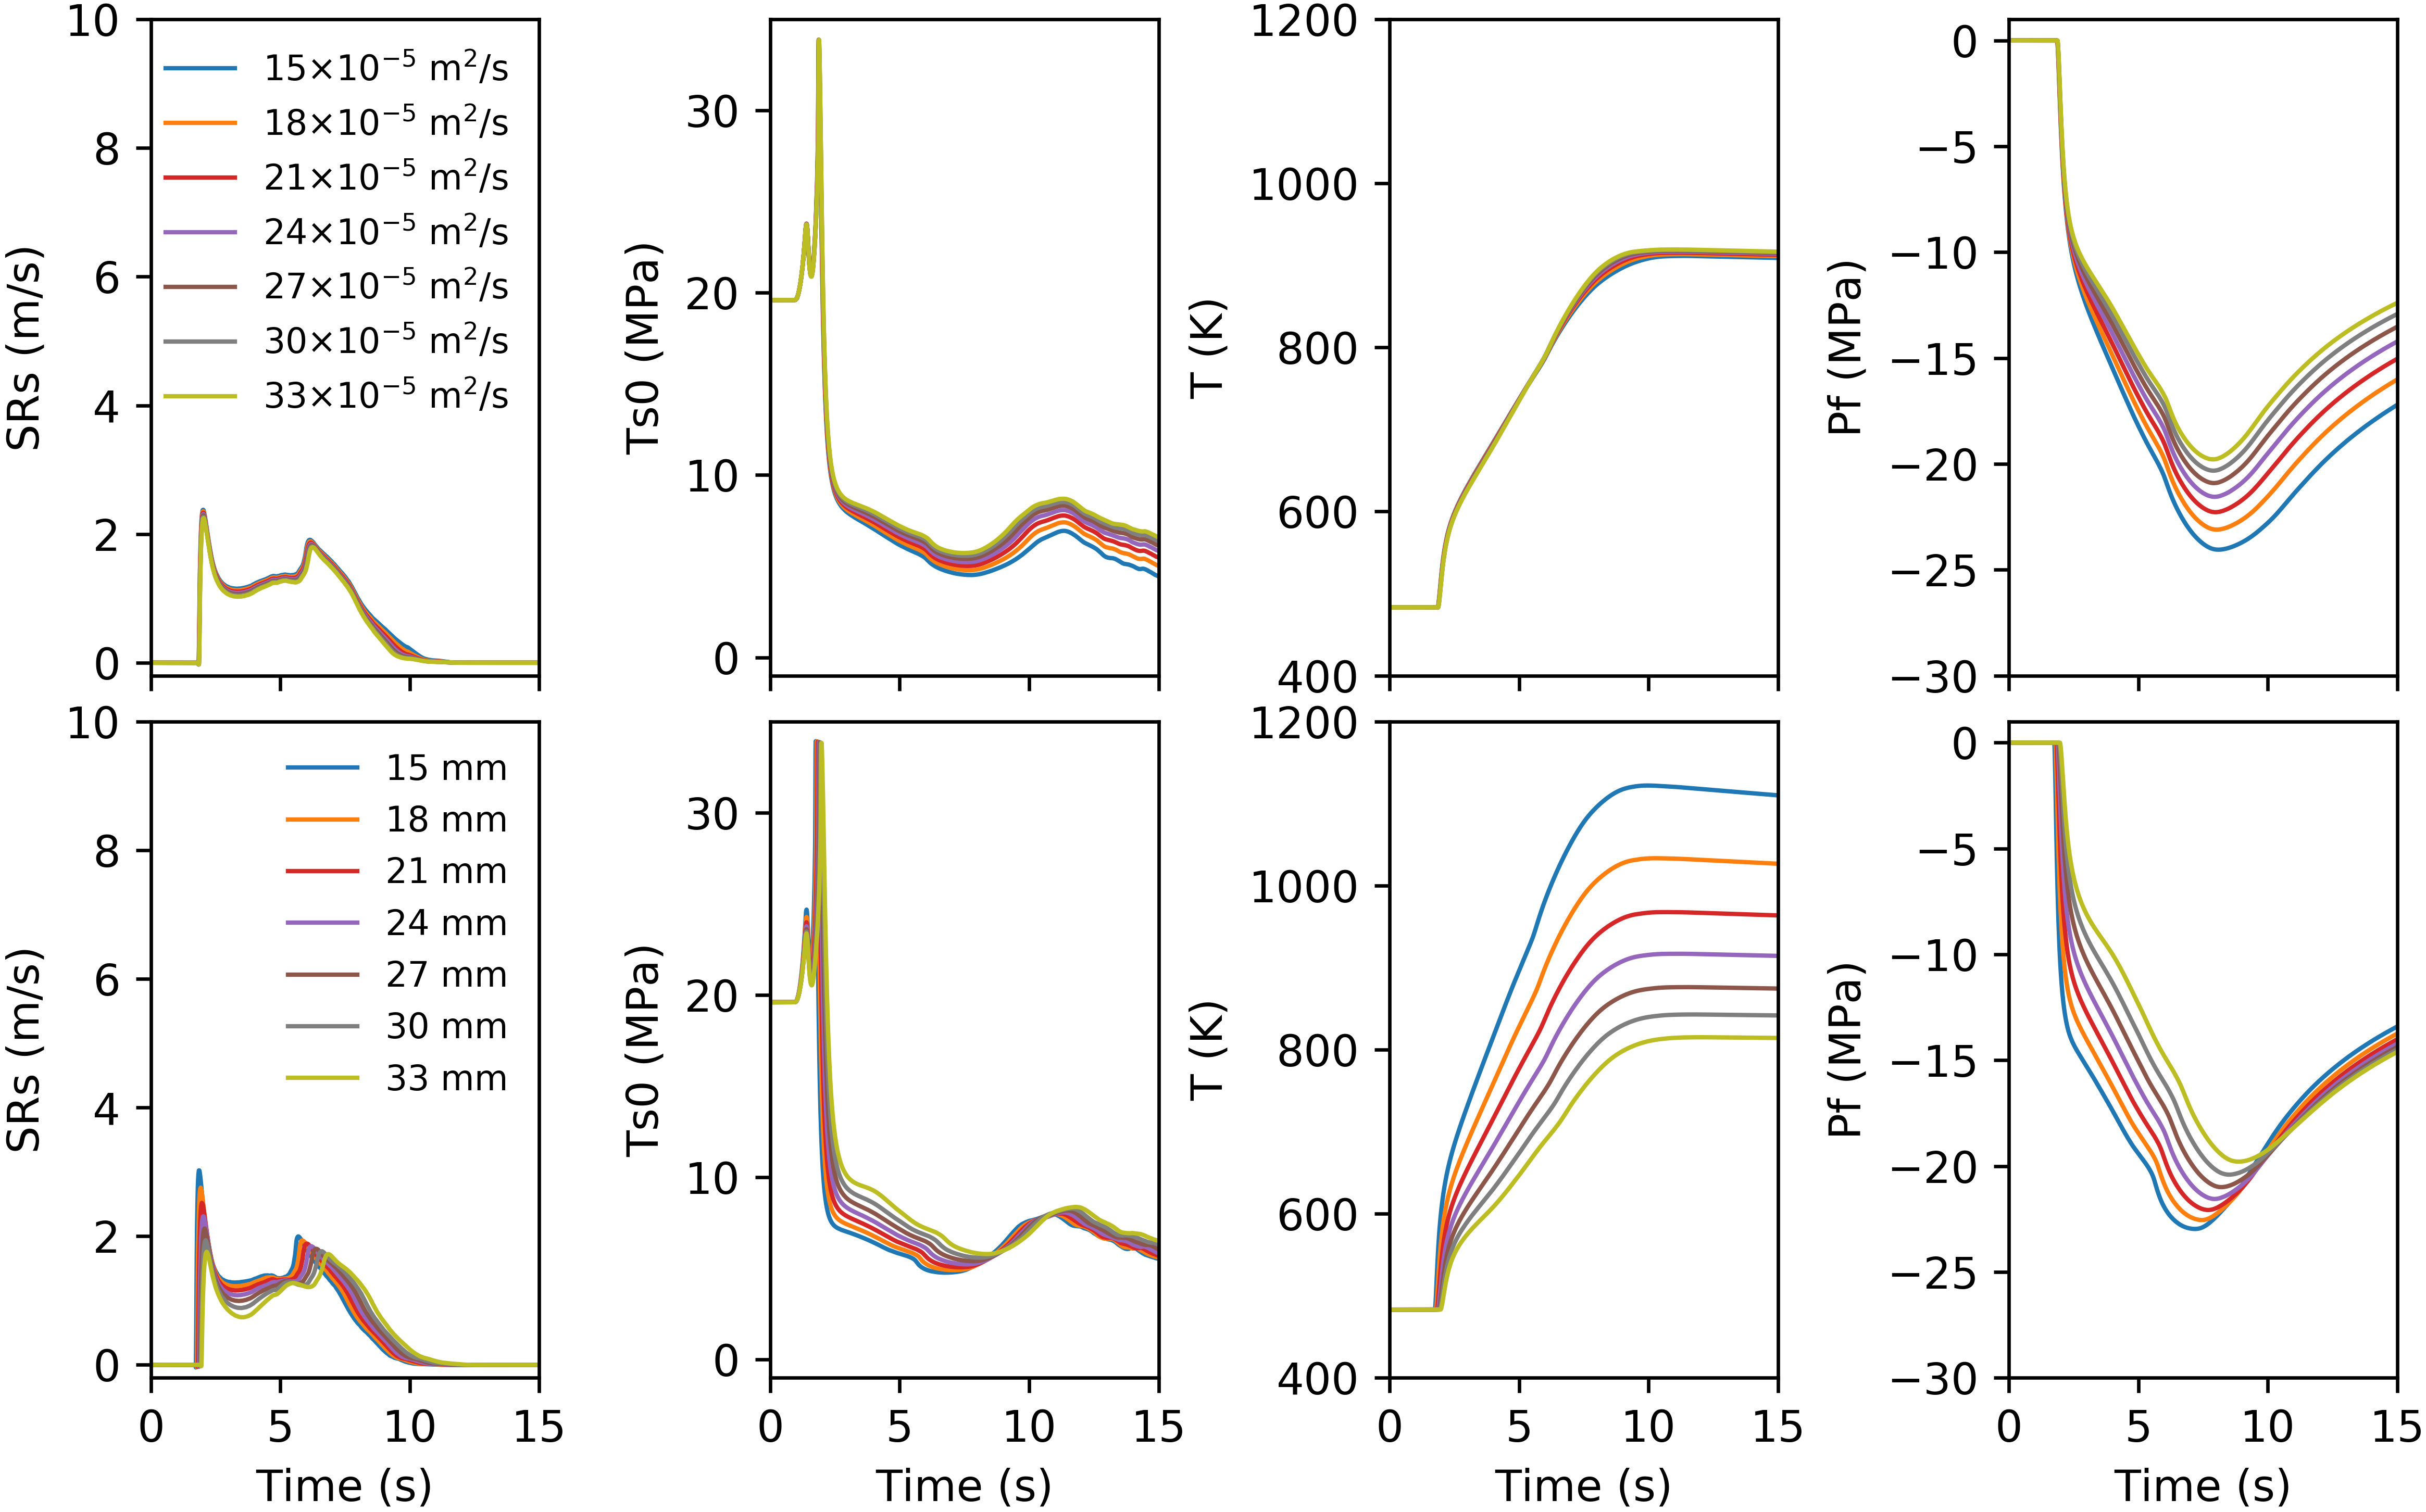
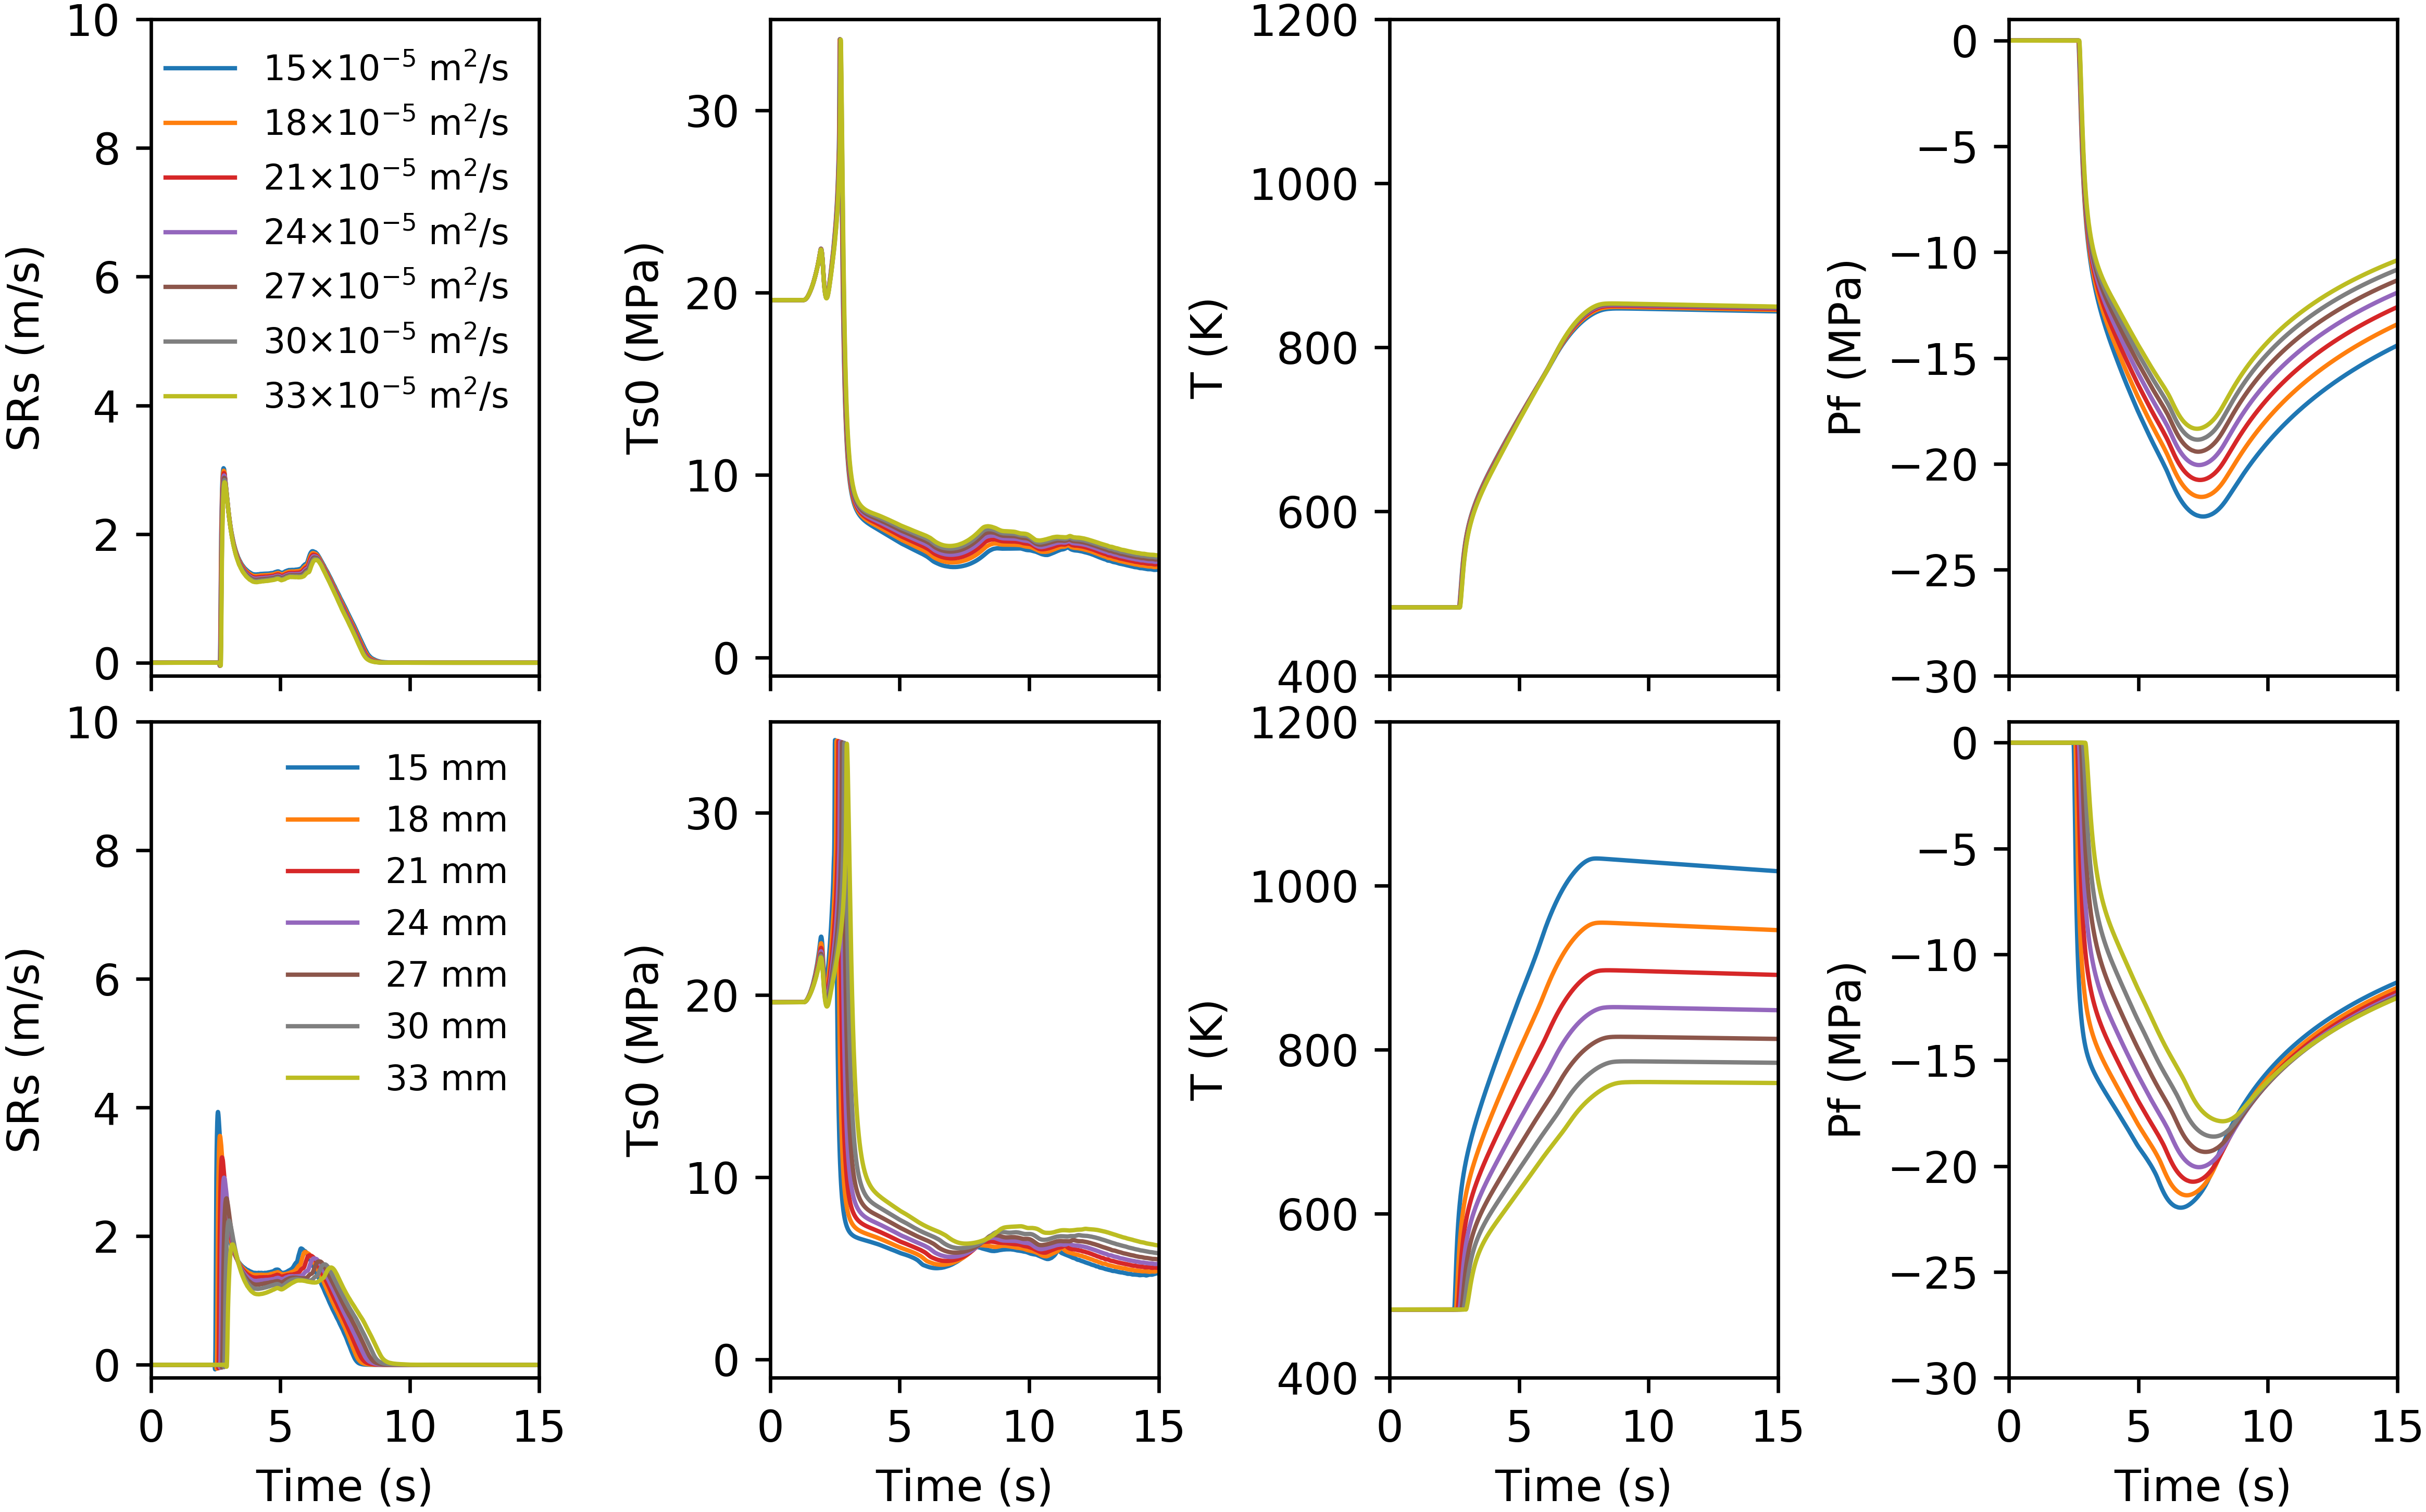
We analyze the temporal evolution of rupture parameters as a function of TP parameters. Figure 3 shows the effects of varying hydraulic diffusivity (in ) and shear-zone half-width (in ) on the temporal evolution of four rupture variables: along-strike slip rate SRs, total traction Ts0, temperature T and pore pressure Pf at location s2 on the fault indicated on Figure 1A. We observe a stronger impact of on SRs, Ts0, T and Pf compared to . The onset time of rupture is delayed as we increase whereas rupture speed remains nearly unaffected when varying . Similarly, the absolute peak values of slip rate, temperature and pore pressure decrease more pronouncedly when increasing than when increasing . The rupture evolution at two other locations on the fault (s1 and s3) shows similar characteristics as observed at location s2 (compare electronic supplement Figures S1 and S2 with Figure 3).
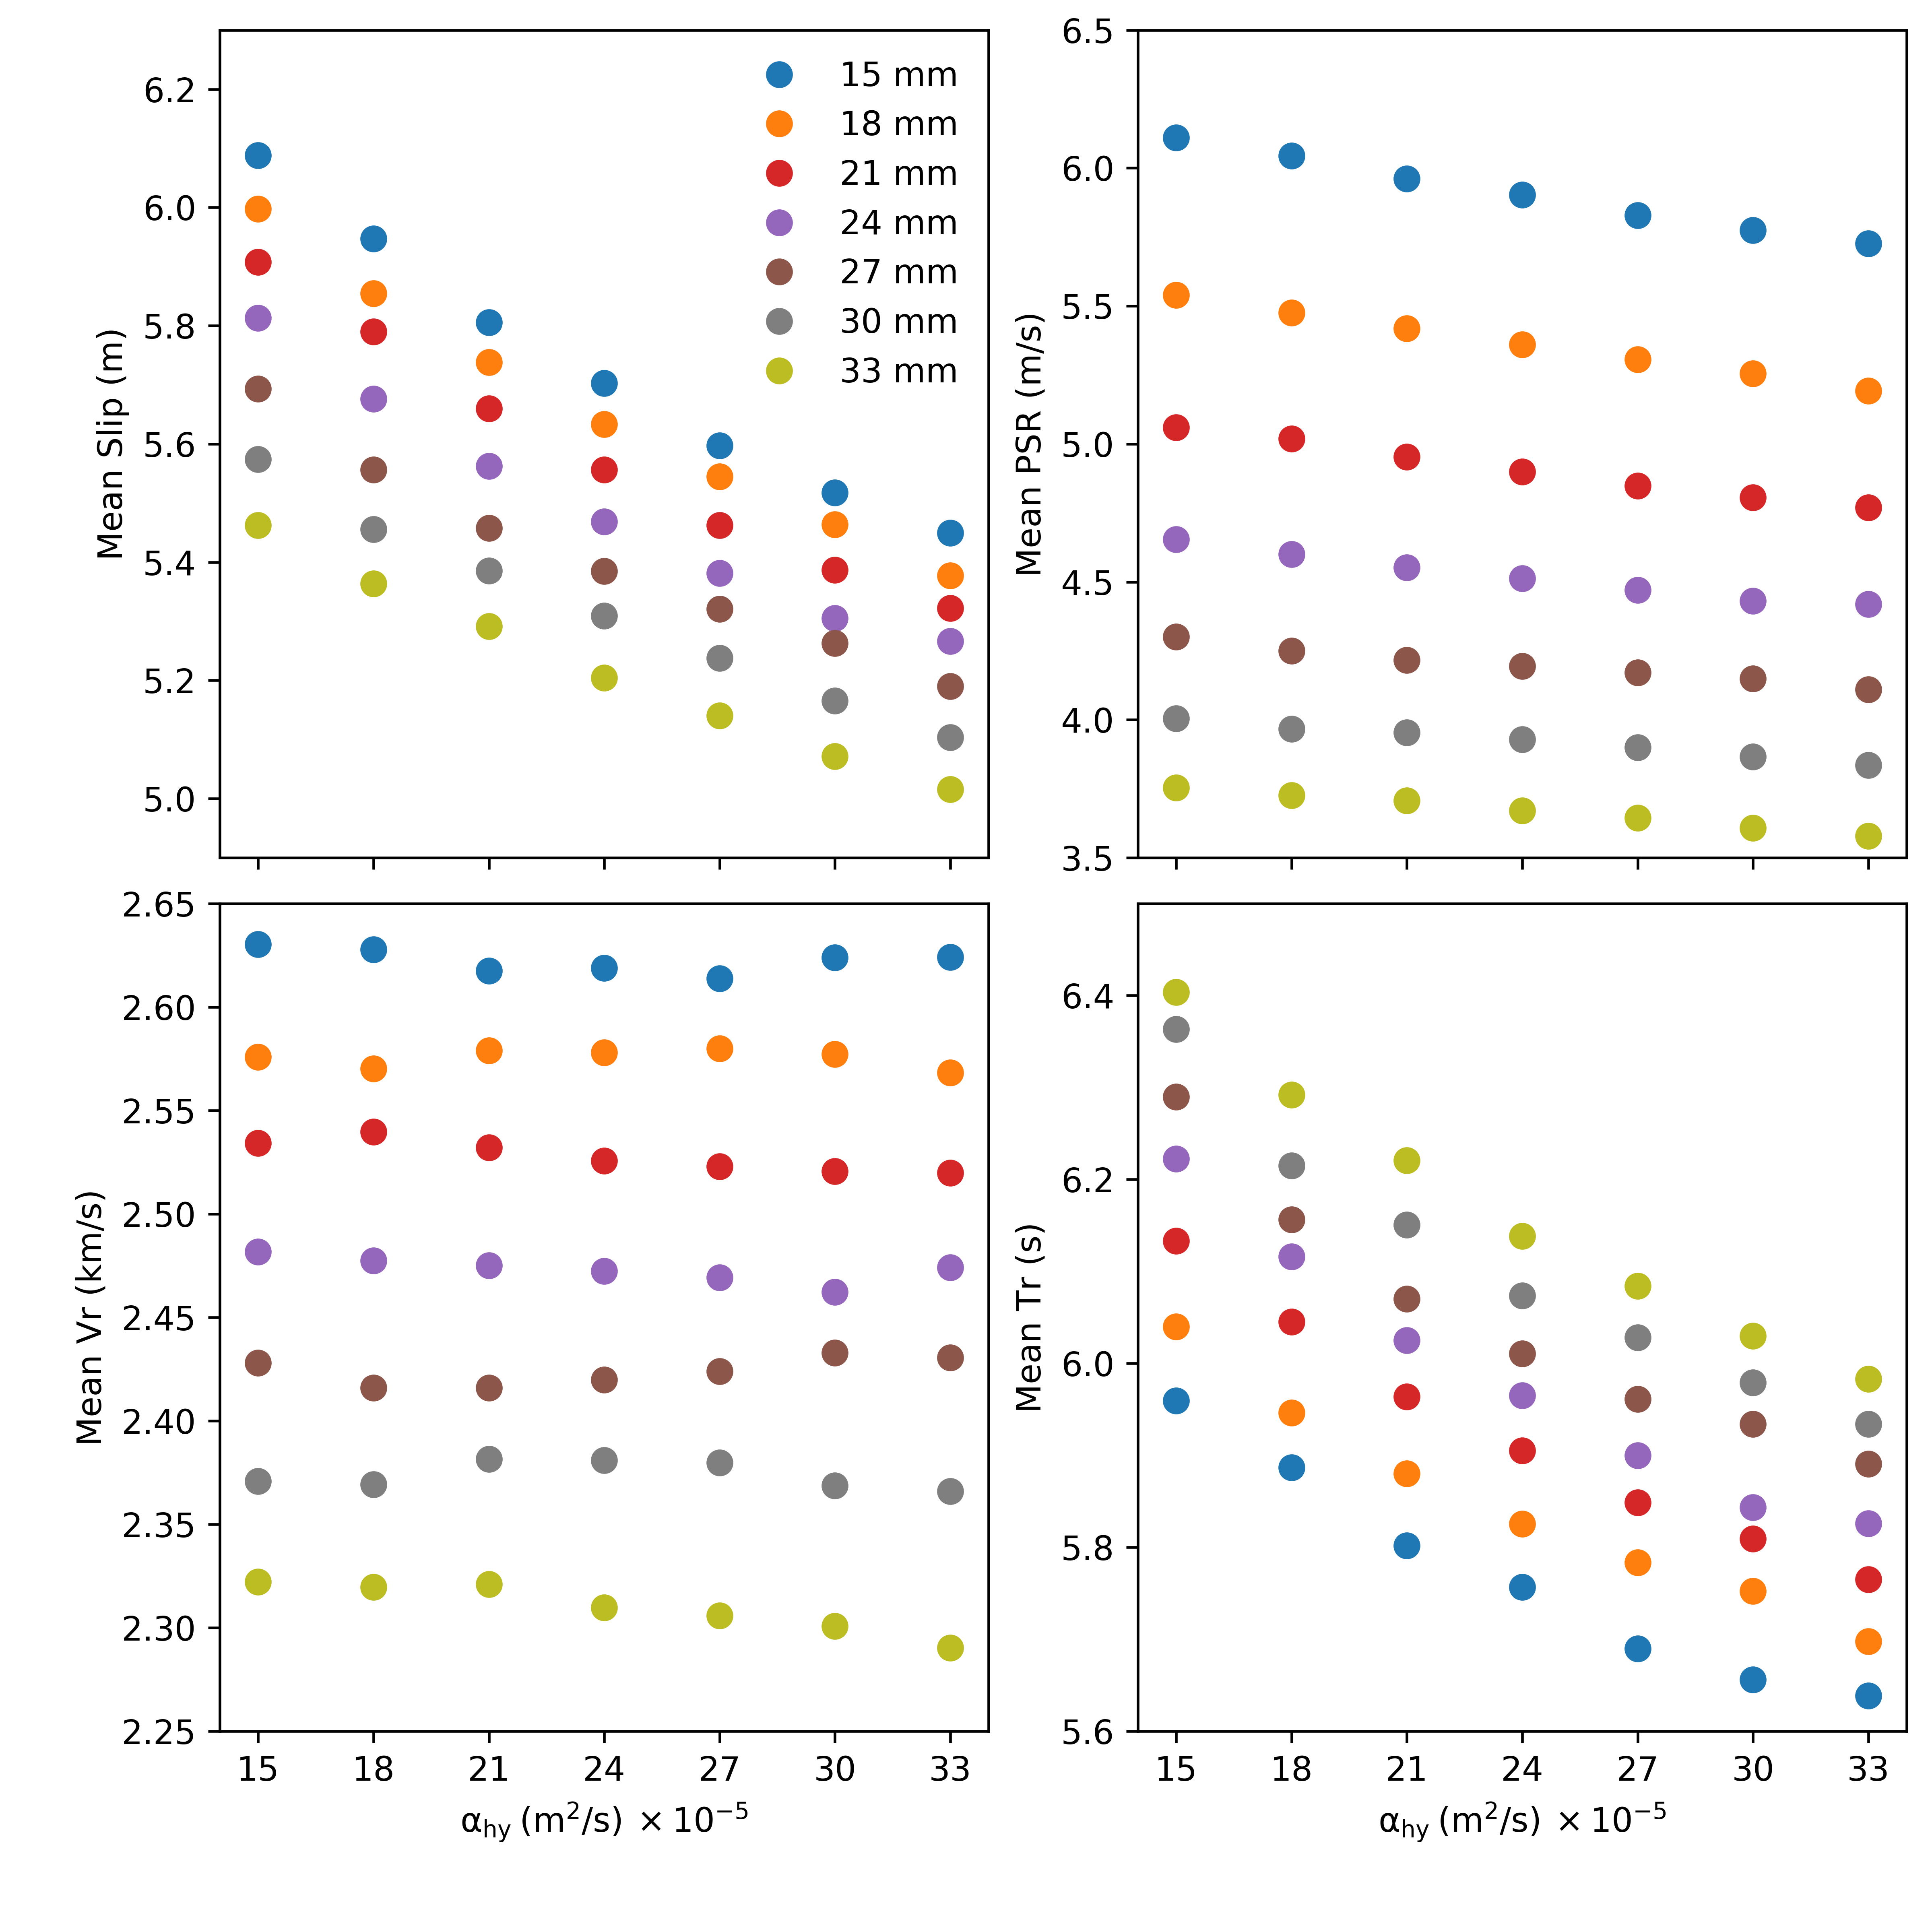
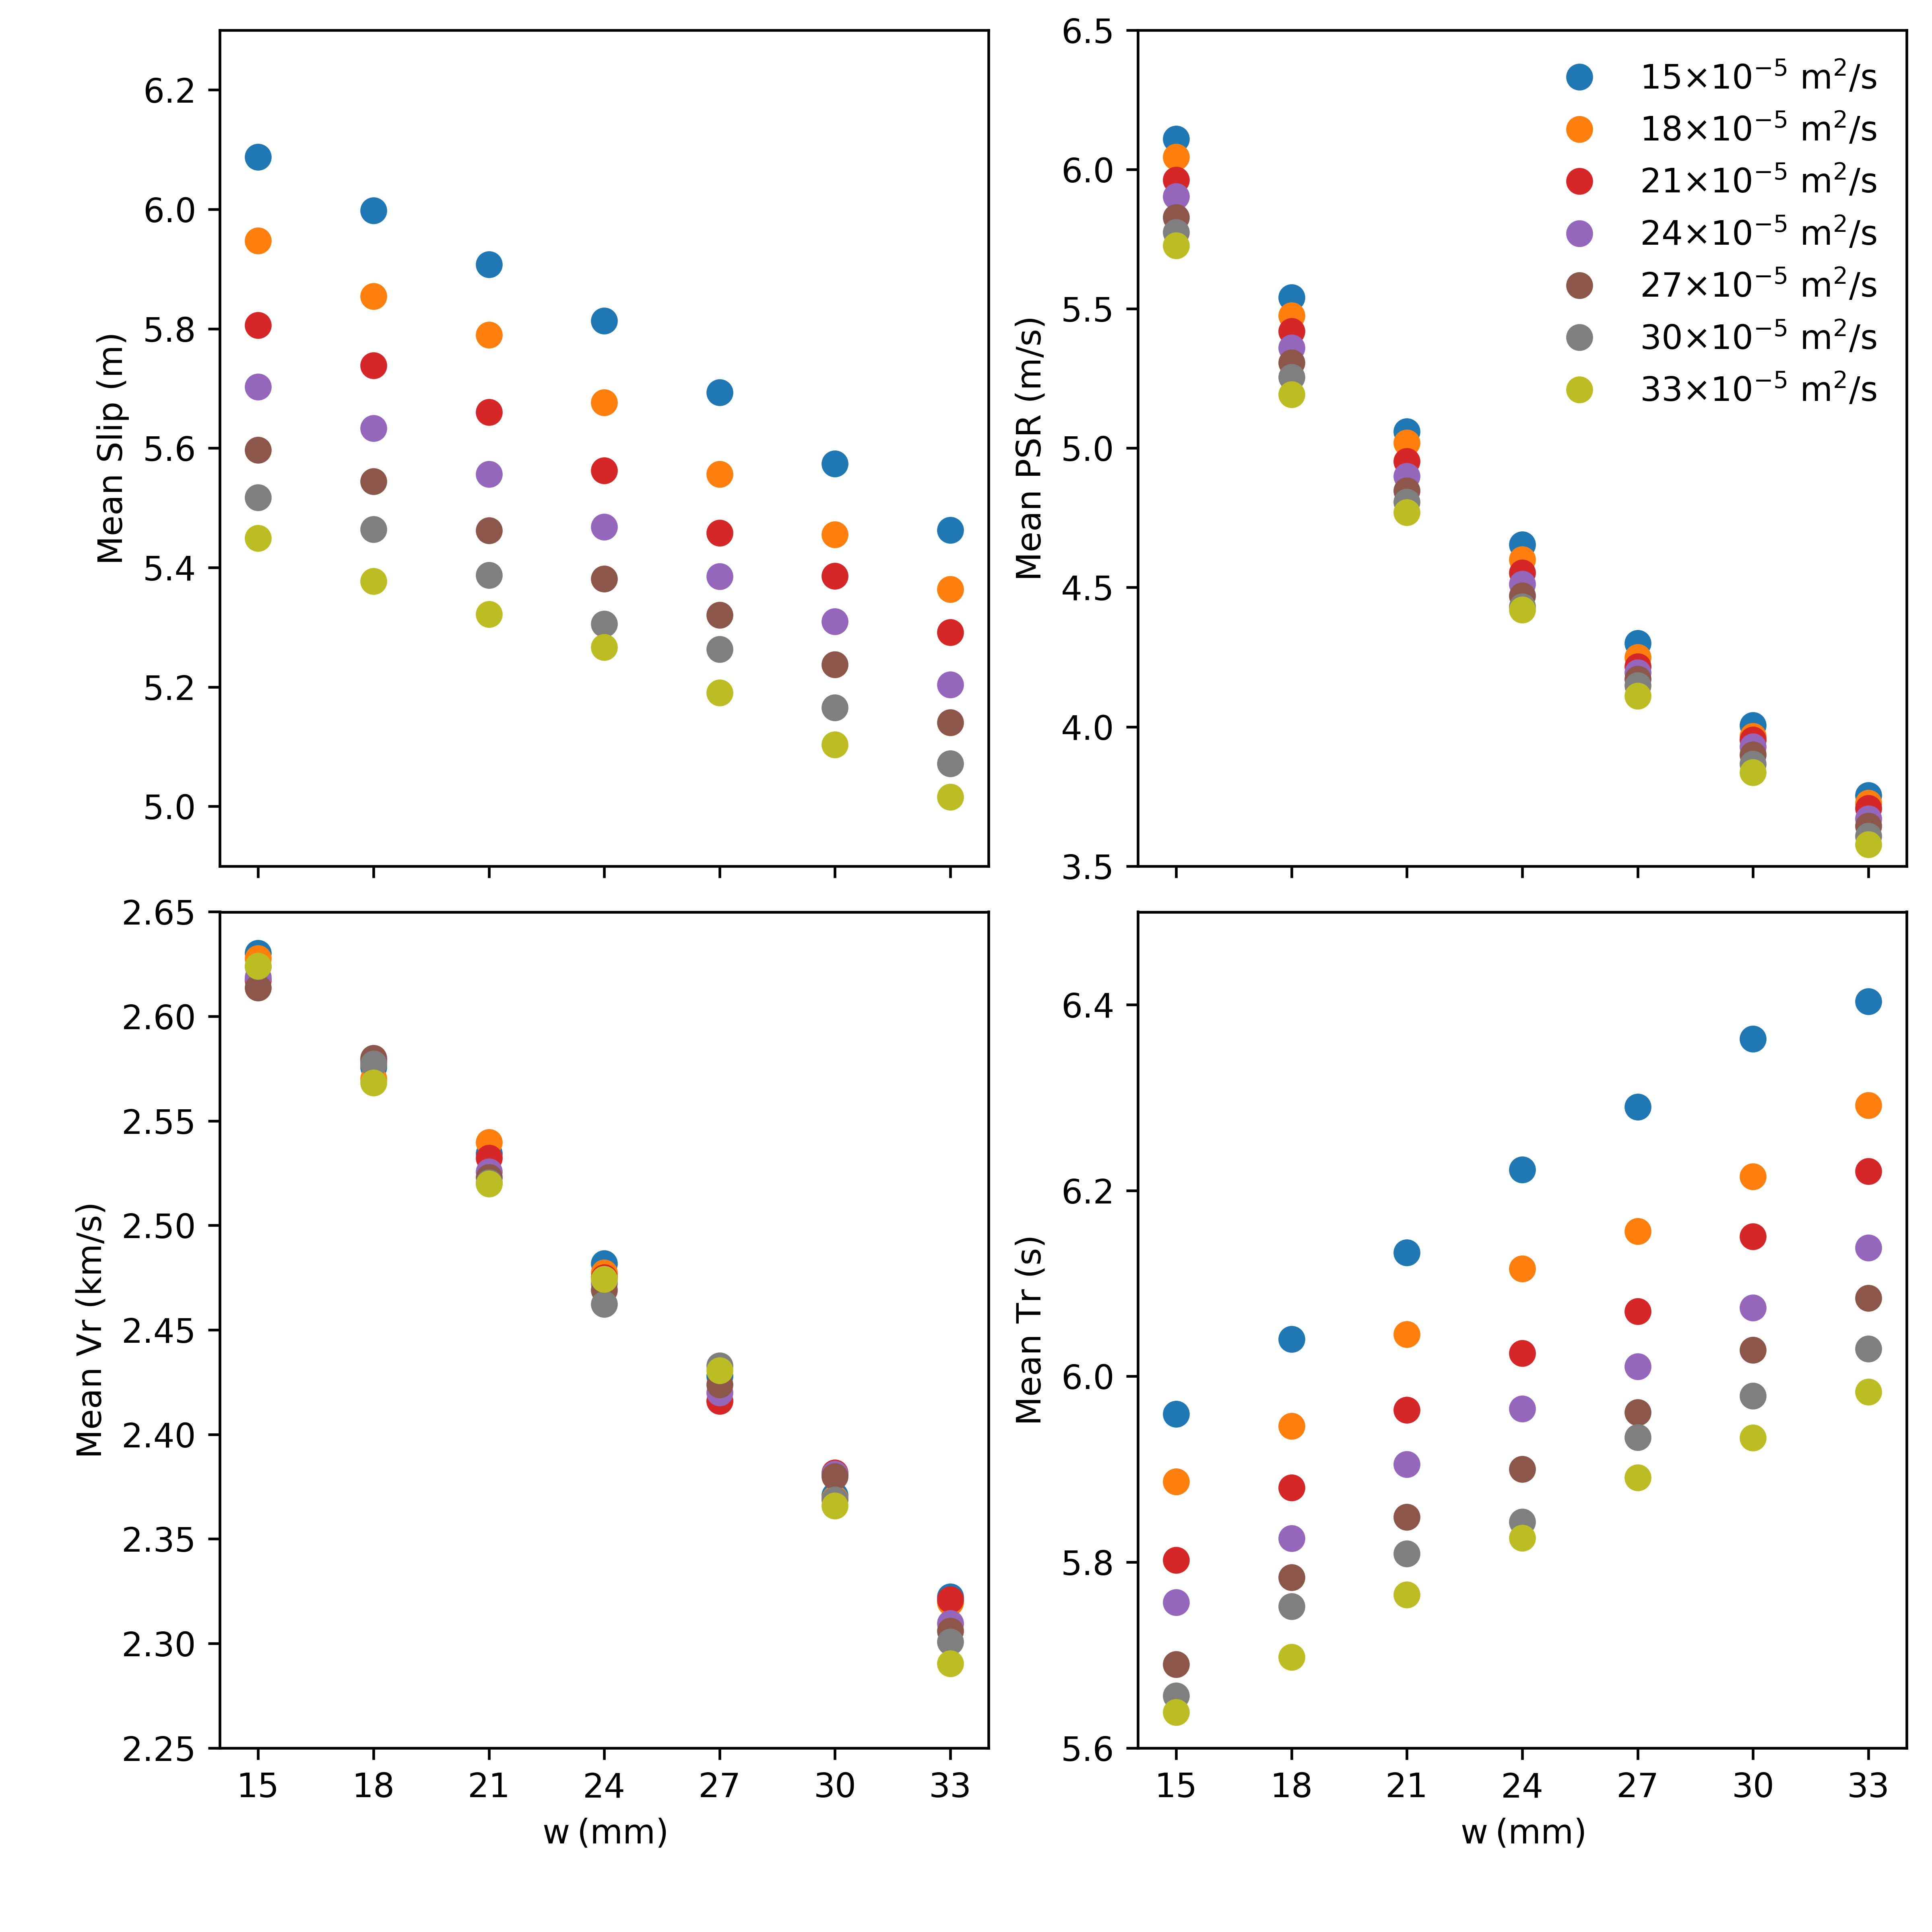
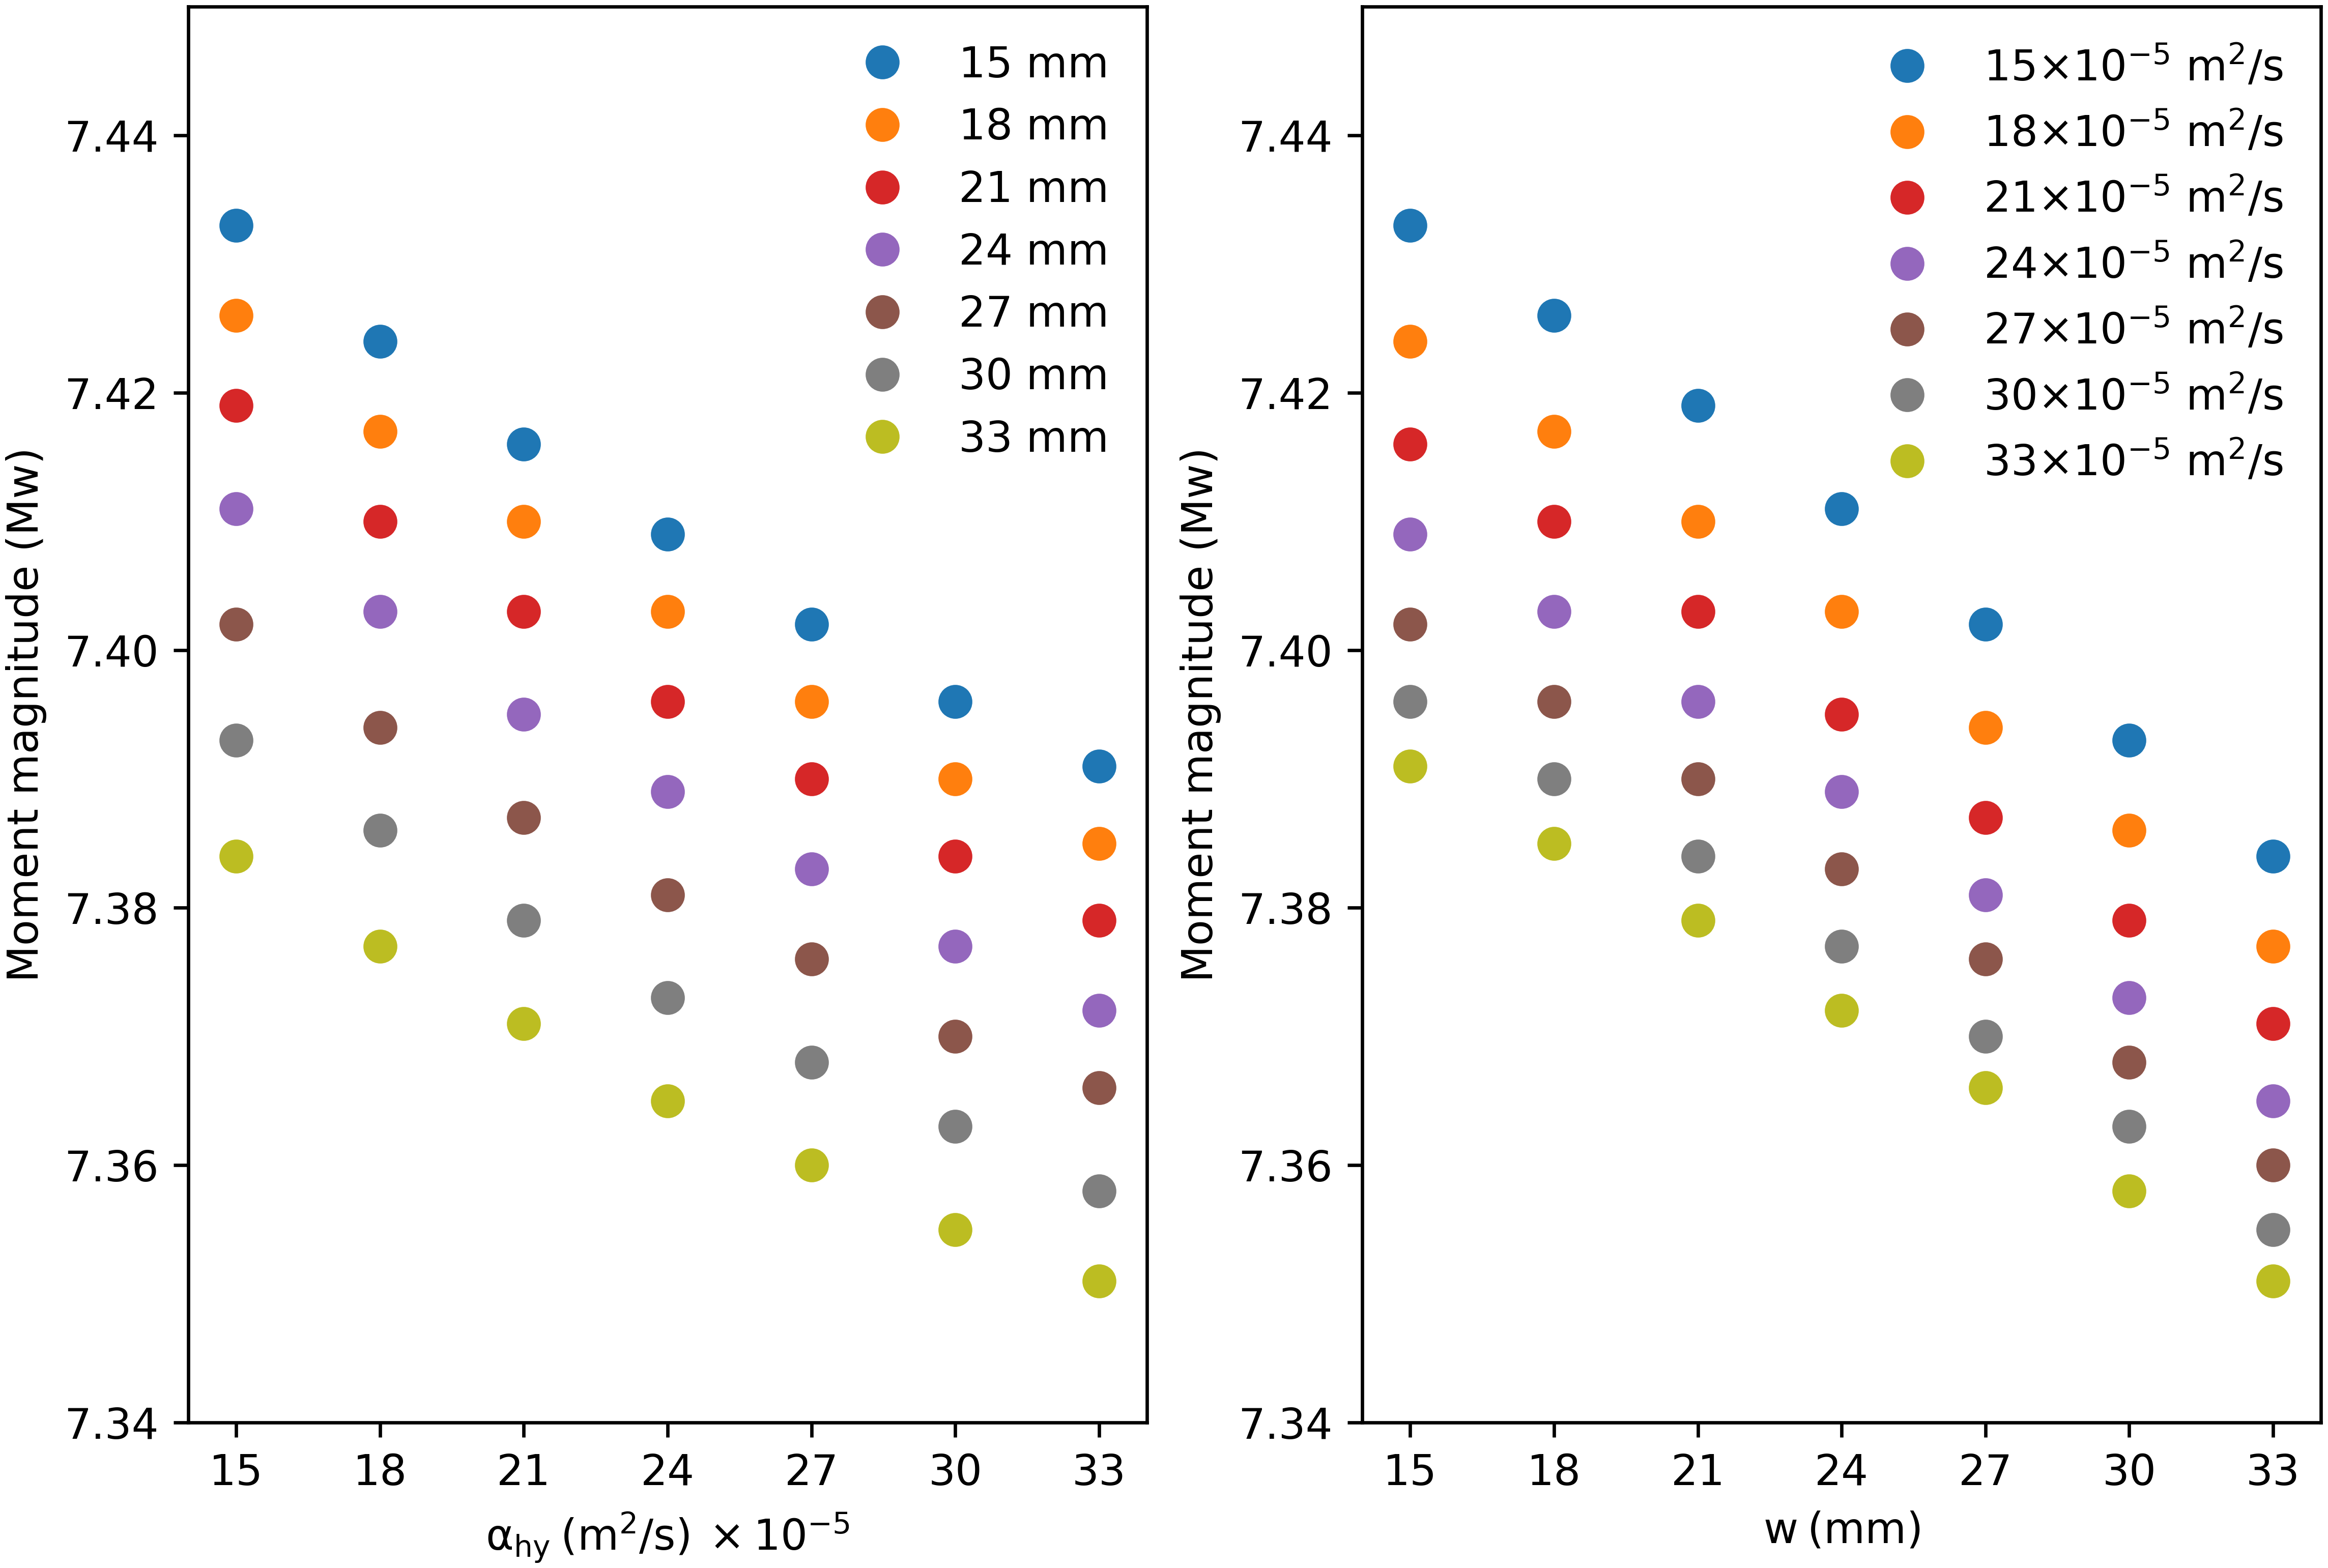
We quantify TP effects on earthquake source processes by statistically analyzing kinematic rupture properties across all 2000 on-fault receivers. We first analyse the mean values of slip, PSR, Vr and Tr. We compute Vr as , using 2D basis functions across each dynamic rupture element face. Figure 4 shows variations in mean slip, PSR, Vr and Tr for varying (x-axis) for a given (color-coded). Mean slip and Tr decrease by nearly 10% and 6%, respectively, as we double the value of for a given , whereas PSR and Vr remain nearly constant. As we increase the fluid diffuses faster. This leads to an earlier reduction of pore pressure, increasing effective normal stress and therefore strengthening the fault. This explains the observed reduced fault slip with increasing . The fault slip reduction translates into a drop of earthquake magnitude Mw of almost 5% when doubling (supplementary Figure S3).
We analyze and compare effects of against on kinematic rupture properties. Figure 5 shows variations in mean slip, PSR, Vr and Tr for varying and fixed . We observe that mean slip, PSR and Vr decrease with increasing whereas mean Tr increases. The mean slip decreases by nearly 10% whereas the mean Tr increases by almost 6% as we double , similar to the magnitude of changes found by varying . Hence, both and almost equally influence mean slip and earthquake magnitude (supplementary Figure S3). Both parameters have similar impact on mean Tr with opposite trends (decreasing and increasing, respectively). The mean PSR and Vr decrease by nearly 60% and 14%, respectively, as we double , but are nearly unaffected by variations of in the range considered (Figure 4). Therefore, has a stronger impact than on the overall earthquake rupture process, especially on PSR, which may also strongly affect ground shaking.
Correlation of kinematic rupture parameters
We now analyze correlations between pairs of rupture parameters. Specifically, we calculate the Pearson correlation coefficient, , between six pairs of source parameters: (slip, PSR), (slip, Vr), (slip, Tr), (PSR, Vr), (PSR, Tr) and (Vr, Tr). The linear correlation coefficient does not completely capture potential non-linear correlations, but it is the metric considered by Schmedes et al., (2010), which allows us to compare our simulation results with theirs. As in Schmedes et al., (2010), we exclude on-fault receivers around the rupture nucleation and arrest areas, by considering only receivers contained in the red dashed rectangle of Figure 1.
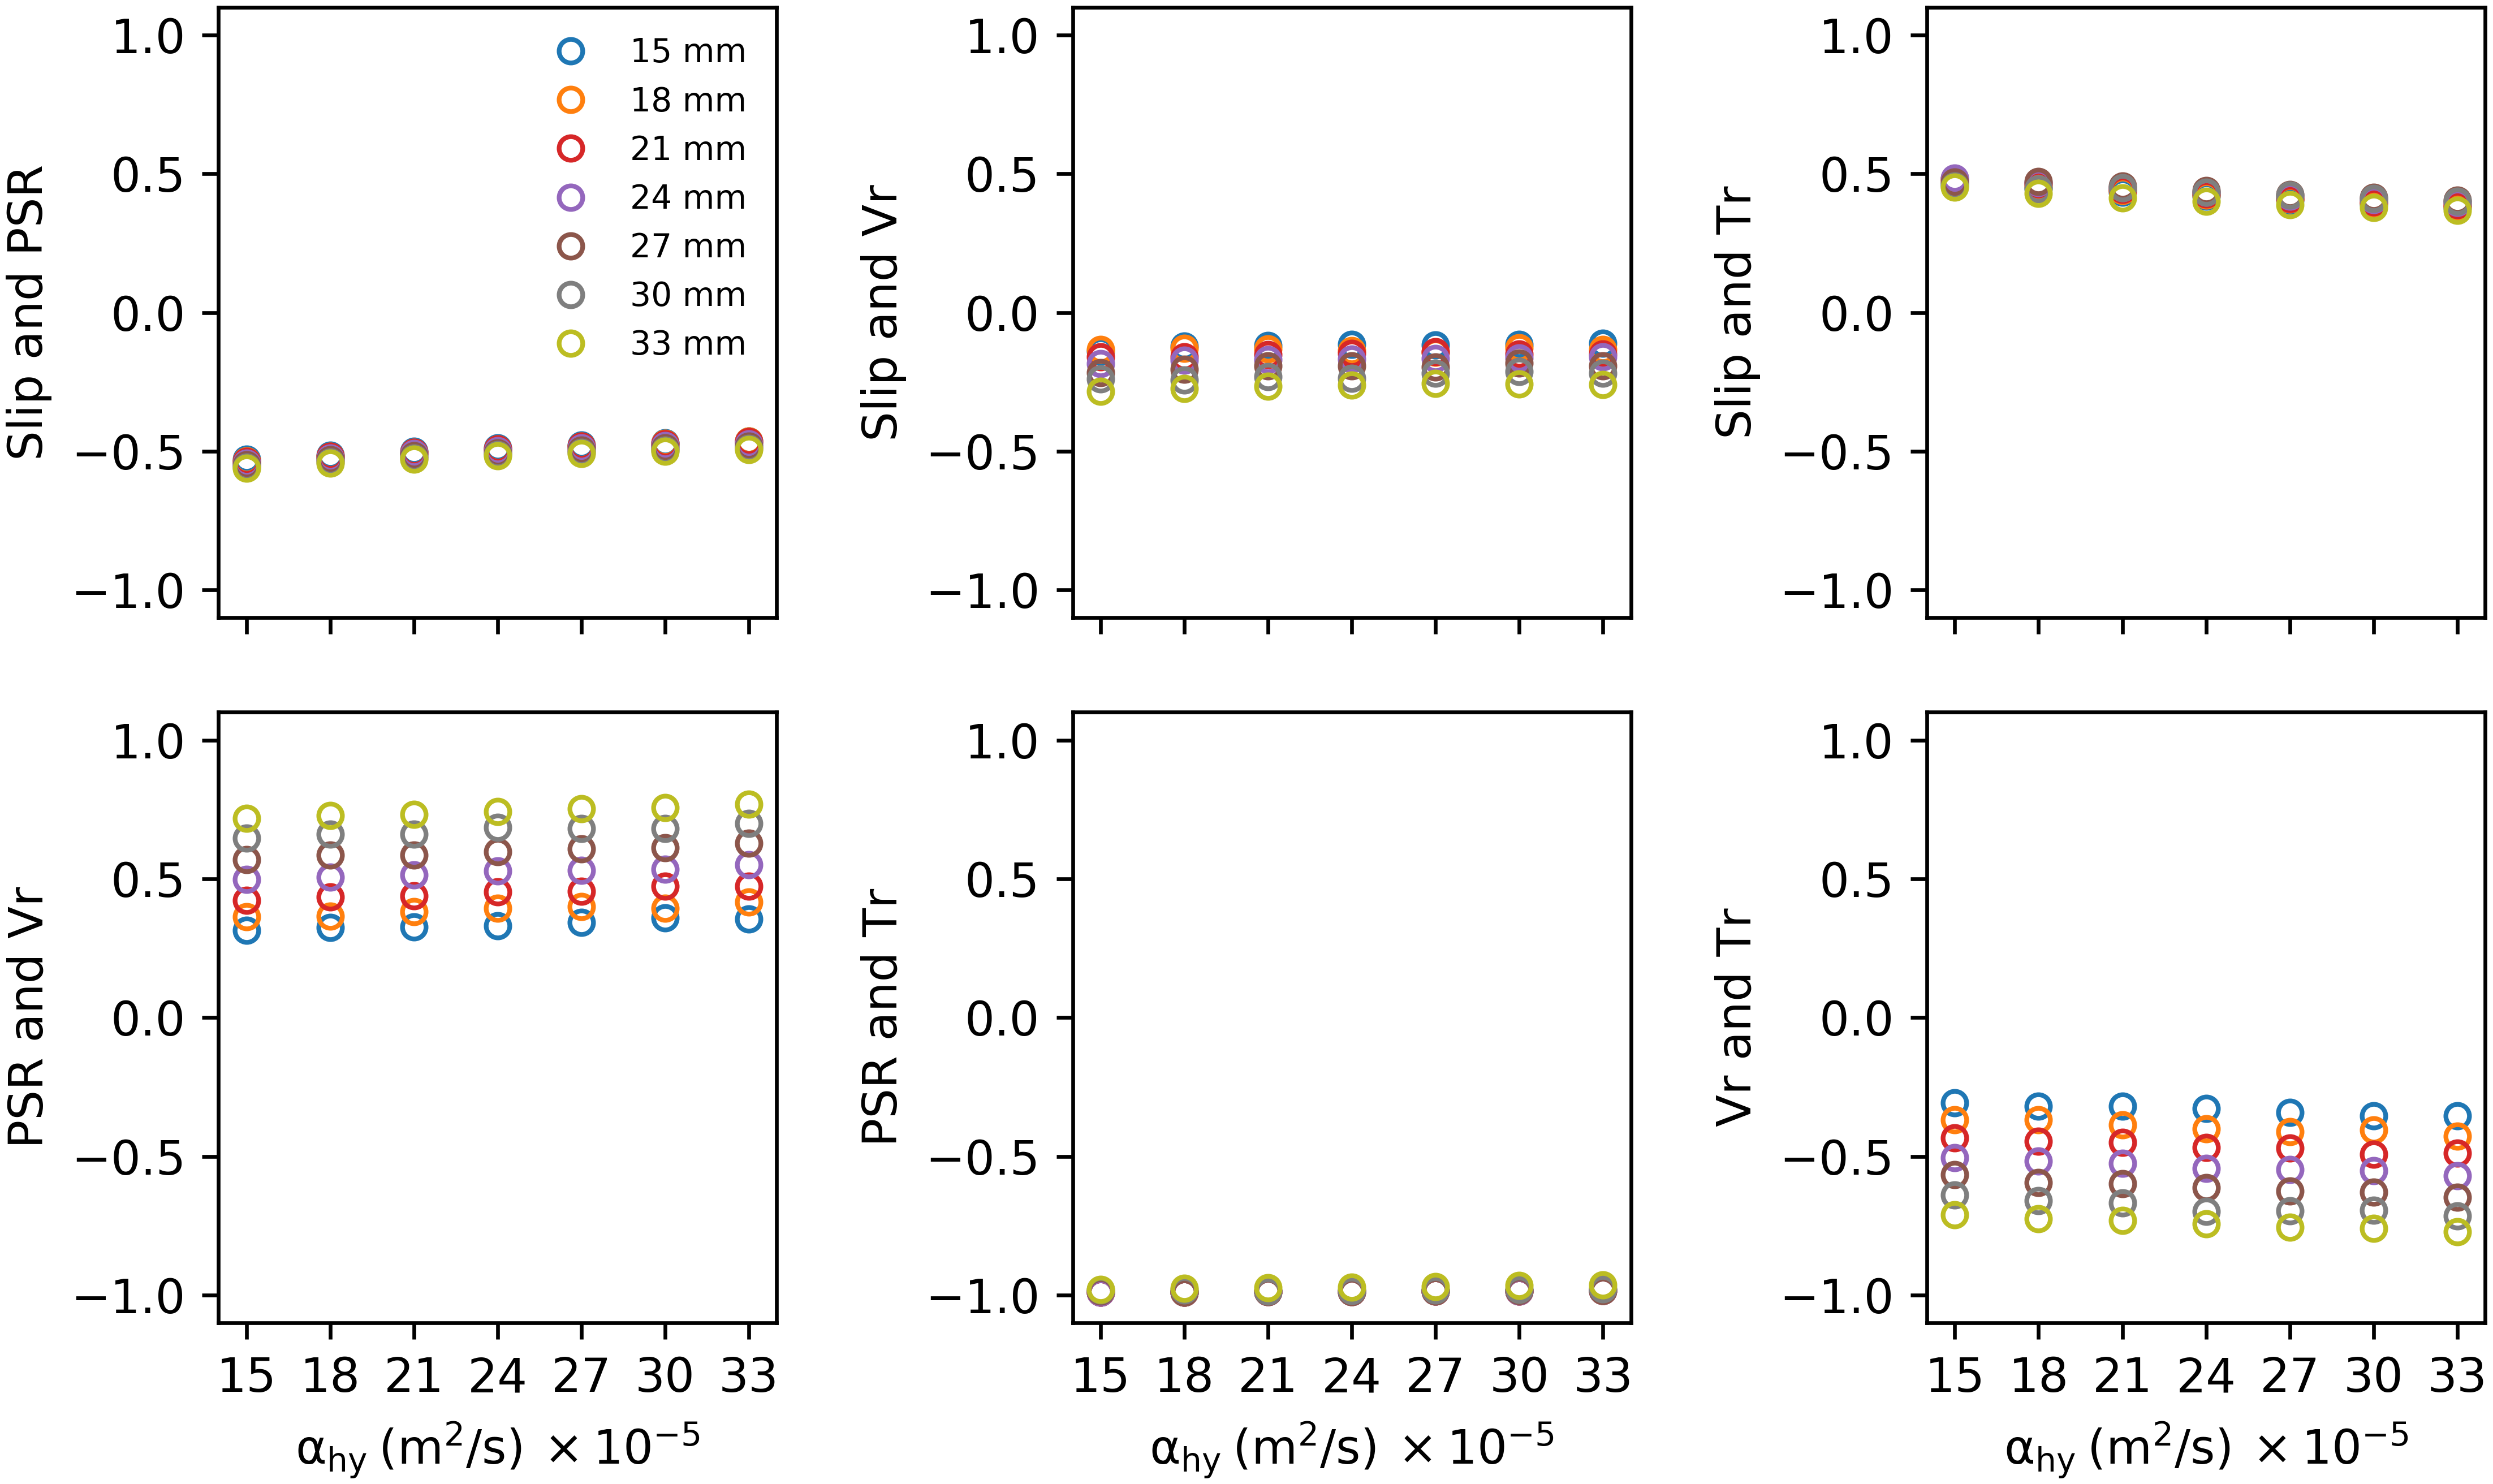
We analyze correlations between kinematic rupture parameters as a function of . Figure 6 shows correlation among rupture parameters with varying hydraulic diffusivity for given shear-zone half-width . The correlations between the six selected source parameter pairs are nearly insensitive to changes in . The (slip, PSR) and (Vr, Tr) are negatively correlated (), and (PSR, Tr) are strongly negatively correlated (). The (slip, Tr) and (PSR, Vr) are positively correlated (), whereas (slip, Vr) are almost uncorrelated ().
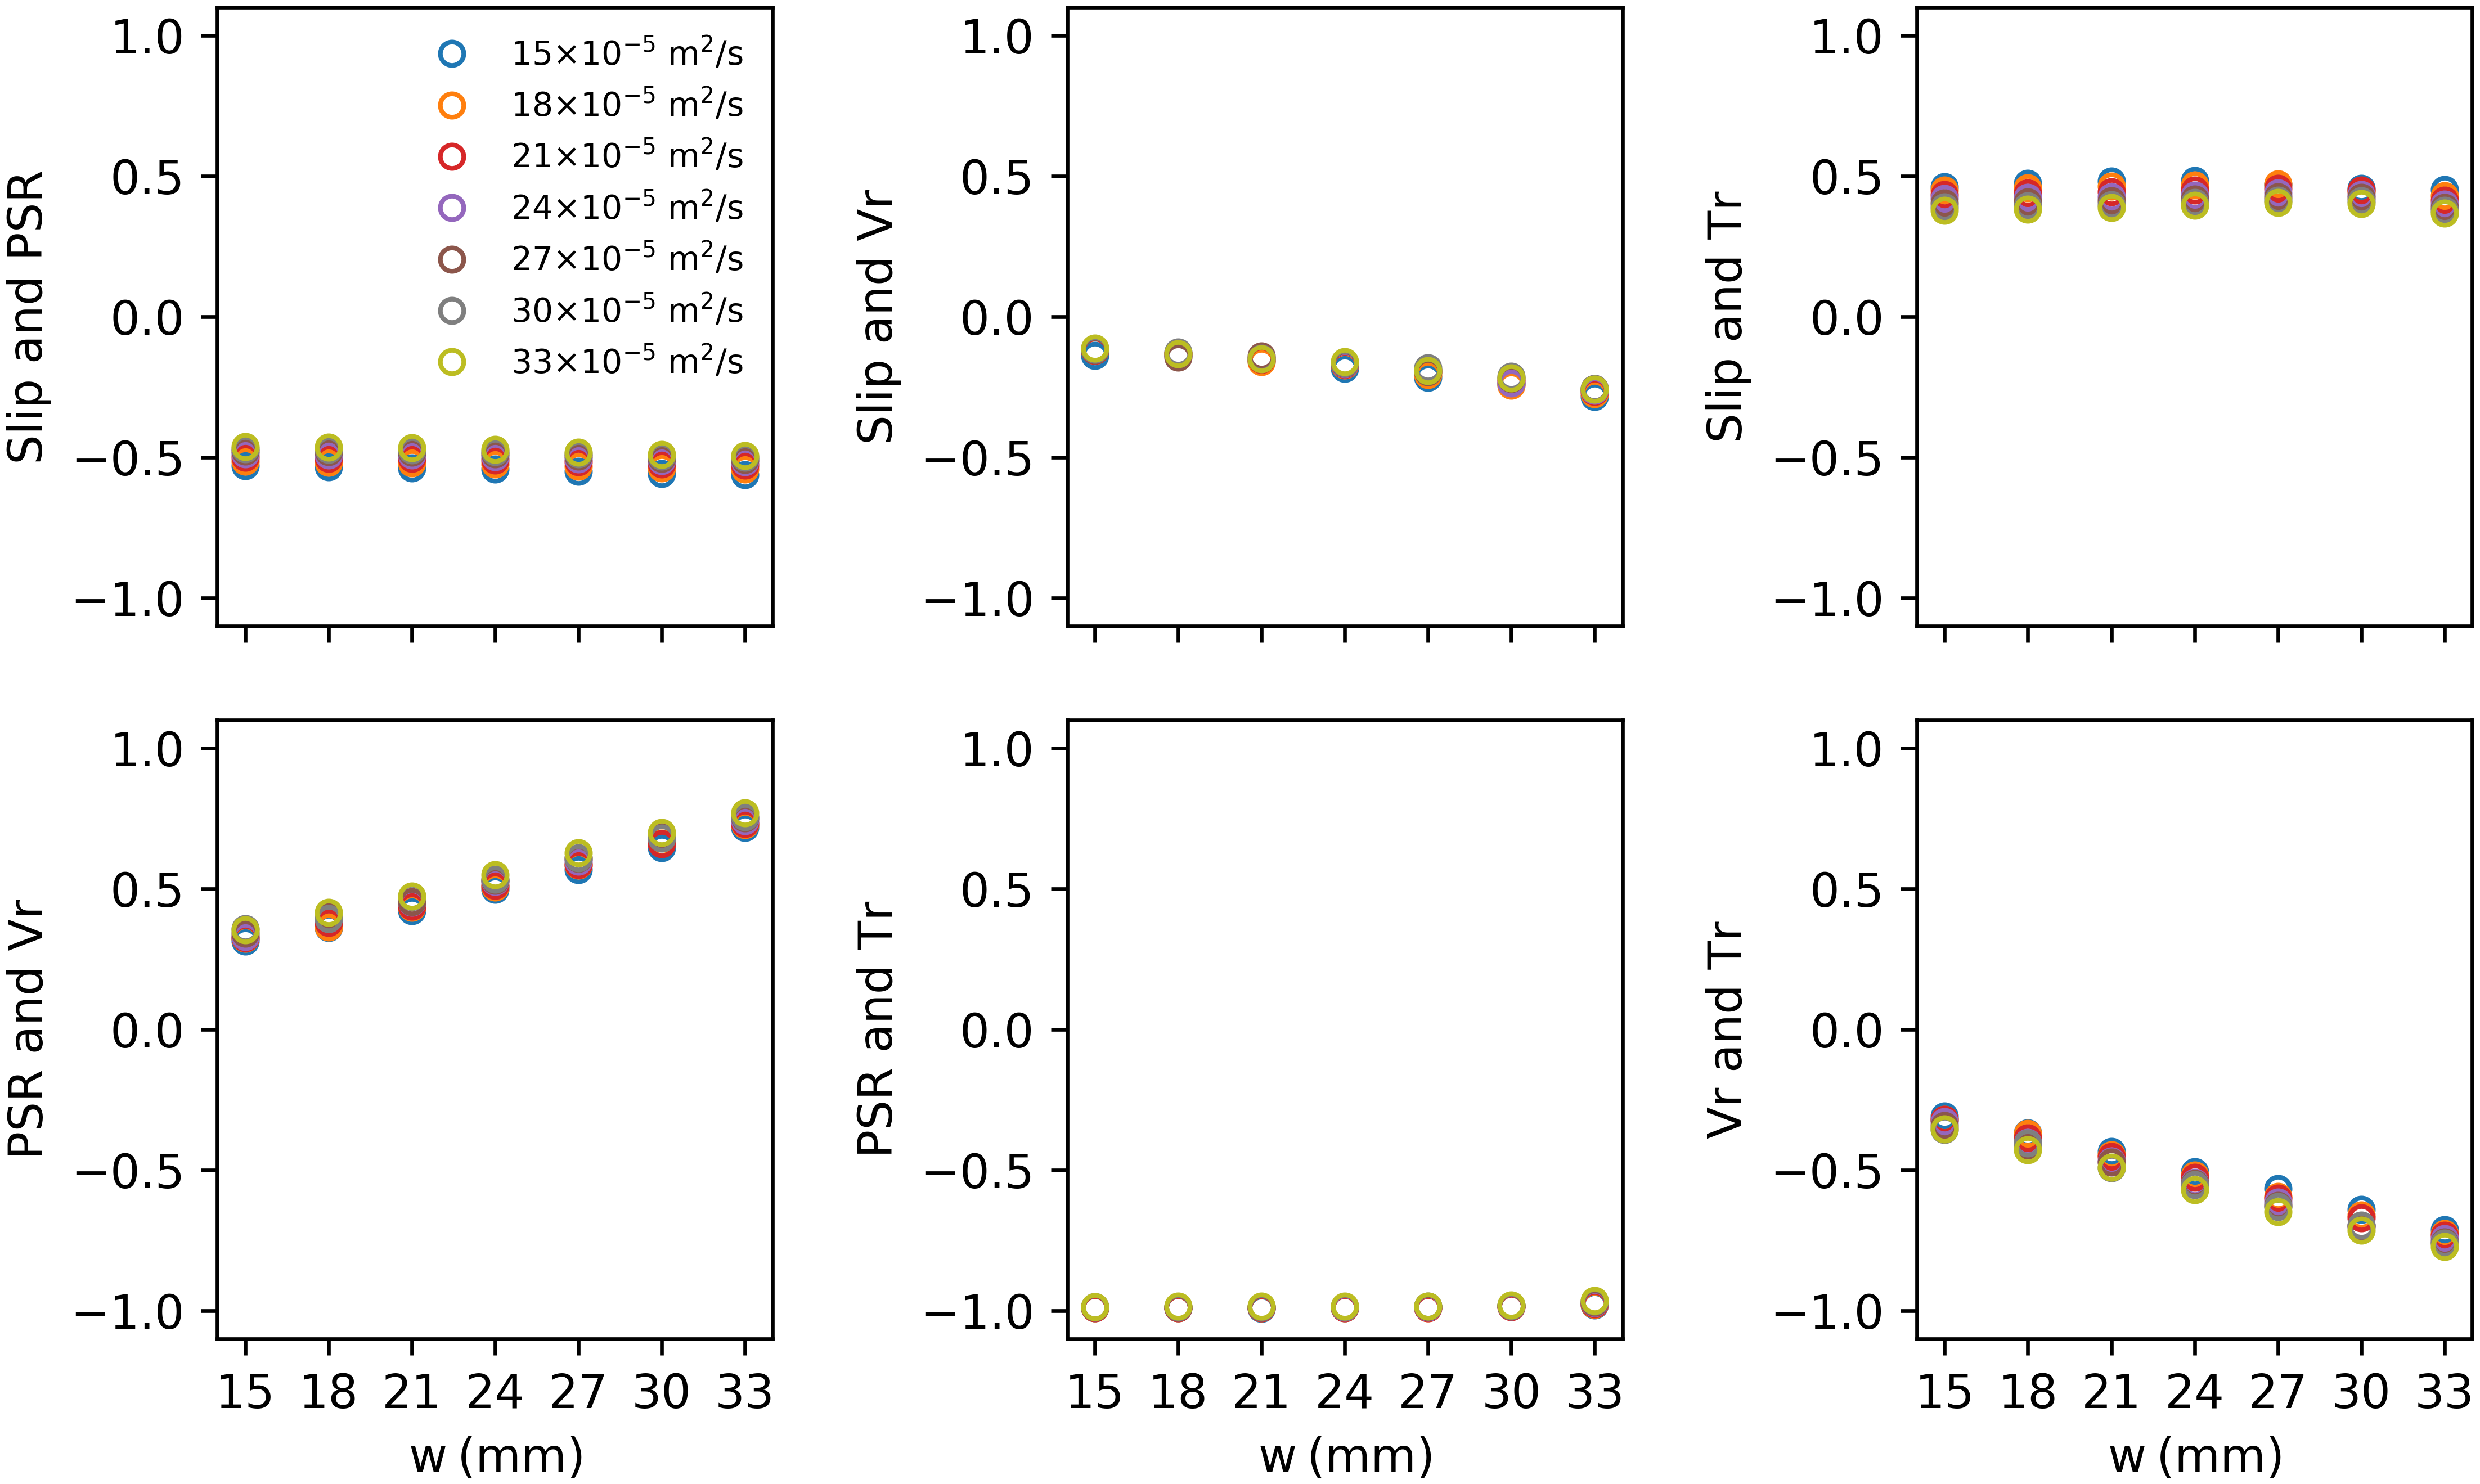
We analyze and compare effects of against on the correlations between kinematic rupture parameters. Figure 7 shows correlations among rupture parameters with varying for fixed . Correlations among (slip, PSR), (slip, Tr) and (PSR, Tr) are nearly insensitive to changes in , which is similar to what we observed in Figure 6 when varying . However, (PSR, Vr) correlation increases from to almost and (Vr, Tr) anticorrelation increases from to almost as we double . The contribution of TP to dynamic weakening is substantial for the smallest explored . Indeed, TP effects can strongly decrease the correlation among (PSR, Vr) and (Vr, Tr). We also find a slight increase in anticorrelation from to for (slip, Vr) when doubling . All parameter pairs whose correlation increases with increasing involve rupture speed Vr. This suggests that may primarily affect Vr, which in turn may affect other kinematic rupture parameters such as slip, PSR and Tr.
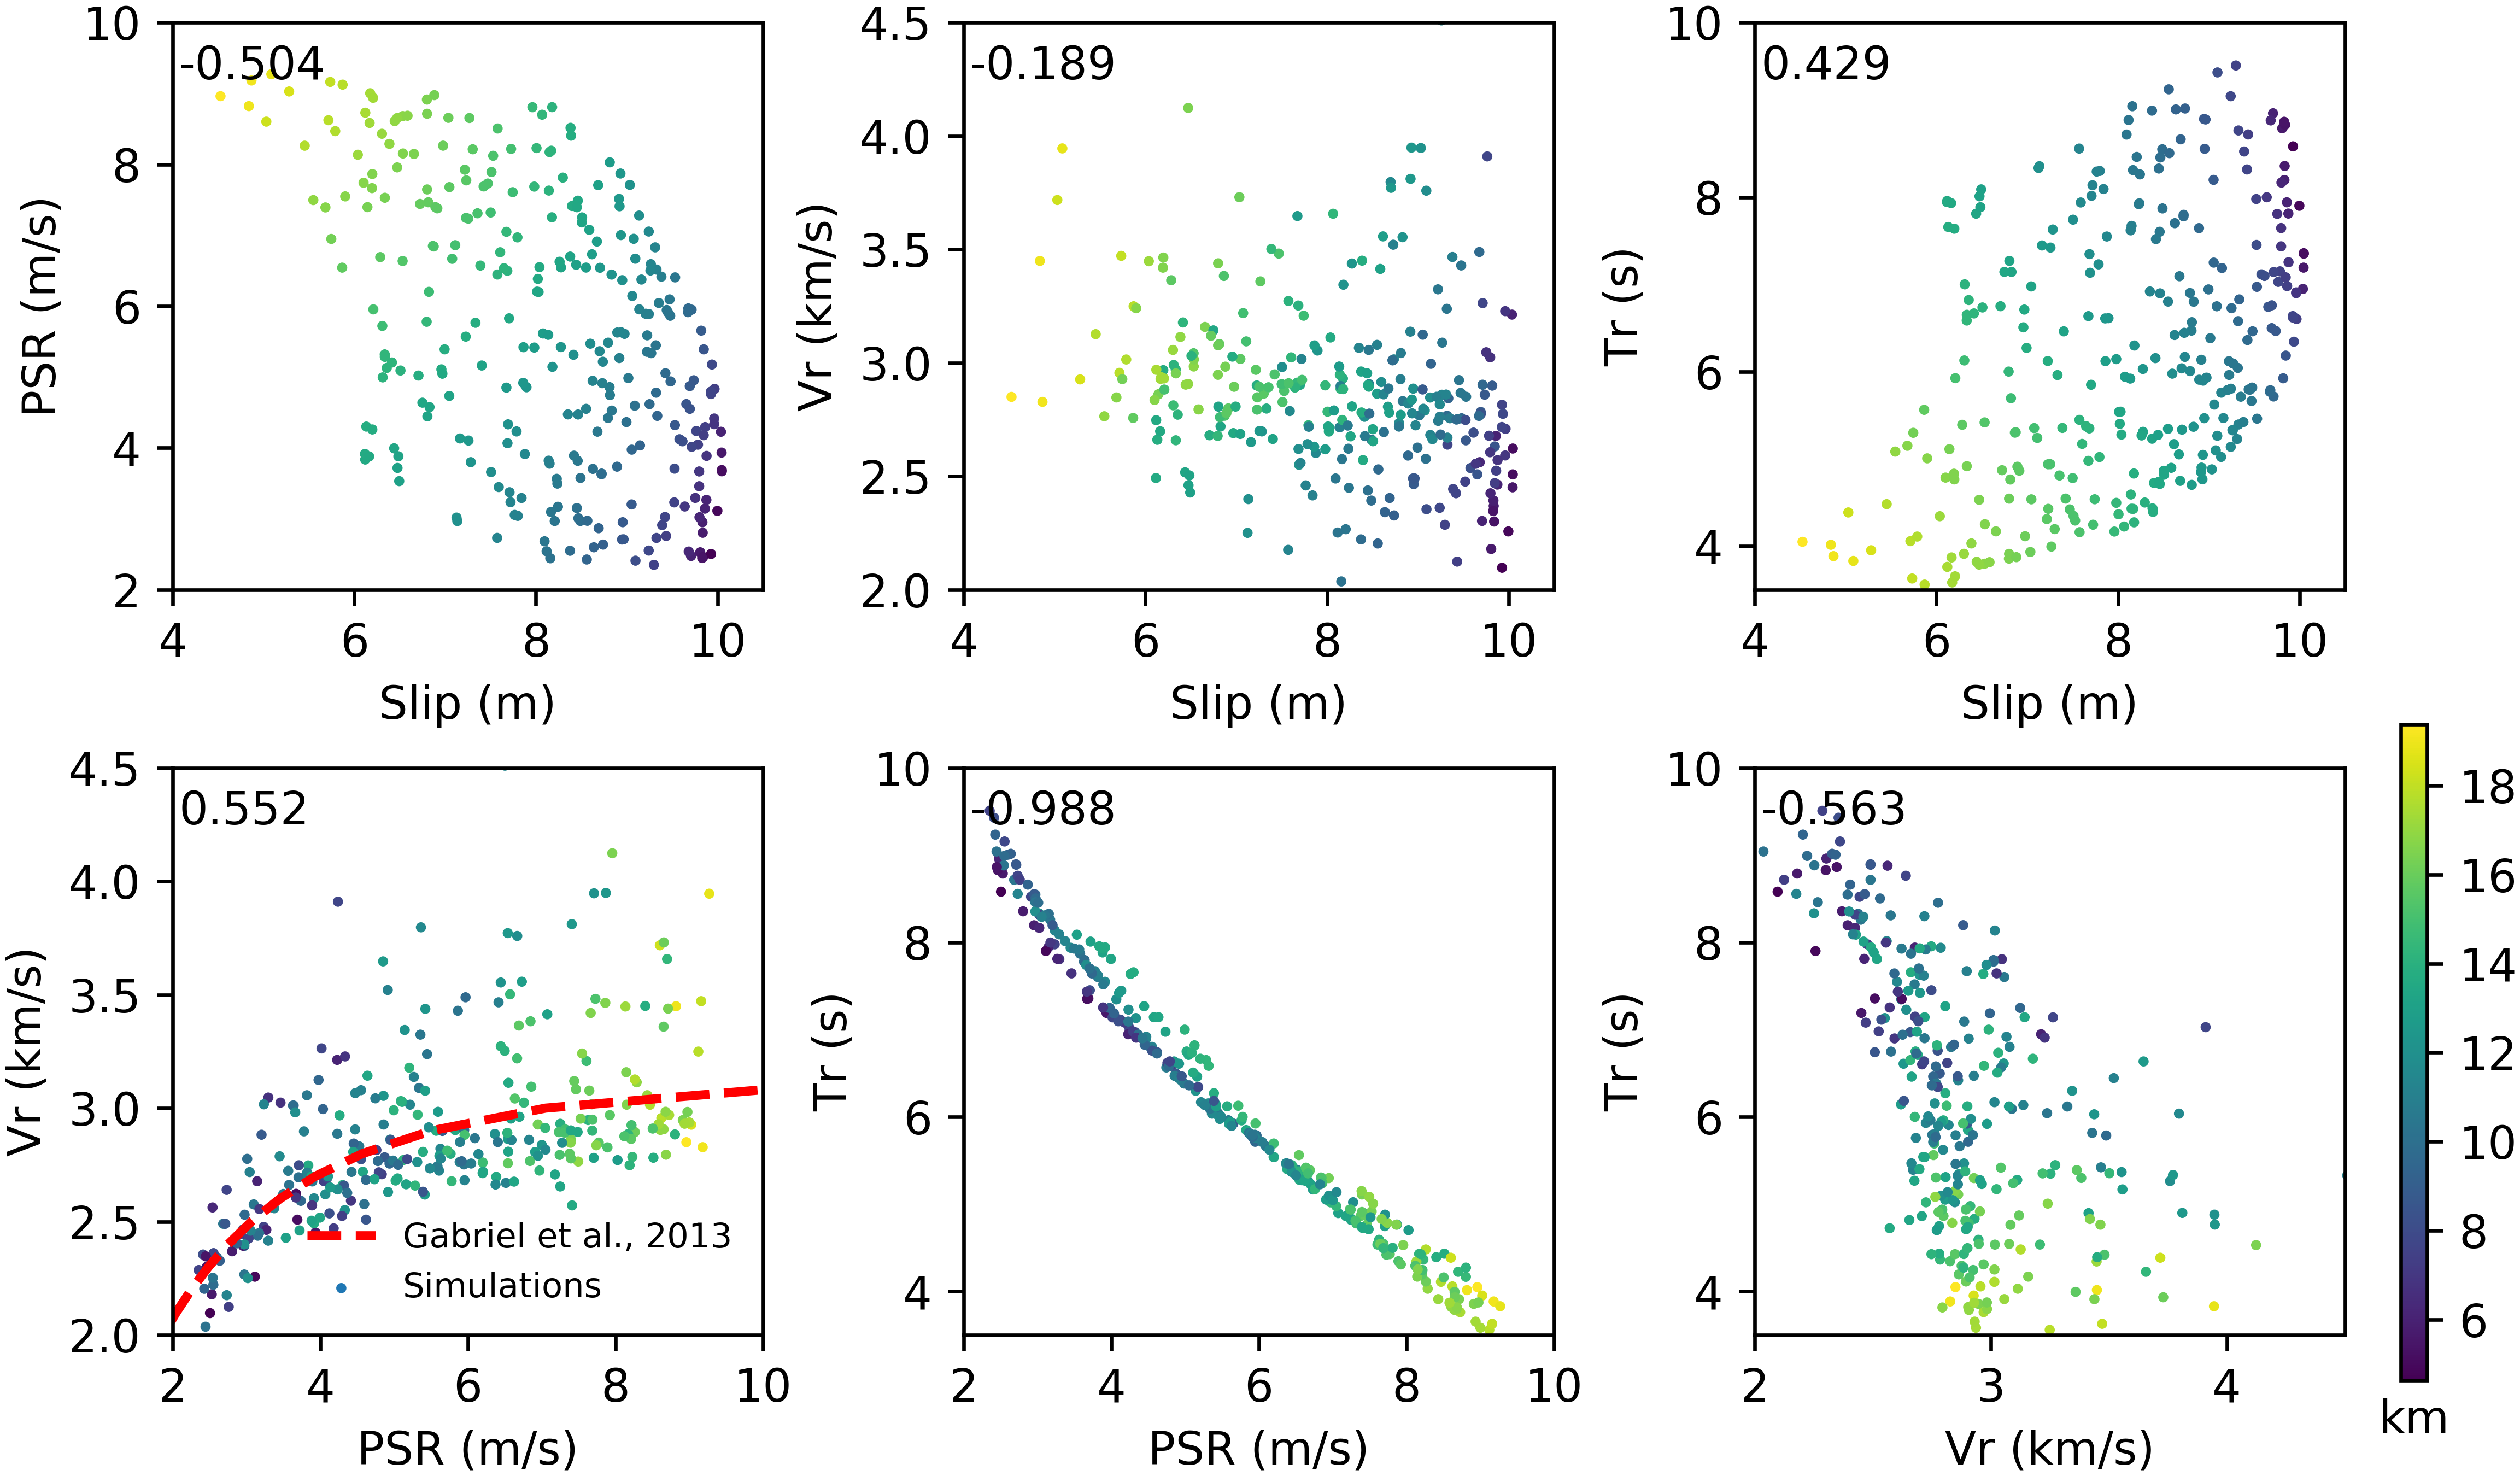
We compute the mean value of each rupture parameter across the 49 explored models at each on-fault receiver to understand the overall correlations among slip, PSR, Vr and Tr. Figure 8 shows these average correlations for six pairs of rupture variables. We observe that slip and PSR are negatively correlated (), which is in contrast to the positive correlation reported by Schmedes et al., (2010). The low correlation we observe between slip and Vr is consistent with findings of Schmedes et al., (2010). We find positive correlation for (slip, Tr; ) in agreement with a positive relationship reported by Schmedes et al., (2010) with to . We find that PSR and Vr are positively correlated consistent with Schmedes et al., (2010). We find negative correlation for (PSR, Tr; ) and (Vr, Tr; ) consistent with findings of negative relationship reported by Schmedes et al., (2010) ( for two pairs). Also, we show that theoretical estimates of (PSR, Vr) derived in Gabriel et al., (2013) match our simulation results (Figure 8). The slightly different scaling factor between PSR and Vr estimated from our models (0.8) compared to the theoretical estimates from Gabriel et al., (2013) (0.65) can be explained by the use of 2D models without TP in Gabriel et al., (2013).
The differences observed in the correlation among rupture parameters from our study with respect to Schmedes et al., (2010) can be partly attributed to dissimilar features of their rupture models, including the initial shear stress, friction law and inclusion of TP effects. We use depth dependent initial shear stress (see Appendix A of electronic supplement) whereas Schmedes et al., (2010) assume a spatially heterogeneous initial shear stress with power-law spectral decay. Schmedes et al., (2010) employ linear slip-weakening friction whereas we use rate-and-state friction with strong velocity-weakening, consistent with laboratory observations. Our simulations account for TP whereas Schmedes et al., (2010) did not.
Ground velocity comparison and PGV statistics
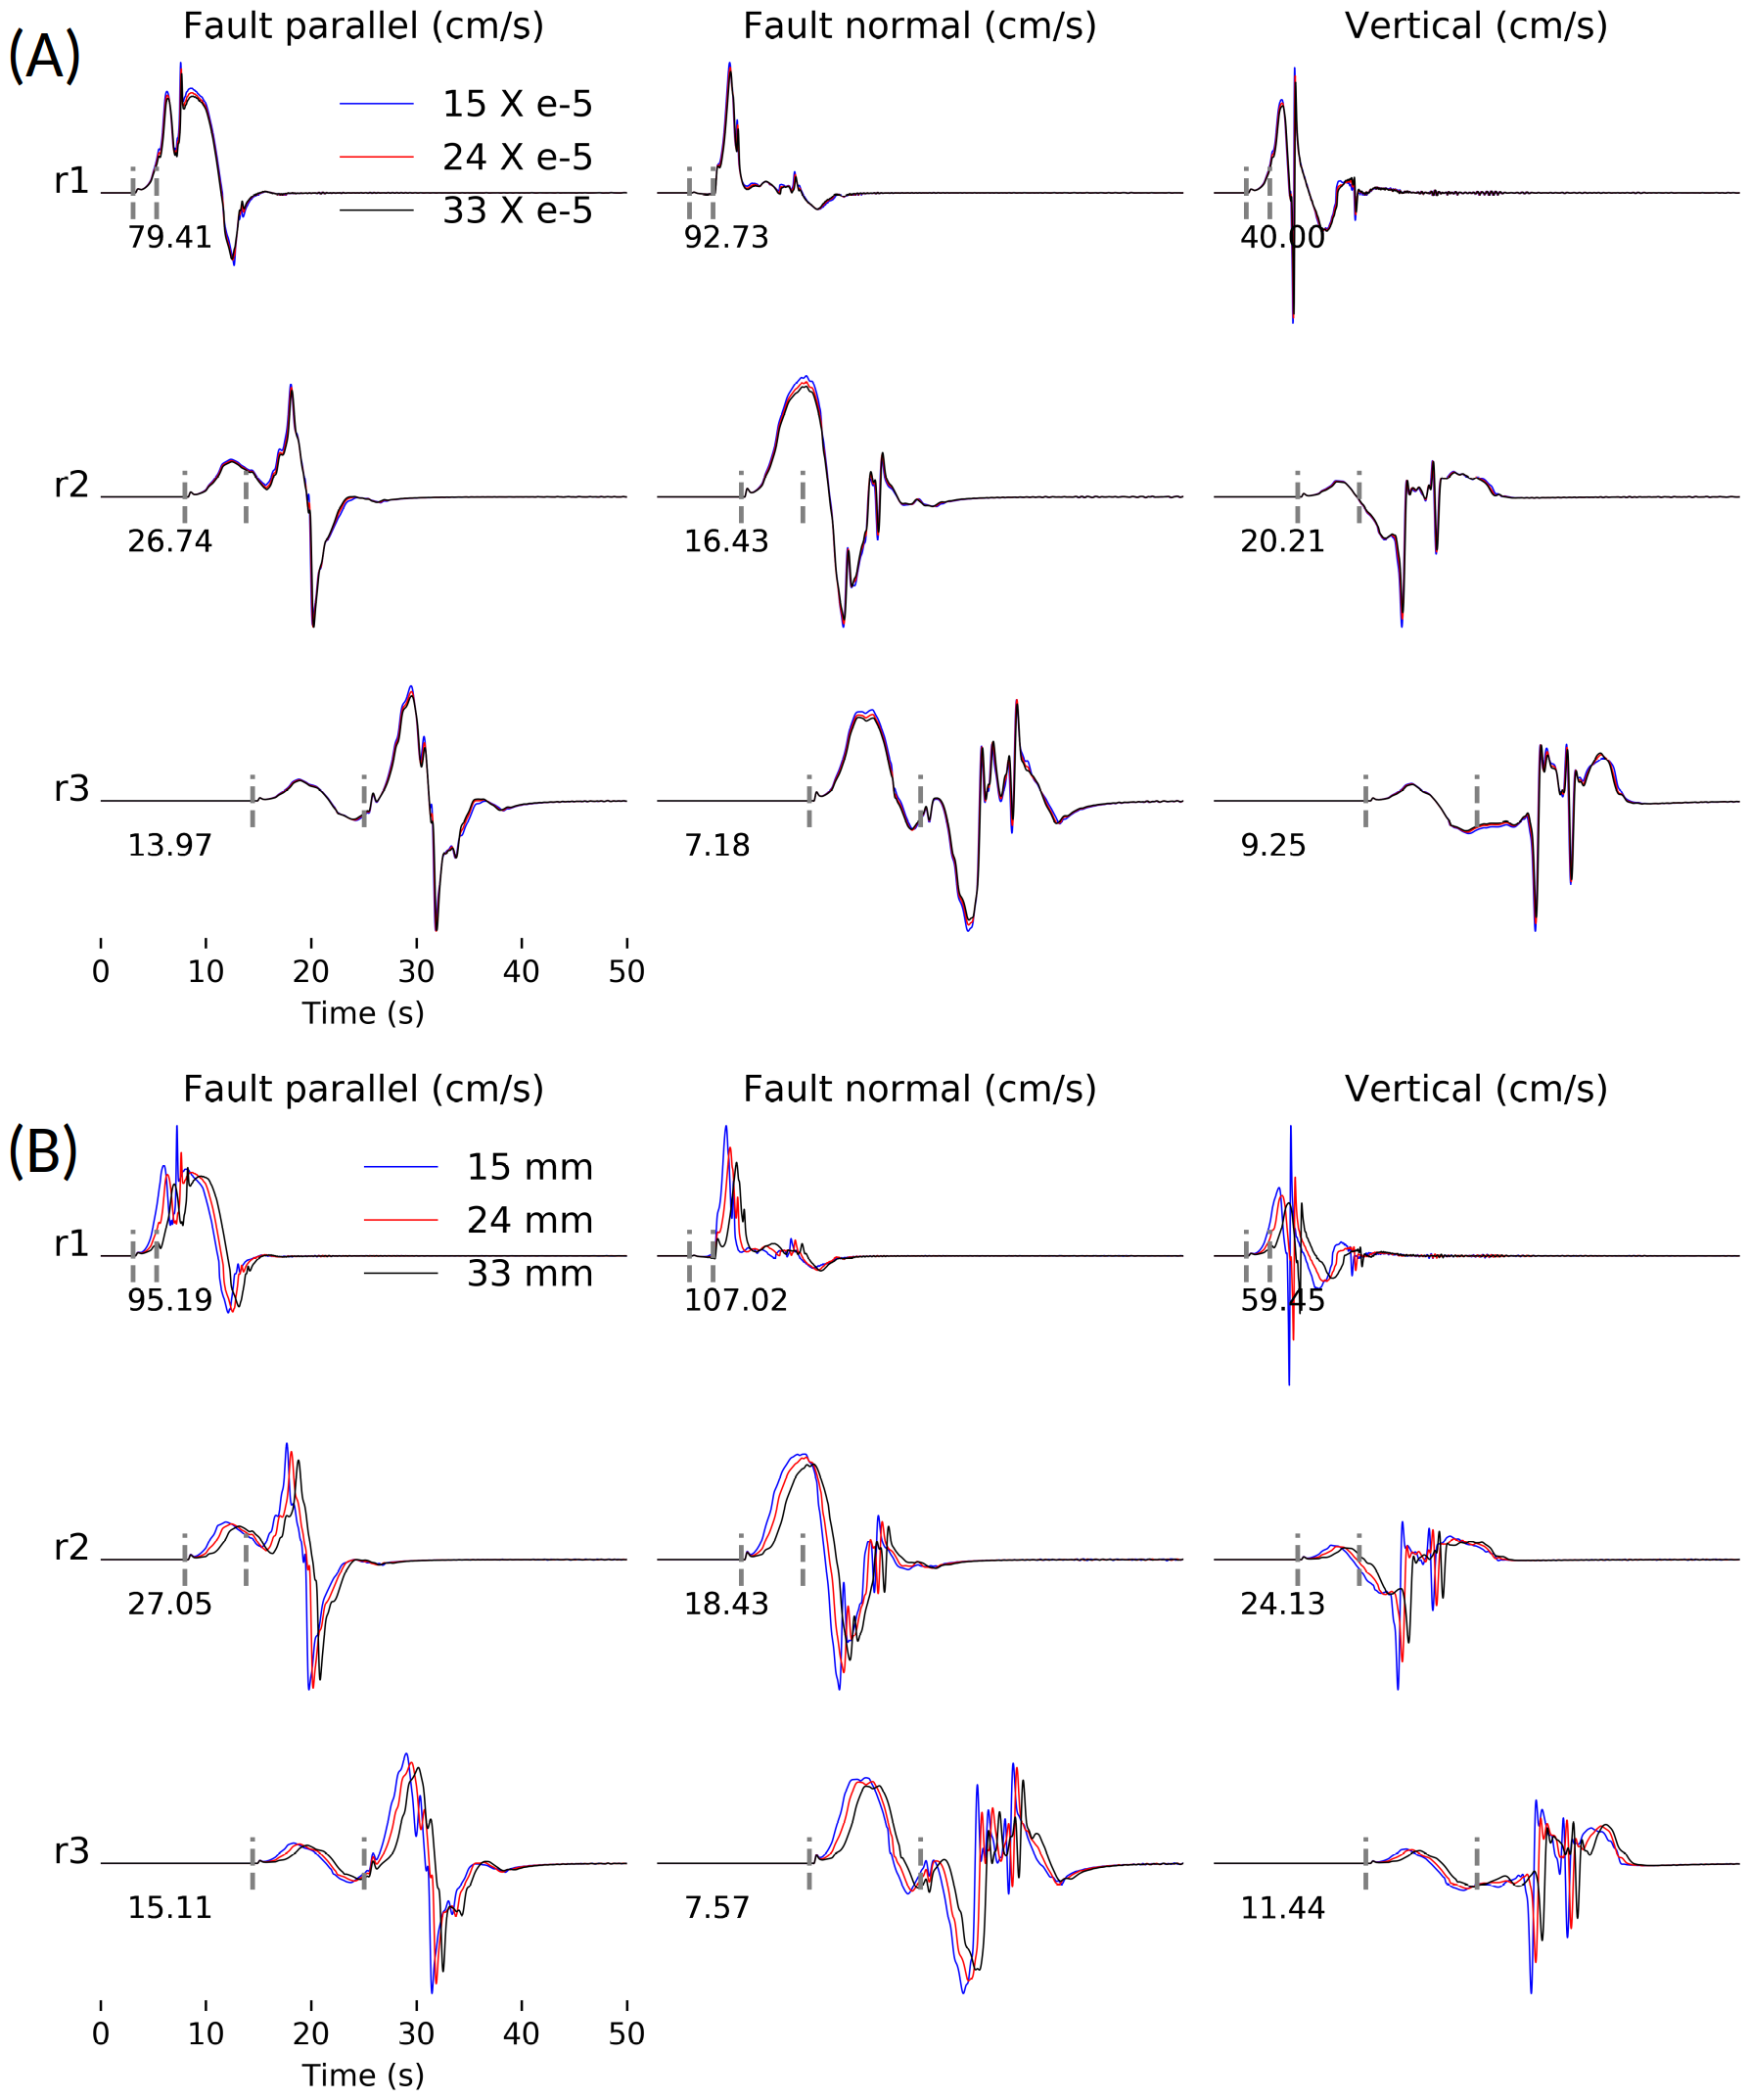
We analyze ground velocity time series as a function of TP parameters. Figure 9 compares three-component ground velocity waveforms for three values of (15, 24, 33 X ) and (15, 24, 33 mm) at receivers r1 to r3 (Figure 1B). Velocity waveforms are nearly unaffected by changes in for all components and receivers. On the other hand, increasing delays the first arrival and reduces peak amplitude, while the waveform shape remains nearly similar (see, Figure 9B). Hence, seems to have a larger impact on ground velocity than .
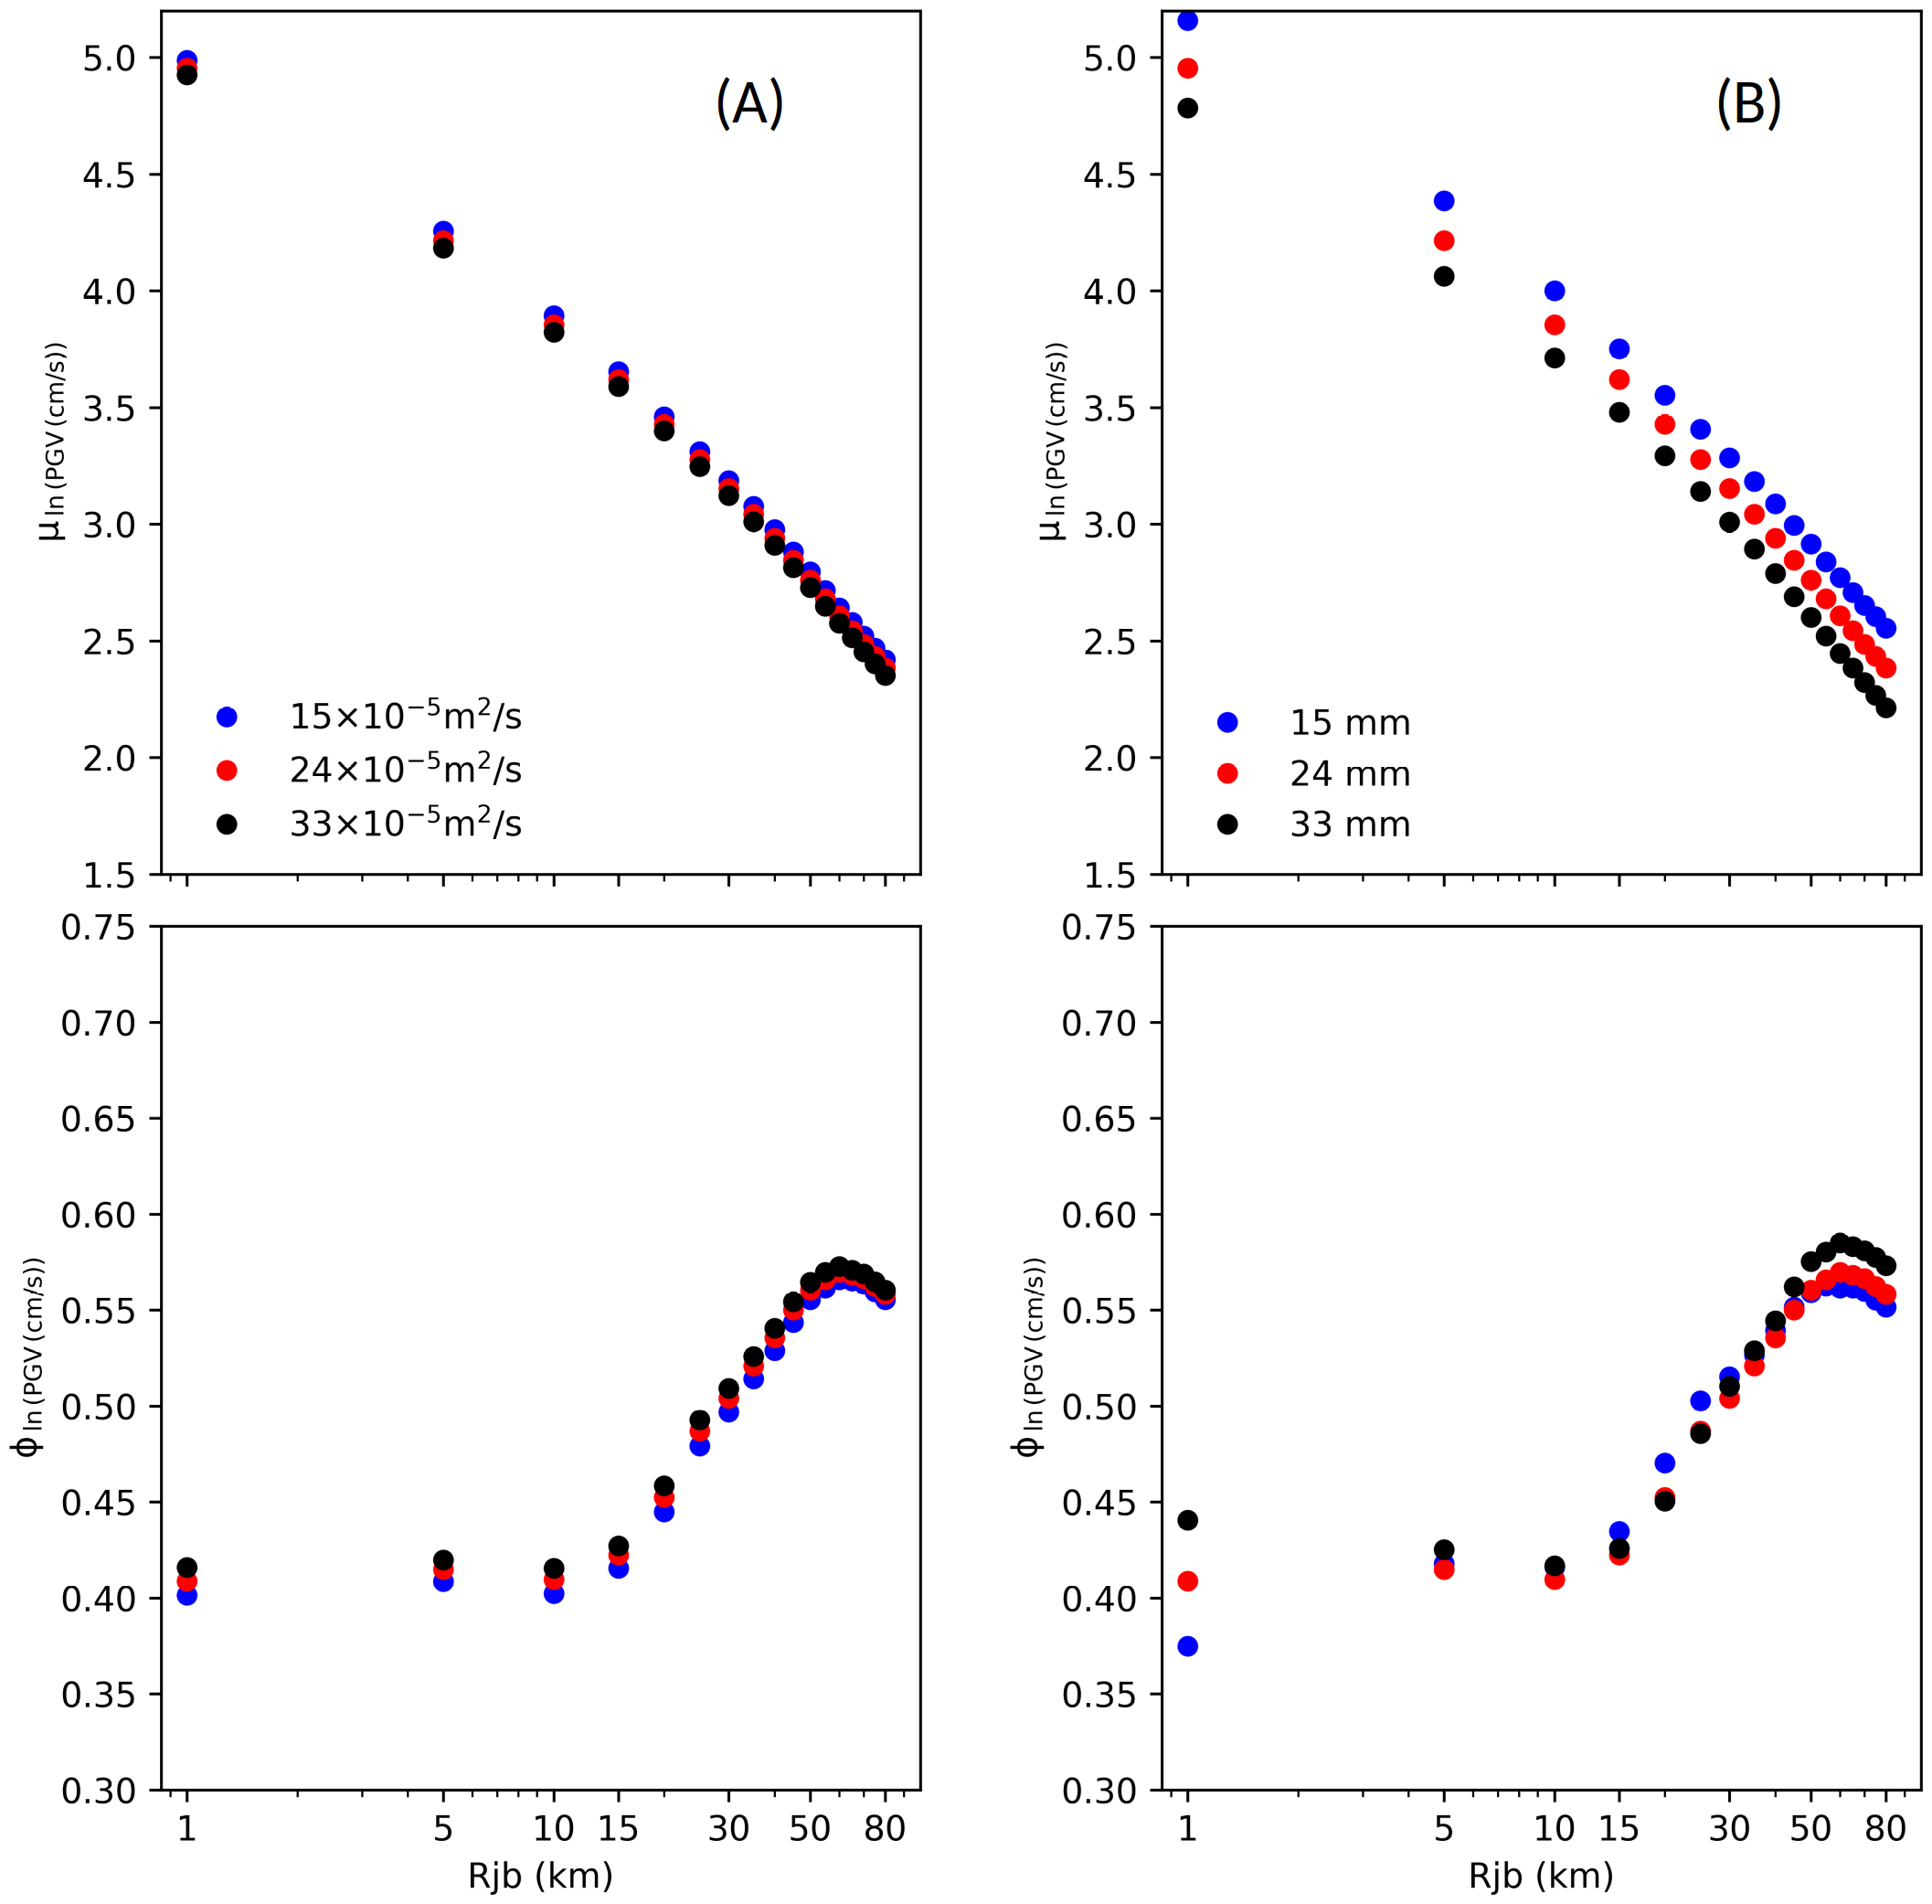
We examine the mean and standard deviation of PGV across all receivers at a given distance. We calculate the orientation-independent PGV metric GMRotD50 (Boore et al.,, 2006). Figure 10 shows the distance dependence of the mean () and the standard deviation () of for varying and . decreases much more with increasing than with increasing . The mean PGV decreases by nearly 15% at 80 km distance when is doubled, whereas it decrease by only 2% when is doubled. The variability has a similar trend at all distances for both and except near the fault ( = 1 km). We also observe an increase in ground motion variability beyond 15 km which is consistent with the reporting of Imtiaz et al., (2015) of increasing variability with distance for bilateral ruptures, and is therefore not specific to rupture accounting for TP. In summary, we observe that has a larger impact on ground velocity and PGV than .
Discussion and conclusions
We investigate the role of two key TP parameters, hydraulic diffusivity and shear-zone half-width , on earthquake rupture dynamics, associated kinematic source properties and ground shaking. We conduct 3D dynamic rupture simulations considering a rate-and-state dependent friction law with strong velocity-weakening, coupled to TP.
We find that has a stronger effect on rupture dynamics, kinematic rupture properties and ground shaking than . Mean slip and rise time decrease with increasing , whereas mean peak slip-rate and rupture speed remain nearly constant. Mean slip, peak slip-rate and rupture speed decrease with increasing , whereas mean rise time increases. Also, distinctly affects the correlation between rupture parameters, especially between parameter pairs (slip, rupture speed), (peak slip-rate, rupture speed), (rupture speed, rise time), whereas has a negligible effect on rupture-parameter correlations. Mean PGV decreases faster with increasing than with increasing , whereas ground motion variability has similar trends.
The dominant impact of compared to on rupture dynamics can be interpreted by considering the characteristic time of the diffusion process:
| (15) |
Since ,
| (16) |
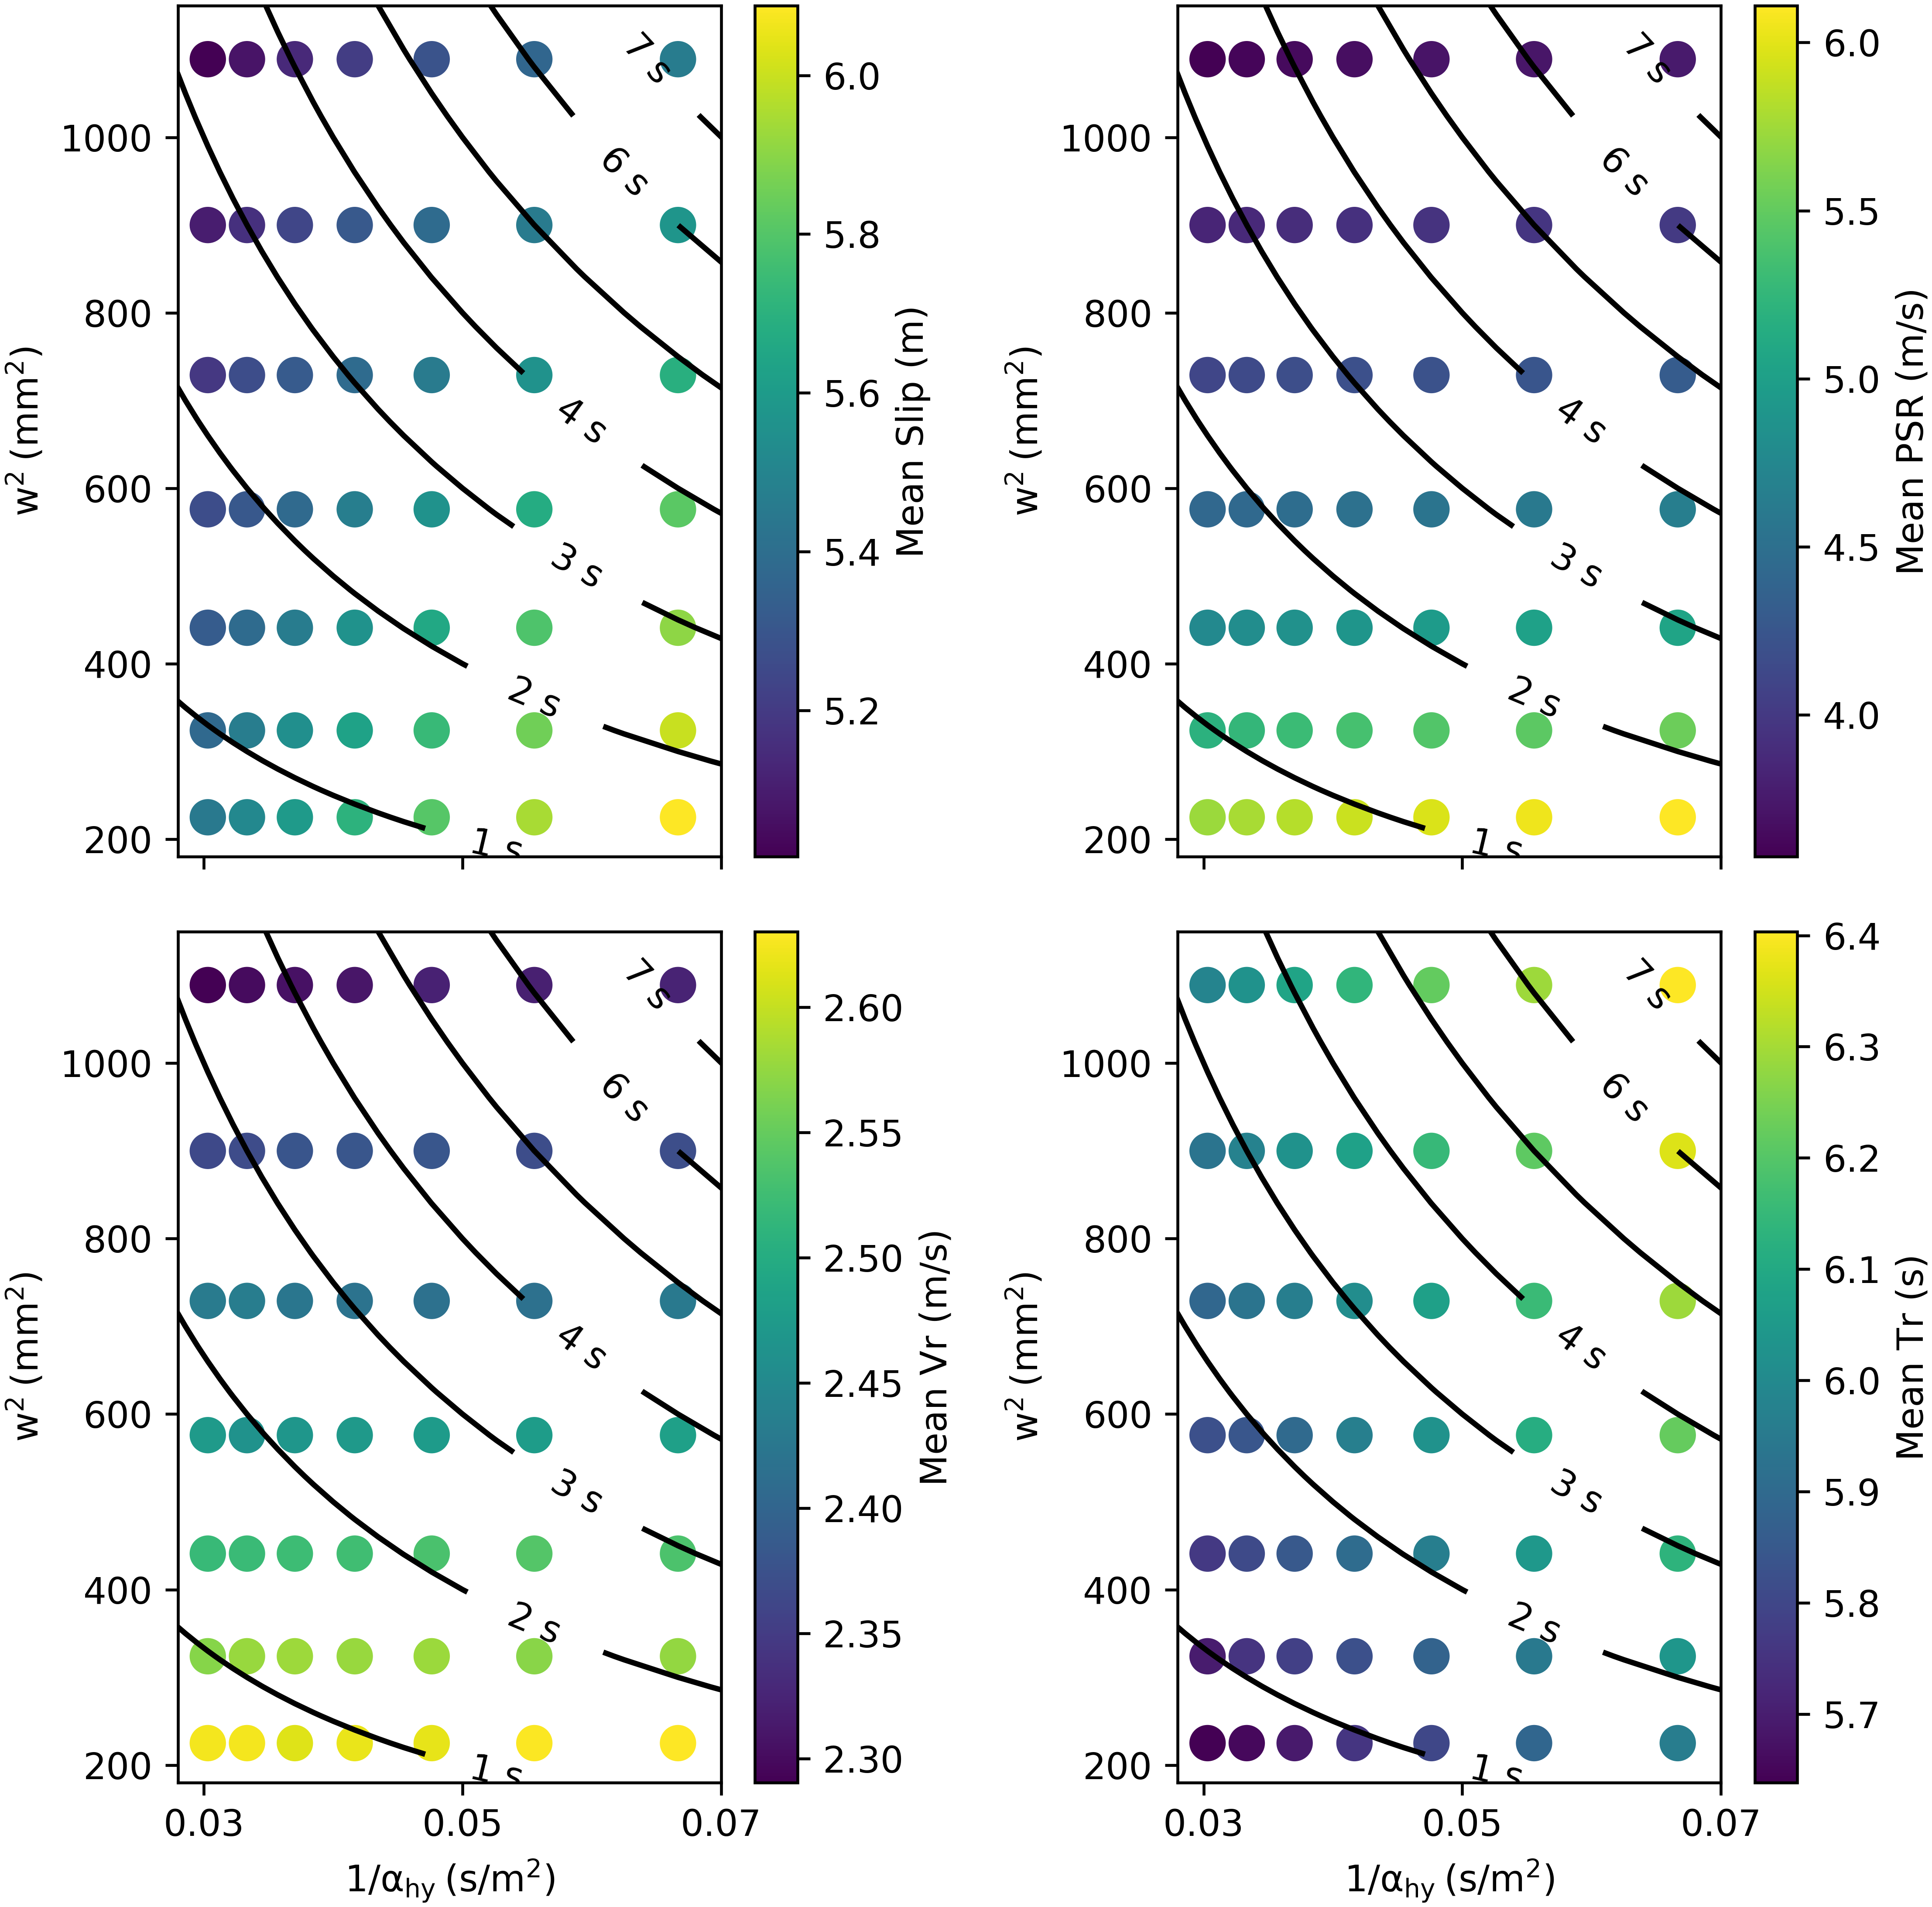
In particular, increases by nearly four times as we double , whereas it decreases by only two times as we double . Figure 11 shows variations in kinematic rupture parameters (slip, PSR, Vr and Tr) as a function of and , along with contours of diffusion time. We find that rupture speed is inversely correlated to , whereas rise time is positively correlated to . Slip and PSR have more complex relations with . The variations in PSR are larger for varying compared to , which is consistent with the variation of as a function of and .
Analytical scaling relations have been developed for 2D steady-state pulse-like ruptures under TP (Garagash,, 2012). Their Fig. 5a shows that pulse rise-time scales with the characteristic diffusion time across the shear zone for a given value of prestress: fault re-strengthening due to pore pressure diffusion away from the shear zone becomes effective at this time scale. Similar effects may qualitatively explain our findings of strong influence of shear-zone half-width and the weaker influence of hydraulic diffusivity on 3D heterogenous rupture pulse characteristics such as average rise time. Our modeled rupture pulses have relatively long rise times (on the order of 5 s), and thus healing will not only be governed by pore pressure diffusion as in the 2D steady-state pulse but also by geometrical effects such as the limited width of the seismogenic zone (Weng and Ampuero,, 2019).
Our study considers constant values of hydraulic diffusivity and shear-zone half-width over a large portion of the fault (the velocity-weakening portion of the fault in Figure 1A), whereas complex spatial variations of TP parameters are expected in nature. Our simulations suggest that the effects on kinematic parameters and ground-motions decrease, especially for PSR (by nearly 60%) and for mean PGV (by nearly 15%) respectively, as we double . We do not consider path effects, such as seismic wavefield scattering and intrinsic attenuation, as our objective is to understand source effects due to TP. Therefore, future extension of this research could include other physical processes such as realistic high-frequency radiation due to fault roughness, rupture complexity due to heterogeneous initial shear stress, seismic scattering due to small scale heterogeneities and plastic deformation of material, to gain understanding on how TP combined with these processes affects rupture dynamics and ground-motion at high frequencies (Imperatori and Mai,, 2012; Shi and Day,, 2013; Mai et al.,, 2018; Wollherr et al.,, 2018; Vyas et al.,, 2018, 2021). The combined effects of several physical processes can reduce (or enhance) TP effects on rupture dynamics making it a second-order (or primary) process governing ground-shaking and PSHA.
In summary, our physics-based dynamic rupture simulations accounting for TP develop an understanding on how hydraulic diffusivity and shear-zone half-width affects rupture dynamics, associated kinematic properties and ground-shaking. Our findings on how variations in and affect slip, PSR, Vr, Tr and PGV provide useful insight for the earthquake source modeling community and hazard assessment community about rupture properties and ground-motion behaviour from earthquakes in fluid-rich environments such as geo-reservoirs and subduction zones where TP can be a dominant dynamic weakening mechanism.
Data and Resources
We use the open-source software SeisSol (https://github.com/SeisSol/SeisSol, git commit hash: 2f4942e8de21aebd56e179eb11837acd40ae4c07, last accessed October, 2022) to simulate earthquake rupture process and ground-motions. All SeisSol input files required to reproduce our simulations will be made available as a zenodo repository upon publication. We generated nearly 2.0 TB data to analyze the effects of pore fluid thermal pressurization on rupture dynamics and ground-shaking which can be provided via personal communication upon request. This article comprises electronic supplemental material on temporal evolution of slip rate, total traction, temperature and pressure at different on-fault locations. It also describes effects of hydraulic diffusivity and shear-zone half-width variations on moment magnitude. The details of initial shear stress and rupture nucleation method are also provided in the electronic supplement. The 3D benchmark exercise by Ulrich et al., (2020) is available on SCEC website (https://strike.scec.org/cvws/download/TPV105-3D-description.pdf, last accessed October, 2022).
Acknowledgments
We acknowledge the work and helpful discussions of and with Stephanie Wollherr, Sebastian Anger and Kadek Palgunadi regarding the implementation of thermal pressurisation in SeisSol. We also thank Michael Barall and Yongfei Wang for uploading their solutions to SECEC TPV105-3D benchmark exercise platform to validate their dynamic rupture codes. The research presented in this paper is supported by King Abdullah University of Science and Technology (KAUST) in Thuwal, Saudi Arabia, under grants BAS/1/1339-01-01 and URF/1/3389-01-01 (JCV and PMM). AAG and TU acknowledge the support of the European Research Council (ERC) under the European Union’s Horizon 2020 research and innovation programme (ERC Starting Grant TEAR, Grant agreement No. 852992 and Center of Excellence ChEESE, Grant agreement No. 823844), the Southern California Earthquake Center (SCEC Grant No. 22135) and the National Science Foundation (NSF Grant No. EAR-2121666). Earthquake rupture dynamics and ground-motion modeling have been carried out using the KAUST Supercomputing Laboratory (KSL), and we acknowledge the support of the KSL staff. We also thank Kadek Palgunadi and SeisSol software team for their help regarding software installation.
References
- Abercrombie and Rice, (2005) Abercrombie, R. E. and Rice, J. R. (2005). Can observations of earthquake scaling constrain slip weakening? Geophysical Journal International, 162(2):406–424.
- Acosta et al., (2018) Acosta, M., Passelègue, F., Schubnel, A., and Violay, M. (2018). Dynamic weakening during earthquakes controlled by fluid thermodynamics. Nature communications, 9(1):1–9.
- Andrews, (2005) Andrews, D. (2005). Thermal pressurization explains enhanced long-period motion in the chi-chi earthquake. In AGU Fall Meeting Abstracts, volume 2005, pages S34A–04.
- Andrews, (2002) Andrews, D. J. (2002). A fault constitutive relation accounting for thermal pressurization of pore fluid. Journal of Geophysical Research: Solid Earth, 107(B12):ESE–15.
- Aretusini et al., (2021) Aretusini, S., Meneghini, F., Spagnuolo, E., Harbord, C., and Di Toro, G. (2021). Fluid pressurisation and earthquake propagation in the hikurangi subduction zone. Nature communications, 12(1):1–8.
- Badt et al., (2020) Badt, N. Z., Tullis, T. E., Hirth, G., and Goldsby, D. L. (2020). Thermal Pressurization Weakening in Laboratory Experiments. Journal of Geophysical Research: Solid Earth, 125(5):e2019JB018872.
- (7) Bizzarri, A. and Cocco, M. (2006a). A thermal pressurization model for the spontaneous dynamic rupture propagation on a three-dimensional fault: 1. methodological approach. Journal of Geophysical Research: Solid Earth, 111(B5).
- (8) Bizzarri, A. and Cocco, M. (2006b). A thermal pressurization model for the spontaneous dynamic rupture propagation on a three-dimensional fault: 2. traction evolution and dynamic parameters. Journal of Geophysical Research: Solid Earth, 111(B5).
- Boore et al., (2006) Boore, D. M., Watson-Lamprey, J., and Abrahamson, N. A. (2006). Orientation-independent measures of ground motion. Bulletin of the seismological Society of America, 96(4A):1502–1511.
- Brantut et al., (2019) Brantut, N., Garagash, D. I., and Noda, H. (2019). Stability of pulse-like earthquake ruptures. Journal of Geophysical Research: Solid Earth, 124(8):8998–9020.
- Crempien and Archuleta, (2018) Crempien, J. G. and Archuleta, R. J. (2018). Within-event and between-events ground motion variability from earthquake rupture scenarios. In Best Practices in Physics-based Fault Rupture Models for Seismic Hazard Assessment of Nuclear Installations, pages 127–141. Springer.
- Di Toro et al., (2011) Di Toro, G., Han, R., Hirose, T., De Paola, N., Nielsen, S., Mizoguchi, K., Ferri, F., Cocco, M., and Shimamoto, T. (2011). Fault lubrication during earthquakes. Nature, 471(7339):494–498.
- Dumbser and Käser, (2006) Dumbser, M. and Käser, M. (2006). An arbitrary high-order discontinuous galerkin method for elastic waves on unstructured meshes—ii. the three-dimensional isotropic case. Geophysical Journal International, 167(1):319–336.
- Dunham et al., (2011) Dunham, E. M., Belanger, D., Cong, L., and Kozdon, J. E. (2011). Earthquake ruptures with strongly rate-weakening friction and off-fault plasticity, part 1: Planar faults. Bulletin of the Seismological Society of America, 101(5):2296–2307.
- Gabriel et al., (2020) Gabriel, A., Vyas, J., Ulrich, T., Ampuero, J., and Mai, M. (2020). 3d dynamic rupture modeling with thermal pressurization. In Poster Presentation at 2020 SCEC Annual Meeting, page 158. Southern California Earthquake Center.
- Gabriel et al., (2013) Gabriel, A.-A., Ampuero, J.-P., Dalguer, L., and Mai, P. M. (2013). Source properties of dynamic rupture pulses with off-fault plasticity. Journal of Geophysical Research: Solid Earth, 118(8):4117–4126.
- Galis et al., (2017) Galis, M., Ampuero, J. P., Mai, P. M., and Cappa, F. (2017). Induced seismicity provides insight into why earthquake ruptures stop. Science Advances, 3(12):eaap7528.
- Gallovič, (2017) Gallovič, F. (2017). Azimuthal dependence of the ground motion variability from scenario modeling of the 2014 mw6. 0 south napa, california, earthquake using an advanced kinematic source model. Pure and Applied Geophysics, 174(9):3467–3478.
- Garagash, (2012) Garagash, D. (2012). Seismic and aseismic slip pulses driven by thermal pressurization of pore fluid. Journal of Geophysical Research: Solid Earth, 117(B4).
- Guatteri et al., (2003) Guatteri, M., Mai, P. M., Beroza, G. C., and Boatwright, J. (2003). Strong ground-motion prediction from stochastic-dynamic source models. Bulletin of the Seismological Society of America, 93(1):301–313.
- Harris et al., (2018) Harris, R. A., Barall, M., Aagaard, B., Ma, S., Roten, D., Olsen, K., Duan, B., Liu, D., Luo, B., Bai, K., et al. (2018). A suite of exercises for verifying dynamic earthquake rupture codes. Seismological Research Letters, 89(3):1146–1162.
- Harris et al., (2011) Harris, R. A., Barall, M., Andrews, D. J., Duan, B., Ma, S., Dunham, E. M., Gabriel, A.-A., Kaneko, Y., Kase, Y., Aagaard, B. T., et al. (2011). Verifying a computational method for predicting extreme ground motion. Seismological Research Letters, 82(5):638–644.
- Hirono et al., (2016) Hirono, T., Tsuda, K., Tanikawa, W., Ampuero, J.-P., Shibazaki, B., Kinoshita, M., and Mori, J. J. (2016). Near-trench slip potential of megaquakes evaluated from fault properties and conditions. Scientific reports, 6(1):1–13.
- Imperatori and Mai, (2012) Imperatori, W. and Mai, P. M. (2012). Sensitivity of broad-band ground-motion simulations to earthquake source and earth structure variations: an application to the messina straits (italy). Geophysical Journal International, 188(3):1103–1116.
- Imtiaz et al., (2015) Imtiaz, A., Causse, M., Chaljub, E., and Cotton, F. (2015). Is ground-motion variability distance dependent? insight from finite-source rupture simulations. Bulletin of the Seismological Society of America, 105(2A):950–962.
- Kaneko et al., (2008) Kaneko, Y., Lapusta, N., and Ampuero, J.-P. (2008). Spectral element modeling of spontaneous earthquake rupture on rate and state faults: Effect of velocity-strengthening friction at shallow depths. Journal of Geophysical Research: Solid Earth, 113(B9).
- Kranz et al., (1990) Kranz, R., Saltzman, J., and Blacic, J. (1990). Hydraulic diffusivity measurements on laboratory rock samples using an oscillating pore pressure method. In International Journal of Rock Mechanics and Mining Sciences & Geomechanics Abstracts, volume 27, pages 345–352. Elsevier.
- Lachenbruch, (1980) Lachenbruch, A. H. (1980). Frictional heating, fluid pressure, and the resistance to fault motion. Journal of Geophysical Research: Solid Earth, 85(B11):6097–6112.
- Lachenbruch and Sass, (1980) Lachenbruch, A. H. and Sass, J. (1980). Heat flow and energetics of the san andreas fault zone. Journal of Geophysical Research: Solid Earth, 85(B11):6185–6222.
- Lamb, (2006) Lamb, S. (2006). Shear stresses on megathrusts: Implications for mountain building behind subduction zones. Journal of Geophysical Research: Solid Earth, 111(B7).
- Lambert et al., (2021) Lambert, V., Lapusta, N., and Perry, S. (2021). Propagation of large earthquakes as self-healing pulses or mild cracks. Nature, 591(7849):252–258.
- Li and Greengard, (2007) Li, J.-R. and Greengard, L. (2007). On the numerical solution of the heat equation i: Fast solvers in free space. Journal of Computational Physics, 226(2):1891–1901.
- Madden et al., (2022) Madden, E. H., Ulrich, T., and Gabriel, A.-A. (2022). The State of Pore Fluid Pressure and 3-D Megathrust Earthquake Dynamics. Journal of Geophysical Research: Solid Earth, 127(4):e2021JB023382.
- Mai et al., (2018) Mai, P. M., Galis, M., Thingbaijam, K. K., Vyas, J. C., and Dunham, E. M. (2018). Accounting for fault roughness in pseudo-dynamic ground-motion simulations. In Best Practices in Physics-based Fault Rupture Models for Seismic Hazard Assessment of Nuclear Installations, pages 95–126. Springer. https://doi.org/10.1007/978-3-319-72709-7_7.
- Mase and Smith, (1984) Mase, C. W. and Smith, L. (1984). Pore-fluid pressures and frictional heating on a fault surface. Pure and Applied Geophysics, 122(2):583–607.
- Mase and Smith, (1987) Mase, C. W. and Smith, L. (1987). Effects of frictional heating on the thermal, hydrologic, and mechanical response of a fault. Journal of Geophysical Research: Solid Earth, 92(B7):6249–6272.
- Mitsui et al., (2012) Mitsui, Y., Iio, Y., and Fukahata, Y. (2012). A scenario for the generation process of the 2011 Tohoku earthquake based on dynamic rupture simulation: Role of stress concentration and thermal fluid pressurization. Earth, Planets and Space, 64(12):1177–1187.
- Noda et al., (2009) Noda, H., Dunham, E. M., and Rice, J. R. (2009). Earthquake ruptures with thermal weakening and the operation of major faults at low overall stress levels. Journal of Geophysical Research: Solid Earth, 114(B7).
- Noda and Lapusta, (2010) Noda, H. and Lapusta, N. (2010). Three-dimensional earthquake sequence simulations with evolving temperature and pore pressure due to shear heating: Effect of heterogeneous hydraulic diffusivity. Journal of Geophysical Research: Solid Earth, 115(B12).
- Noda and Lapusta, (2013) Noda, H. and Lapusta, N. (2013). Stable creeping fault segments can become destructive as a result of dynamic weakening. Nature, 493(7433):518–521.
- Oglesby and Day, (2002) Oglesby, D. D. and Day, S. M. (2002). Stochastic fault stress: Implications for fault dynamics and ground motion. Bulletin of the Seismological Society of America, 92(8):3006–3021.
- Pelties et al., (2014) Pelties, C., Gabriel, A.-A., and Ampuero, J.-P. (2014). Verification of an ader-dg method for complex dynamic rupture problems. Geoscientific Model Development, 7(3):847–866.
- Perry et al., (2020) Perry, S. M., Lambert, V., and Lapusta, N. (2020). Nearly magnitude-invariant stress drops in simulated crack-like earthquake sequences on rate-and-state faults with thermal pressurization of pore fluids. Journal of Geophysical Research: Solid Earth, 125(3):e2019JB018597.
- Rice, (2006) Rice, J. R. (2006). Heating and weakening of faults during earthquake slip. Journal of Geophysical Research: Solid Earth, 111(B5).
- Rodriguez-Marek et al., (2011) Rodriguez-Marek, A., Montalva, G. A., Cotton, F., and Bonilla, F. (2011). Analysis of single-station standard deviation using the kik-net data. Bulletin of the Seismological Society of America, 101(3):1242–1258.
- Schmedes et al., (2010) Schmedes, J., Archuleta, R. J., and Lavallée, D. (2010). Correlation of earthquake source parameters inferred from dynamic rupture simulations. Journal of Geophysical Research: Solid Earth, 115(B3).
- Schmedes et al., (2013) Schmedes, J., Archuleta, R. J., and Lavallée, D. (2013). A kinematic rupture model generator incorporating spatial interdependency of earthquake source parameters. Geophysical Journal International, 192(3):1116–1131.
- Schmitt et al., (2015) Schmitt, S. V., Segall, P., and Dunham, E. M. (2015). Nucleation and dynamic rupture on weakly stressed faults sustained by thermal pressurization. Journal of Geophysical Research: Solid Earth, 120(11):7606–7640.
- Shi and Day, (2013) Shi, Z. and Day, S. M. (2013). Rupture dynamics and ground motion from 3-d rough-fault simulations. Journal of Geophysical Research: Solid Earth, 118(3):1122–1141.
- Sibson, (1973) Sibson, R. (1973). Interactions between temperature and pore-fluid pressure during earthquake faulting and a mechanism for partial or total stress relief. Nature Physical Science, 243(126):66–68.
- Sibson, (1980) Sibson, R. (1980). Power dissipation and stress levels on faults in the upper crust. Journal of Geophysical Research: Solid Earth, 85(B11):6239–6247.
- Sibson, (1977) Sibson, R. H. (1977). Kinetic shear resistance, fluid pressures and radiation efficiency during seismic faulting. pure and applied geophysics, 115(1):387–400.
- Suzuki and Yamashita, (2006) Suzuki, T. and Yamashita, T. (2006). Nonlinear thermoporoelastic effects on dynamic earthquake rupture. Journal of Geophysical Research: Solid Earth, 111(B3).
- Ujiie et al., (2010) Ujiie, K., Kameyama, M., and Yamaguchi, A. (2010). Geological record of thermal pressurization and earthquake instability of subduction thrusts. Tectonophysics, 485(1-4):260–268.
- Ulrich et al., (2020) Ulrich, T., Vyas, J., and Gabriel, A. (2020). Scec code verification: A proposed 3d benchmark of thermal pressurization and rate-and-state strong velocity weakening friction. In SCEC/USGS Benchmark Descriptions: TPV105-3D. The SCEC/USGS Spontaneous Rupture Code Verification Project.
- Uphoff et al., (2017) Uphoff, C., Rettenberger, S., Bader, M., Madden, E. H., Ulrich, T., Wollherr, S., and Gabriel, A.-A. (2017). Extreme scale multi-physics simulations of the tsunamigenic 2004 sumatra megathrust earthquake. In Proceedings of the international conference for high performance computing, networking, storage and analysis, pages 1–16.
- Urata et al., (2014) Urata, Y., Hok, S., Fukuyama, E., and Madariaga, R. (2014). The effect of thermal pressurization on dynamic fault branching. Geophysical Journal International, 196(2):1237–1246.
- Viesca and Garagash, (2015) Viesca, R. C. and Garagash, D. I. (2015). Ubiquitous weakening of faults due to thermal pressurization. Nature Geoscience, 8(11):875–879.
- Vyas et al., (2021) Vyas, J. C., Galis, M., and Mai, P. M. (2021). Characterizing seismic scattering in 3d heterogeneous earth by a single parameter. Bulletin of the Seismological Society of America, 111(2):791–800.
- Vyas et al., (2016) Vyas, J. C., Mai, P. M., and Galis, M. (2016). Distance and azimuthal dependence of ground-motion variability for unilateral strike-slip ruptures. Bulletin of the Seismological Society of America, 106(4):1584–1599.
- Vyas et al., (2018) Vyas, J. C., Mai, P. M., Galis, M., Dunham, E. M., and Imperatori, W. (2018). Mach wave properties in the presence of source and medium heterogeneity. Geophysical Journal International, 214(3):2035–2052.
- Weng and Ampuero, (2019) Weng, H. and Ampuero, J.-p. (2019). The dynamics of elongated earthquake ruptures. Journal of Geophysical Research: Solid Earth, 124(8):8584–8610.
- Wibberley, (2002) Wibberley, C. A. (2002). Hydraulic diffusivity of fault gouge zones and implications for thermal pressurization during seismic slip. Earth, planets and space, 54(11):1153–1171.
- Wibberley and Shimamoto, (2005) Wibberley, C. A. and Shimamoto, T. (2005). Earthquake slip weakening and asperities explained by thermal pressurization. Nature, 436(7051):689–692.
- Wollherr et al., (2018) Wollherr, S., Gabriel, A.-A., and Uphoff, C. (2018). Off-fault plasticity in three-dimensional dynamic rupture simulations using a modal discontinuous galerkin method on unstructured meshes: implementation, verification and application. Geophysical Journal International, 214(3):1556–1584.
- Youngs et al., (1995) Youngs, R., Abrahamson, N., Makdisi, F., and Sadigh, K. (1995). Magnitude-dependent variance of peak ground acceleration. Bulletin of the Seismological Society of America, 85(4):1161–1176.
- Zhu et al., (2020) Zhu, W., Allison, K. L., Dunham, E. M., and Yang, Y. (2020). Fault valving and pore pressure evolution in simulations of earthquake sequences and aseismic slip. Nature communications, 11(1):1–11.
Author’s full physical mailing addresses
Dr. Jagdish Chandra Vyas,
Building 1, Level 3, office 3111,
King Abdullah University of Science and Technology (KAUST),
Jeddah, Thuwal, 23955, Saudi Arabia.
Prof. Alice-Agnes Gabriel,
Department of Earth and Environmental Sciences, Room: C 416,
Ludwig-Maximilians-Universität München,
Theresienstr 41,
80333 Munich, Germany.
Dr. Thomas Ulrich,
Department of Earth and Environmental Sciences, Room: C 445,
Ludwig-Maximilians-Universität München,
Theresienstr 41,
80333 Munich, Germany.
Prof. Paul Martin Mai,
Building 1, Level 3, office 3114,
King Abdullah University of Science and Technology (KAUST),
Jeddah, Thuwal, 23955, Saudi Arabia.
Jean Paul Ampuero,
Geoazur Laboratory, Université Côte d’Azur,
250 rue Albert Einstein, Sophia Antipolis, 06560 Valbonne, France.
List of table
| Variable | Notation | Value | |
|---|---|---|---|
| Material Properties | |||
| P-wave velocity | |||
| S-wave velocity | |||
| Density | |||
| Frictional Properties | |||
| Steady state friction coefficient | |||
| Reference slip velocity | |||
| Direct effect parameter | |||
| State evolution effect parameter | |||
| Fully weakened friction coefficient | |||
| Weakening slip velocity | |||
| State evolution distance | |||
| TP Properties | |||
| Thermal diffusivity | |||
| Volumetric heat capacity | |||
| Pore pressure increase per unit temperature | |||
| Hydraulic diffusivity | ( | ||
| ) | |||
| Shear-zone half-width | |||
List of Figures
+
Electronic Supplement
How does thermal pressurization of pore fluids affect earthquake dynamics and ground motions?
This electronic supplement contains temporal evolution of slip rate, total traction, temperature and pressure at different on-fault locations. It also describes effects of hydraulic diffusivity and shear-zone half-width variations on moment magnitude. The details of initial shear stress and rupture nucleation method are also provided here.
Appendix A Initial Conditions
The initial shear stress on the fault is , the effective normal stress is , the initial value of the state variable is and initial fault sliding velocity is (= ).
The initial normal stress and shear stress (in Pa) are given by:
| (A.1) |
| (A.2) |
with = 1000 kg/ the water density and = 9.8 the gravitational acceleration.
The initial value of the state variable is given by:
| (A.3) |
with the reference slip velocity and the direct effect parameter.
Appendix B Nucleation Method
The rupture is nucleated by imposing a horizontal shear traction perturbation that depends on both space and time. The perturbation smoothly grows from zero to its maximum amplitude over a finite time interval and is confined to a finite region of the fault of radius R. Specifically, the perturbation is
| (B.1) |
in which
| (B.2) |
and
| (B.3) |
The perturbation is radially symmetric, with the radial distance away from the hypocenter along the fault given by . The nucleation parameters are given in the table below.
| (, ) |