Axis thermal expansion switching in transition-metal zirconides Zr2 by tuning the ratio
Abstract
This study examines the temperature-dependent evolution of the lattice constants for various CuAl2-type compounds, including NiZr2, (Co,Rh,Ir)Zr2, (Fe,Co,Rh,Ir)Zr2, and (Co,Ni,Cu,Rh,Ir)Zr2, in the pursuit of negative or zero thermal expansion. Results reveal that NiZr2 has positive thermal expansion, while the other compounds exhibit uniaxial negative thermal expansion along the -axis contraction. The study suggests that the -axis thermal expansion can be controlled by manipulating the ratio through -site substitution, providing a design principle for achieving negative thermal expansion of the -axis and potentially zero thermal expansion in a single compound in Zr2 compounds.
Materials possessing zero thermal expansion (ZTE) are important for certain applications, however, the attainment of ZTE materials necessitates the utilization of ultra-precise positive thermal expansion (PTE) and negative thermal expansion (NTE) materials. It is well-known that heat causes thermal expansion in almost all compounds, whereas some exhibit shrinkage upon heating. NTE compounds have been developed based on phase transitions, (such as structuralEvans_2000 ; Amos_2001 , ferroelectricAgrawal_1988 ; Agrawal_1987 , magnetic transitionsSchlosser_1971 ; Nikitin_1991 ), intermetallic charge transfersYamada_2013 ; Nishikubo_2019 , and valence crossoversQiao_2021 ; Azuma_2007 . The significant NTE exhibited by these compounds is often limited to specific temperatures, such as those at the boundary of phase transition or crossover temperature, whereas PTE is observed over a broader range of temperatures. ZrW2O8 has been extensively studied for its isotropic NTE over a broad temperature range, from 0.3 K to 1000 KMartinek_1968 ; Mary_1996 . This isotropic NTE is disscussed to be caused by the vibration of two rigid units, a ZrO6 octahedron and WO4 tetrahedron, referred to as the rigid unit modeGiddy_1993 ; Pryde_1996 ; Ernst_1998 ; Dove_1997 .
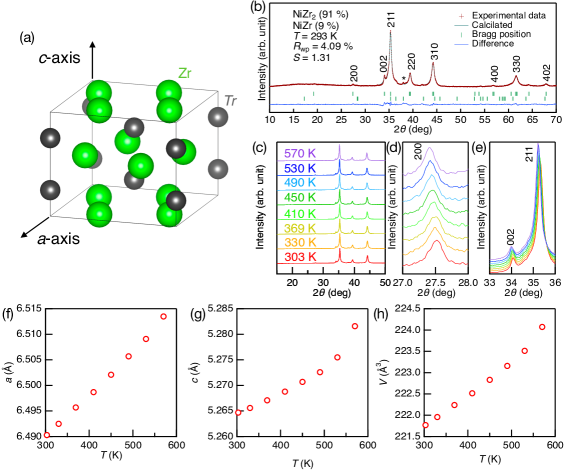
Recently, transition-metal zirconides CoZr2 and alloyed Zr2 (where denotes Fe, Co, Ni, Rh and Ir) have been reported as a new family of NTE compoundsMizugu_2022_1 ; Kasem_2022 . The crystal structure of Zr2 is depicted in Figure 1(a), which is a body-centered tetragonal structure of CuAl2 type, in space group #140. Neutron powder diffraction (NPD) and X-ray diffraction (XRD) at low and high temperatures reveal an anisotropic linear thermal expansion of the - and -axes in CoZr2. In more details, it was observed that heating induces the expansion of the lattice constant (PTE) and contraction of the lattice constant (NTE), across a wide temperature range of 7 K to 573 K. Similar wide temperature range uniaxial linear thermal expansion has been reported for (Fe,Co,Ni)Zr2, (Fe,Co,Ni,Rh,Ir)Zr2, and (Fe,Co,Ni,Cu,Ga)Zr2, which were synthesized based on the concept of high-entropy alloys (HEA). To investigate the temperature-dependent lattice parameters of solid solutions, we selected Zr2 compounds with space group #140 (=Fe, Co, Ni, Rh, and Ir) that have been previously reportedKuzuma_1966 ; Kirkpatrick_1961 ; Havinga_1972 ; Eremenko_1980 . Additionally, we included =Cu, which possesses electrons as these elements. Our experimental analysis involved synthesizing uniaxial NiZr2, (Co,Rh,Ir)Zr2, (Fe,Co,Rh,Ir)Zr2, and (Co,Ni,Cu,Rh,Ir)Zr2 compounds and conducting XRD experiments to explore the temperature dependence of the lattice parameters for the identification of NTE compounds.
The polycrystalline samples of NiZr2, (Co,Rh,Ir)Zr2, (Fe,Co,Rh,Ir)Zr2 and (Co,Ni,Cu,Rh,Ir)Zr2 were synthesized by the arc melting method in an Ar gas atmosphere, on a water-cooled copper hearth. High purity powders of Ni (99.9 %), Co (99 %), Rh (99.9 %), Fe (99.99 %), Cu (99.9 %), and Ir (99.9 %) were pelletized and melted with Zr plates (99.2 %). During arc melting, the ingot was turned over and remelted several times to homogenize the samples. Energy-dispersive X-ray spectroscopy (EDX, SwiftED, Oxford) equipped with a scanning electron microscope (TM3030, Hitachi High-Tech) was used to determine the composition of the samples (Co,Rh,Ir)Zr2, (Fe,Co,Rh,Ir)Zr2 and (Co,Ni,Cu,Rh,Ir)Zr2. The configurational entropy of mixing () at the site was calculated from the composition of the site using the formula , where is the gas constant and is the mole fraction of component . The crystal structure in high temperature was investigated by employing a powder XRD technique using the Cu-K radiation by the - method (Miniflex-600 RIGAKU) equipped with a heating temperature attachment (BTS 500). In this experiment, XRD patterns were analyzed using the Split pseudo-Voigt function of TorayaToraya_1990 . The Rietveld refinement of the XRD data was performed using the RIETAN-FP packageizumi_2007 . A schematic image was obtained by VESTAMomma_2011 .
The approximate composition of the site estimated by EDX for (Co,Rh,Ir)Zr2, (Fe,Co,Rh,Ir)Zr2 and (Co,Ni,Cu,Rh,Ir)Zr2 were Co0.28Rh0.43Ir0.29Zr2, Fe0.25Co0.26Rh0.28Ir0.21Zr2 and Co0.19Ni0.10Cu0.08Rh0.33Ir0.31Zr2, respectively. Using these calculations, the composition of Zr was fixed at 2. In this study, we abbreviated Co0.28Rh0.43Ir0.29Zr2 as (Co,Rh,Ir)Zr2, Fe0.25Co0.26Rh0.28Ir0.21Zr2 as (Fe,Co,Rh,Ir)Zr2 and Co0.19Ni0.10Cu0.08Rh0.32Ir0.31Zr2 as (Co,Ni,Cu,Rh,Ir)Zr2. Entropies of mixing of (Co,Rh,Ir)Zr2, (Fe,Co,Rh,Ir)Zr2 and (Co,Ni,Cu,Rh,Ir)Zr2 were 1.08, 1.42 and 1.50, respectively.
Figure 1(b) illustrates the XRD pattern and Rietveld refinement results for NiZr2 at a temperature of 293 K. The obtained pattern was refined using the CuAl-type (space group: #140) structural model with an impurity phase of NiZr (9%) concentration. The reliability factor was determined to be = 4.1 %, and the goodness-of-fit indicator was calculated as = 1.3. Figure 1(c) depicts the XRD at high temperatures, wherein the profiles at each temperature are similar, thus confirming the absence of structural transition. Figures 1(d) and (e) demonstrate that the 200 peak, indicative of the lattice constant , and the 002 peak, indicative of the lattice constant , respectively, shift to the lower angle side upon warming, indicating an expansion of the lattice constants and . These results indicate the absence of the uniaxial NTE in NiZr2. The Rietveld method was employed to obtain the lattice constants and and volume from the XRD results at each temperature, and their temperature dependence is summarized in Figures 1 (f), (g) and (h). Here, we estimate the linear thermal expansion coefficient (TEC), denoted as , using the formula
| (1) |
In this study, the entire temperature range was approximated as linear and fitted to the results. In CoZr2, linear TEC along - and -axes are and , respectively. These values are consistent with the results reported by Watanabe et al ( , ).watanabe_2022
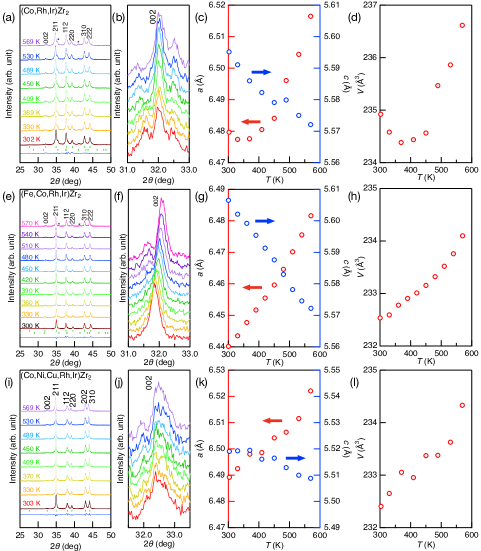
Figure 2 depicts the high-temperature XRD patterns and the temperature dependence of lattice parameters for (Co,Rh,Ir)Zr2, (Fe,Co,Rh,Ir)Zr2 and (Co,Ni,Cu,Rh,Ir)Zr2. In both (Co,Rh,Ir)Zr2 and (Fe,Co,Rh,Ir)Zr2, Zr2 (space group: #227) impurity peaks were observed, in addition to Zr2 (space group: #140), as illustrated in Figs. 2(a) and (e). Only the Rietveld analysis results at room temperature, with corresponding values of 3.37 % and 4.62 %, were shown, as displayed in Figures 2(a) and 2(e). The Rietveld analysis revealed that the impurity content in (Co,Rh,Ir)Zr2 was 7% and 2% in (Fe,Co,Rh,Ir)Zr2. Conversely, no peaks indicative of impurities were detected in (Co,Ni,Cu,Rh,Ir)Zr, as shown in Fig. 2(i), and the in the Rietveld analysis at room temperature was 5.24 %. As depicted in Figures 2(a), (e) and (i), the high-temperature XRD patterns of these materials remained unchanged, indicating the absence of structural changes. The peak of the 002 reflection, which indicates the lattice constant , varied among the different materials, as shown in Figures 2(b), (f) and (j). As shown in Figures 2(b) and (j), the 002 peaks of (Co,Rh,Ir)Zr2 and (Co,Ni,Cu,Rh,Ir)Zr2 exhibited a slight shift towards higher angles as temperature increased, indicating a decrease in the lattice constant upon warming. Notably, the shift of the 002 peak towards the higher angle side with increasing temperature was particularly evident in (Fe,Co,Rh,Ir)Zr2, as depicted in Figure 2(f). As shown Figure 2 (c), the -axis of (Co,Rh,Ir)Zr2 exhibits uniaxial NTE over the entire temperature range measured. Its lattice constant slightly decreases at room temperature and exhibits PTE above 370 K. The minor decrease in the a-axis near room temperature is hypothesized to be due to amorphization, but the underlying cause remains unclear. The temperature dependence of the volume was NTE near room temperature and PTE above 400 K. Given that volumetric NTE has been reported near room temperature for CoZr2, it is likely that the room temperature volumetric NTE of (Co,Rh,Ir)Zr2 is a result of the presence of CoZr2 as depicted by the green closed circle in Figure 3(c)Mizugu_2022_1 . The lattice constants and of the (Fe,Co,Rh,Ir)Zr2 exhibit expansion and contraction, respectively, and the temperature dependence of volume is increased. The temperature dependence of the lattice constants and volume of the (Co,Ni,Cu,Rh,Ir)Zr2 is similar to those of (Fe,Co,Rh,Ir)Zr2, however, the change ration in the lattice constants is less pronounced in comparison to (Fe,Co,Rh,Ir)Zr2.
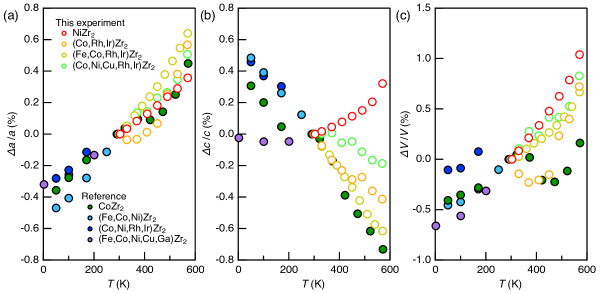
In order to compare the magnitude of change in the lattice constants and volume, Figure 3 illustrates the temperature dependence of the change ratio of lattice constants in the -axis (), -axis () and volume () normalized at room temperature of Zr2 ( = Ni, Co, (Fe,Co,Ni), (Co,Rh,Ir), (Fe,Co,Rh,Ir), (Fe,Co,Ni,Rh,Ir), (Co,Ni,Cu,Rh,Ir), (Fe,Co,Ni,Cu,Ga))Mizugu_2022_1 ; Kasem_2022 . Table 1 summarizes the linear TEC of these materials, calculated using equation (1). As depicted in Figure 3(a), the lattice constants increase for all materials, and the change ratio is comparable across all of them. As shown in Table 1, the linear TEC along the -axis is of the order of +10 . Exceptions include (Co, Rh, Ir), which -axis exhibit contraction near room temperature and a relatively large linear TEC =+30 above 450 K. In contrast, the change ratio of the -axis varies among materials as depicted in Figure 3(b). The -axis of (Fe,Co,Ni,Cu,Ga)Zr2 exhibited almost temperature independence, while that of NiZr2 displayed expansion; other compounds shows -axis contraction. As show in Table 1, the linear TEC along the -axis is smallest for CoZr2 (=-28 above 300 K) and increases in the order of (Fe,Co,Rh,Ir), (Fe,Co,Ni), (Fe,Co,Ni,Rh,Ir), (Co,Rh,Ir), (Co,Ni,Cu,Rh,Ir). As depicted in Figure 3(c), the change ratio in volume increases with increasing temperature, with the exception of =Co, (Co,Rh,Ir) as shown in Figure 3(c). The material with the greatest volumetric change is NiZr2, while the material with the least volumetric change is (Fe,Co,Ni,Rh,Ir)Zr2 . The reason for the lower volumetric change in (Fe,Co,Ni,Rh,Ir)Zr2 is thought to be due to the fact that the absolute value of the linear TEC along the -axis is significantly greater than that of the -axis by 45%, resulting in offsetting expansion in the -axis by contract along the -axis. The absolute value of of (Fe,Co,Rh,Ir)Zr2 is also larger than , but only by about 0.4 %, thus the effect of -axis contract on the volume change is smaller and the volume expansion rate is likely greater. The temperature dependence of the volume of CoZr2 and (Co,Rh,Ir)Zr2 exhibits a similar trend, with the volume decreasing near room temperature and increasing at higher temperatures.
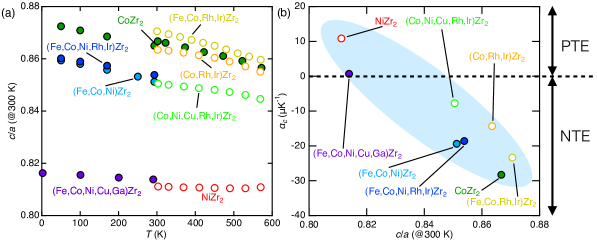
To discuss the effect of uniaxial NTE with the -axis contraction in Zr2 compounds, we demonstrated the temperature dependence of the ratio of the - and -axis lattice constants () for Zr2 ( = Ni, Co, (Fe,Co,Ni), (Co,Rh,Ir), (Fe,Co,Rh,Ir), (Fe,CoNi,Rh,Ir), (Co,Ni,Cu,Rh,Ir), and (Fe,Co,Ni,Cu,Ga)) in Figure 4 (a). In the uniaxial NTE compounds (Co, (Fe,Co,Ni), (Co,Rh,Ir), (Fe,Co,Rh,Ir), (Fe,CoNi,Rh,Ir), and (Co,Ni,Cu,Rh,Ir)), decreases with increasing temperature due to the contraction and expansion of the lattice constants and , respectively. NiZ2 and (Fe,Co,Ni,Cu,Ga)Zr2 showed a smaller change in than other compounds, owing to the expansion of the lattice constant . In addition, room temperature values were found to be larger for uniaxial NTE compounds than for PTE compounds.
In Figure 4(b), we depict the linear TEC along the c-axis as a function of the ratio at room temperature. Figure 4(b) clearly illustrates the relationship between and , with increasing as decreases, and the sign of switching from negative to positive at a threshold of approximately 0.83 by manipulating . During this experiment, the mixing entropy at the sites varied, which may have influenced the temperature dependence of the lattice constant . This experiment does not rule out the possibility that the disparity in at the sites affected the electronic state and resulted in anisotropic thermal expansion. However, we claim that the association between and anisotropic thermal expansion is insignificant, as CoZr2 and NiZr2 with =0 exhibit contrasting thermal expansions, while (Fe,Co,Ni,Rh,Ir)Zr2 (=1.60) and (Co,Ni,Cu,Rh,Ir)Zr2 (=1.50) with relatively high display dissimilar temperature dependencies of the lattice constant . Notably, the anisotropy of thermal expansion is more dependent on the ratio than the type of -site atoms, implying that the -axis thermal expansion can be regulated by flexible substitution of the sites in Zr2.
Materials exhibiting anisotropic thermal expansion over a wide temperature range, with expansion in one axial direction and contraction in another, include hexagonal boron nitride (hBN) and BiB3O6Paszkowicz_2002 ; Tenga_2002 . The linear TECs along the - and -axes of hBN near room temperature are K-1 and K-1, respectively. Anisotropic bonding energy have been proposed as the origin of this phenomenon. Conversely, BiB3O6 has TECs of K-1, K-1, and K-1, and the theoretical origin of its anisotropic thermal expansion has been proposed to be chiral acoustic phonons with elliptical motion of the bismuth atoms, based on first-principles calculationsRomao_2019 . In the future, it is important to investigate the temperature dependencies of the lattice parameters of various Zr2, including HEAs, to unveil the systematic relationship between crystal structure and thermal expansion. To clarify the origin of the anisotropy of thermal expansion of the -axis, it is important to elucidate the local crystal structure by high-resolution XRD and NPD.
In conclusion, we synthesized transition-metal zirconides NiZr2, (Co,Rh,Ir)Zr2, (Fe,Co,Rh,Ir)Zr2, and (Co,Ni,Cu,Rh,Ir)Zr2 with a CuAl2-type structure (space group #140) and analyzed their crystal structures at high temperatures using powder XRD. We observed that while all compounds exhibited PTE in the lattice constant , the temperature dependence of the -axis varied among the compounds. In particular, NiZr2 demonstrated PTE, while NTE was observed for (Co,Rh,Ir)Zr2, (Fe,Co,Rh,Ir)Zr2, and (Co,Ni,Cu,Rh,Ir)Zr2. Our findings indicate that the temperature dependence of the lattice constant is correlated with the ratio of the -axis to the -axis (), and that manipulating through elemental substitution at the site can switch between NTE and PTE. Although the underlying mechanism for this anisotropic lattice structural change remains unclear, this study provides a promising avenue for the development of ZTE compounds.
I acknowledgment
The authors would like to thank Y. Watanabe, M. Fujita and O. Miura for their support in experiments and discussion. This work was partly supported by Grant-in-Aid for Scientific Research (KAKENHI) (Proposal No. 21K18834 and 21H00151) and Tokyo Government Advanced Research (H31-1).
| () | () | Reference | |
| Ni | +13 | +11 | this study |
| +18 (0 K 300 K) | -15 (0 K300 K) | Ref. 17 | |
| Co | +14 (300 K) | -28 (300 K) | |
| (Co,Rh,Ir) | -12 (300 K 370 ) | -14 | this study |
| +30 (450 K) | |||
| (Fe,Co,Ni) | +19 | -19 | Ref. 17 |
| (Fe,Co,Rh,Ir) | +24 | -25 | this study |
| (Co,Ni,Cu,Rh,Ir) | +17 | +7 | this study |
| (Fe,Co,Ni,Rh,Ir) | +11 | -16 | Ref. 17 |
| (Fe,Co,Ni,Cu,Ga) | +11 | +0.7 | Ref. 18 |
References
- (1) J. S. O. Evanse and T. A. Mary, Int. J. Inorg. Chem., 2, 143 (2000).
- (2) T. G. Amos and A. W. Sleight, J. Solid State Chem., 160, 230 (2001).
- (3) D. K. Agrawal, R. Roy and H. A. McKinstry, Mater. Res. Bull., 22, 83 (1987)
- (4) D. K. Agrawal and A. Halliyal and J. Belsick, Mater. Res. Bull., 23, 159 (1988)
- (5) W. F. Schlosser, G. M. Graham and P.P.M. Meincke, J. Phys. Chem. Solids., 32, 927 (1971)
- (6) S. A. Nikitin, A. M. Tishin, M. D. Kuz’min and Y. I. Spichkin, Phys. Lett. A., 153, 155 (1991)
- (7) I. Yamada, K. Shiro, K. Oka, M. Azuma and T. Irifune, J. Ceram. Soc. Jpn., 121, 912 (2013)
- (8) T. Nishikubo, Y. Sakai, K. Oka, T. Watanuki, A. Machida, M. Mizukami, K. Maebayashi, T. Imai, T. Ogata, K. Yokoyama, Y. Okimoto, S. Koshihara, H. Hojo, T. Mizokawa and M. Azuma, J. Am. Chem. Soc., 141, 19397 (2019)
- (9) Y. Qiao, Y. Song, A. Sanson, L. Fan, Q. Sun, S. Hu, L. He, H. Zhang, X. Xing and J. Chen, npj Quantum Mater., 6, 49 (2021)
- (10) M. Azuma, S. Carlsson, J. Rodgers, M. G. Tucker, M. Tsujimoto, S. Ishiwata, S. Isoda, Y. Shimakawa, M. Takano and J. P. Attfield, J. Am. Chem. Soc., 129, 14433 (2007)
- (11) C. Martinek and F. A. Hummel, J. Am. Ceram. Soc., 51, 227 (1968)
- (12) T. A. Mary, J. S. O. Evans, T. Vogt and A. W. Sleight, Science, 272, 90 (1996)
- (13) A. P. Giddy, M. T. Dove, G. S. Pawley and V. Heine, Acta. Crystallogr. A., 49, 697 (1993)
- (14) A. K. A. Pryde, K. D. Hammonds, M. T. Dove, V. Heine, J. D. Gale and M. C. Warren, J. Condens. Matter Phys., 8, 10973 (1996)
- (15) G. Ernst, C. Broholm, G. R. Kowach, A. P. Ramirez, Nature, 396, 147 (1998)
- (16) M. T. Dove, Am. Mineralogist., 82, 213 (1997)
- (17) Y. Mizuguchi, M. R. Kasem and Y. Ikeda, J. Phys. Soc. Jpn., 91, 103601 (2022)
- (18) M. R. Kasem, H. Arima, Y. Ikeda, A. Yamashita and Y. Mizuguchi, J. Phys. Mater., 5 045001 (2022)
- (19) T. B. Kuz’ma, V. Y. Markiv, Y. V. Voroshilov, and R. V. Skolozdra, Inorg. Mater., 2, 222, (1966)
- (20) M. E. Kirkpatrick, and W. L. Larsen, Trans. Am. Soc. Met., 54, 580 (1961)
- (21) E.E. Havinga, H. Damsma, and P. Hokkeling, J. Less-Common Met., 27, 169 (1972)
- (22) V. N. Eremenko, E. L. Semenova, and T. D. Shtepa, Russ. Metall., 5, 210, (1980)
- (23) H. Toraya, J. Appl. Crystallogr., 23, 485, (1990)
- (24) F. Izumi and K. Momma, Solid State Phenom., 130, 15 (2007)
- (25) K. Momma and F. Izumi, J. Appl. Crystallogr., 44, 1272 (2011)
- (26) Y. Watanabe, H. Arima, H. Usui, and Y. Mizuguchi, Sci. Rep., 13, 1008, (2022)
- (27) W. Paszkowicz, J.B. Pelka, M. Knapp, T. Szyszko, and S. Podsiadlo, Appl. Phys. A., 75, 431, (2002)
- (28) B. Tenga, Z. Wang, H. Jiang, X. Cheng, H. Liu, X. Hu, S. Dong, J. Wang, and Z. Shao, J. Appl. Phys., 91, 3618, (2002)
- (29) C. P. Romao, Phys. Rev. B., 100, 060302, (2019)