The MillenniumTNG Project: The large-scale clustering of galaxies
Abstract
Modern redshift surveys are tasked with mapping out the galaxy distribution over enormous distance scales. Existing hydrodynamical simulations, however, do not reach the volumes needed to match upcoming surveys. We present results for the clustering of galaxies using a new, large volume hydrodynamical simulation as part of the MillenniumTNG (MTNG) project. With a computational volume that is times larger than the next largest such simulation currently available, we show that MTNG is able to accurately reproduce the observed clustering of galaxies as a function of stellar mass. When separated by colour, there are some discrepancies with respect to the observed population, which can be attributed to the quenching of satellite galaxies in our model. We combine MTNG galaxies with those generated using a semi-analytic model to emulate the sample selection of luminous red galaxies (LRGs) and emission line galaxies (ELGs), and show that although the bias of these populations is approximately (but not exactly) constant on scales larger than Mpc, there is significant scale-dependent bias on smaller scales. The amplitude of this effect varies between the two galaxy types, and also between the semi-analytic model and MTNG. We show that this is related to the distribution of haloes hosting LRGs and ELGs. Using mock SDSS-like catalogues generated on MTNG lightcones, we demonstrate the existence of prominent baryonic acoustic features in the large-scale galaxy clustering. We also demonstrate the presence of realistic redshift space distortions in our mocks, finding excellent agreement with the multipoles of the redshift-space clustering measured in SDSS data.
keywords:
cosmology: theory – (cosmology): large-scale structure of the Universe – galaxies: haloes – methods: numerical1 Introduction
The Cold Dark Matter (CDM) model is, at present, our best model for the formation of the large-scale structure of the Universe. A major reason for its popularity is its predictive power: most notably, the distribution of galaxies throughout the cosmos, the morphology of which reveals a rich network of structures in the form of filaments, nodes, walls, and voids – the so-called “cosmic web” (Geller & Huchra, 1989). The development of this model has been complemented by an equally active programme of galaxy redshift surveys; the impressive agreement – both qualitative and quantitative – between the results of these surveys and the CDM model has helped elevate it to its status as the concordance model for cosmology (e.g. Colless et al., 2001; Tegmark et al., 2004; Zehavi et al., 2005; Eisenstein et al., 2005; Cole et al., 2005).
With this being said, it is important to clarify that the CDM model does not predict the clustering of the galaxy field directly. Instead, it provides a framework for predicting the density field of the dark matter following epochs of gravitational instability, settling eventually into dark matter “haloes” that ultimately act as the sites of galaxy formation. As haloes form preferentially in locations where the initial density fluctuations were large, they are considered to be biased tracers of the underlying density field (Mo et al., 1999; Sheth & Tormen, 1999; Gao et al., 2005; Gao & White, 2007; Wechsler et al., 2006). Furthermore, galaxies are thought to be biased tracers of dark matter haloes, adding yet another layer of complexity on top (see Desjacques et al., 2018, for a review of “galaxy bias”). If we are to ultimately use the observed galaxy field to constrain our cosmological model with high precision, it necessitates the development of a robust and consistent framework for establishing the mapping between the dark and luminous matter in our Universe.
There are a number of different approaches to modelling the galaxy-halo connection theoretically (see, e.g., Wechsler & Tinker, 2018, for a review). The simplest of these involve the statistical assignment of galaxies to haloes, the most prominent of which include abundance matching (e.g. Mo et al., 1999; Kravtsov et al., 2004; Tasitsiomi et al., 2004; Vale & Ostriker, 2004; Behroozi et al., 2010; Reddick et al., 2013), empirical models (e.g. Conroy & Wechsler, 2009; Behroozi et al., 2013; Moster et al., 2013; Rodríguez-Puebla et al., 2016; Tacchella et al., 2018; Behroozi et al., 2019) and Halo Occupation Distributions (HODs, Peacock & Smith, 2000; Benson et al., 2000; Berlind & Weinberg, 2002; Zheng et al., 2005). Each of these methods makes an assumption regarding salient features of dark matter haloes that dictate the abundance and the properties of the galaxies that eventually reside within them. A more sophisticated approach is enabled by semi-analytic models of galaxy formation, in which an attempt is made to model the physical processes determining the formation and evolution of galaxies using sets of differential equations that can be applied to halo or subhalo merger trees either created by a stochastic model or obtained directly from collisionless simulations (e.g. Kauffmann et al., 1993; Somerville & Primack, 1999; Kauffmann et al., 1999; Cole et al., 2000; Springel et al., 2001; Croton et al., 2006; Benson, 2012; Henriques et al., 2015; Lagos et al., 2018).
Undoubtedly, the most accurate route towards self-consistent modelling of galaxy formation is offered by cosmological, hydrodynamical simulations. It is only recently that our computational methods have improved to the point where hydrodynamical simulations are possible both with the high resolution needed to resolve the physical processes relevant to galaxies, and with the large volumes necessary to generate large statistical samples of simulated galaxies. In the last decade or so, several such simulations have been performed and been shown to reproduce the observable properties of galaxies with reasonable accuracy. These include projects like OWLS (Schaye et al., 2010), Illustris (Vogelsberger et al., 2014b, a; Genel et al., 2014), EAGLE (Schaye et al., 2015), MassiveBlack-II (Khandai et al., 2015), SIMBA (Davé et al., 2016), Magneticum (Dolag et al., 2016), Horizon-AGN (Dubois et al., 2016), BAHAMAS (McCarthy et al., 2017), IllustrisTNG (Pillepich et al., 2018a), ASTRID (Bird et al., 2022; Ni et al., 2022), and THESAN (Kannan et al., 2022b). We refer the reader to the review by Vogelsberger et al. (2020), which provides a comprehensive review of the latest developments in this subject. Despite the advancement of this field, however, even the largest of the simulations that has been run so far – TNG-300 – is only able to resolve galaxies within a periodic box of volume – a far cry from the kinds of survey volumes that will be mapped with ongoing and future galaxy redshift surveys.
It is the advent of these new redshift surveys that motivates the present endeavour. Ongoing surveys like DESI (Levi et al., 2013) and future missions like Euclid (Laureijs et al., 2011) and the Roman Space Telescope (Spergel et al., 2015) will eventually the map the large-scale structure out to several tens of Gpc3. A primary target for these missions is to produce the most precise measurement of the baryonic acoustic oscillation (BAO) scale, a standard distance ruler that provides one of the cleanest measurements of the expansion rate of the Universe. This feature, imprinted in the galaxy distribution on a scale of Mpc is already at the edge of what has thus far been achievable in existing cosmological hydrodynamical simulations. Realising the full potential of these surveys therefore demands new generations of simulations that are able to keep pace with the ever-increasing volume of galaxy redshift surveys.
In this paper, we present predictions for the clustering properties of galaxies in a new set of large volume, cosmological hydrodynamical simulations, named the MillenniumTNG (or MTNG) project. As suggested by the name, the flagship simulation of this suite is one that integrates the IllustrisTNG model of galaxy formation in the 740 Mpc periodic box of the iconic Millennium simulation (Springel et al., 2005), updated to use the latest constraints on the cosmological parameters. The result is a galaxy population evolved within a volume that is nearly 15 times larger than TNG-300, with only a modest compromise in resolution. In addition to this run, we have also performed a series of dark matter-only simulations within the same volume (including a pair of runs designed to suppress cosmic variance), simulations that assess the impact of massive neutrinos with varying mass, as well as a substantially larger dark matter-only run, also including neutrinos, comprising more than 1 trillion particles in a box of size 3 Gpc. The dark matter-only members of the MTNG suite have been designed to be augmented with semi-analytic galaxies, allowing the generation of mock galaxy catalogues, both in snapshots and on the past lightcone, distributed over length scales relevant to upcoming surveys.
The layout of this paper is as follows. We introduce the MillenniumTNG simulation suite, describing the full physics and dark matter-only runs in Section 2. Our main results are presented in Section 3 where, amongst other quantities, we consider the clustering properties of full physics and semi-analytic galaxies selected by stellar mass, colour, their appearance in DESI-like sample selections, and their redshift-space clustering on lightcone mocks. Finally, Section 4 provides a summary and discussion of the results presented in this paper.
2 The Millennium-TNG simulations
In this section, we briefly describe the main features of the MillenniumTNG simulation suite, focussing on the set of runs considered in this work in particular (Section 2.1). We then describe the L-Galaxies model that has been used so far to generate semi-analytic galaxy catalogues in the subset of simulations in the series that have been run with dark matter-only (Section 2.2). The resulting galaxy catalogue is used as a complementary data set to the galaxies produced in the MTNG full physics run.
2.1 An introduction to the simulation suite
The MillenniumTNG (MTNG) project comprises of a large suite of cosmological dark matter-only and hydrodynamical simulations of structure formation. The flagship simulation of the hydrodynamic series, which we hereafter refer to as MTNG740, is a cubic periodic box of size 740 Mpc on a side, and follows the co-evolution of 43203 dark matter particles (resulting in an effective particle mass of ) and 43203 gas cells, each with an initial mass of . The gravitational softening lengths for the dark matter and gas components, respectively, are set to 3.7 kpc and 370 pc (as the minimum value). The physics model in MTNG740 is based on the IllustrisTNG (TNG, Pillepich et al., 2018b; Springel et al., 2018; Marinacci et al., 2018; Nelson et al., 2018; Naiman et al., 2018) galaxy formation model (Weinberger et al., 2017; Pillepich et al., 2018a, 2019; Nelson et al., 2019a, b), which has been shown to reproduce reasonably realistic galaxy populations across cosmic time. One notable difference with respect to TNG is that we do not simulate the effect of magnetic fields or track individual metal species in MTNG740, which is a choice made to conserve memory. The former, in particular, is not expected to have any significant outcomes on the properties of galaxies (see, e.g., Pakmor et al., 2017).
In addition to the MTNG740 full physics simulation, we also consider in this paper a series of dark matter-only volumes which we use as the basis for constructing semi-analytic galaxy catalogues using the L-Galaxies model (described in Section 2.2). In particular, we consider two 740 Mpc volumes with 43203 dark matter particles, labelled MTNG740-4320-A/B. The ‘A’ and ‘B’ denominations refer to the fact that the two boxes have been generated using ‘fixed’ and ‘paired’ initial conditions based on the variance suppression technique of Angulo & Pontzen (2016). In short, the two realisations, ‘A’ and ‘B’, have been generated by first ‘fixing’ the initial Fourier mode amplitudes to the ensemble average power spectrum, and ‘pairing’ them such that the initial modes are exactly out of phase. The net effect of this is to reduce the variance arising from the sparse sampling of wavemodes in any individual cosmological simulation, and to boost the statistical precision of the combined set by factors of (e.g., Chuang et al., 2019; Ding et al., 2022). Initial conditions for the MTNG740 full physics simulation correspond to the ‘A’ series. We also consider a second set of paired simulations, labelled MTNG740-2160-A/B, which has 8 times poorer mass resolution than MTNG740-4320-A/B. This set is used to study the clustering of semi-analytic galaxies on the lightcone, which will be our focus in Section 3.4.
In all the simulations used in this work, we adopt cosmological parameters given by Planck Collaboration et al. (2016): (total matter density), (baryon density), (dark energy density), kms-1Mpc-1 (Hubble parameter) and (linear rms density fluctuation in a sphere of radius 8 Mpc at ). These are identical to those adopted in TNG in order to aid comparison. Initial conditions are generated at using second-order Lagrangian perturbation theory based on a modern version of the NgenIC code (Springel et al., 2005).
The dark matter-only simulations in this project have been run using a modified version of the publicly-available Gadget-4 code (Springel et al., 2021), while all full physics simulations have been performed using the Arepo code (Springel, 2010; Weinberger et al., 2020). In order to streamline data processing, we have opted to perform common tasks like halo and substructure finding, merger tree construction, lightcone creation, and the computation of matter power spectra on-the-fly. In particular, halo finding starts by defining groups using a friends-of-friends algorithm, while hierarchical bound structures within these groups are identified using the subfind-hbt algorithm (Springel et al., 2021). In what follows, ‘galaxies’ are defined as collections of stars that exist within bound structures identified by subfind-hbt. We have generated a series of halo-, galaxy-, and particle-based lightcones in a variety of geometries; for further details, we refer the reader to the paper by Hernández-Aguayo et al. (2022).
The present paper represents one of an initial series of publications associated with the MTNG project. Companion papers in this series include that by Hernández-Aguayo et al. (2022), which provides a detailed introduction to the project as a whole, including all data products such as group catalogues, merger trees, and lightcones, and an analysis of the dark matter and halo clustering statistics. Pakmor et al. (2022) introduces the full physics MTNG simulations, with a particular focus on the scaling relations of rich galaxy clusters. The latest version of the L-Galaxies semi-analytic model, and its application to the lightcone outputs in MTNG are presented in Barrera et al. (2022). In Hadzhiyska et al. (2022a, b), we test and improve upon standard HOD prescriptions of the galaxy-halo connection based on measurements of the galaxy population in MTNG, while in Contreras et al. (2022) we introduce a powerful inference methodology that is capable of constraining the cosmological parameters of MTNG from galaxy clustering. Delgado et al. (2022a) presents a comprehensive study of the intrinsic alignments of elliptical and spiral galaxies, and the correlation of galaxy shapes with their large-scale environment. Furlito et al. (2022) examines the weak gravitational lensing signal predicted in our dark matter-only and full physics runs. Finally, in Kannan et al. (2022a), we investigate the properties of very high redshift galaxies () and consider the predictions of our model against recent observations made by the James Webb Space Telescope.
2.2 The L-Galaxies semi-analytic model
The L-Galaxies semi-analytic model (Springel et al., 2001; Springel et al., 2005; Croton et al., 2006; Guo et al., 2011; Yates et al., 2013; Henriques et al., 2015, 2020; Ayromlou et al., 2021) is used to generate synthetic galaxy populations within dark matter-only simulations in post-processing. This is achieved through a set of coupled differential equations used to capture the galaxy formation process, and is applied to dark matter halo merger trees constructed from MTNG740-2160/4320-A/B simulations. The L-Galaxies model includes prescriptions that account for gas cooling and star formation in haloes, as well as a variety of feedback modes including those from supernovae and black holes. The model is able to also account for ejection and recycling of gas from haloes, as well as the formation and evolution of metals, broad-band line luminosities etc. Galaxy catalogues generated with L-Galaxies, therefore, act as a perfect foil for comparisons to the full physics MTNG simulations, particularly those that have been run with comparable box size and mass resolution. We explore this in more detail in Sections 3.2–3.4.
The particular version of L-Galaxies used in this paper is taken, together with the free parameters embedded in its physics modules, from Henriques et al. (2015). The parameters were calibrated so as to reproduce the abundance and specific star formation rate of observed galaxies as a function of stellar mass over the redshift range . The clustering and the gas content of galaxies were not used as constraints and so provide a direct test of the model. (For further details, we refer the reader to the companion paper by Barrera et al. 2022).
3 Results
In this section, we will present the main results of our work. As the flagship hydrodynamics simulation in our suite, we will begin by considering the clustering properties of galaxies selected by stellar mass and colour in the MTNG740 full physics simulation (Section 3.1). Next we turn our focus to the same statistics measured in L-Galaxies catalogues generated for the MTNG740-4320-A/B boxes (Section 3.2). We then consider these two sets of galaxies together and select DESI-like samples from each and consider their clustering (Section 3.3). Finally, we will conclude by considering the redshift-space clustering of L-Galaxies mock catalogues generated on the MTNG lightcone outputs (Section 3.4).
3.1 The clustering properties of galaxies in MTNG740
In order to characterise the clustering properties of galaxies in our simulations, we measure the two-point correlation function in real-space, , defined as:
| (1) |
where and , respectively, are the number of data-data and random-random pairs separated by some distance . The full 3D distance, , may be decomposed into a (transverse) projected separation, , and a component along the line-of-sight, , such that . In observations, the more readily measured quantity is instead the projected two-point correlation function, , which is simply the integral of along the line-of-sight:
| (2) |
We set Mpc throughout and use the Corrfunc code (Sinha & Garrison, 2017) to compute the correlation function given a set of galaxies.
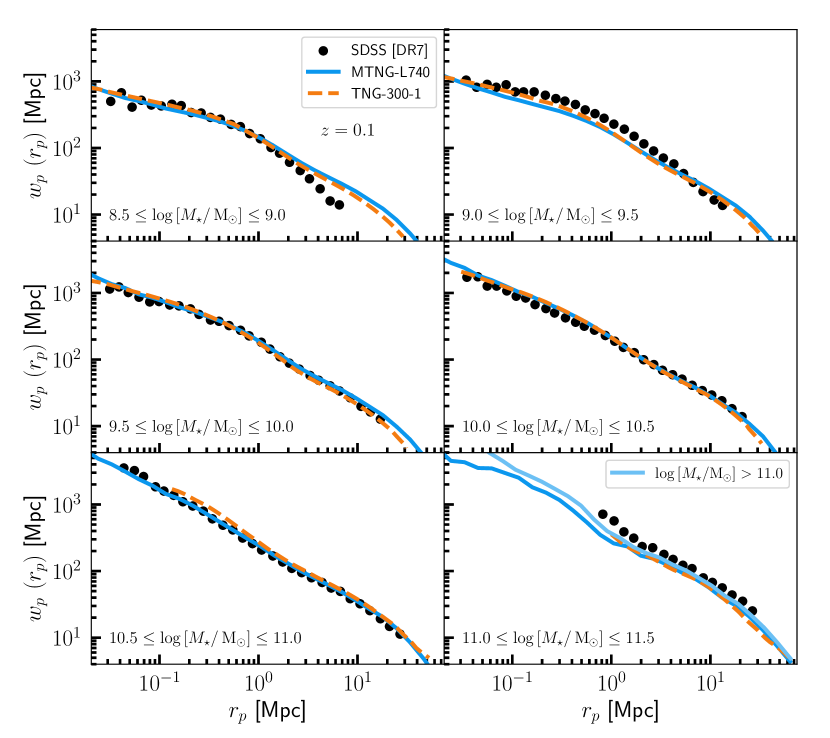
In Figure 1, we show the projected correlation function, , measured from MTNG740 galaxies at selected by stellar mass. Each panel considers the clustering of galaxies with increasing stellar mass, ranging from in the top-left panel, to in the bottom-right. The results from MTNG740 are shown in blue. The black circles show the clustering measured observationally in the SDSS data as compiled by Guo et al. (2011). Finally, the dashed orange curve shows the projected clustering measured in the TNG300-1 simulation, where the baryonic mass resolution is roughly a factor of two better than in MTNG740.
A first conclusion from this figure is the generally good level of agreement between the observational data and the two sets of hydrodynamical simulations. This is especially noticeable in the intermediate mass ranges (). This is consistent with the conclusions of Springel et al. (2018) who quantified the clustering in IllustrisTNG (the orange curves in Figure 1 coincide with their results). While the agreement is, in general, quite good, there are regions where the observed clustering is not reproduced as well. For example, both MTNG740 and TNG-300-1 overpredict the two-halo clustering for galaxies in the range on scales Mpc. An even bigger discrepancy is observed in the largest mass bin, where now MTNG740 and TNG-300-1 underpredict the clustering strength observed in the SDSS data. Cosmic variance or finite box size effects are unlikely to be the solution here, as moving from TNG-300-1 to the larger volume in MTNG740 makes no real difference on large scales. One source of systematic error could be in the details of how the stellar mass of the most massive galaxies are compared between observed and simulated samples. As a simple test of this, we use the light blue curve in the last panel to show the clustering of galaxies with to allow a more generous mass range for the largest galaxies in MTNG740. This slightly enhances the clustering prediction, bringing it closer to the data, but only marginally so. We leave a detailed investigation of the clustering of the most massive galaxies to future work.
It is reassuring to see that despite the lower baryonic mass resolution in MTNG740, the projected galaxy clustering is no worse than in TNG-300-1. In other words, the projected clustering by stellar mass is converged at the resolution of MTNG740. The real statistical power of MTNG740 is seen in the bottom two panels of Figure 1 which shows that we are able to make concrete predictions for the one-halo clustering of galaxies more massive than , which is statistically limited in TNG-300-1.
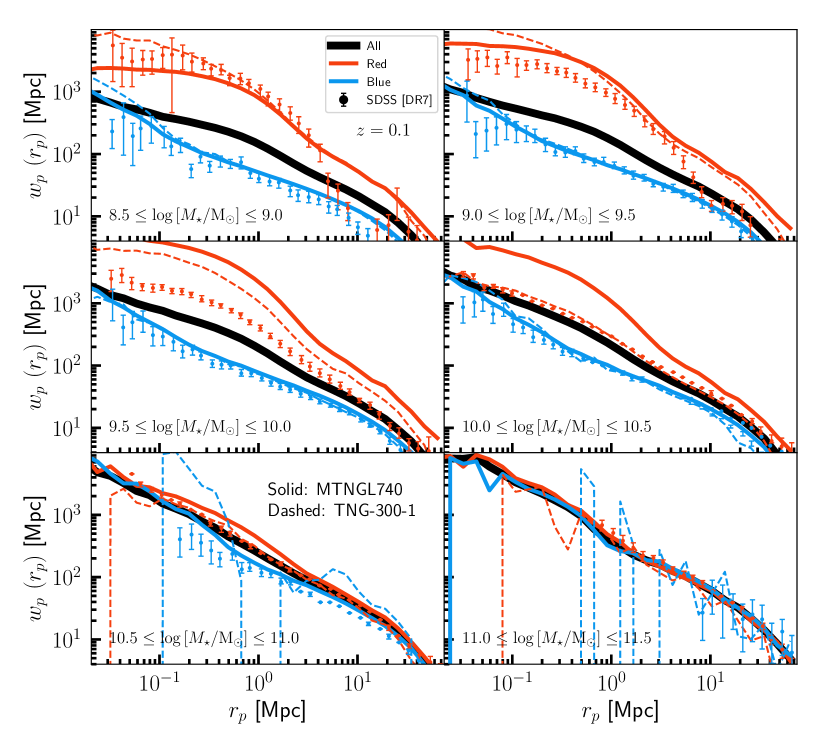
A stronger test for any galaxy formation model is to predict the clustering of galaxies at fixed stellar mass, separated according to their star forming state. In Figure 2, we once more consider the projected clustering of galaxies selected by stellar mass in MTNG740 (again at ) but now galaxies in each mass bin have been segregated into ‘blue’ and ‘red’ galaxies based on their colour. To define the threshold demarcating red and blue populations, we follow Springel et al. (2018) and employ a mass-dependent colour cut:
| (3) |
Figure 2 contrasts the predictions of MTNG740 (solid lines) and those from TNG-300-1 (dashed lines) with data from SDSS (points). The black curves show the clustering of all MTNG740 in each mass range. Qualitatively, our simulations are able to recover the expected trend where red galaxies are clustered more strongly than blue galaxies. In detail, however, we note interesting differences between the observed data and the predictions of the full physics simulations. While the clustering of blue galaxies is generally reproduced well in all mass bins, the clustering of red galaxies is much stronger in MTNG740 and TNG-300-1 compared to what is observed in the data. The discrepancy is especially pronounced in the intermediate mass range (), where TNG-300-1 does a slightly better job than MTNG740. This is an arena where the better baryonic mass resolution in TNG-300-1 might result in bluer, star-forming galaxies compared to MTNG740 which displays a much higher fraction of quenched galaxies (particularly satellites). The overly strong one-halo term is an indication that too large a fraction of the red galaxies in those mass ranges are satellite galaxies in massive haloes, rather than centrals or satellites in lower mass systems. In particular, it may be the case that at the resolution of TNG-300-1 and MTNG740, ram pressure stripping may be too efficient.
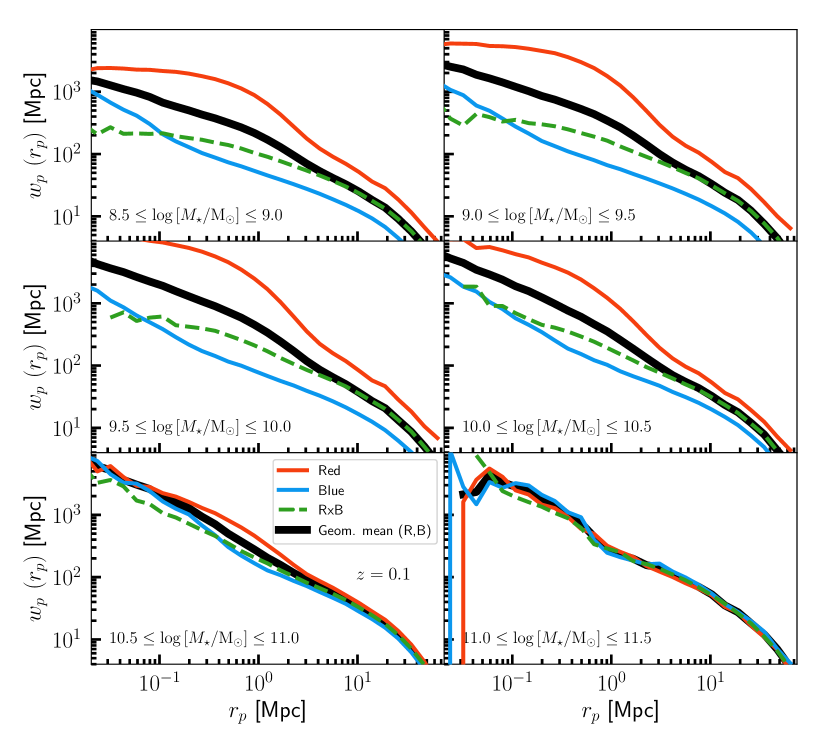
We examine the relative clustering of red and blue populations further in Figure 3, which reproduces the MTNG740 curves from Figure 2, but also includes the cross-correlation of red and blue galaxies in each mass bin (shown in green). The thick black curve now shows the geometric mean of the red and blue galaxy auto-correlation functions. The cross-correlation function encodes the mixing of red and blue galaxy populations within haloes; its deviation from the geometric mean of the individual auto-correlations suggests a segregation of these populations from one another (see, e.g., Zehavi et al., 2011). Figure 3 shows that while the cross-correlation overlaps with the geometric mean on large scales ( Mpc), it is suppressed relative to the latter inside haloes. This suggests some evidence of segregation between red and blue populations within massive haloes – which is not unexpected given that the satellites of massive haloes are expected to be predominantly red rather than blue.
It is also interesting to note that the cross-correlation is nearly flat for Mpc in the two lowest mass bins. The absence of a contribution to the one-halo term may suggest an absence of any mixing between these populations: perhaps indicating the existence of entirely ‘red’ or ‘blue’ haloes. On the other hand, the cross-correlation tracks the geometric mean down to kpc in the two most massive bins; this is also consistent with measurements in the data (see, e.g., Zehavi et al., 2005). Slight deviations are noticeable on smaller scales, but as the number of galaxy pairs decreases on separations this small, the correlation function also becomes more noisy.
3.2 The clustering properties in the L-Galaxies catalogue
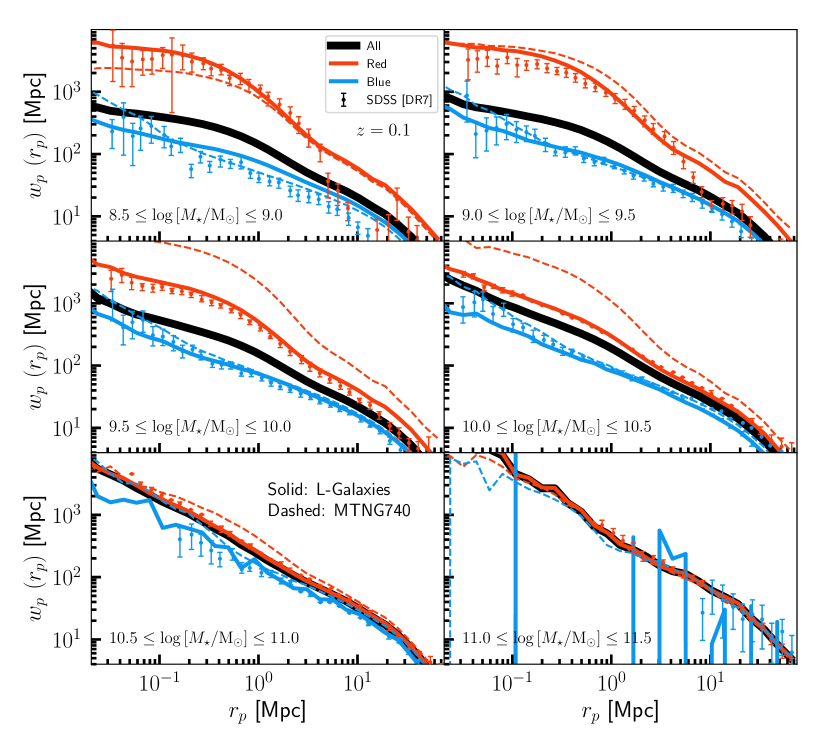
Having established some of the basic clustering properties of galaxies in the MTNG740 full physics simulation, we now turn our attention to the performance of the L-Galaxies semi-analytic model. Figure 4 is identical to Figure 2, except now we contrast the predictions of the MTNG740 full physics simulation (dashed lines) with the L-Galaxies catalogue generated from the MTNG740-4320-A dark matter-only box (solid lines). We consider only the ‘A’ realisation here as it encodes the same phase information as the MTNG740 full physics run, thereby easing comparison between the two sets of galaxy catalogues. We use the same threshold (Equation 3) for determining stellar mass-dependent colour cuts in L-Galaxies, where we have also corrected galaxy colours for extinction using the standard dust prescription in the model.
Figure 4 shows that while the projected clustering of blue galaxies is reproduced equally well in L-Galaxies, the model also does a better job of predicting the correct clustering for red galaxies, particularly in the regime where MTNG740 showed large discrepancies with respect to the data. We caution here, however, that these results do not imply that the L-Galaxies semi-analytic model is somehow a ‘better’ or ‘more realistic’ model of galaxy formation than the full physics implementation in MTNG. For instance, we know that at least part of the discrepancy in MTNG stems from numerical resolution as the more well-resolved TNG-300-1 does a better job at reproducing the colour-dependent clustering. Instead, the results show how choices made in each model result in differences in how blue and red galaxies of a given stellar mass populate dark matter haloes (i.e., resulting in different colour-dependent HODs) in L-Galaxies as compared to MTNG740.
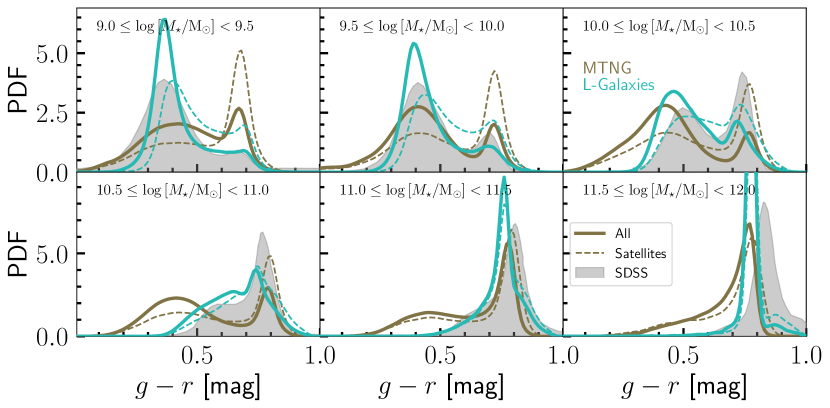
We can examine the origin for the differences in the colour-dependent clustering between MTNG740 and L-Galaxies by considering the detailed distribution of galaxy colours as a function of stellar mass and satellite/central status. Figure 5 shows one-dimensional kernel density weighted PDFs of galaxy colours at for objects identified in MTNG740 (olive curves) and L-Galaxies (teal curves); these are contrasted against data from SDSS shown using the grey histograms. Satellite galaxies in MTNG740 and L-Galaxies are represented by dashed curves. We find that the simulated galaxy populations as a whole (i.e. the solid curves) show reasonable qualitative agreement with the observed galaxy population, and exhibit the expected colour bimodality for galaxies with . Above this mass we find mostly quiescent populations, signified by the predominance of the red galaxy tail.
In Figure 4, we found that galaxies in the mass range show the largest difference in clustering between MTNG740 and L-Galaxies – particularly for red galaxies. Focussing on this mass range in Figure 5 (first three panels), we see interesting differences in the colours of objects in MTNG740 and L-Galaxies. In particular, MTNG740 shows a prominent excess of red satellites (with respect to L-Galaxies). This excess abundance of red satellites in this mass range is likely what contributes to the excess clustering at Mpc seen in Figure 4. We also note some additional differences in the three most massive bins where, in particular, MTNG740 exhibits an extended blue tail, which is not seen in either L-Galaxies or SDSS galaxies. This may be remedied, at least partially, by accounting for extinction by dust, which we have not done for MTNG740. The paucity of blue galaxies in the mass range results in the rather noisy clustering measurements in this mass range (bottom right panel in Figure 4). Finally, although not shown here, we have checked that the red-blue galaxy cross-correlation in L-Galaxies tracks the geometric mean of their individual auto-correlations to smaller scales than in MTNG740.
3.3 The clustering properties of DESI-like samples in MTNG740 and L-Galaxies
An important application of the MTNG suite of simulations is to make predictions for ongoing and future galaxy redshift surveys; this is the focus of the present section. In particular, we consider populations of simulated galaxies that are representative of Luminous Red Galaxies (LRGs) and Emission Line Galaxies (ELGs) as will be targeted by the DESI survey. LRG-like galaxies identify massive, mostly quiescent galaxies hosted in group- and cluster-mass haloes (). The ELG sample targets highly star forming galaxies characterised by strong emission lines in their spectra which signifies the presence of young stars; these are typically found within less massive hosts than their LRG counterparts (). There has been significant recent interest in the relationship between ELG/LRG populations and their host haloes; for more details, we refer the reader to works by Geach et al. (2012); Gonzalez-Perez et al. (2018); Hadzhiyska et al. (2021); Hernández-Aguayo et al. (2021); Jiménez et al. (2021); Yuan et al. (2022); Delgado et al. (2022b); Osato & Okumura (2022).
In the present analysis, we focus mainly on ELG-like and LRG-like populations at , comparable to the redshift at which the DESI ELG sample peaks in number density. We generate these samples with a target number density of which, at , is comparable to the target number density of ELGs in eBOSS (Raichoor et al., 2017) and DESI (DESI Collaboration et al., 2016), as follows:
-
•
ELGs: we select galaxies with minimum stellar mass of and minimum specific star formation rate (sSFR) in MTNG740 and L-Galaxies, respectively (in order to attain the same number density, slightly different thresholds are required for the two different galaxy formation models).
-
•
LRGs: we rank order galaxies in descending order of stellar mass and select the first N galaxies so as to reporduce the observed number density. This results in a minimum galaxy mass of in MTNG740 and in L-Galaxies. We also impose a maximum sSFR cut equal to the minimum sSFR threshold for the ELG populations in order to guarantee that we include only massive quiescent galaxies (see also Hadzhiyska et al., 2022a, b).
We note that the selection criteria described above identify ELG-like and LRG-like galaxies only approximately. In particular, we do not attempt to forward model photometry for MTNG galaxies into DESI photometric bands, where, for example, W1 luminosities and magnitudes are used to identify LRGs in the survey. We leave a full treatment of this kind to a future investigation. Instead, the cuts used in this paper are based on criteria identified by Hadzhiyska et al. (2021) after forward modelling galaxy SEDs in TNG-300-1.
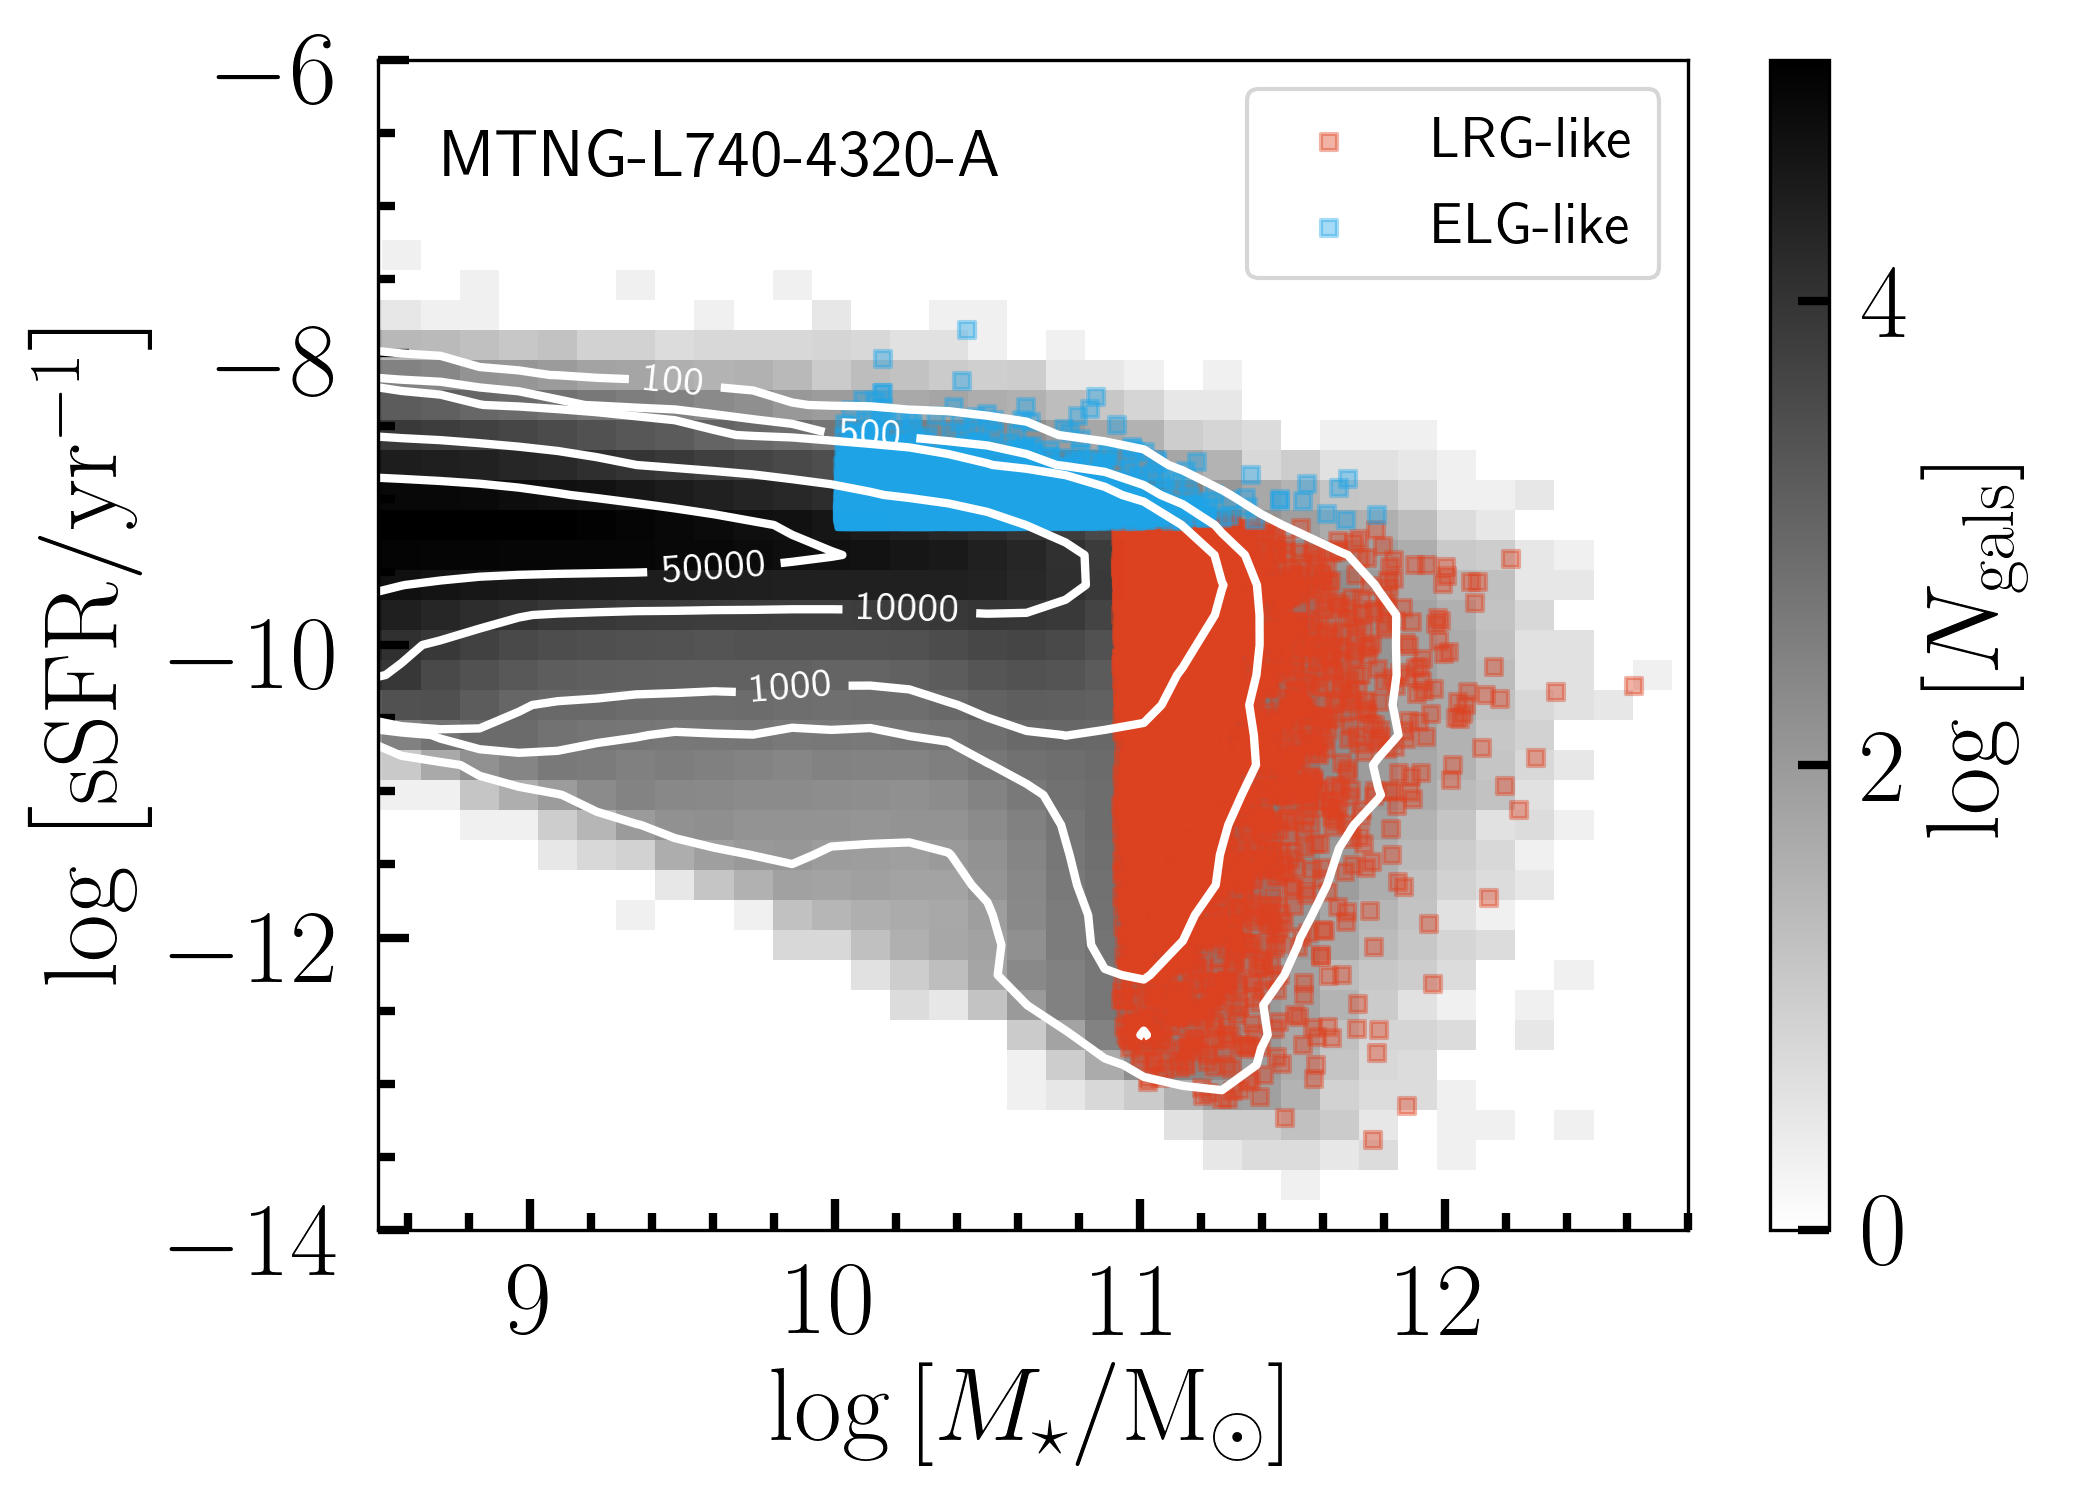
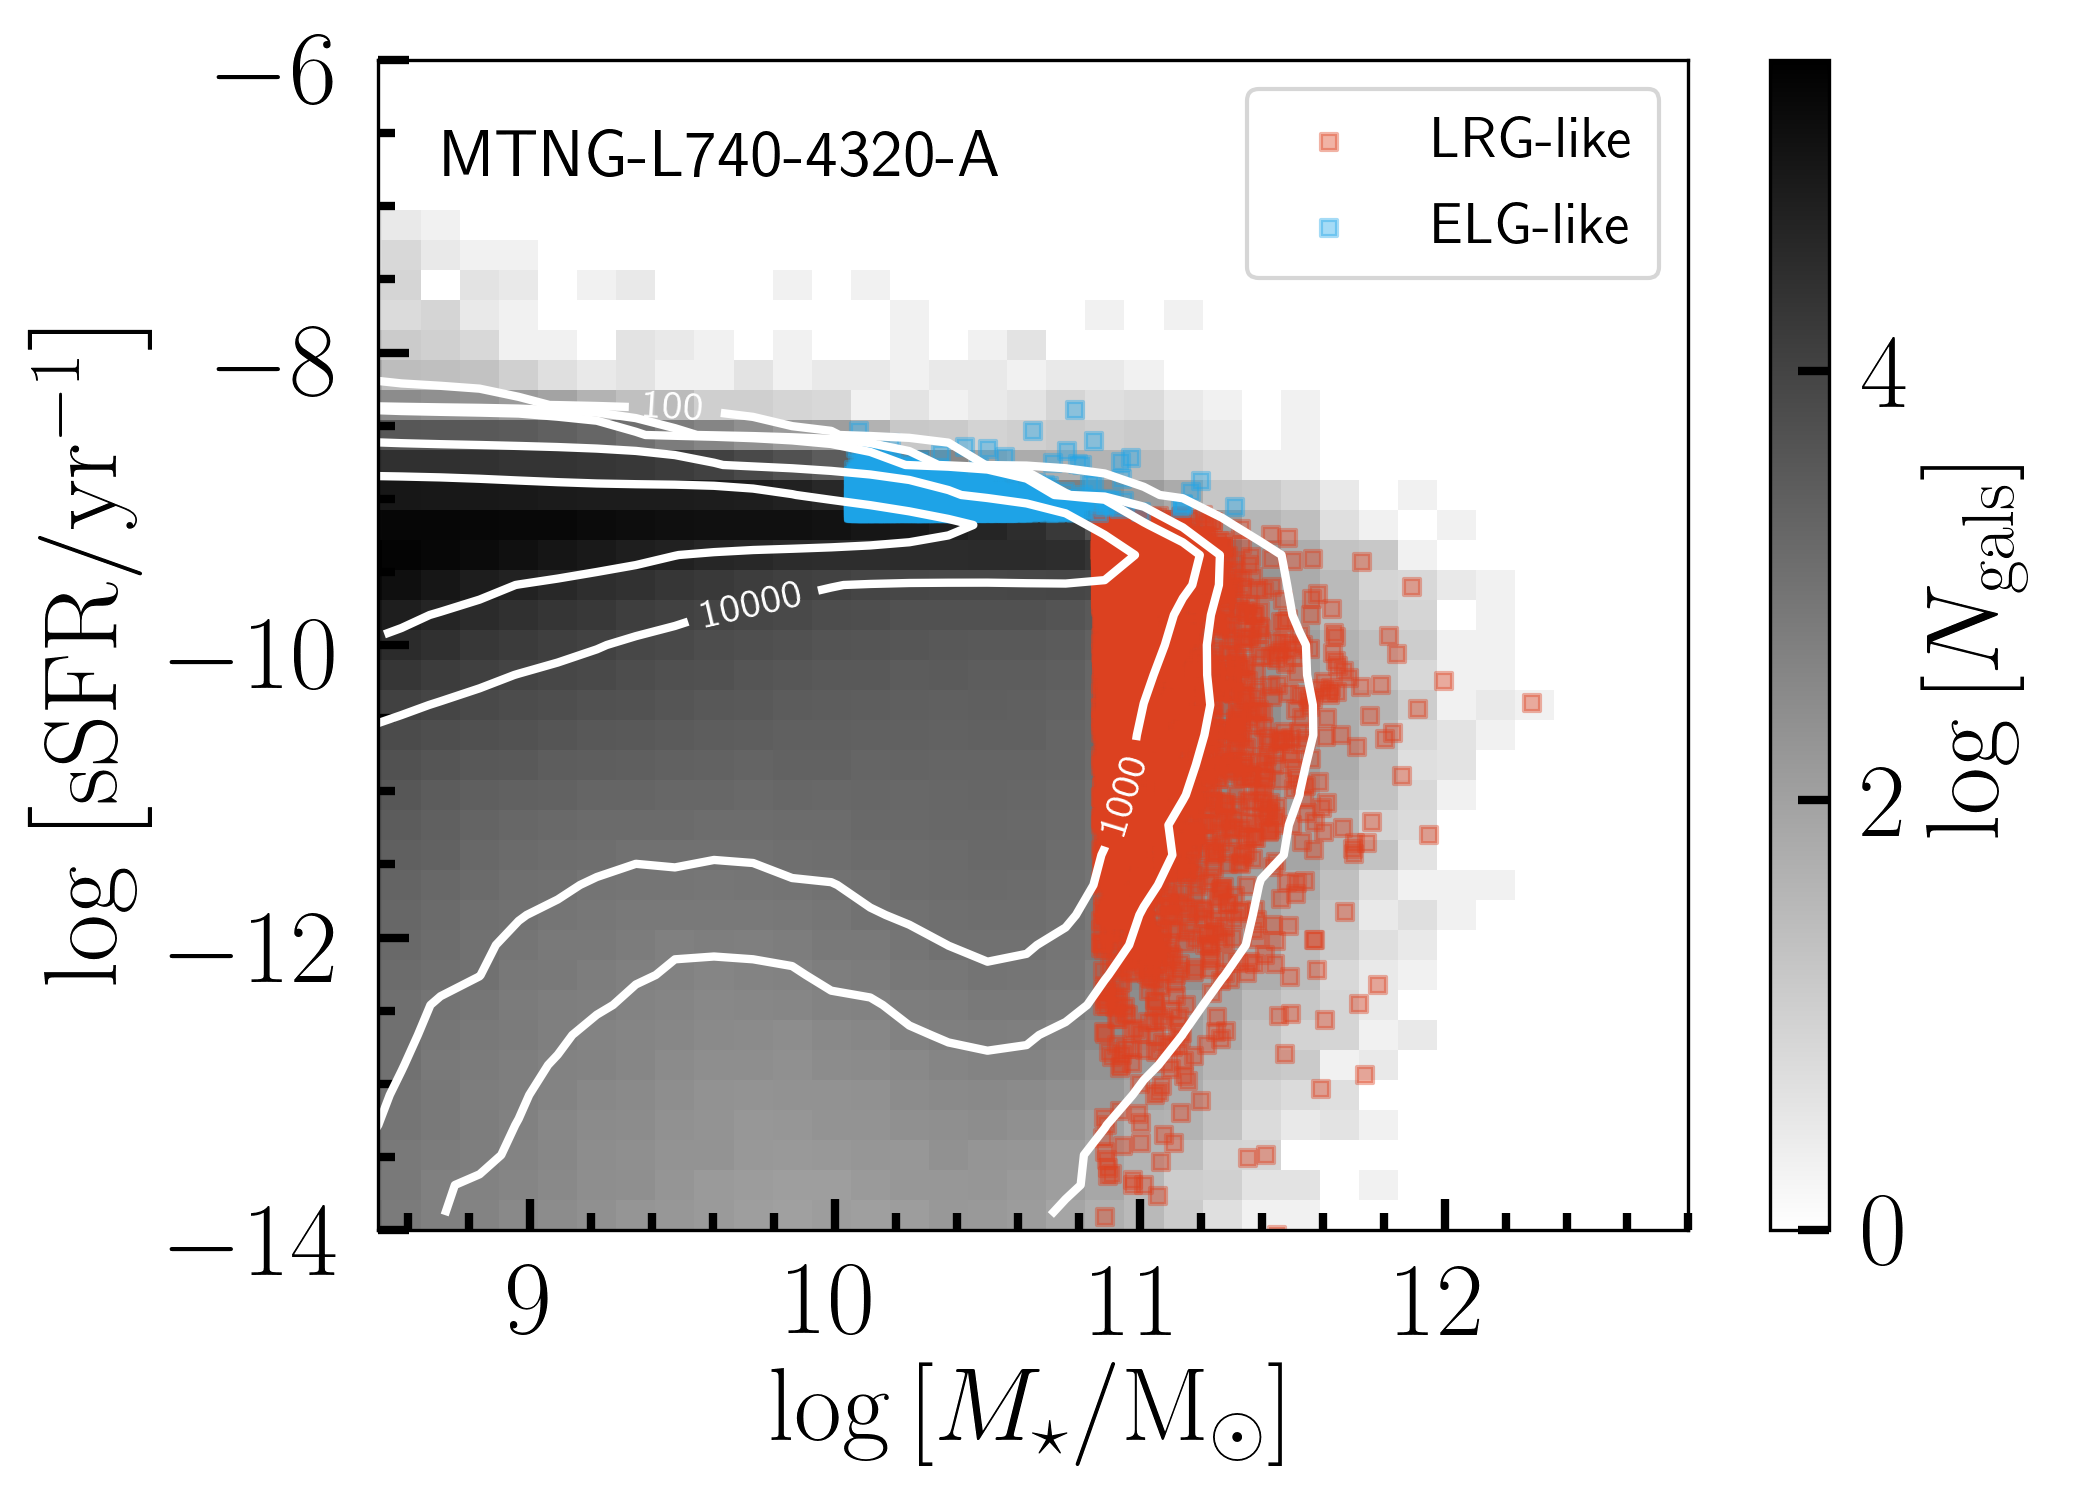
Figure 6 shows the specific star formation rate as a function of stellar mass at in MTNG740 (left panel) and L-Galaxies (right panel). The subset of galaxies identified as LRG-like and ELG-like (based on the criteria listed above) are highlighted using red and blue colours, respectively. By imposing a specific star formation rate cut for both selections we ensure that there is no overlap between the two populations of galaxies. The L-Galaxies model, being semi-analytic in nature, is less restricted by numerical resolution and allows a denser sampling of galaxies less massive than . Note that because we have generated samples at the same number density within volumes of the same size ( Mpc3), we are left with the same total number of ELG-like and LRG-like galaxies in MTNG740 and L-Galaxies.
Having defined an appropriate sample of LRG-like and ELG-like galaxies, we are now in a position to predict the clustering properties of these populations. Rather than show the clustering strength, , it is interesting to consider the clustering bias of these objects. The scale-dependent bias of a tracer galaxy population, , is defined as:
| (4) |
where and , respectively, are the two-point correlation functions of the tracer population and the dark matter density field.
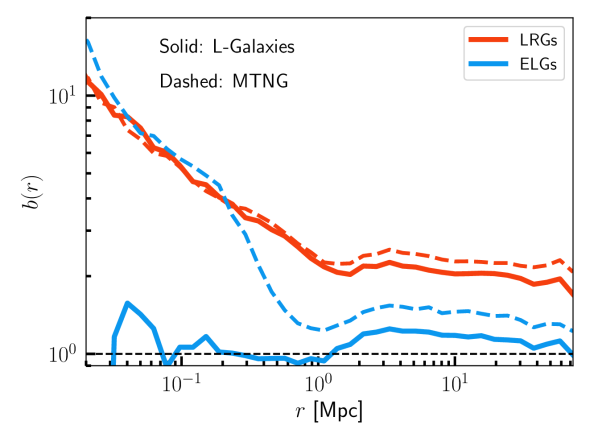
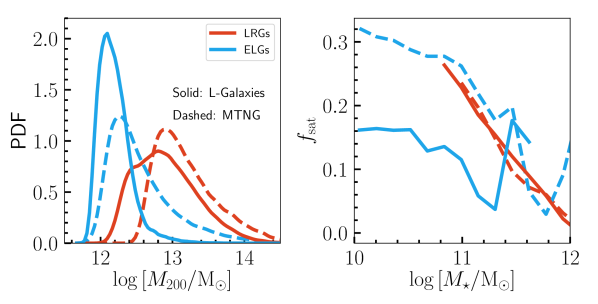
Figure 7 shows the bias of our ELG- (blue) and LRG-like (red) samples in MTNG740 (dashed lines) and L-Galaxies (solid lines). There are a number of interesting conclusions to be drawn from this diagram. First, it is clear to see a strong scale dependence exhibited by both galaxy types. The scale dependence is especially pronounced on small scales ( Mpc); on larger scales, the bias becomes roughly constant. This is in line with the expectation that the large-scale galaxy bias is scale independent, making perturbative approaches to modelling galaxy bias appropriate on these scales. We also see that the large-scale bias for LRG-like galaxies is about a factor of two stronger than for ELGs; this is also expected as LRG-like galaxies are hosted in more massive haloes, which are themselves clustered more strongly than low mass objects. We find that the large-scale bias settles down at around for LRGs and - for ELGs. Significant scale dependence in the galaxy bias begins to manifest in the transition regime between the one- and two-halo terms, where the clustering begins to be dominated by satellite galaxies. Trends similar to what we have shown here are also observed in TNG-300 (see, e.g. Figure 19 in Springel et al., 2018).
The comparison between MTNG740 and L-Galaxies for the two galaxy types is also interesting. For the LRGs, we find excellent agreement between the two catalogues for galaxy separations of kpc all the way up to Mpc (1/10th of the box size, which is the maximum separation we consider when computing ). For the ELG-like population, on the other hand, the behaviour is similar on scales larger than Mpc, but significantly different on smaller scales. While ELG-like galaxies in MTNG740 show strong scale-dependent bias (not dissimilar to the LRGs), this scale-dependence is largely absent in L-Galaxies.
In order to explain the possible cause of these differences, it is instructive to examine the galaxies and host haloes of the LRG-like and ELG-like samples we have generated from each of MTNG740 and L-Galaxies. The left panel in Figure 8 shows the distribution of halo masses (in terms of ) of galaxies identified as LRG-like or ELG-like in MTNG740 (dashed lines) and L-Galaxies (solid lines). Consistent with other works studying these populations, we find that the typical host halo mass for LRG-like galaxies is and for ELG-like galaxies. In fact, we largely do not find any LRGs hosted in the mass scale typical for ELG hosts. It is also interesting to note that in L-Galaxies, ELG-like galaxies are hosted in a narrower mass range (centred around ) than in MTNG740. In the latter, for example, there is a non-negligible number of galaxies identified as ELGs hosted in haloes with whereas we typically do not find ELG-like galaxies in hosts as massive as these in L-Galaxies.
To understand this further, in the right-hand panel in Figure 8 we show the fraction of galaxies of a given stellar mass, , that are identified as satellite galaxies (). We remind the reader that a galaxy is identified as a satellite when it is not formed inside the most massive subhalo within a given host halo. Focussing on the LRG-like populations to begin with, we find near-identical behaviour in MTNG740 and L-Galaxies. As expected, galaxies of increasing stellar mass are less likely to be identified as satellites; the most massive galaxies are more likely to be formed within the principal subhalo within a host halo. On the other hand, around a quarter of galaxies with stellar mass are satellite LRGs.
We find more significant differences when comparing the satellite fraction of the ELG-like populations. Here, we also note the trend of decreasing with increasing , though the dependence becomes gentler below . While a handful of galaxies with are identified as satellite ELGs in MTNG740, there are no such objects in L-Galaxies. This is consistent with our observation in the left-hand panel of the same figure, where it was found that L-Galaxies has an absence of ELGs hosted in the most massive haloes. Shifting to lower mass galaxies, we find that in MTNG740, satellite ELGs appear twice as often at , and nearly four times as often at than they do in L-Galaxies. The considerable difference in satellite fractions provides a tantalising metric to potentially constrain models of galaxy formation with upcoming data. However, there is significant systematic uncertainty associated with inferring observationally as it depends sensitively on the details of the galaxy occupation model used to fit the clustering.
The comparatively low density of satellite ELGs in L-Galaxies likely contributes to part of the reason why the small-scale bias, , is lower than in MTNG740 (see Figure 7). The clustering of satellite galaxies dominates the clustering signal below Mpc, and it is on these scales where we notice the large divergence in the predicted bias measurement of the two sets of simulated ELG samples. This difference is reflective of the different HODs for emission line galaxies in L-Galaxies compared to MTNG740. We tend to find more star-forming (bluer) central galaxies in the L-Galaxies catalogue (see Figure 5), which means for a number density-limited sample the overall fraction of satellite ELGs is comparatively lower in L-Galaxies than in MTNG740.
We now conclude our examination of the clustering properties of galaxies in the periodic MTNG740 and MTNG740-4320 L-Galaxies volumes. A realistic galaxy redshift survey observes galaxies within a lightcone, with footprints and selection functions that are specific to individual surveys. In the following subsection, we will consider the clustering properties of galaxies identified on lightcones that have been constructed from our simulations on-the-fly.
3.4 The clustering properties of mock catalogues on the lightcone
In this subsection, we present clustering predictions of mock galaxy catalogues constructed on lightcones output as part of the MTNG suite. In what follows, we will consider L-Galaxies catalogues constructed from the MTNG740-2160-A/B dark matter-only runs. The full details of the lightcone construction strategy can be found in the companion paper by Barrera et al. (2022); here, we consider a particle lightcone occupying one octant of the sky in the redshift range , resulting in a maximum comoving distance of 4.5 Gpc.
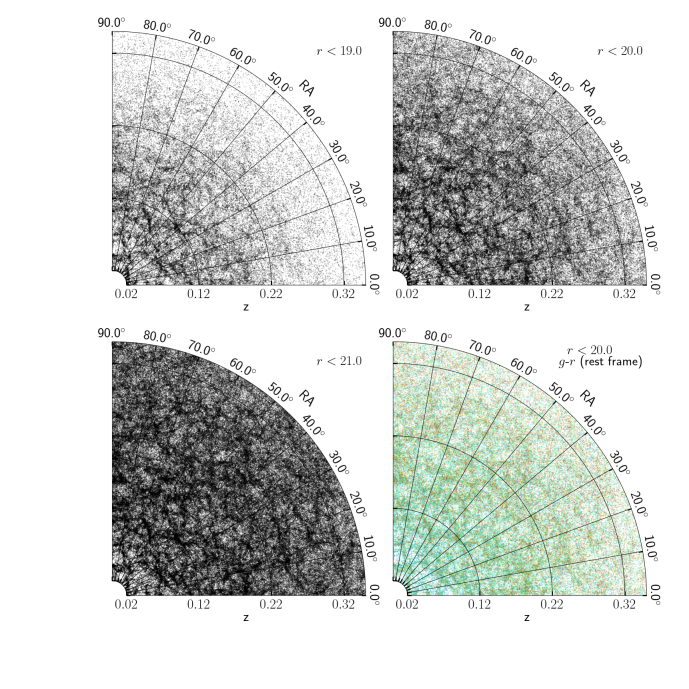
To demonstrate a potential application of our lightcones, we construct an SDSS-like magnitude limited sample of galaxies between . The L-Galaxies ligtcone outputs provide observer frame apparent -band magnitudes that we use to generate such samples. Figure 9 shows slices through the resulting mocks generated from MTNG740-2160-A using three apparent magnitude cuts: , , and . Each successive cut results in the inclusion of fainter galaxies, which is why the space density of galaxies increases from one wedge to the next. We display the positions of galaxies only within angular positions and in order to avoid oversaturating the diagram. The structure of the cosmic web, traced by our semi-analytic galaxies, can be seen clearly, with filaments and walls reminiscent of SDSS structure. The last panel in the bottom right of this figure shows the sample with galaxies coloured according to their - colour. We see that the magnitude-limited sample picks up nearby faint, blue galaxies, and distant bright, red galaxies.
We are now in a position to compute the redshift-space clustering, , of galaxies defined on the lightcone (where is the galaxy pair separation calculated in redshift-space). We use the Landy & Szalay (1993) estimator, defined so that:
| (5) |
where , , , respectively, are the data-data pair counts, random-random pair counts, and data-random cross pair counts computed in redshift space.
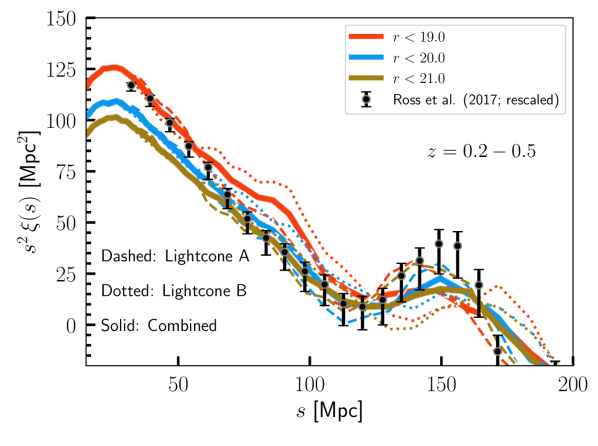
Figure 10 shows the redshift-space correlation function, , of galaxies in the redshift range in the mock catalogue defined above. Each curve shows the clustering of samples generated using different apparent -band magnitude thresholds; the ‘A’ and ‘B’ realisations of the MTNG740-2160 L-Galaxies lightcones are shown, respectively using the dashed and dotted lines. The correlation function has been multiplied by to exaggerate fluctuations in . We see the clear presence of a BAO feature in each of clustering samples occurring at scales of Mpc, as expected. We also find that the amplitude of the clustering varies between the samples: the includes many faint galaxies, whereas the sample includes only the brighter (and more biased) galaxies. The variance just between the ‘A’ and ‘B’ realisations is interesting to note, particularly in the exact location of the BAO feature (see also Barrera et al., 2022, for a more detailed analysis of this effect). The thick solid line combines the two realisations to yield a smoother clustering measurement with suppressed noise on large scales, showing the advantage of combining volumes with ‘fixed’ and ‘paired’ initial conditions.
For comparison, we have also included the clustering measured in the Baryon Acoustic Oscillation Spectroscopic Survey (BOSS, Reid et al., 2016) by Ross et al. (2017) for galaxies in the redshift range ; this is shown using the black points with error bars. Note that the Ross et al. (2017) measurements have been shifted down by a constant factor so as to enable comparison with the simulations. We find reasonable qualitative agreement between the clustering measured in BOSS and our magnitude-limited samples, although there are some differences to note, particularly in the amplitude of the BAO peak. Some differences are inevitable, since we have taken no great care to match either the colour selection (where, in addition to a brightness cut, colour cuts in the , , and -bands are also used), nor do we attempt to mimic the redshift-dependent galaxy number density in BOSS.
The peculiar motions of galaxies in redshift-space add a contribution to their observed redshift (i.e., their position along the radial direction) that can be attributed to the growth rate of structure on large scales. These redshift space distortions (RSDs) propagate through to the clustering measured from galaxies in a survey, making it more anisotropic. By measuring the degree of anisotropy, therefore, it is possible to quantify the characteristic amplitude of pairwise peculiar motions of galaxies and, therefore, the growth rate of structure (e.g. Kaiser, 1987; Hawkins et al., 2003; Zehavi et al., 2005; Samushia et al., 2012; Reid et al., 2012). A convenient way to express the anisotropy in redshift-space clustering is to decompose into its Legendre multipoles (Hamilton, 1992):
| (6) |
in which is magnitude of the pair separation vector, , is the cosine of the angle between the line-of-sight direction and , and is the order Legendre polynomial. Due to symmetry, the first three non-zero Legendre multipoles are those of order which, respectively, are referred to as the monopole (), quadrupole (), and hexadecapole () terms of the redshift-space correlation function. In the absence of RSDs, the quadrupole and hexadecapole terms vanish.
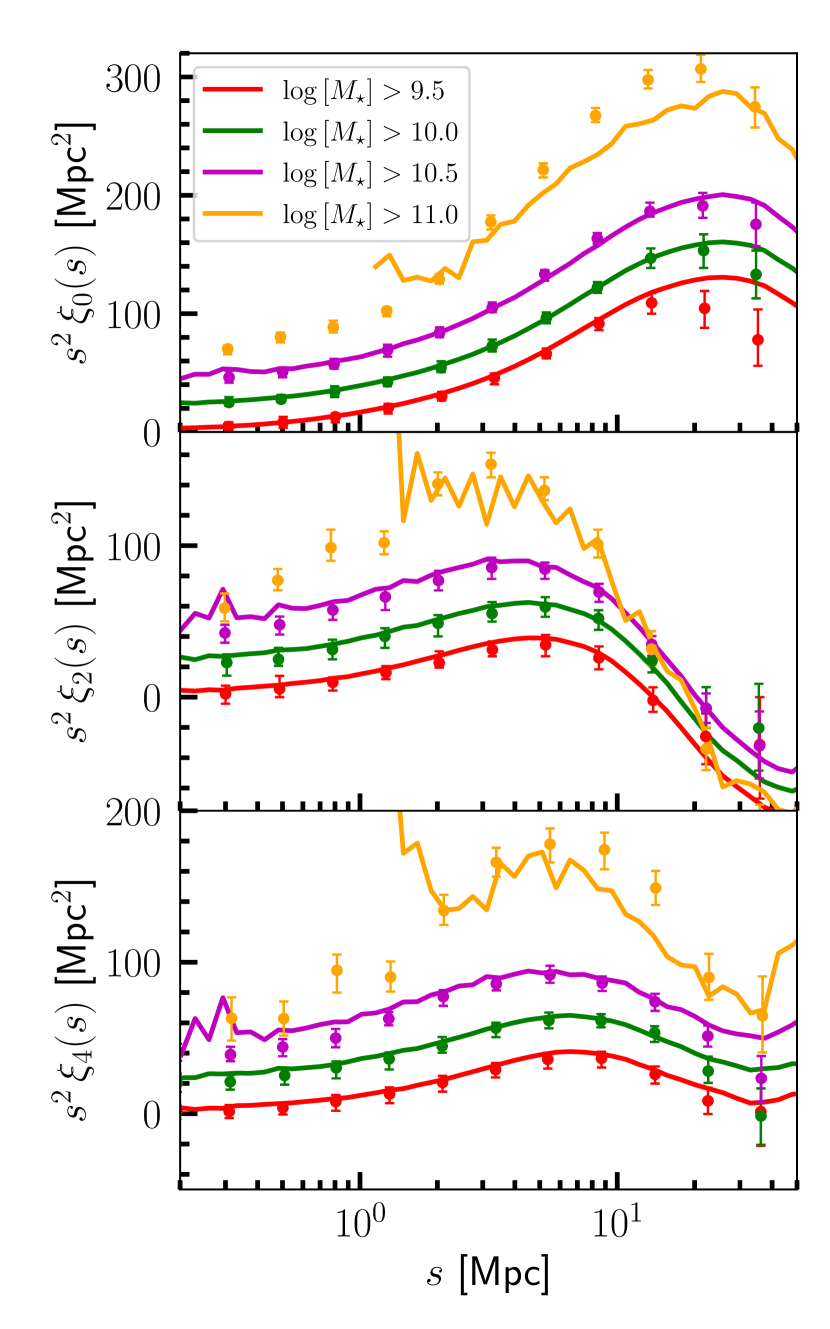
In Figure 11, we present predictions for the monopole, quadrupole, and hexadecapole of the redshift-space correlation function measured from our lightcone mock catalogues. Once again, we have combined the individual measurements from the ‘A’ and ‘B’ realisations. We show the measurements for samples now constructed at fixed stellar mass thresholds: (red); (green); (purple); (orange). Each curve has been offset vertically in steps of (starting from the lowest mass bin) to aid clarity. We also show (using points with errorbars in corresponding colours) the redshift-space multipoles measured in SDSS data by Dong-Páez et al. (2022); these data have also been offset like the curves.
As expected, we find non-zero contributions to and through the inclusion of galaxy peculiar motions in the RSD. The strength of the signal is largest towards small galaxy separations, where peculiar motions are enhanced due to non-linear growth. Note that the RSDs also have a non-negligible impact on the monopole term. On large scales, the quadrupole term is expected to become negative111This effect is not so obvious in Figure 11 due to the vertical offsets we have applied between the curves. as a reflection of the infalling motions of galaxies on the outskirts of clusters; this causes a compression of structure along the line-of-sight. On smaller scales, the quadrupole term is again positive due to the virialised motions of galaxies within clusters causing a net elongation of structures along the line-of-sight (the so-called “fingers of God” effect). The hexadecapole term, , encodes similar information, but now regarding paired infalling galaxies.
Figure 11 shows excellent agreement between the SDSS redshift-space multipoles and the predictions of our lightcone catalogues, all the way from separations of kpc to Mpc. The measurements for the largest mass bin are noisy, and the agreement here is not as good for lower mass bins; it is likely that our (simulated) sample size is statistically limited in this regime. It will be interesting to revisit this further using lightcones generated from the 3 Gpc MillenniumTNG-XXL volume, which boasts more than 60 times the volume of the runs presented in this paper. We set aside this investigation as future work.
4 Discussion & Conclusions
This work is part of a series of introductory papers comprising the MillenniumTNG (MTNG) project, a new simulation series that blends the successes of the IllustrisTNG (TNG) galaxy formation model (Weinberger et al., 2017; Pillepich et al., 2018a) with high-resolution, large volume simulations. Our main objective in this work was to present the clustering predictions of galaxies extracted from the flagship full physics simulation, MTNG740, which evolves a 740 Mpc periodic volume with a baryonic mass resolution of . This mass resolution has been shown to be sufficient to achieve converged properties in the regime relevant to large-scale structure analyses (Pakmor et al., 2022), which is the primary domain of applications anticipated for MTNG. The clustering predictions for these galaxies are considered alongside a synthetic catalogue generated using the L-Galaxies semi-analytic model of galaxy formation, run on merger trees extracted from the dark matter-only counterpart to MTNG740. Our main findings are summarised below:
-
1.
We find that at , the projected two-point clustering of galaxies, , extracted from MTNG740 is in good agreement with that of observed galaxies (Figure 1). In particular, measurements of as a function of galaxy stellar mass show a reasonable match to the measurements from SDSS data by Guo et al. (2011). The clustering is also shown to be well-converged against the higher resolution TNG-300-1 simulation, in which the baryonic mass resolution is roughly twice that in MTNG740.
-
2.
When split by colour, the projected clustering shows good agreement with the observed data for blue galaxies, but MTNG740 overpredicts the clustering observed for red galaxies, particularly for objects in the mass range and in the one-halo regime (Figure 2). This suggests an overabundance of quenched, red satellite galaxies in our full physics model. This problem is almost absent in the semi-analytic model.
-
3.
A consequence of this is that the predicted cross-correlation of red and blue galaxies in MTNG740 shows a suppression relative to the geometric mean of their individual auto-correlation functions (Figure 3). In galaxies less massive than , the cross-correlation effectively flattens out below Mpc. This potentially implies a significant separation of red- and blue-satellite hosting haloes in this mass range. Again, this issue is absent in the semi-analytic model.
-
4.
The much better agreement of L-Galaxies model with observed colour-dependent clustering as a function of stellar mass may in part be because the observed active/passive fractions of galaxies (though not their clustering) were used to calibrate the semianalytic model. No such explicit requirement was imposed on the MTNG full physics run (or rather on the ealier TNG runs from which the MTNG parameters were taken). Indeed, comparing the galaxy colour distributions in the simulated catalogues, we find a clear excess peak of red satellites in MTNG740 (Figure 5).
-
5.
We then consider the clustering predictions of galaxy samples from each of MTNG740 and L-Galaxies chosen so as to reflect the selection of luminous red galaxy (LRG) and emission line galaxy (ELG) samples as targeted by the DESI survey (Figure 6). Our models predict that the large-scale bias, , of these samples becomes roughly linear and scale-independent on scales larger than Mpc, with the value settling around for the LRGs and - for ELGs (Figure 7).
-
6.
In L-Galaxies the small-scale bias of ELG-like samples is much weaker than in MTNG740; this is due to the fact that a much smaller fraction of low-mass ELG-like galaxies are satellites in the semi-analytic model, around times fewer than in the MTNG740 full physics run (Figure 8). Both models predict that LRG-like galaxies are hosted in haloes with mass while ELGs tend to live in haloes that are an order of magnitude less massive. The distribution of halo masses hosting ELG-like galaxies is narrower in L-Galaxies than in MTNG740. On the other hand, the bias for LRG-like galaxies is similar across all scales in both models.
-
7.
We created mock galaxy samples from the lightcone output generated on-the-fly in MTNG. We generated mocks selected above three apparent -band magnitude thresholds (Figure 9), and presented the redshift-space clustering predictions, , for galaxies in this lightcone between (Figure 10). We are able to clearly identify the BAO feature in each of these samples.
-
8.
Finally, we concluded our investigation by decomposing the redshift-space clustering into Legendre multipoles, studying the monopole, quadrupole, and hexadecapole terms (Figure 11). Upon comparing the predictions of our mock lightcone catalogues with stellar mass-selected samples in SDSS, we find good agreement with observations, thus signifying that our lightcone mocks contain reasonably realistic redshift space distortions.
Our results show the important insights into galaxy formation that may be inferred from studies of galaxy clustering. By considering the clustering predictions of galaxies selected according to various types, and measured across a wide range of spatial scales, we are able to gain a more comprehensive understanding of how details of the galaxy formation process manifest in the evolved galaxy density field we observe today. With ongoing surveys like DESI, as well as upcoming ones like Euclid and the Roman Space Telescope, the opportunity to use high-precision measurements of galaxy clustering to constrain how galaxies form will only improve. This makes it an exciting time to also push cosmological hydrodynamical and semi-analytic simulations to the regime relevant to these surveys. The results presented in this paper are just a small representation of the kinds of applications the MillenniumTNG project is primed for. Further demonstrations of the richness of this data set will be the subject of future work.
Acknowledgements
We are thankful to the referee for their careful reading of this manuscript and for making suggestions that improve the quality of our work. The authors gratefully acknowledge the Gauss Centre for Supercomputing (GCS) for providing computing time on the GCS Supercomputer SuperMUC-NG at the Leibniz Supercomputing Centre (LRZ) in Garching, Germany, under project pn34mo. This work used the DiRAC@Durham facility managed by the Institute for Computational Cosmology on behalf of the STFC DiRAC HPC Facility, with equipment funded by BEIS capital funding via STFC capital grants ST/K00042X/1, ST/P002293/1, ST/R002371/1 and ST/S002502/1, Durham University and STFC operations grant ST/R000832/1. SB is supported by the UK Research and Innovation (UKRI) Future Leaders Fellowship [grant number MR/V023381/1]. CH-A acknowledges support from the Excellence Cluster ORIGINS which is funded by the Deutsche Forschungsgemeinschaft (DFG, German Research Foundation) under Germany’s Excellence Strategy – EXC-2094 – 390783311. VS and LH acknowledge support by the Simons Collaboration on “Learning the Universe”. LH is supported by NSF grant AST-1815978.
Data Availability
The MillenniumTNG simulations will be made fully publicly available at https://www.mtng-project.org/ in 2024. The data shown in the figures of this article will be shared upon reasonable request to the corresponding author.
References
- Angulo & Pontzen (2016) Angulo R. E., Pontzen A., 2016, MNRAS, 462, L1
- Ayromlou et al. (2021) Ayromlou M., Kauffmann G., Yates R. M., Nelson D., White S. D. M., 2021, MNRAS, 505, 492
- Barrera et al. (2022) Barrera M., et al., 2022, arXiv e-prints, p. arXiv:2210.10419
- Behroozi et al. (2010) Behroozi P. S., Conroy C., Wechsler R. H., 2010, ApJ, 717, 379
- Behroozi et al. (2013) Behroozi P. S., Wechsler R. H., Conroy C., 2013, ApJ, 770, 57
- Behroozi et al. (2019) Behroozi P., Wechsler R. H., Hearin A. P., Conroy C., 2019, MNRAS, 488, 3143
- Benson (2012) Benson A. J., 2012, New Astron., 17, 175
- Benson et al. (2000) Benson A. J., Cole S., Frenk C. S., Baugh C. M., Lacey C. G., 2000, MNRAS, 311, 793
- Berlind & Weinberg (2002) Berlind A. A., Weinberg D. H., 2002, ApJ, 575, 587
- Bird et al. (2022) Bird S., Ni Y., Di Matteo T., Croft R., Feng Y., Chen N., 2022, MNRAS, 512, 3703
- Chuang et al. (2019) Chuang C.-H., et al., 2019, MNRAS, 487, 48
- Cole et al. (2000) Cole S., Lacey C. G., Baugh C. M., Frenk C. S., 2000, MNRAS, 319, 168
- Cole et al. (2005) Cole S., et al., 2005, MNRAS, 362, 505
- Colless et al. (2001) Colless M., et al., 2001, MNRAS, 328, 1039
- Conroy & Wechsler (2009) Conroy C., Wechsler R. H., 2009, ApJ, 696, 620
- Contreras et al. (2022) Contreras S., et al., 2022, arXiv e-prints, p. arXiv:2210.10075
- Croton et al. (2006) Croton D. J., et al., 2006, MNRAS, 365, 11
- DESI Collaboration et al. (2016) DESI Collaboration et al., 2016, arXiv e-prints, p. arXiv:1611.00036
- Davé et al. (2016) Davé R., Thompson R., Hopkins P. F., 2016, MNRAS, 462, 3265
- Delgado et al. (2022a) Delgado A. M., et al., 2022a
- Delgado et al. (2022b) Delgado A. M., Wadekar D., Hadzhiyska B., Bose S., Hernquist L., Ho S., 2022b, MNRAS, 515, 2733
- Desjacques et al. (2018) Desjacques V., Jeong D., Schmidt F., 2018, Phys. Rep., 733, 1
- Ding et al. (2022) Ding Z., et al., 2022, MNRAS, 514, 3308
- Dolag et al. (2016) Dolag K., Komatsu E., Sunyaev R., 2016, MNRAS, 463, 1797
- Dong-Páez et al. (2022) Dong-Páez C. A., et al., 2022, arXiv e-prints, p. arXiv:2208.00540
- Dubois et al. (2016) Dubois Y., Peirani S., Pichon C., Devriendt J., Gavazzi R., Welker C., Volonteri M., 2016, MNRAS, 463, 3948
- Eisenstein et al. (2005) Eisenstein D. J., et al., 2005, ApJ, 633, 560
- Furlito et al. (2022) Furlito F., et al., 2022
- Gao & White (2007) Gao L., White S. D. M., 2007, MNRAS, 377, L5
- Gao et al. (2005) Gao L., Springel V., White S. D. M., 2005, MNRAS, 363, L66
- Geach et al. (2012) Geach J. E., Sobral D., Hickox R. C., Wake D. A., Smail I., Best P. N., Baugh C. M., Stott J. P., 2012, MNRAS, 426, 679
- Geller & Huchra (1989) Geller M. J., Huchra J. P., 1989, Science, 246, 897
- Genel et al. (2014) Genel S., et al., 2014, MNRAS, 445, 175
- Gonzalez-Perez et al. (2018) Gonzalez-Perez V., et al., 2018, MNRAS, 474, 4024
- Guo et al. (2011) Guo Q., et al., 2011, MNRAS, 413, 101
- Hadzhiyska et al. (2021) Hadzhiyska B., Tacchella S., Bose S., Eisenstein D. J., 2021, MNRAS, 502, 3599
- Hadzhiyska et al. (2022a) Hadzhiyska B., et al., 2022a, arXiv e-prints, p. arXiv:2210.10068
- Hadzhiyska et al. (2022b) Hadzhiyska B., et al., 2022b, arXiv e-prints, p. arXiv:2210.10072
- Hamilton (1992) Hamilton A. J. S., 1992, ApJ, 385, L5
- Hawkins et al. (2003) Hawkins E., et al., 2003, MNRAS, 346, 78
- Henriques et al. (2015) Henriques B. M. B., White S. D. M., Thomas P. A., Angulo R., Guo Q., Lemson G., Springel V., Overzier R., 2015, MNRAS, 451, 2663
- Henriques et al. (2020) Henriques B. M. B., Yates R. M., Fu J., Guo Q., Kauffmann G., Srisawat C., Thomas P. A., White S. D. M., 2020, MNRAS, 491, 5795
- Hernández-Aguayo et al. (2021) Hernández-Aguayo C., Prada F., Baugh C. M., Klypin A., 2021, Mon. Not. Roy. Astron. Soc., 503, 2318
- Hernández-Aguayo et al. (2022) Hernández-Aguayo C., et al., 2022, arXiv e-prints, p. arXiv:2210.10059
- Jiménez et al. (2021) Jiménez E., Padilla N., Contreras S., Zehavi I., Baugh C. M., Orsi Á., 2021, MNRAS, 506, 3155
- Kaiser (1987) Kaiser N., 1987, MNRAS, 227, 1
- Kannan et al. (2022a) Kannan R., et al., 2022a, arXiv e-prints, p. arXiv:2210.10066
- Kannan et al. (2022b) Kannan R., Garaldi E., Smith A., Pakmor R., Springel V., Vogelsberger M., Hernquist L., 2022b, MNRAS, 511, 4005
- Kauffmann et al. (1993) Kauffmann G., White S. D. M., Guiderdoni B., 1993, MNRAS, 264, 201
- Kauffmann et al. (1999) Kauffmann G., Colberg J. M., Diaferio A., White S. D. M., 1999, MNRAS, 303, 188
- Khandai et al. (2015) Khandai N., Di Matteo T., Croft R., Wilkins S., Feng Y., Tucker E., DeGraf C., Liu M.-S., 2015, MNRAS, 450, 1349
- Kravtsov et al. (2004) Kravtsov A. V., Berlind A. A., Wechsler R. H., Klypin A. A., Gottlöber S., Allgood B., Primack J. R., 2004, ApJ, 609, 35
- Lagos et al. (2018) Lagos C. d. P., Tobar R. J., Robotham A. S. G., Obreschkow D., Mitchell P. D., Power C., Elahi P. J., 2018, MNRAS, 481, 3573
- Landy & Szalay (1993) Landy S. D., Szalay A. S., 1993, ApJ, 412, 64
- Laureijs et al. (2011) Laureijs R., et al., 2011, arXiv e-prints,
- Levi et al. (2013) Levi M., et al., 2013, arXiv e-prints,
- Marinacci et al. (2018) Marinacci F., et al., 2018, MNRAS, 480, 5113
- McCarthy et al. (2017) McCarthy I. G., Schaye J., Bird S., Le Brun A. M. C., 2017, MNRAS, 465, 2936
- Mo et al. (1999) Mo H. J., Mao S., White S. D. M., 1999, MNRAS, 304, 175
- Moster et al. (2013) Moster B. P., Naab T., White S. D. M., 2013, MNRAS, 428, 3121
- Naiman et al. (2018) Naiman J. P., et al., 2018, MNRAS, 477, 1206
- Nelson et al. (2018) Nelson D., et al., 2018, MNRAS, 475, 624
- Nelson et al. (2019a) Nelson D., et al., 2019a, Computational Astrophysics and Cosmology, 6, 2
- Nelson et al. (2019b) Nelson D., et al., 2019b, MNRAS, 490, 3234
- Ni et al. (2022) Ni Y., et al., 2022, MNRAS, 513, 670
- Osato & Okumura (2022) Osato K., Okumura T., 2022, arXiv e-prints, p. arXiv:2206.08678
- Pakmor et al. (2017) Pakmor R., et al., 2017, MNRAS, 469, 3185
- Pakmor et al. (2022) Pakmor R., et al., 2022, arXiv e-prints, p. arXiv:2210.10060
- Peacock & Smith (2000) Peacock J. A., Smith R. E., 2000, MNRAS, 318, 1144
- Pillepich et al. (2018a) Pillepich A., et al., 2018a, MNRAS, 473, 4077
- Pillepich et al. (2018b) Pillepich A., et al., 2018b, MNRAS, 475, 648
- Pillepich et al. (2019) Pillepich A., et al., 2019, MNRAS, 490, 3196
- Planck Collaboration et al. (2016) Planck Collaboration et al., 2016, A&A, 594, A13
- Raichoor et al. (2017) Raichoor A., et al., 2017, MNRAS, 471, 3955
- Reddick et al. (2013) Reddick R. M., Wechsler R. H., Tinker J. L., Behroozi P. S., 2013, ApJ, 771, 30
- Reid et al. (2012) Reid B. A., et al., 2012, MNRAS, 426, 2719
- Reid et al. (2016) Reid B., et al., 2016, MNRAS, 455, 1553
- Rodríguez-Puebla et al. (2016) Rodríguez-Puebla A., Primack J. R., Behroozi P., Faber S. M., 2016, MNRAS, 455, 2592
- Ross et al. (2017) Ross A. J., et al., 2017, MNRAS, 464, 1168
- Samushia et al. (2012) Samushia L., Percival W. J., Raccanelli A., 2012, MNRAS, 420, 2102
- Schaye et al. (2010) Schaye J., et al., 2010, MNRAS, 402, 1536
- Schaye et al. (2015) Schaye J., et al., 2015, MNRAS, 446, 521
- Sheth & Tormen (1999) Sheth R. K., Tormen G., 1999, MNRAS, 308, 119
- Sinha & Garrison (2017) Sinha M., Garrison L., 2017, Corrfunc: Blazing fast correlation functions on the CPU, Astrophysics Source Code Library, record ascl:1703.003 (ascl:1703.003)
- Somerville & Primack (1999) Somerville R. S., Primack J. R., 1999, MNRAS, 310, 1087
- Spergel et al. (2015) Spergel D., et al., 2015, arXiv e-prints, p. arXiv:1503.03757
- Springel (2010) Springel V., 2010, MNRAS, 401, 791
- Springel et al. (2001) Springel V., White S. D. M., Tormen G., Kauffmann G., 2001, MNRAS, 328, 726
- Springel et al. (2005) Springel V., et al., 2005, Nature, 435, 629
- Springel et al. (2018) Springel V., et al., 2018, MNRAS, 475, 676
- Springel et al. (2021) Springel V., Pakmor R., Zier O., Reinecke M., 2021, MNRAS, 506, 2871
- Tacchella et al. (2018) Tacchella S., Bose S., Conroy C., Eisenstein D. J., Johnson B. D., 2018, ApJ, 868, 92
- Tasitsiomi et al. (2004) Tasitsiomi A., Kravtsov A. V., Wechsler R. H., Primack J. R., 2004, ApJ, 614, 533
- Tegmark et al. (2004) Tegmark M., et al., 2004, Phys. Rev. D, 69, 103501
- Vale & Ostriker (2004) Vale A., Ostriker J. P., 2004, MNRAS, 353, 189
- Vogelsberger et al. (2014a) Vogelsberger M., et al., 2014a, MNRAS, 444, 1518
- Vogelsberger et al. (2014b) Vogelsberger M., et al., 2014b, Nature, 509, 177
- Vogelsberger et al. (2020) Vogelsberger M., Marinacci F., Torrey P., Puchwein E., 2020, Nature Reviews Physics, 2, 42
- Wechsler & Tinker (2018) Wechsler R. H., Tinker J. L., 2018, ARA&A, 56, 435
- Wechsler et al. (2006) Wechsler R. H., Zentner A. R., Bullock J. S., Kravtsov A. V., Allgood B., 2006, ApJ, 652, 71
- Weinberger et al. (2017) Weinberger R., et al., 2017, MNRAS, 465, 3291
- Weinberger et al. (2020) Weinberger R., Springel V., Pakmor R., 2020, ApJS, 248, 32
- Yates et al. (2013) Yates R. M., Henriques B., Thomas P. A., Kauffmann G., Johansson J., White S. D. M., 2013, MNRAS, 435, 3500
- Yuan et al. (2022) Yuan S., Hadzhiyska B., Bose S., Eisenstein D. J., 2022, MNRAS, 512, 5793
- Zehavi et al. (2005) Zehavi I., et al., 2005, ApJ, 630, 1
- Zehavi et al. (2011) Zehavi I., et al., 2011, ApJ, 736, 59
- Zheng et al. (2005) Zheng Z., et al., 2005, ApJ, 633, 791