G-PECNet: Towards a Generalizable Pedestrian Trajectory Prediction System
Abstract
Navigating dynamic physical environments without obstructing or damaging human assets is of quintessential importance for social robots. In this work, we solve autonomous drone navigation’s sub-problem of predicting out-of-domain human and agent trajectories using a deep generative model. Our method: General-PECNet or G-PECNet observes an improvement of 9.5% on the Final Displacement Error (FDE) on 2020’s benchmark: PECNet (Mangalam et al., 2020b) through a combination of architectural improvements inspired by periodic activation functions (Sitzmann et al., 2020) and synthetic trajectory (data) augmentations using Hidden Markov Models (HMMs) and Reinforcement Learning (RL). Additionally, we propose a simple geometry-inspired metric for trajectory non-linearity and outlier detection, helpful for the task. Code available at GitHub
1 Introduction
Multimodal human or pedestrian trajectory prediction is an ill-posed problem of predicting the final and intermediate steps of some or all pedestrians when only a limited context of their previous trajectories and the scene is known. This is further complicated by implicit personal values and social rules that pre-define the interaction to an extent. Autonomous navigation for robots or social agents (Bennewitz et al., 2002), can only be enabled by accurate predictions for further downstream planning tasks. For the prediction problem, we contribute twofold: a novel reinforcement learning based synthetic dataset and a variational autoencoder (Kingma & Welling, 2013) based pedestrian prediction network: General-PECNet which achieves state-of-the-art performance on the goal-point or final destination prediction error (FDE). G-PECNet is an adaptation of PECNet (Mangalam et al., 2020b), 2020’s state-of-the-art (Mangalam et al., 2020b) method.
2 Related Work
We present a year-wise sorted concise summary of previous seminal pedestrian prediction networks in Tab 1. All previous works use the following 3 datasets: ETH (Pellegrini et al., 2009), UCY (Lerner et al., 2007), and Stanford Drone dataset or SDD (Robicquet et al., 2016).
| Method | Year | ADE | FDE |
|---|---|---|---|
| DESIRE (Lee et al., 2017) | 2017 | 19.25 | 34.05 |
| Social GAN (Gupta et al., 2018) | 2018 | 27.23 | 41.44 |
| Sophie (Sadeghian et al., 2018) | 2019 | 16.27 | 29.38 |
| CGNS (Li et al., 2019) | 2019 | 15.6 | 28.2 |
| CF-VAE (Bhattacharyya et al., 2020) | 2019 | 12.60 | 22.30 |
| P2TIRL (Deo & Trivedi, 2021) | 2020 | 12.58 | 22.07 |
| PECNet (Mangalam et al., 2020b) | 2020 | 9.96 | 15.88 |
| Y-Net (Mangalam et al., 2020a) | 2021 | 7.85 | 11.85 |
| -Net (Wong et al., 2022) | 2022 | 7.12 | 11.39 |
| NSP-SFM (Yue et al., 2023) | 2022 | 6.52 | 10.61 |
| G-PECNet | 2022 | 26.75 | 9.04 |
3 Method
3.1 Augmenting with RL Synthetic Trajectories
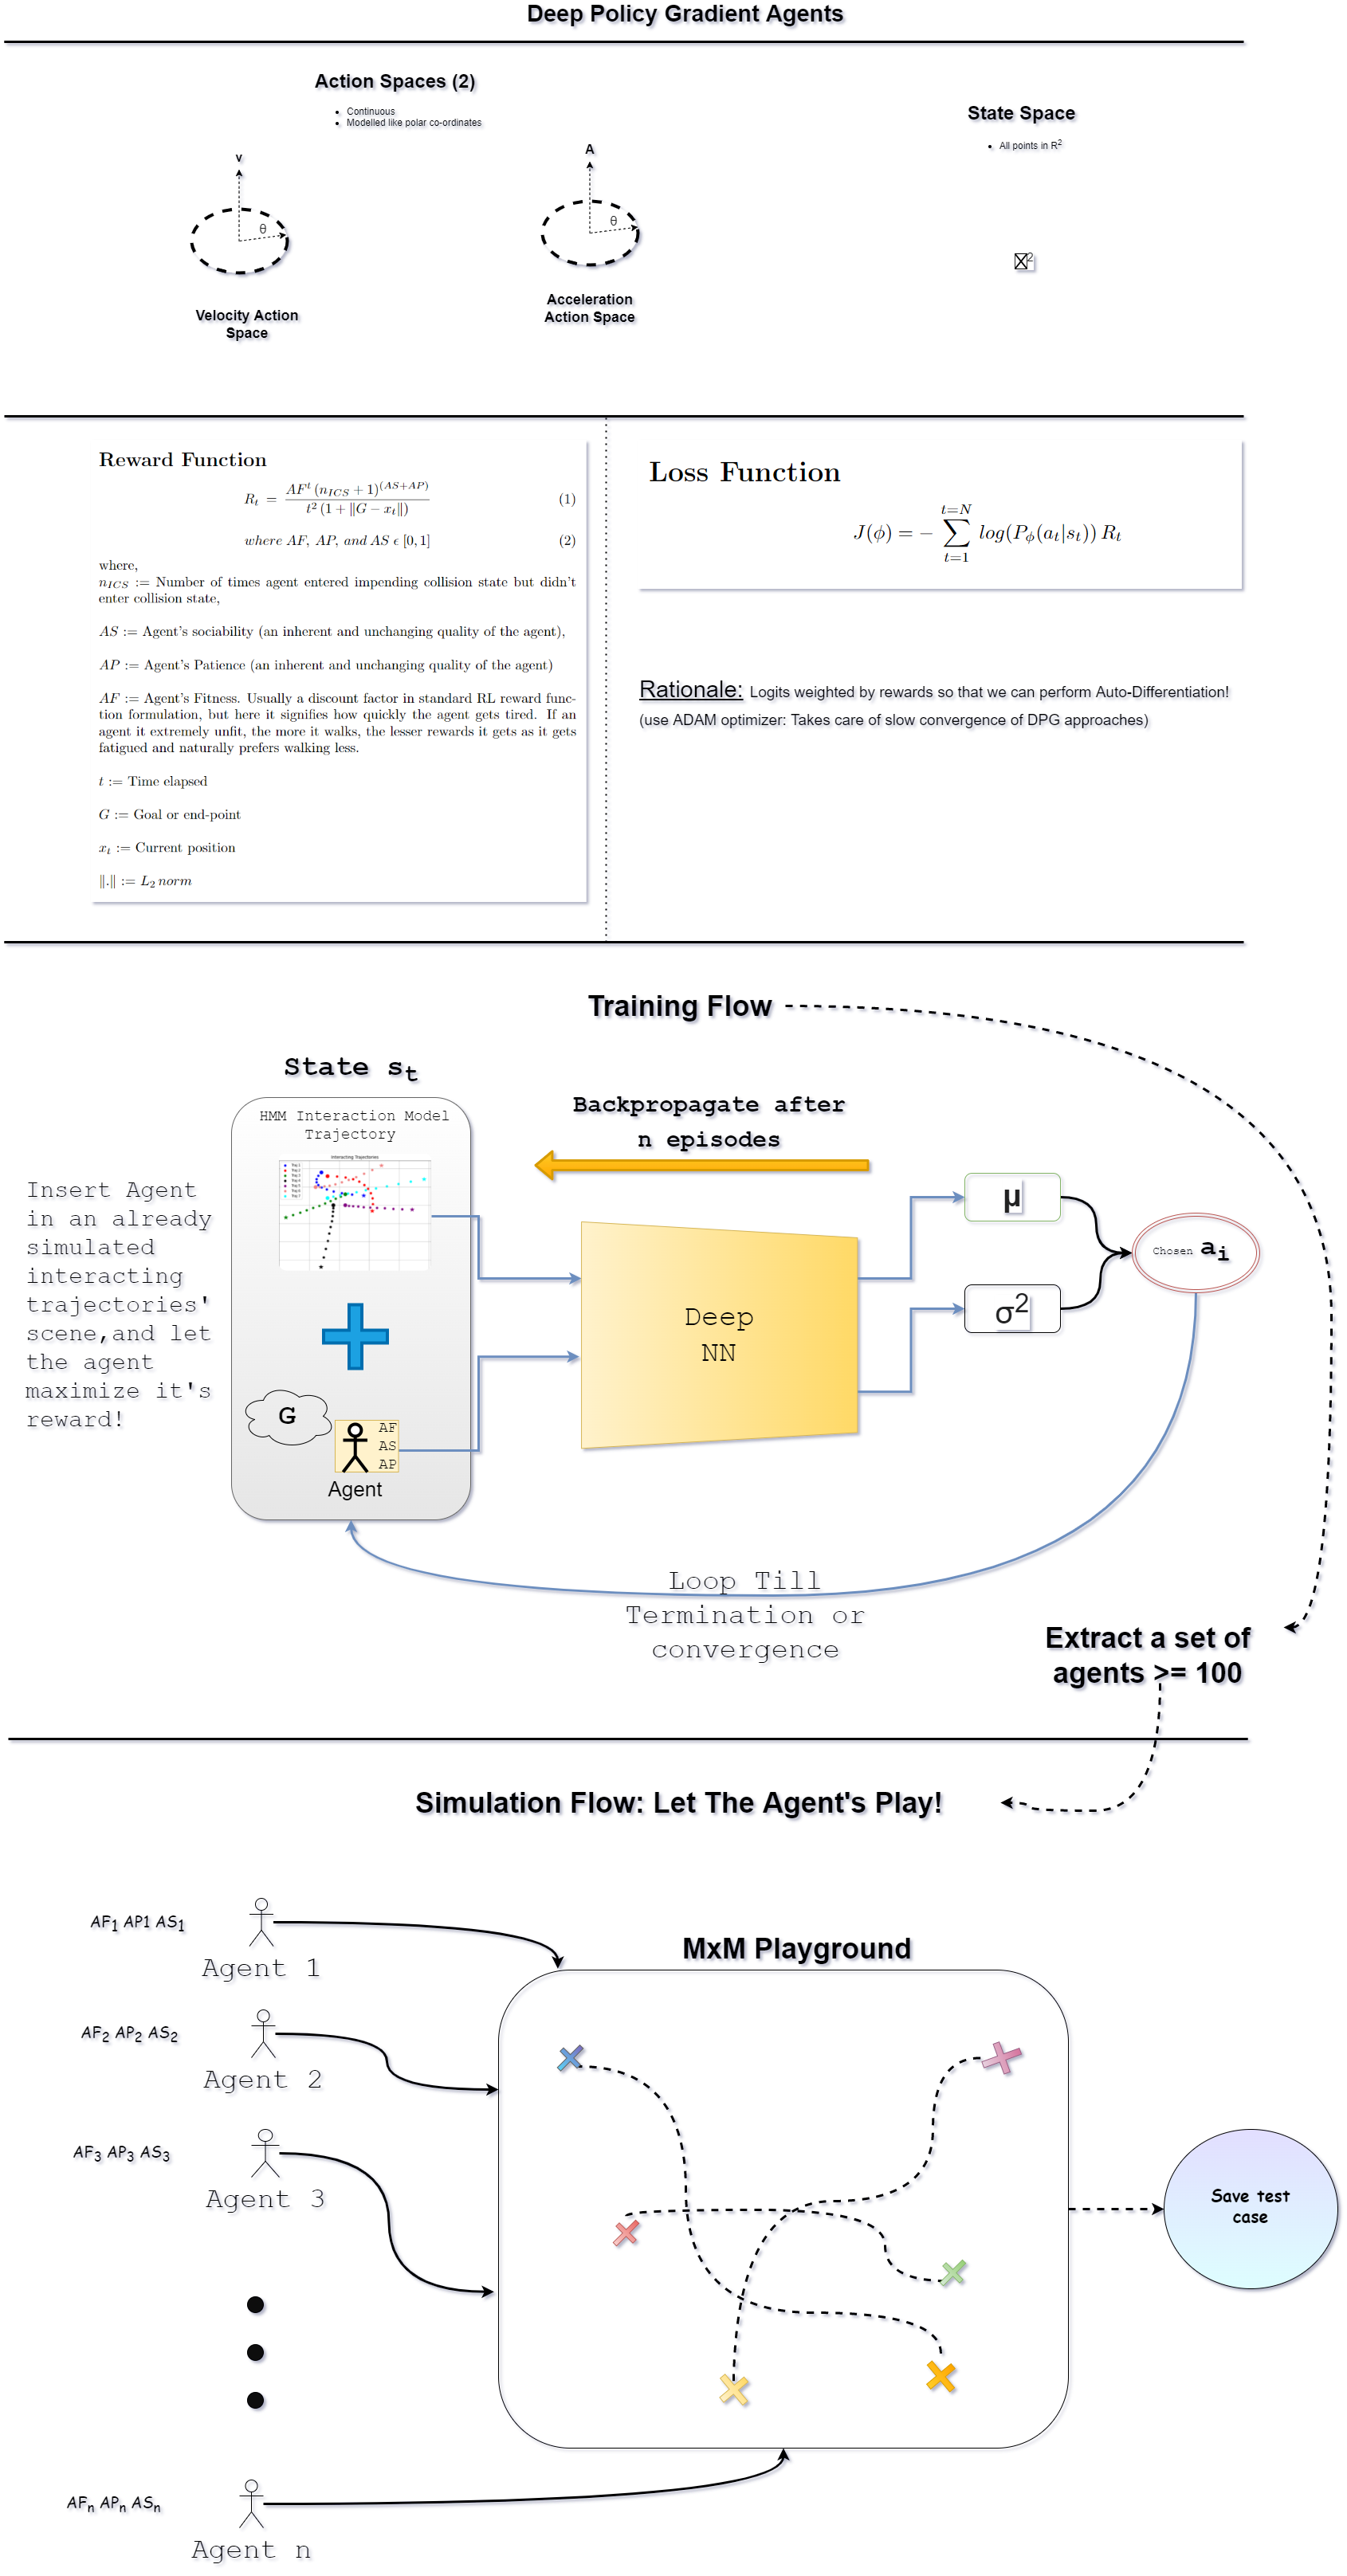
Synthetic trajectories were created using traditional Newtonian equations of motion and interaction modeling using a Hidden Markov Model. Finally, we train RL-based bots/agents deployed in the aforementioned interaction (HMM) model using Deep Policy Gradients (DPG).
DPG agents were modeled with two major goals: reaching the destination quickly and avoiding collisions with fellow agents/pedestrians. Apart from acceleration, stopping for another crossing pedestrian (being considerate) was implicitly decided by the agent’s randomly pre-defined sociability, fitness, and patience attributes. We add a circular proximity (fixed radius) detection mechanism to penalize agents that collide with others in the playground.
Mathematically, the reward function at time step : for the agents to finally reach the goal is defined by where , , and . is the agent’s current position, and is the number of impending collision states. and are its sociability and patience respectively, determining its recklessness. : Agent’s Fitness enforces reaching the goal quickly. Finally, the loss function is the one used in standard deep-policy gradients methods: where, is parameterized by , a simple neural network that emulates the agent’s action and state space at any time . Training evolution is shown in figure 1.
3.2 Periodic Activation: SIREN Improvement
3.3 Trajectory Non-linearity & Outlier Detection Criterion: AbScore
We introduce a simple criterion: Abruptness Score or AbScore to measure the turns and variability or non-linearity in each trajectory. An areal-scaled (bounding box area) of the metric is used for outlier detection. More details in A.3.
URM Statement
The authors acknowledge that the first author of this work meets the URM criteria of ICLR 2024 Tiny Papers Track.
References
- Agarap (2018) Abien Fred Agarap. Deep learning using rectified linear units (relu), 2018. URL https://arxiv.org/abs/1803.08375.
- Alahi et al. (2016) Alexandre Alahi, Kratarth Goel, Vignesh Ramanathan, Alexandre Robicquet, Li Fei-Fei, and Silvio Savarese. Social lstm: Human trajectory prediction in crowded spaces. In Proceedings of the IEEE Conference on Computer Vision and Pattern Recognition (CVPR), June 2016.
- Bennewitz et al. (2002) Maren Bennewitz, Wolfram Burgard, and Sebastian Thrun. Learning motion patterns of persons for mobile service robots. In In Proceedings of the IEEE International Conference on Robotics and Automation (ICRA, pp. 3601–3606, 2002.
- Bhattacharyya et al. (2020) Apratim Bhattacharyya, Michael Hanselmann, Mario Fritz, Bernt Schiele, and Christoph-Nikolas Straehle. Conditional flow variational autoencoders for structured sequence prediction, 2020.
- Brand et al. (1997) M. Brand, N. Oliver, and A. Pentland. Coupled hidden markov models for complex action recognition. In Proceedings of IEEE Computer Society Conference on Computer Vision and Pattern Recognition, pp. 994–999, 1997. doi: 10.1109/CVPR.1997.609450.
- Deo & Trivedi (2021) Nachiket Deo and Mohan M. Trivedi. Trajectory forecasts in unknown environments conditioned on grid-based plans, 2021.
- Gupta et al. (2018) Agrim Gupta, Justin Johnson, Li Fei-Fei, Silvio Savarese, and Alexandre Alahi. Social gan: Socially acceptable trajectories with generative adversarial networks, 2018.
- Ho et al. (2020) Jonathan Ho, Ajay Jain, and Pieter Abbeel. Denoising diffusion probabilistic models, 2020.
- Kingma & Welling (2013) Diederik P Kingma and Max Welling. Auto-encoding variational bayes, 2013. URL https://arxiv.org/abs/1312.6114.
- Lee et al. (2017) Namhoon Lee, Wongun Choi, Paul Vernaza, Christopher B. Choy, Philip H. S. Torr, and Manmohan Chandraker. Desire: Distant future prediction in dynamic scenes with interacting agents, 2017.
- Lerner et al. (2007) Alon Lerner, Yiorgos Chrysanthou, and Dani Lischinski. Crowds by example. Computer Graphics Forum, 26, 2007.
- Li et al. (2019) Jiachen Li, Hengbo Ma, and Masayoshi Tomizuka. Conditional generative neural system for probabilistic trajectory prediction, 2019.
- Mangalam et al. (2020a) Karttikeya Mangalam, Yang An, Harshayu Girase, and Jitendra Malik. From goals, waypoints and paths to long term human trajectory forecasting, 2020a.
- Mangalam et al. (2020b) Karttikeya Mangalam, Harshayu Girase, Shreyas Agarwal, Kuan-Hui Lee, Ehsan Adeli, Jitendra Malik, and Adrien Gaidon. It is not the journey but the destination: Endpoint conditioned trajectory prediction. CoRR, abs/2004.02025, 2020b. URL https://arxiv.org/abs/2004.02025.
- Pellegrini et al. (2009) S. Pellegrini, A. Ess, K. Schindler, and L. van Gool. You’ll never walk alone: Modeling social behavior for multi-target tracking. In 2009 IEEE 12th International Conference on Computer Vision, pp. 261–268, 2009. doi: 10.1109/ICCV.2009.5459260.
- Robicquet et al. (2016) A. Robicquet, A. Sadeghian, A. Alahi, and S. Savarese. Learning social etiquette: Human trajectory prediction in crowded scenes. 2016. URL http://cvgl.stanford.edu/projects/uav_data/.
- Sadeghian et al. (2018) Amir Sadeghian, Vineet Kosaraju, Ali Sadeghian, Noriaki Hirose, S. Hamid Rezatofighi, and Silvio Savarese. Sophie: An attentive gan for predicting paths compliant to social and physical constraints, 2018.
- Sitzmann et al. (2020) Vincent Sitzmann, Julien N. P. Martel, Alexander W. Bergman, David B. Lindell, and Gordon Wetzstein. Implicit neural representations with periodic activation functions, 2020. URL https://arxiv.org/abs/2006.09661.
- Wong et al. (2022) Conghao Wong, Beihao Xia, Ziming Hong, Qinmu Peng, Wei Yuan, Qiong Cao, Yibo Yang, and Xinge You. View vertically: A hierarchical network for trajectory prediction via fourier spectrums, 2022.
- Yue et al. (2023) Jiangbei Yue, Dinesh Manocha, and He Wang. Human trajectory prediction via neural social physics, 2023.
Appendix A Appendix
A.1 Deep Policy Gradient Per Agent Network
We use a simple fully connected ReLU-activated neural network (nodes: 8 16 8 4) with 8 inputs: current -coordinate, current -coorinate, -goal, -goal, fitness, patience, sociability, and distance to nearest person/agent and 4 output nodes defining the action space: the speed, direction, acceleration magnitude and acceleration direction to take another step. An overview of the whole workflow can be found in Fig 2.
HMMs were considered for the interaction modeling due to their high success in spatiotemporal tasks (Brand et al., 1997).
| Unique Points | Trajectories | % dataset |
|---|---|---|
| 1 | 145 | 5.13% |
| 2 | 62 | 2.19 % |
| 3 | 71 | 2.51 % |
| 4 | 69 | 2.44% |
| 5 | 57 | 2.01% |
| 6 | 41 | 1.45% |
| 7 | 51 | 1.80% |
| 8 | 28 | 0.99% |
| 9 | 26 | 0.92% |
| 10 | 24 | 0.85% |
| 11 | 22 | 0.78% |
| 12 | 25 | 0.88% |
| 13 | 17 | 0.60% |
| 14 | 24 | 0.85% |
| 15 | 22 | 0.78% |
| 16 | 22 | 0.78% |
| 17 | 39 | 1.38% |
| 18 | 30 | 1.06% |
| 19 | 76 | 2.69% |
| 20 | 1978 | 69.92% |
Based on the quantitative (table: 2), we augmented the training dataset to keep the statistical properties of the training dataset intact.
A.2 Ablation Studies
We performed two ablation studies. First, by decoupling the ADE and the FDE metrics. See table 3.
| Learning Rate | ADE | FDE | Best FDE epoch |
|---|---|---|---|
| 0.001 | 50 | 15.68 | 457 |
| 0.0005 | 50 | 15.76 | 301 |
| 0.0003 | 50 | 15.9 | 541 |
| 0.0002 | 50 | 15.65 | 420 |
| 0.0001 | 50 | 15.92 | 391 |
Second, without the standardization parameter on the input trajectories. We note an adverse effect on ADE and a significant state-of-the-art improvement on FDE, by removing standardization. See table 4 and figure LABEL:fig:no_std_plots.
| Learning Rate | ADE | FDE | Best FDE epoch |
|---|---|---|---|
| 0.001 | 22.20 | 9.32 | 915 |
| 0.0005 | 29.91 | 9.05 | 834 |
| 0.0003 | 25.92 | 9.37 | 998 |
| 0.0002 | 26.75 | 9.04 | 908 |
| 0.0001 | 25.57 | 9.05 | 235 |
We notice an absurdity in PECNet’s codebase where the standardization parameter() is also dividing the ADE metric. We remove that division for G-PECNet and report fair metrics.
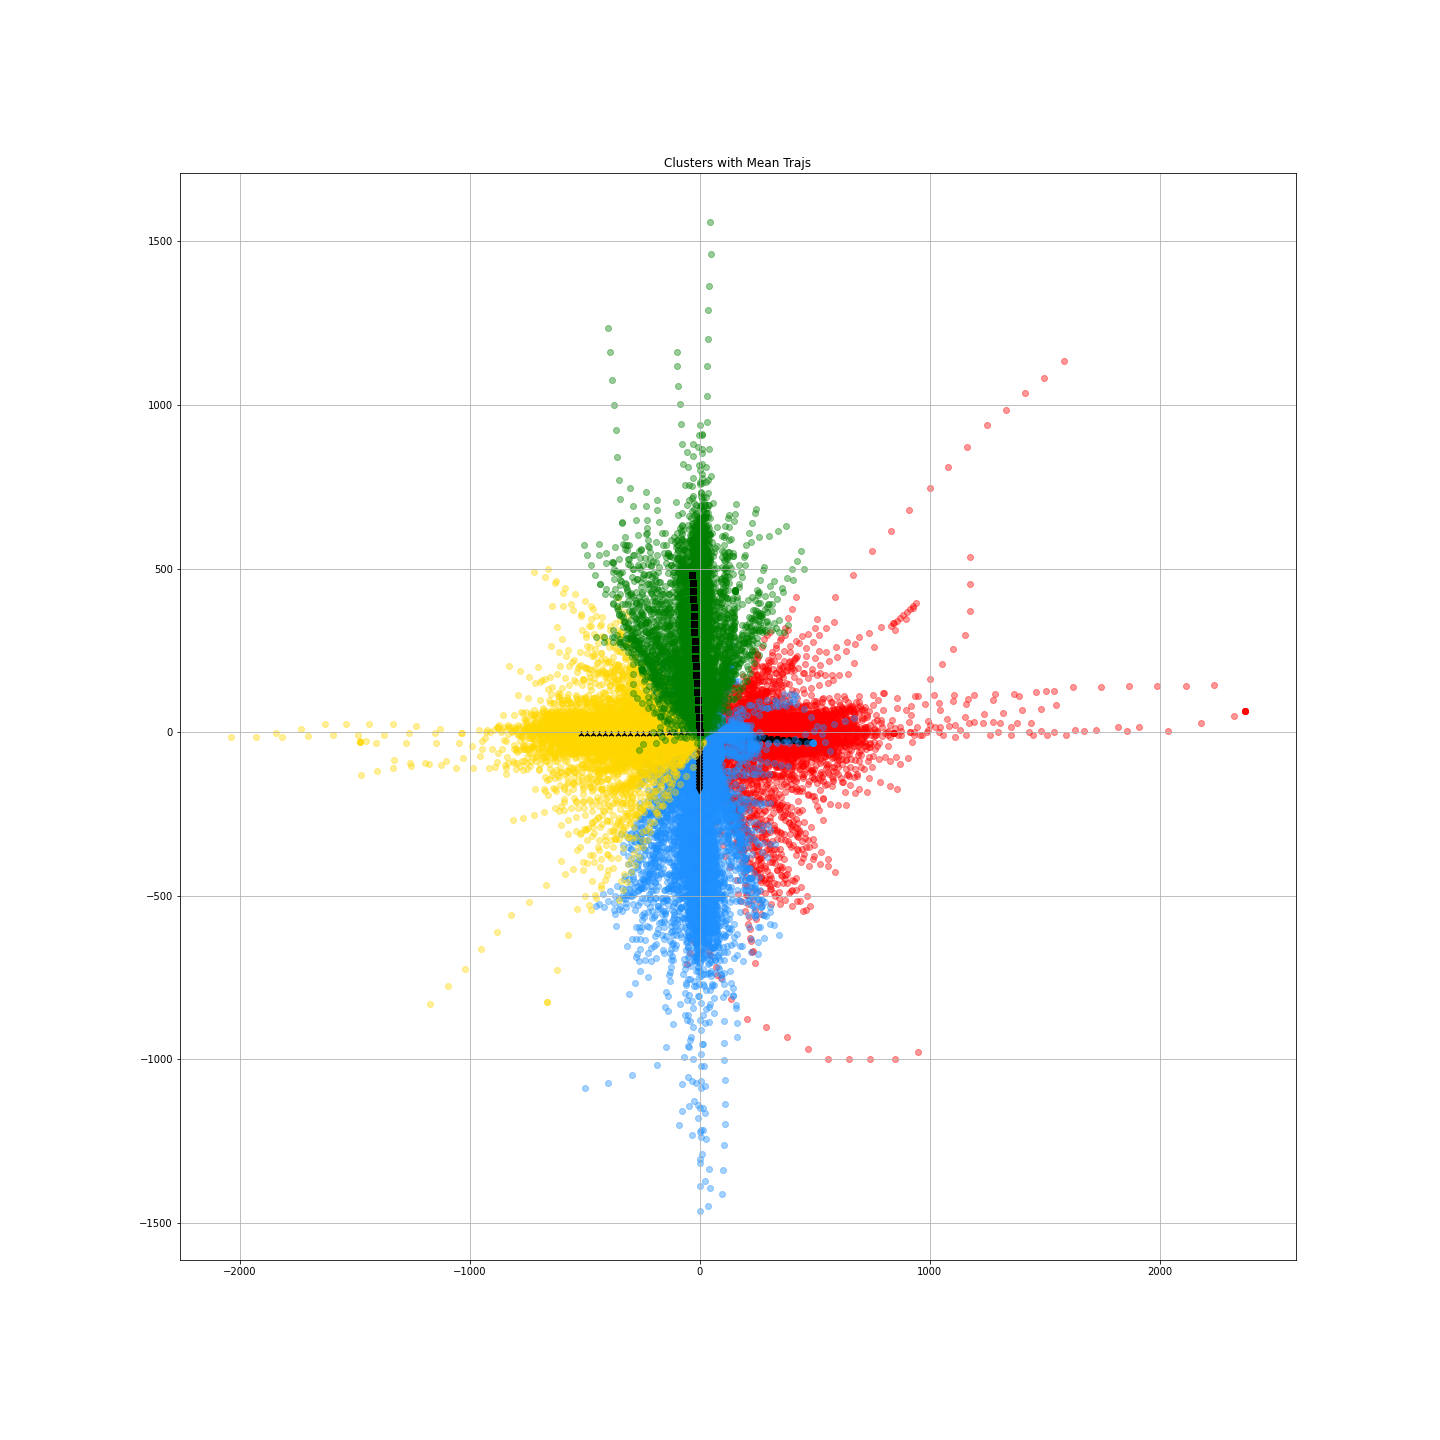
A.3 Non-linearity analysis: Abruptness-Score
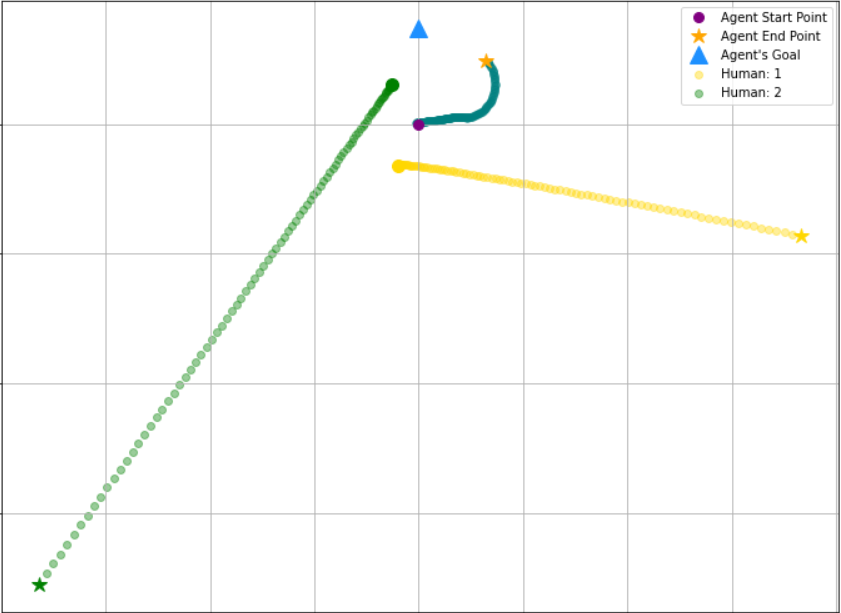
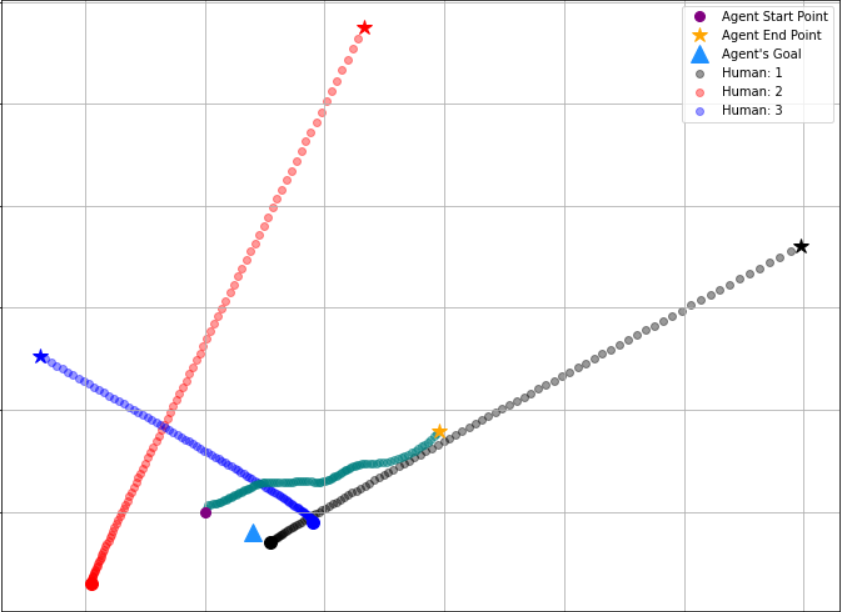
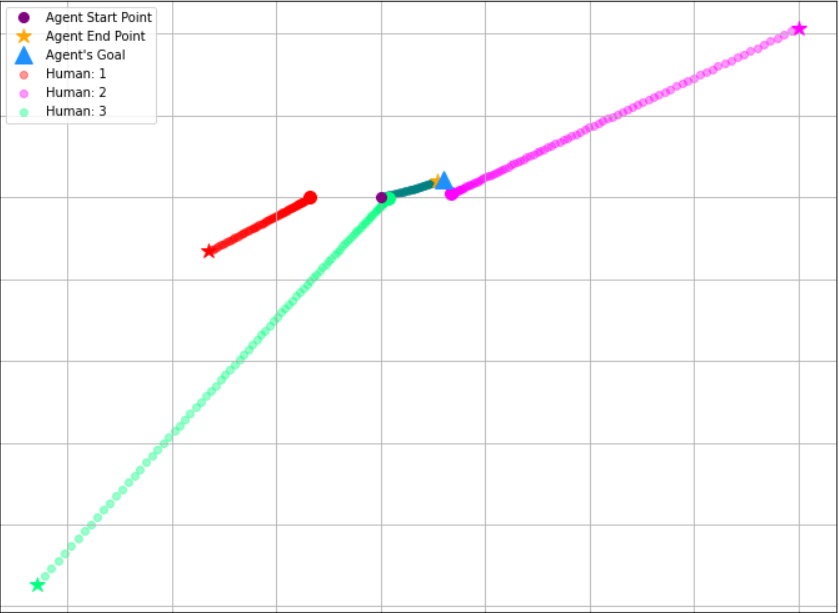
We clustered SDD’s trajectories (3) based on the bounding boxes to get an estimate of the maximal displacement and turn in each trajectory. Based on this information, we introduce a novel and simple metric: Abruptness Score to measure the turns and variability or non-linearity in each trajectory. An areal-scaled and an unscaled version of the metric is used for analysis and outlier detection. The intuition and mathematical formulation are as follows:
In the example figure 4, the trajectories and are shown. The dotted blue line is normal to the red danger zone. Points that fall under this danger zone will form an obtuse turn trajectory like . Naturally, we want the score to assign a larger value to than since the turn is huge and the trajectory (more) abruptly changes direction.
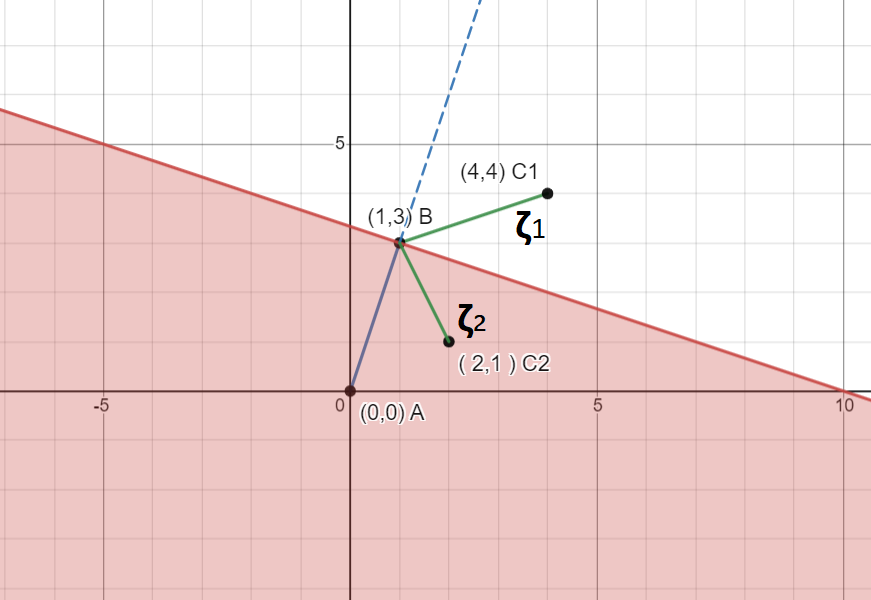
Mathematically,
| (1) |
where
| (2) |
| (3) |
If is obtuse, we add to before sending it to equation 1.
For scaling we simply divide the abruptness score by the area of the tightest-bounding-box of the trajectory or divide by . For perfectly linear trajectories, we use the length of the trajectory for scaling.
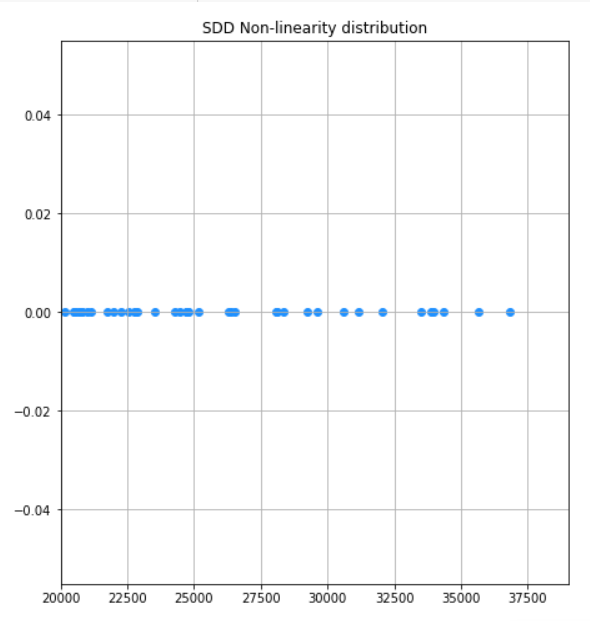
We need areal-scaling to get an unbiased estimate of trajectories’ non-linearity that spans widely different sizes or regions. Based on this metric we analyze SDD and report that the trajectories are not non-linear on average however the distribution contains outliers with huge non-linearity scores. This analysis provided us with an estimate of the dataset’s non-linearity for synthetic dataset generation purposes. See table 5 and figure 5.
| Statistic | Value |
|---|---|
| Maximum | 494866.374 |
| Minimum | 0.0 |
| Mean | 3430.665 |
| Std. Deviation | 11987.34 |