Coresets for Defense Against Data Poisoning Attacks
(Draft)
1 Data Poisoning Attacks
1.1 From Scratch Training
In the from-scratch training setting, Gradient Matching (geiping2021witches) is the strongest data poisoning method. The reported success rate of its poisoned CIFAR10 (budget ) on ResNet-18 over 100 trials is 45%.
We tested first 50 datasets (numbered as #0-#49) provided by the authors. Out of these 50 poisoned CIFAR10, #1, 6, 11, 13, 14, 19, 20, 23, 24, 25, 26, 27, 29, 34, 35, 40, 42, 43, 48, 49 successfully poisoned the models when evaluated in the benchmark setting. Among these datasets, the target of #1 #23, #24, #27, #29, #35 cannot be classified correctly with a high confidence with 40-epoch training.
1.2 Transfer Learning
For transfer learning, Bullseye Polytope (aghakhani2020bullseye) has the highest success rate in the white-box setting while Feature Collision (shafahi2018poison) is more effective in the black-box setting. We should expand our experiments to these two attack methods when we move onto the tranfer learning setting.
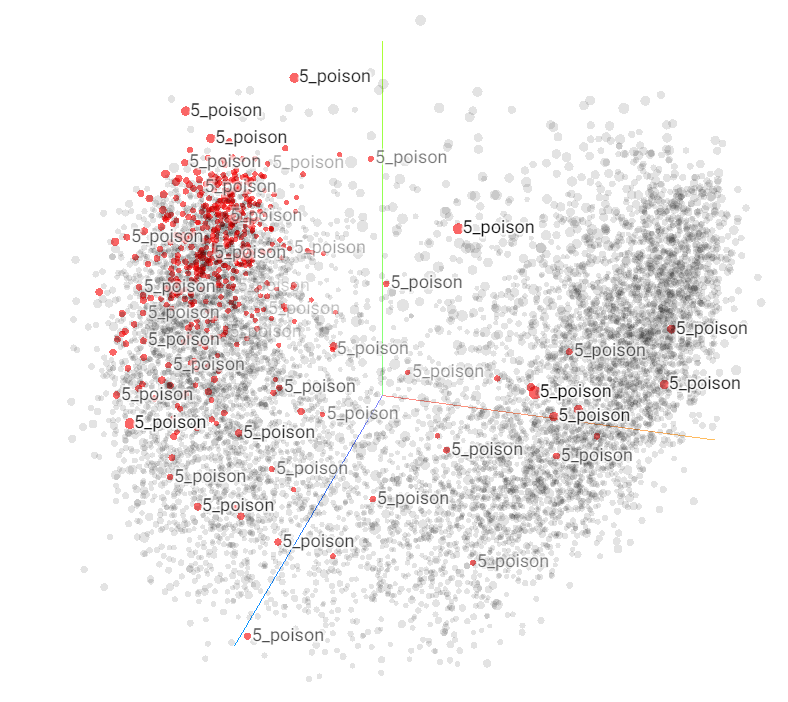
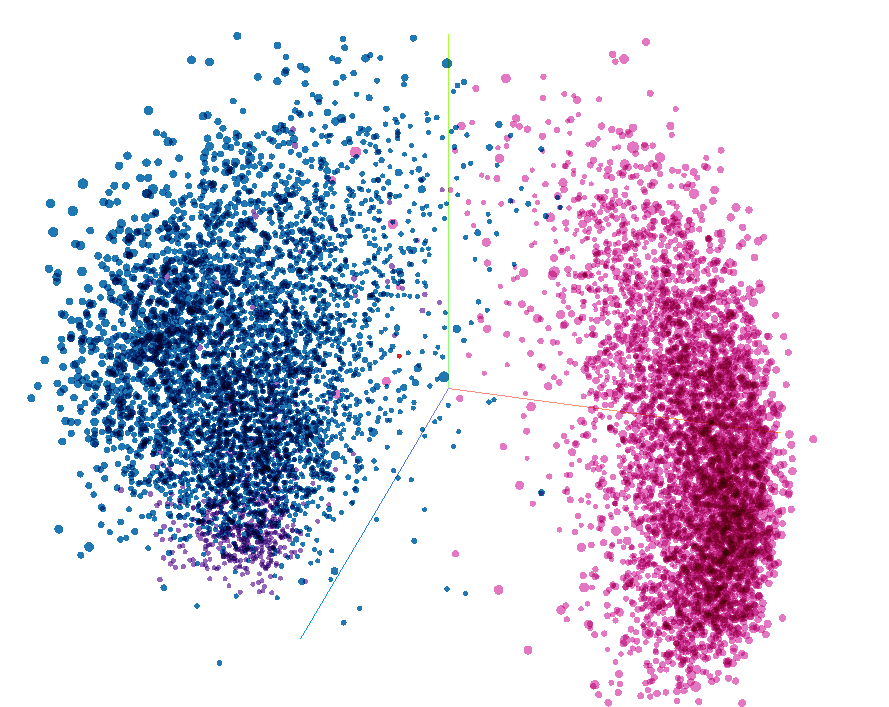
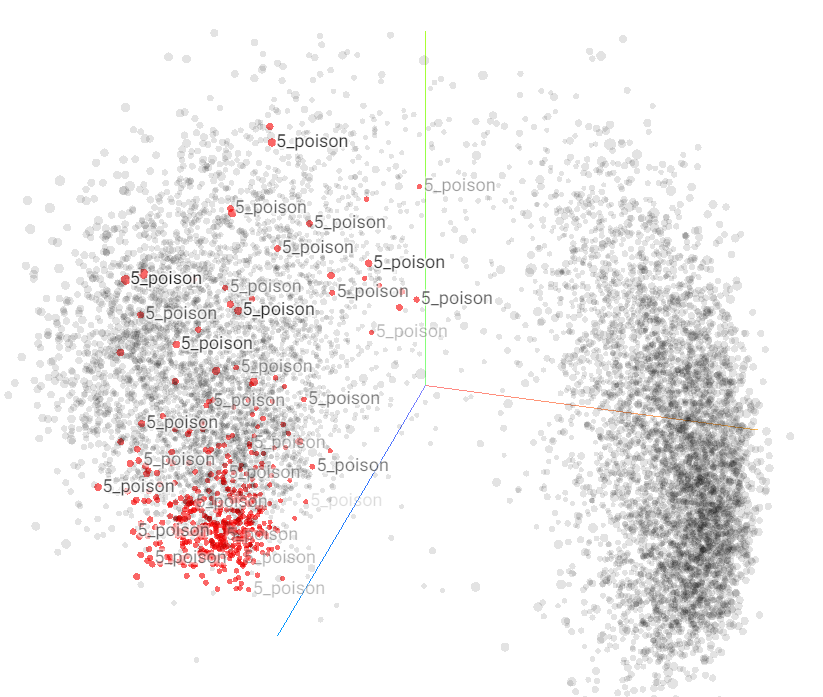
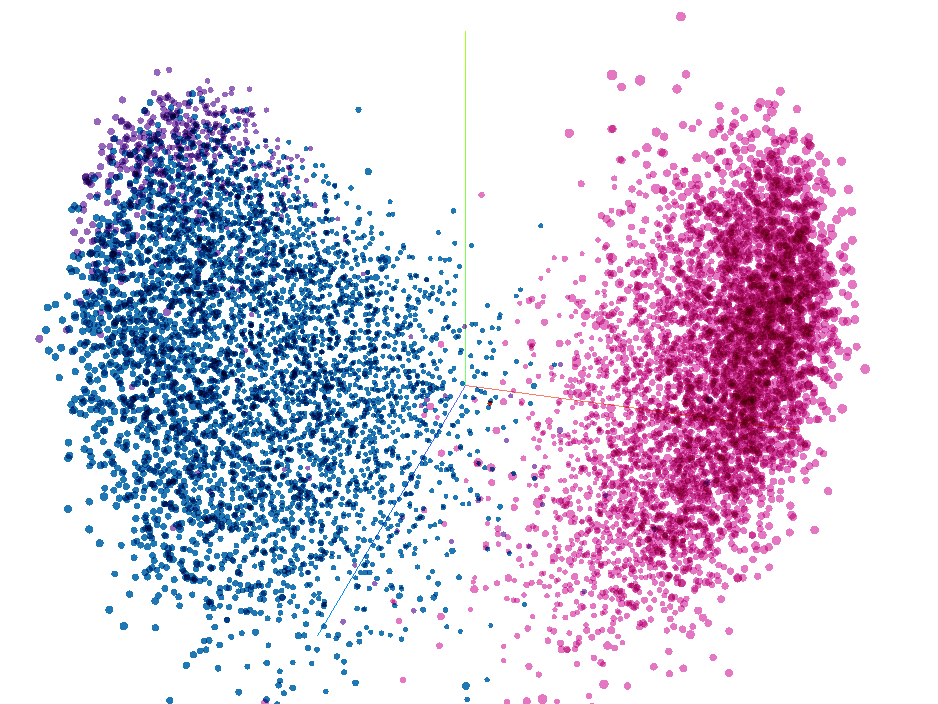
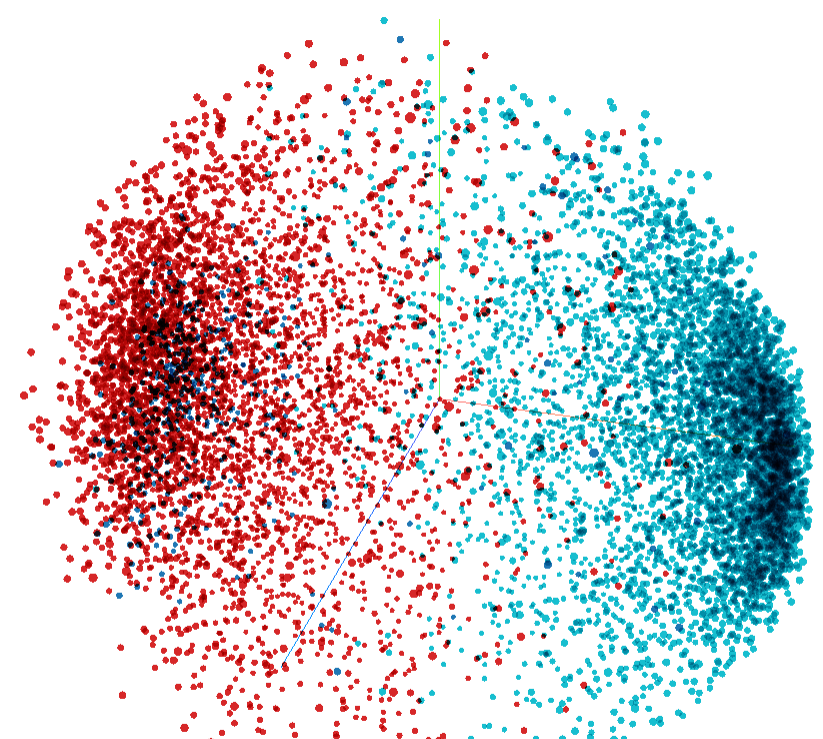
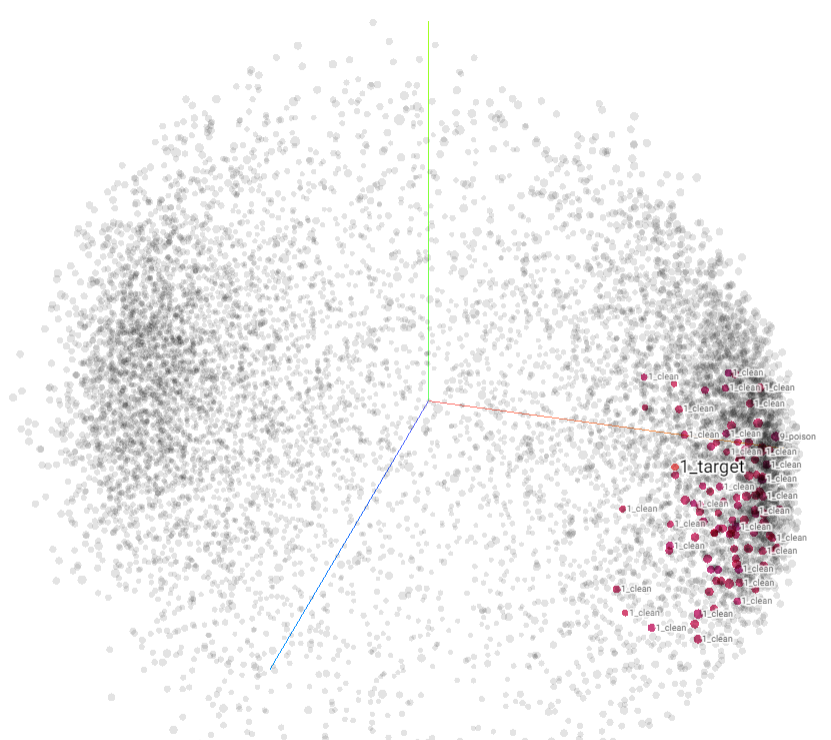
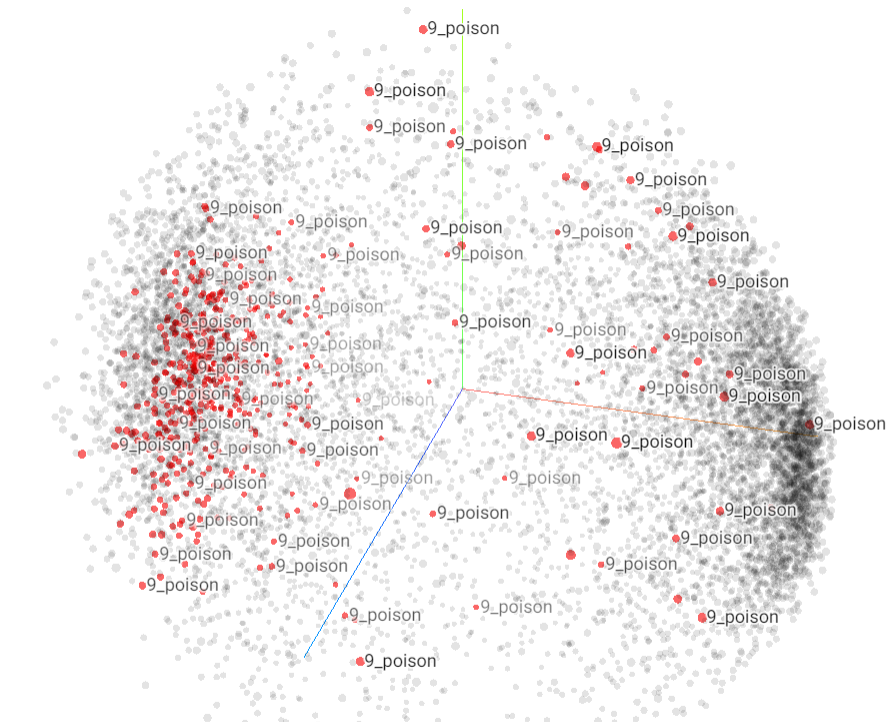
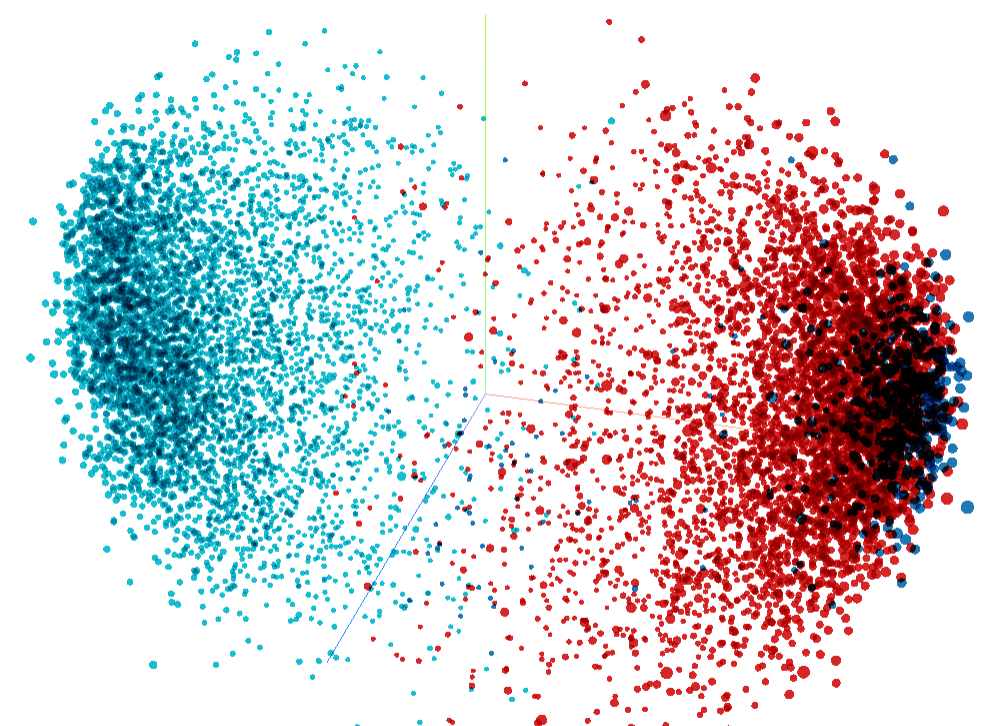
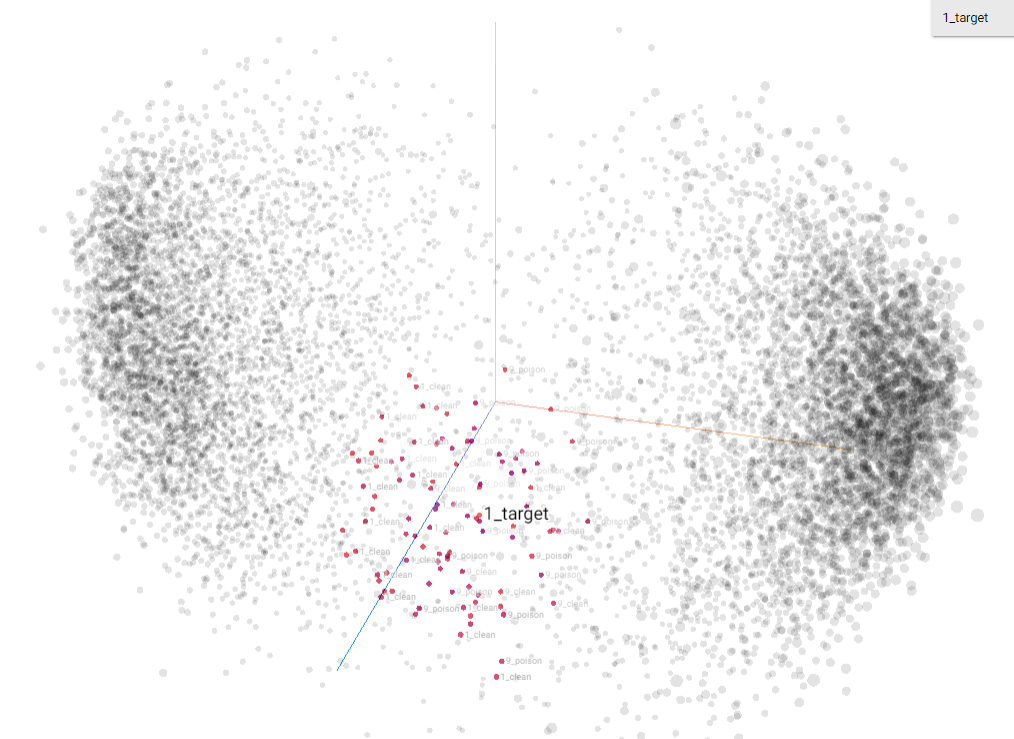
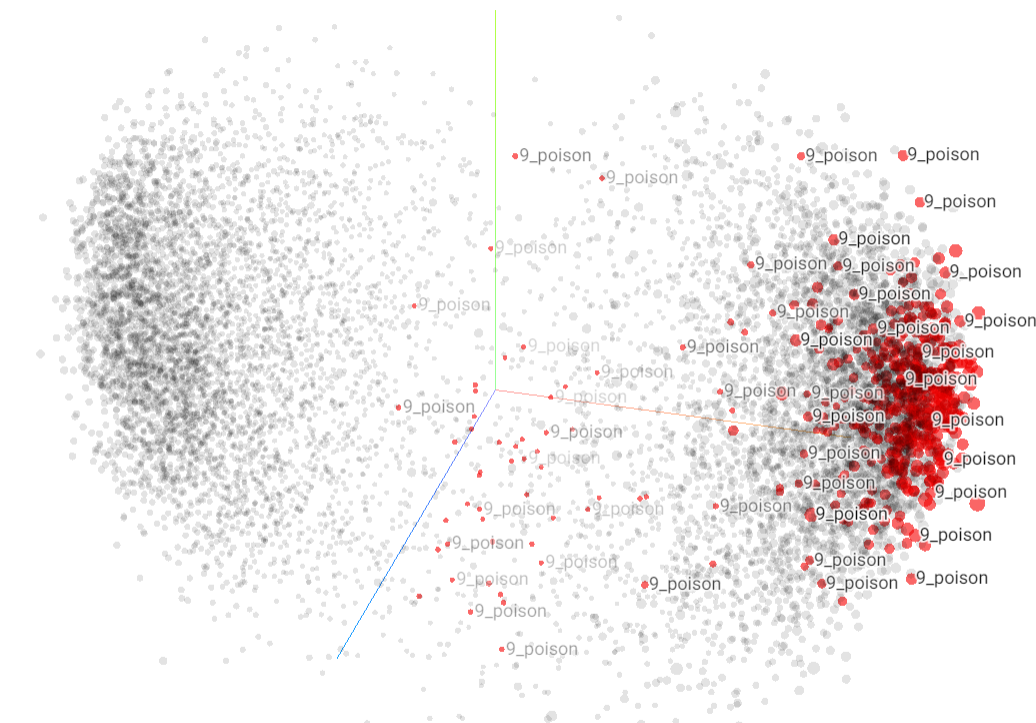
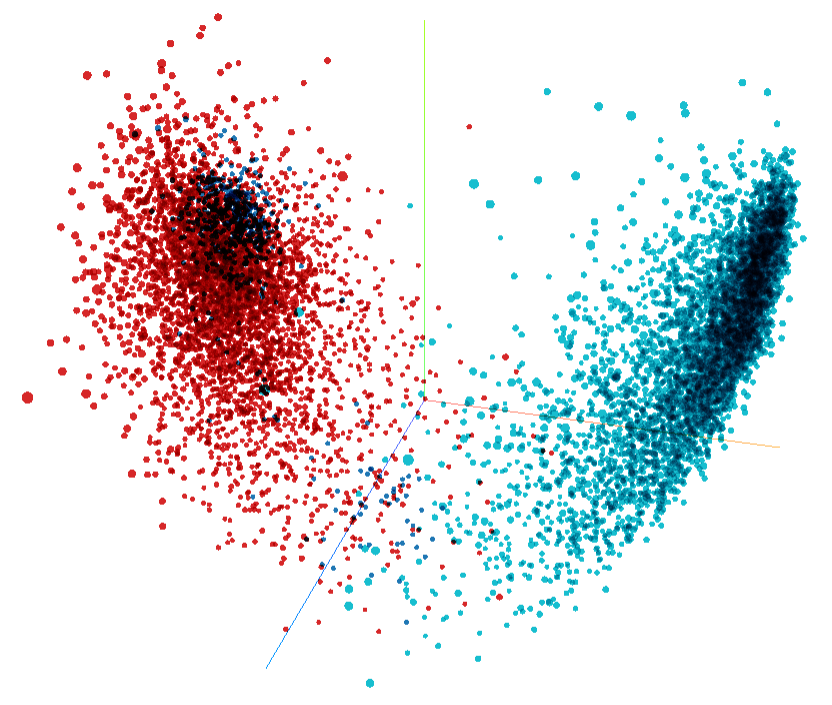
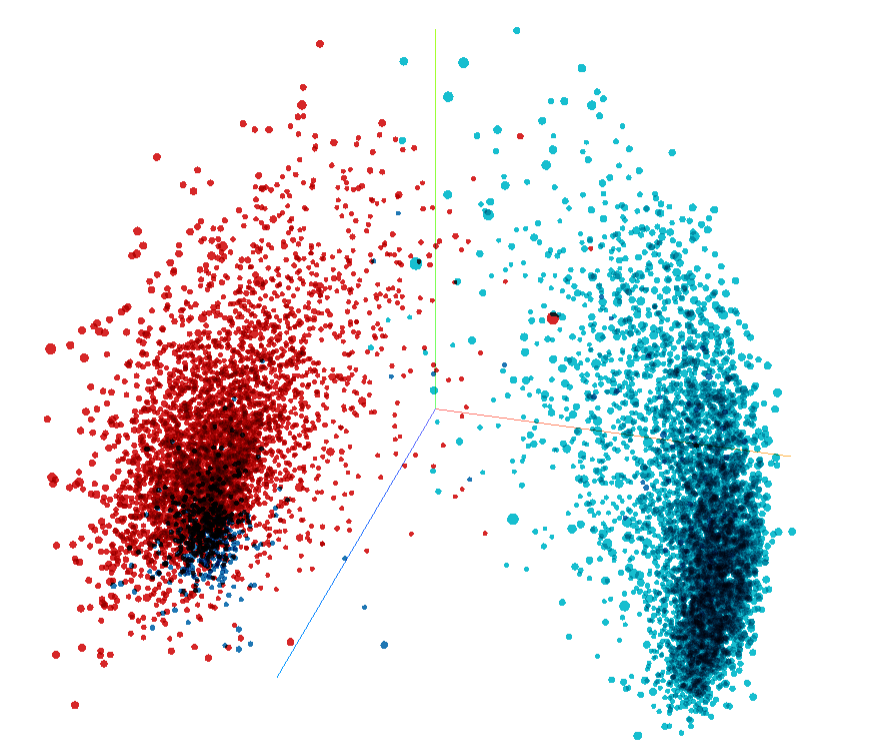
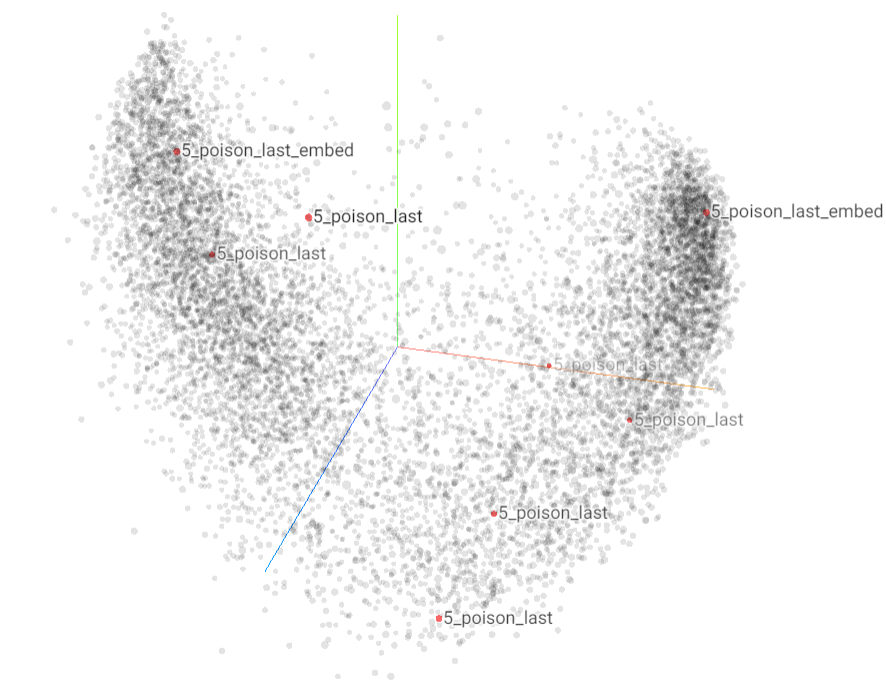
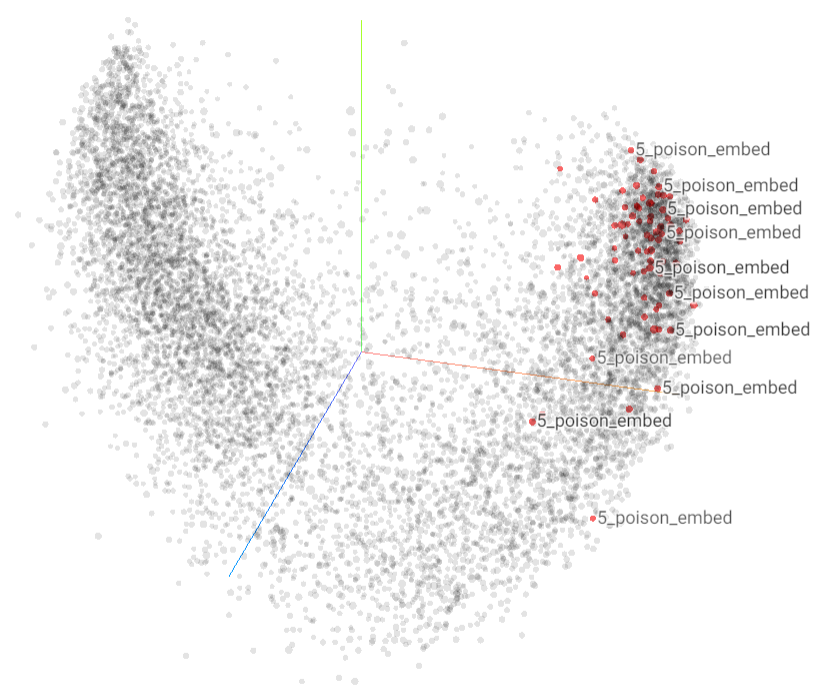
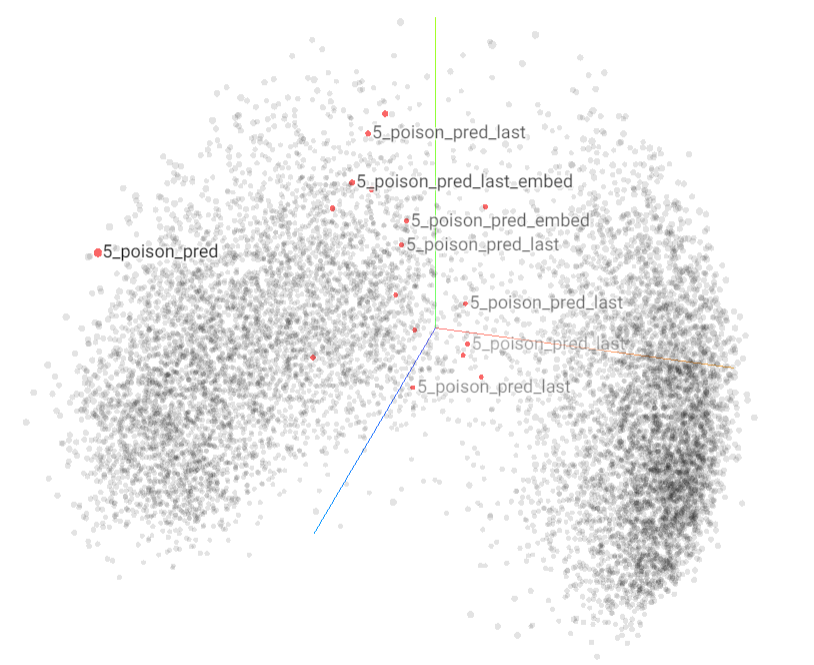
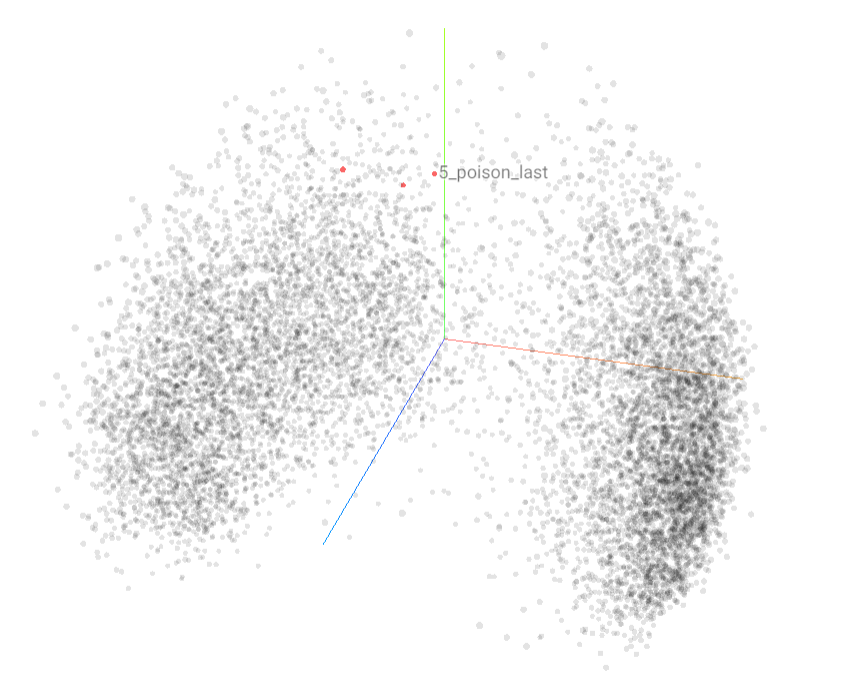
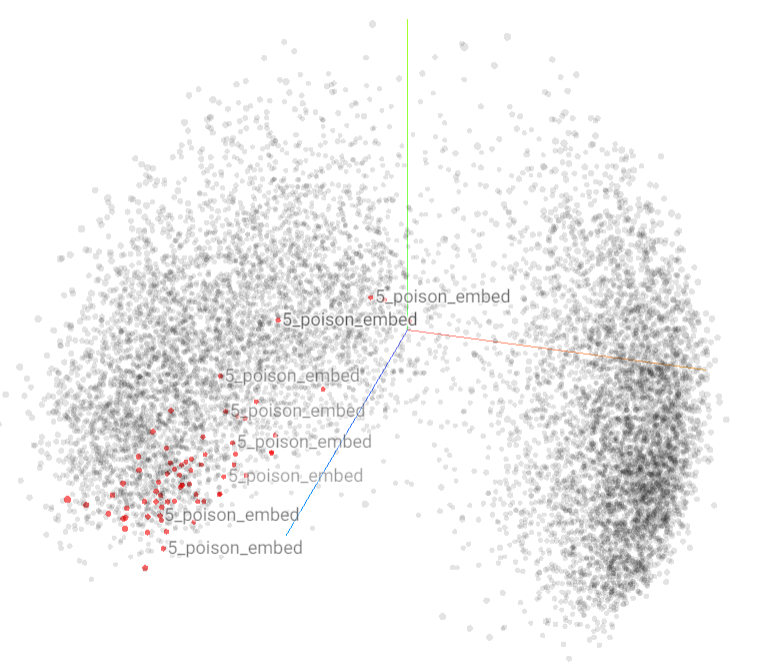
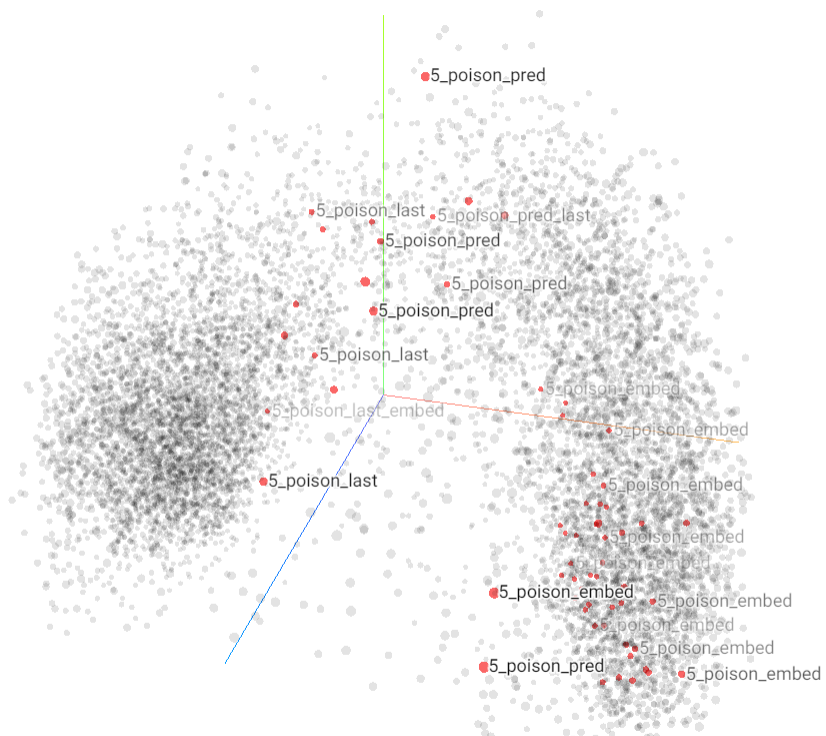
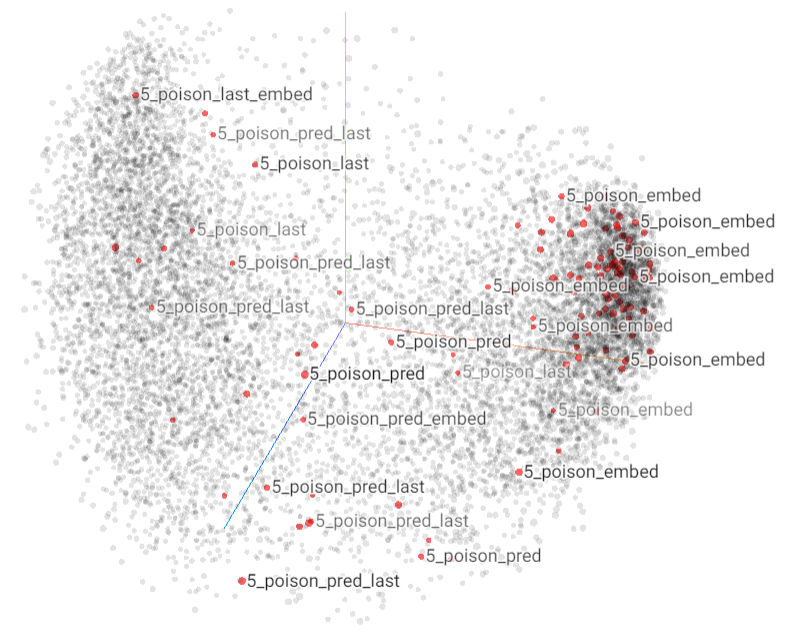
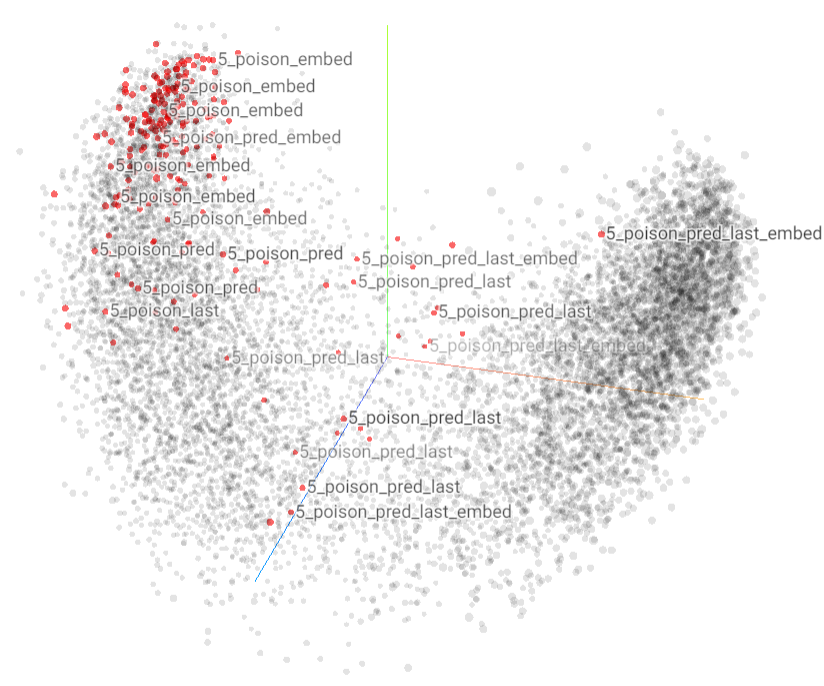
2 Visualizing the Poisons with Spherical PCA
2.1 Poisons in the Activation Space
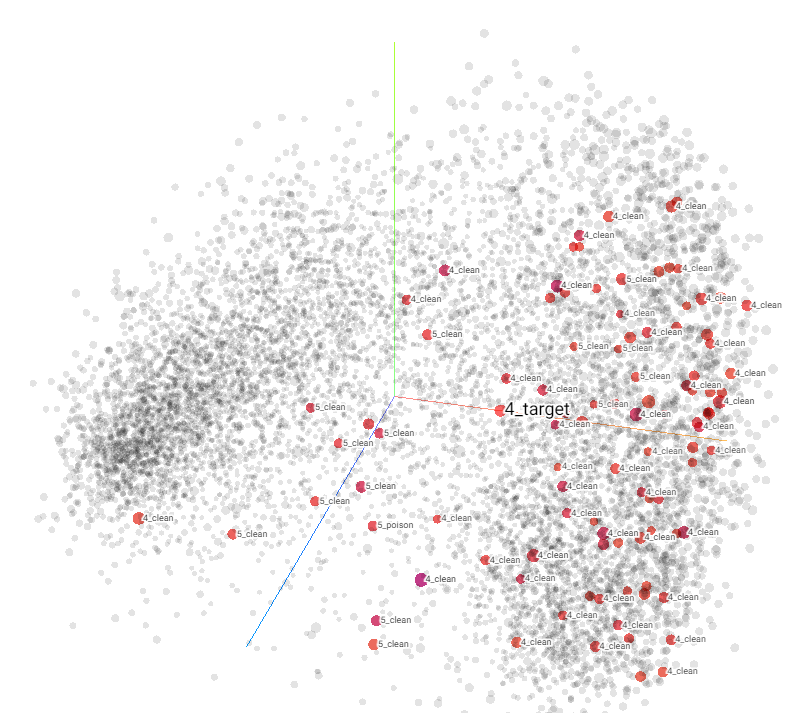
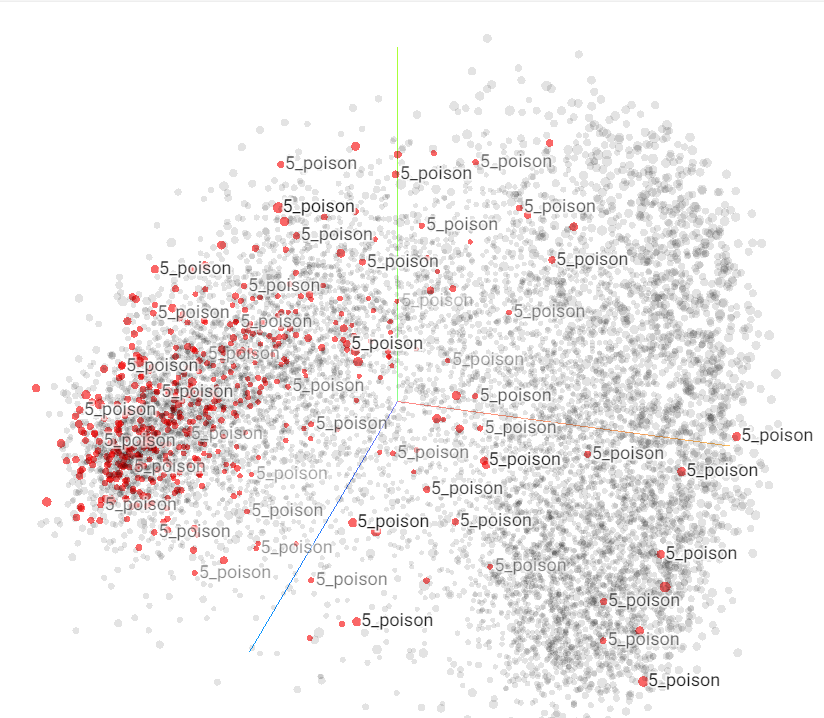
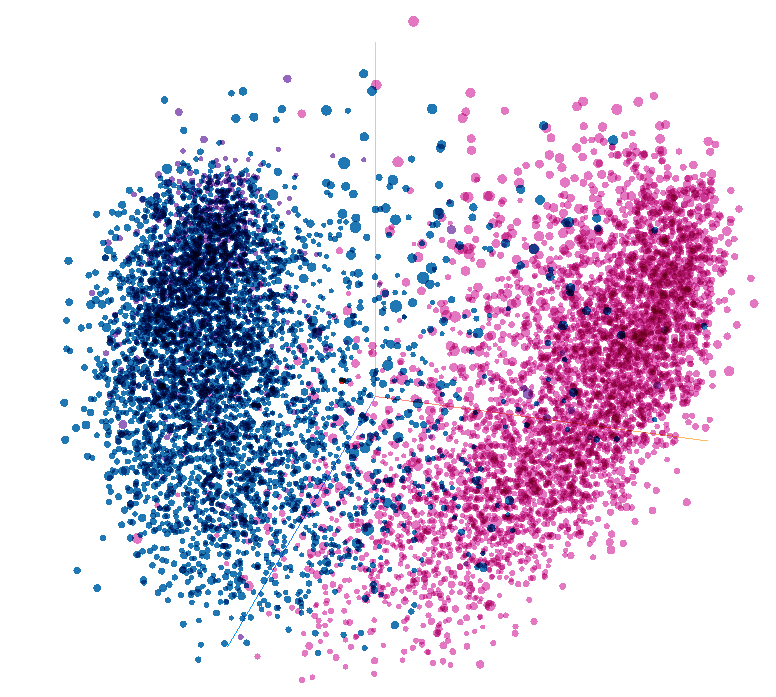
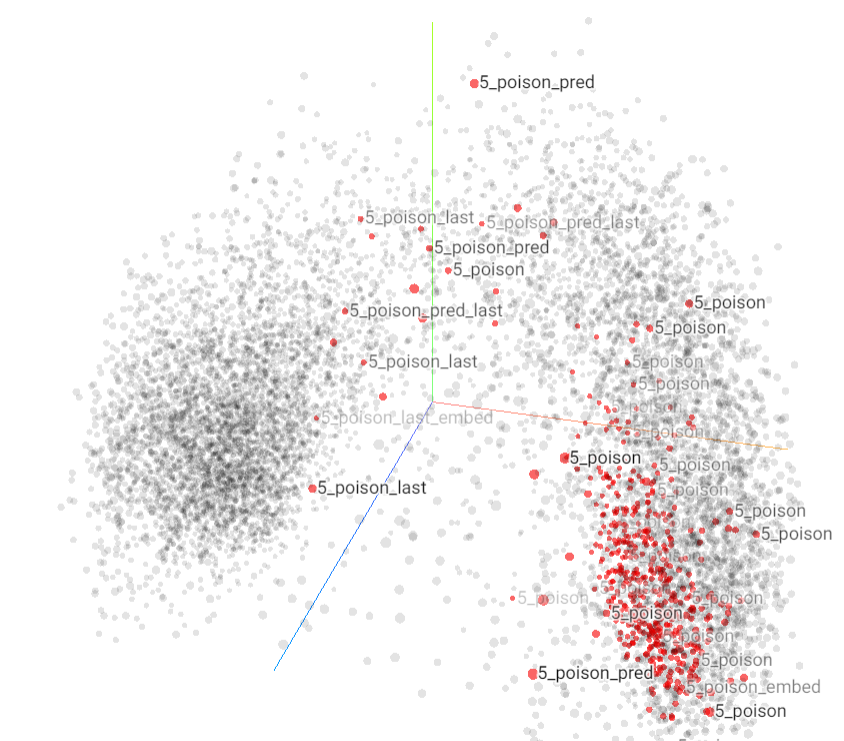
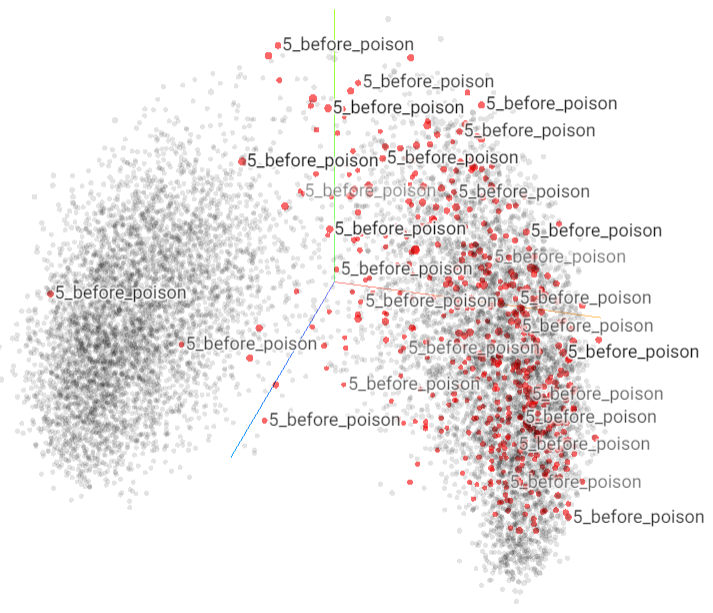
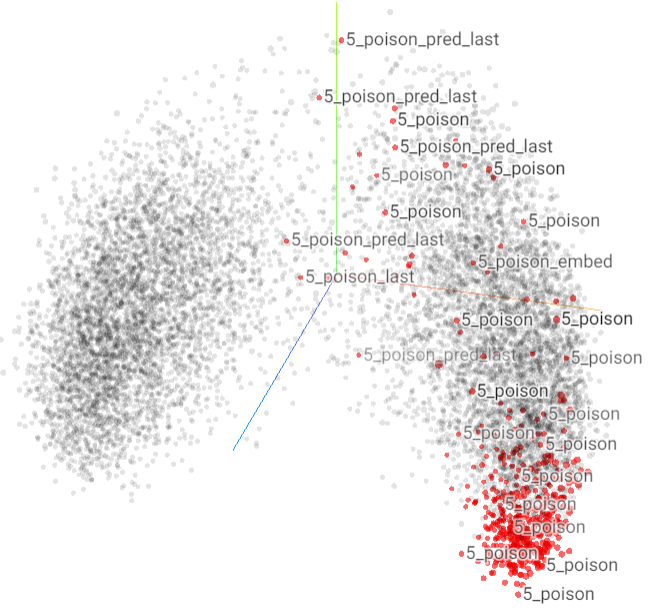
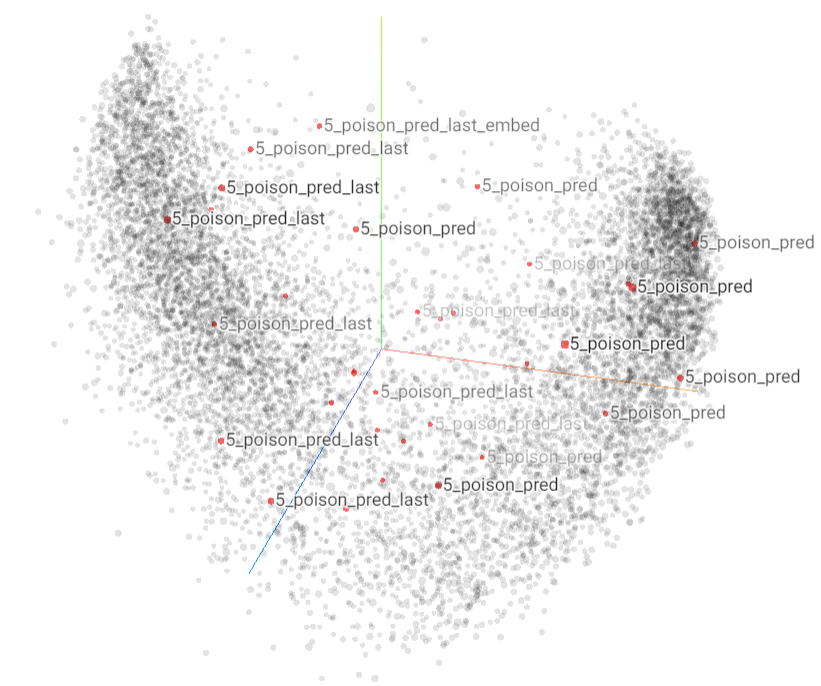
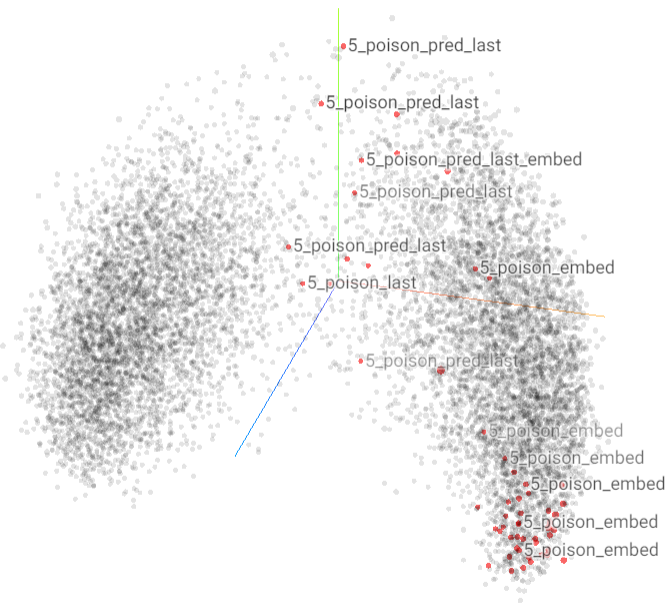
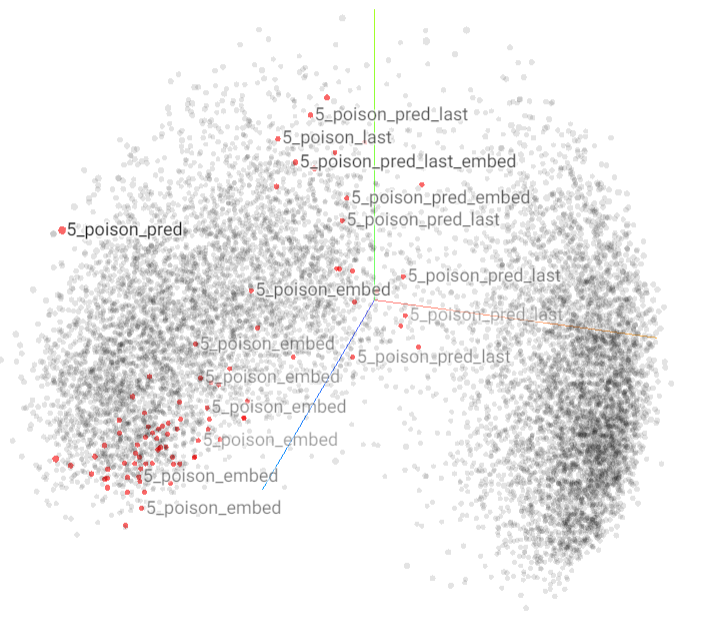
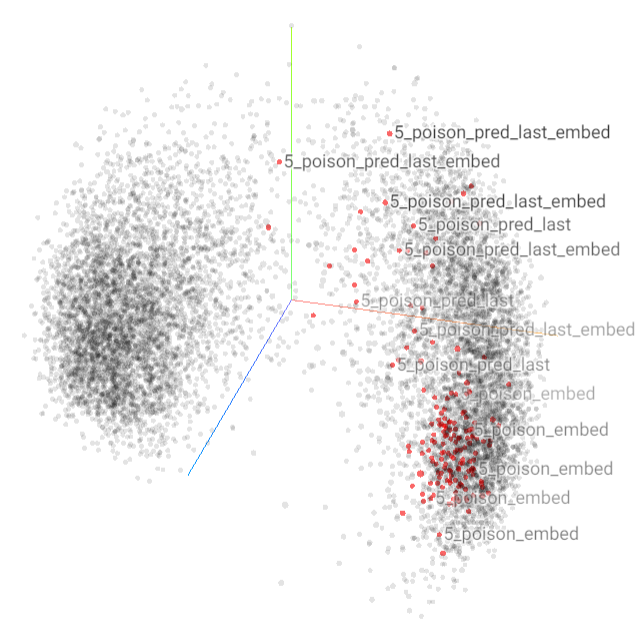
See Figure 1-6 in the next two pages. The data is normalized by shifting each point by the centroid and making it unit.
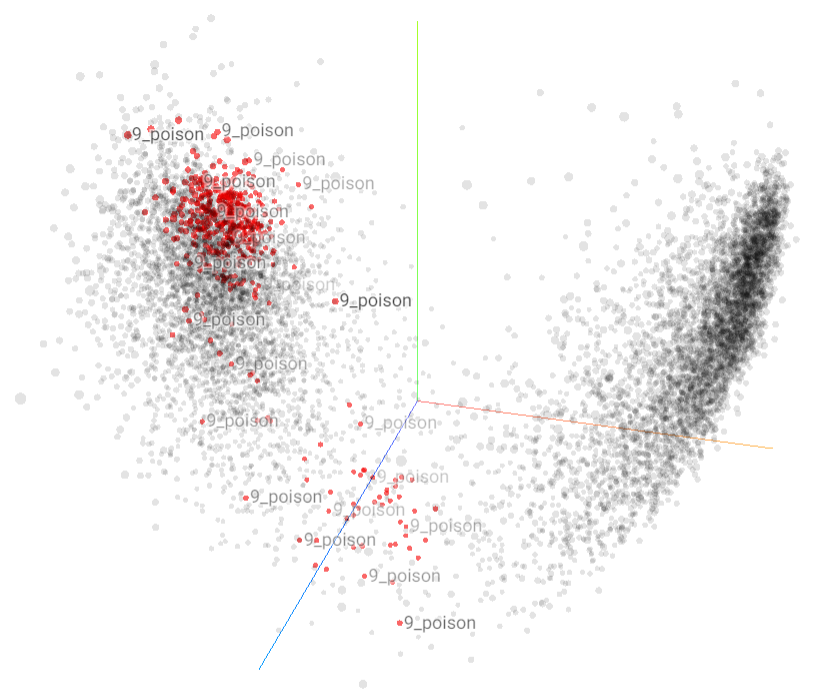
For both poisoned datasets (#1 and #6), the poisons are not clustered as closely before the model is poisoned as after the model is poisoned. With a fully trained model, no matter it is trained with a clean or poisoned dataset, we should be able to find most poisons in a dense cluster.

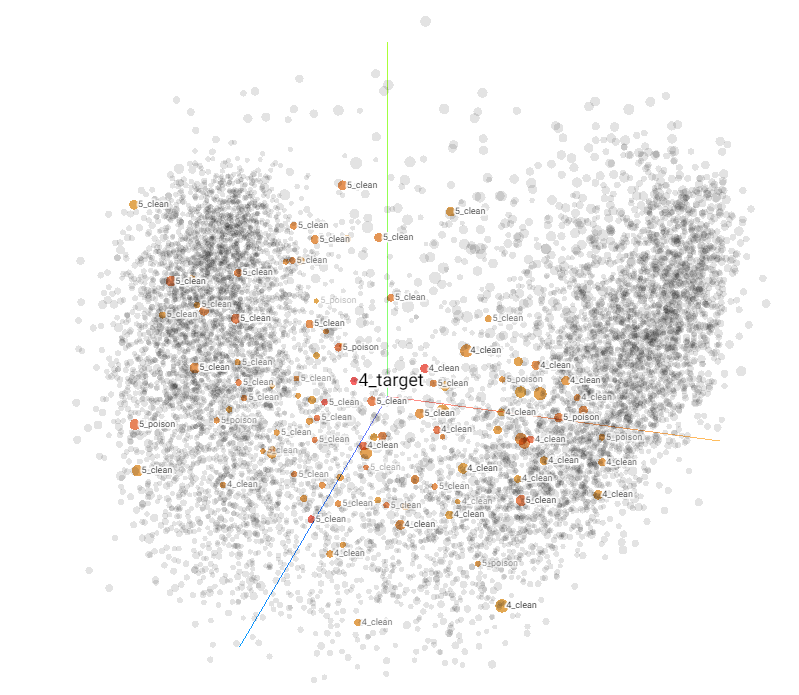
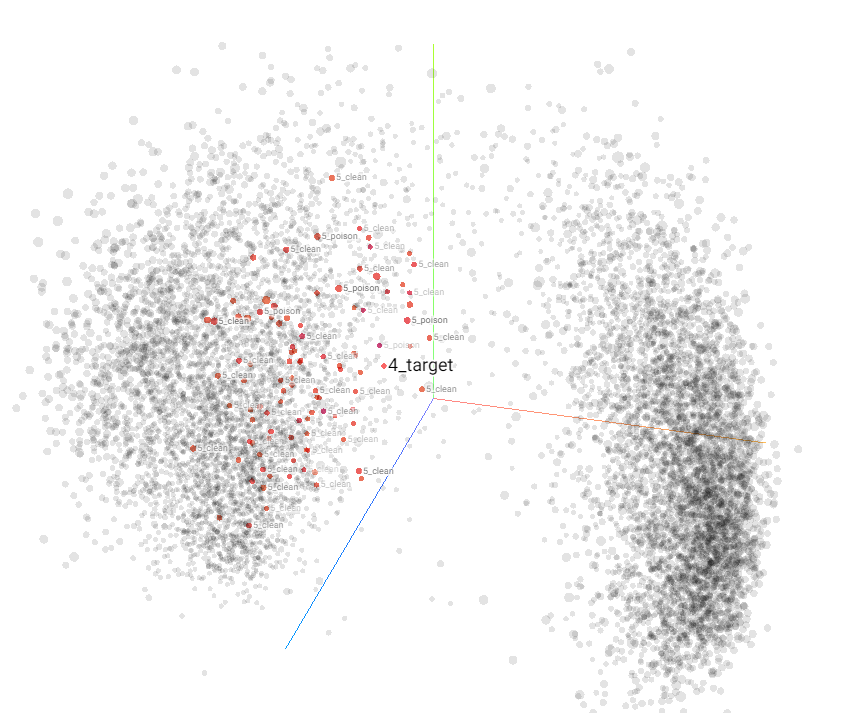
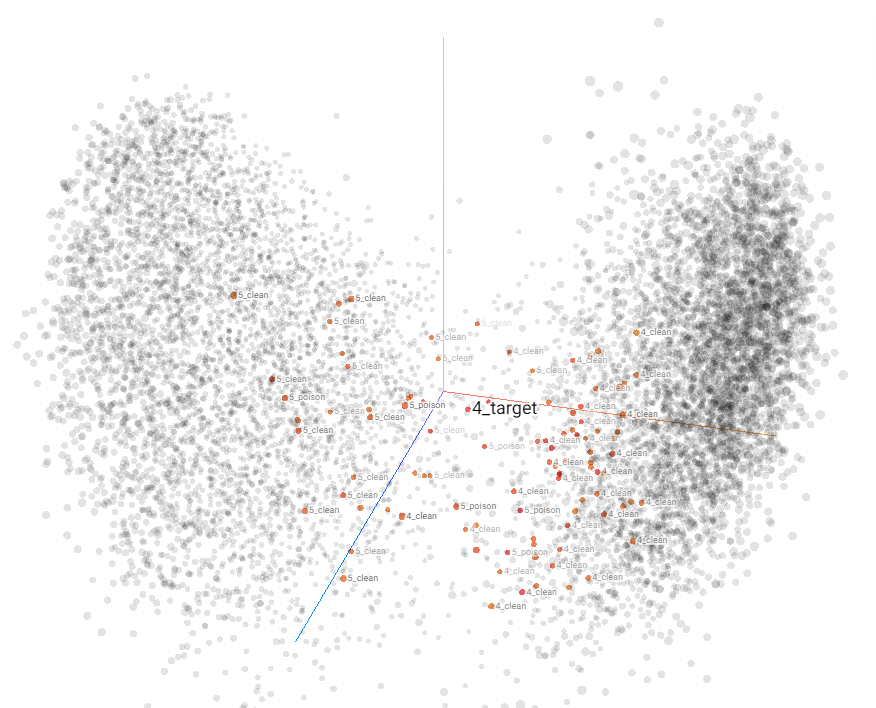
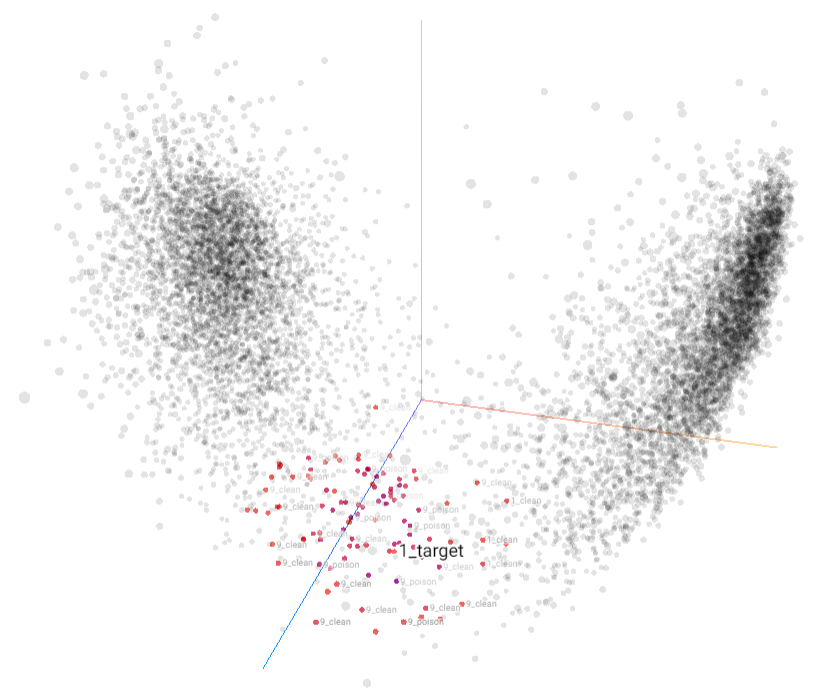
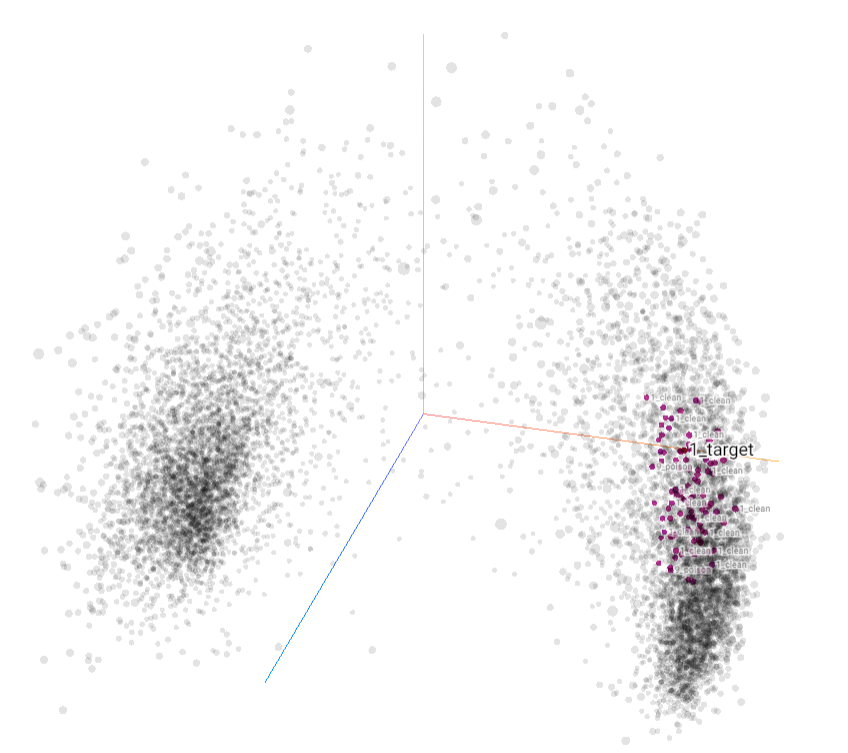
2.2 Poisons with Their Clean Counterparts
2.3 Poisons Selected by Coresets
2.4 By Gradients or By Activations?
2.5 How Many Examples?
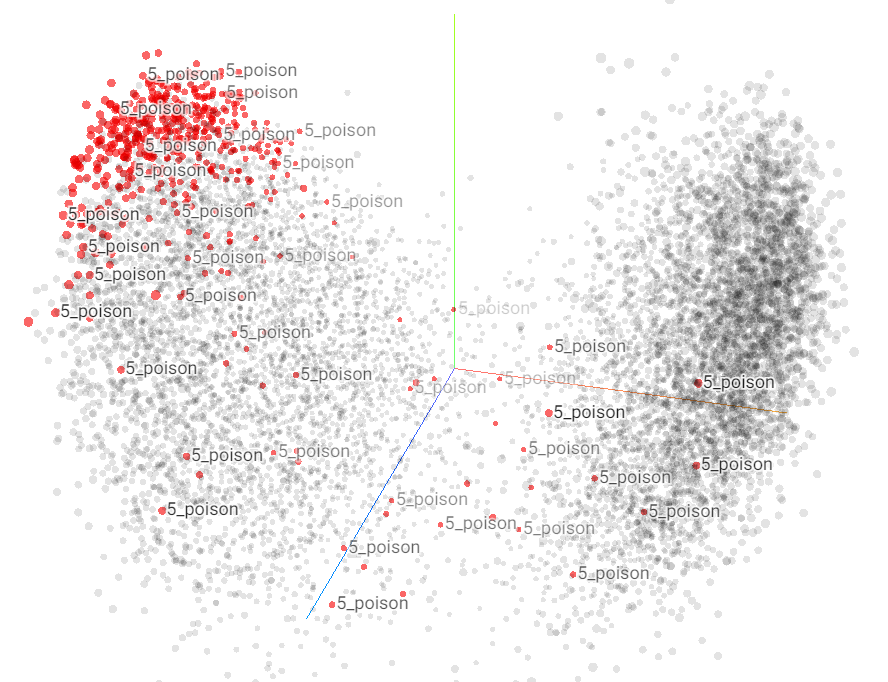
3 Low-Confidence Poisons are Crucial
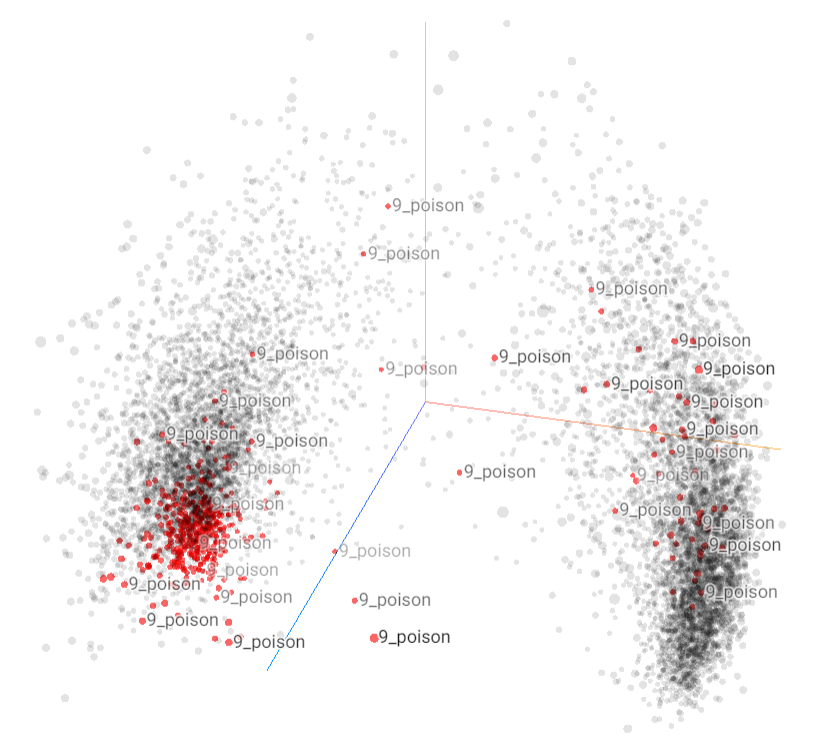
As we can see from the visualization, there are generally two types of poisons. Most of the poisons are clustered together and have high confidence while a few poisons are closer to the target’s class and have low confidence.
Experiments
We remove either the 450/500 high-confidence poisons or 50/500 low-confidence poisons from poisoned dataset #1, and then train the model with full supervision from scratch.
Results
Removing the high-confidence poisons won’t affect the success of the poisoning, even if they consist 90% of the poisons. Only pruning the 10% low-confidence ones can help defend the attack.
Conclusions
These experiments imply that we should formulate the data poisoning problem as training with noisy labels. If only we don’t not learn from the low-confidence poisons, we should be safe from data poisoning attacks.
4 Poisons are Learned Faster
In our experiments, we also see that the poisons are learned faster than the clean examples. In other words, the poisons have a higher average confidence and a higher accuracy than the clean examples. We shall also confirm this in the next section.
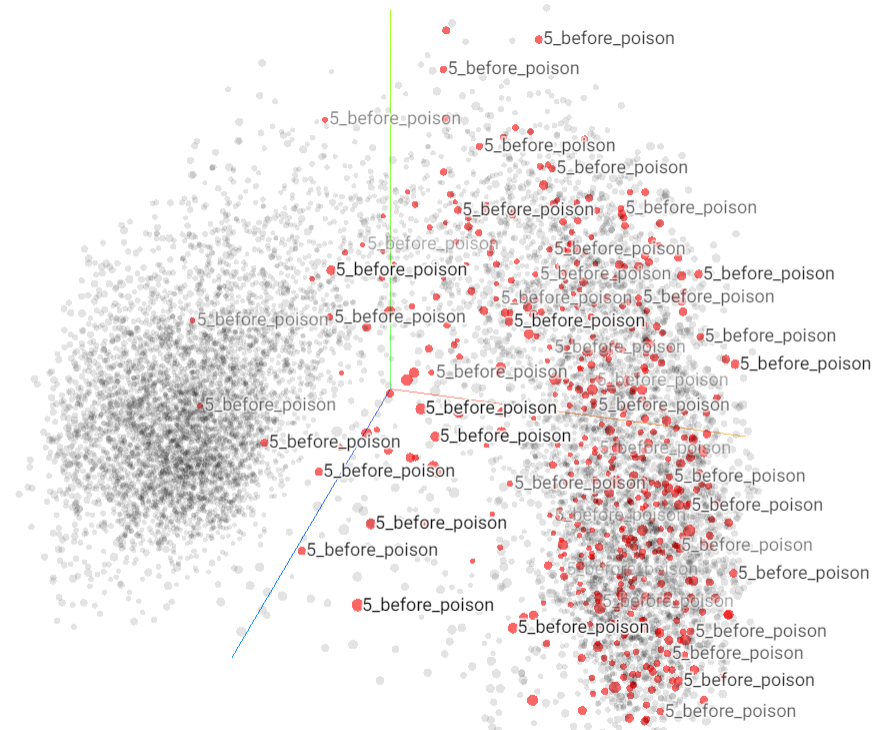
5 The Effect of Data Augmentations
Our experiments also show that the poisons have different behaviors from the clean examples when data augmentation is used. (Figure LABEL:fig:aug_1-LABEL:fig:aug_6)
Observations
-
•
The poisons have higher confidence than the clean examples for both weak and strong augmentations.
-
•
When strong augmentations are used, poisons may either have a high or low confidence while the clean examples usually have low confidence.
-
•
The poisons in the weaker poisoned dataset (#6) have higher confidence for their strong augmentations than the stronger poisoned dataset (#1).
6 Semi-Supervised Learning Delays the Poisoning
From the semi-supervised experiments, we see that self-supervised learning can delay the poisoning but not actually prevent it, even if we use only clean labels for the supervised part.
Hypothesis
High-confidence poisons may play a role here in semi-supervised learning even if they seem to be less important in supervised training.
7 CRAIG for Poisoned Dataset
7.1 Vanilla CRAIG
7.1.1 40-epoch Pipeline
| LR Steps | Warm-up? | Test Accuracy |
|---|---|---|
| 15,25,35 | 85.76% | |
| 16,20 | 84.39% | |
| 15,25,35 | 86.56% | |
| 16,20 | 88.91% |
| Criterion | Frequency | Accuracy | Poisoned? |
|---|---|---|---|
| All Data | - | 92.60% | Epoch 15 |
| p-y | 1 | 86.94% | Epoch 26 |
| 5 | 85.32% | Epoch 22 | |
| 10 | 85.76% | Epoch 26 | |
| linear | 1 | 79.29% | Epoch 24 |
| 5 | 82.82% | ||
| 10 | 79.22% | ||
| embed | 1 | 86.53% | Epoch 26 |
| 5 | 85.52% | Epoch 26 | |
| 10 | 83.45% | Epoch 24 |
| Criterion | Frequency | Accuracy | Poisoned? |
|---|---|---|---|
| All Data | - | 92.77% | Epoch 21 |
| p-y | 1 | 85.27% | |
| 5 | 87.30% | ||
| 10 | 83.90% | ||
| linear | 1 | 79.38% | |
| 5 | 79.74% | ||
| 10 | 80.45% | ||
| embed | 1 | 88.58% | |
| 5 | 87.17% | ||
| 10 | 85.80% |
7.1.2 200-epoch Pipeline
| LR Steps | Warm-up? | Test Accuracy |
|---|---|---|
| 75,125,175 | 90.72% | |
| 80,100 | 92.12% | |
| 75,125,175 | 90.40% | |
| 80,100 | 91.91% |
| Criterion | Frequency | Accuracy | Poisoned? |
|---|---|---|---|
| All Data | - | ||
| p-y | 1 | 87.12% | Epoch 132 |
| 5 | 89.06% | Epoch 196 | |
| 10 | 92.22% | Epoch 89 | |
| linear | 1 | 86.61% | |
| 5 | 87.79% | ||
| 10 | 88.69% | Epoch 95 |
| Criterion | Frequency | Accuracy | Poisoned? |
| All Data | - | ||
| p-y | 1 | 88.39% | |
| 5 | 90.45% | Epoch 147 | |
| 10 | 90.57% | Epoch 98 | |
| linear | 1 | 89.82% | Epoch 191 |
| 5 | 66.88% | ||
| 10 | 85.33% |
7.2 Semi-supervised CRAIG
7.2.1 Low Threshold with Proportional Budgets
See Table 7 and 8. Use pseudo labels for subset selection if confidence is above 0.2. The budgets for different classes is proportional to the class size.
Comparing to Table 5 and 6, this approach doesn’t seem to help much with either accuracy or defense.
| Criterion | Frequency | Accuracy | Poisoned? |
|---|---|---|---|
| All Data | - | ||
| p-y | 1 | 88.63% | Epoch 198 |
| 5 | 91.48% | Epoch 83 | |
| 10 | 92.34% | Epoch 81 | |
| linear | 1 | 85.52% | Epoch 198 |
| 5 | 87.64% | ||
| 10 | 86.99% | Epoch 200 |
| Criterion | Frequency | Accuracy | Poisoned? |
|---|---|---|---|
| All Data | - | ||
| p-y | 1 | 90.84% | Epoch 103 |
| 5 | 90.31% | Epoch 89 | |
| 10 | 90.63% | Epoch 96 | |
| linear | 1 | 80.50% | |
| 5 | 88.61% | Epoch 199 | |
| 10 | 85.06% |
7.2.2 High Threshold with Equal Budgets
Use the same budget for different classes. In this case, we need a higher threshold; otherwise, we may have examples fewer than the budget for some classes.
| Criterion | Frequency | Accuracy | Poisoned? |
|---|---|---|---|
| All Data | - | ||
| p-y | 1 | - | - |
| 5 | 91.03% | Epoch 80 | |
| 10 | 89.94% | Epoch 184 |
| Criterion | Frequency | Accuracy | Poisoned? |
|---|---|---|---|
| All Data | - | ||
| p-y | 1 | 91.84% | Epoch 81 |
| 5 | 68.51% | Epoch 89 | |
| 10 | 91.97% | Epoch 90 |
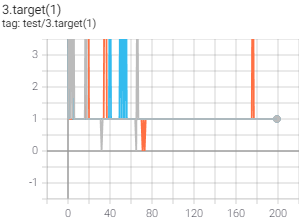
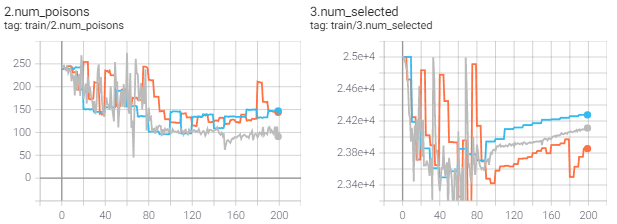
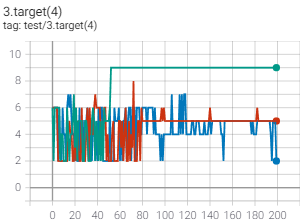
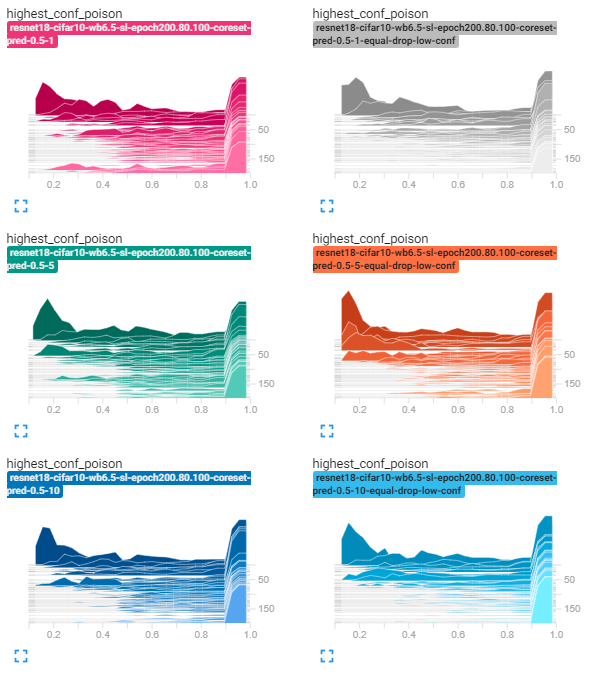
7.3 Dropping Low-confidence Centers
Cheating Experiment
For both the 40-epoch and 200-epoch pipelines, if we drop 10% low-confidence poisons (50 poisons) which have the lowest confidence in the poisons’ class every epoch, the model is not poisoned when trained with either dataset #1 and #6. We even get a 95% high test accuracy for 200-epoch training.
Experiment
After updating the subset at each epoch, we drop the examples which have higher than 0.8 confidence in other classes instead of the ground truth class.
Results
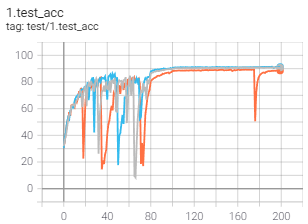
See Table 12. The defense seems to be effective for dataset #6. (I’m still trying to see if we can find a better threshold for dataset #1 as well.) From Figure 17 we can see that with the current approach we indeed dropped the low-confidence poisons during the training.
| Criterion | Frequency | Accuracy | Poisoned? |
|---|---|---|---|
| All Data | - | ||
| p-y | 1 | 89.60% | Epoch 78 |
| 5 | 90.03% | Epoch 90 | |
| 10 | 90.40% | Epoch 200 |
| Criterion | Frequency | Accuracy | Poisoned? |
|---|---|---|---|
| All Data | - | ||
| p-y | 1 | 90.81% | |
| 5 | 88.51% | ||
| 10 | 91.33% |

Using uniform weights will give us higher accuracy but won’t the model will still get poisoned.
| Criterion | Frequency | Accuracy | Poisoned? |
|---|---|---|---|
| All Data | - | ||
| p-y | 1 | 94.13% | Epoch 76 |
| 5 | 93.80% | Epoch 100 | |
| 10 | 94.18% | Epoch 80 |
Trade-off Between Accuracy and Defense Success
| Criterion | Frequency | Accuracy | Poisoned? |
|---|---|---|---|
| All Data | - | ||
| p-y | 1 | 88.73% | Epoch 100 |
| 5 | 75.11% | ||
| 10 | 83.67% |
| Criterion | Frequency | Accuracy | Poisoned? |
|---|---|---|---|
| All Data | - | ||
| p-y | 1 | 89.32% | |
| 5 | 85.63% | ||
| 10 | 74.96% |
8 CRAIG with Uniform Stepsizes
CRAIG doesn’t work stably when the subsets are large, so we consider using uniform stepsizes for all exampels in the selected subsets.
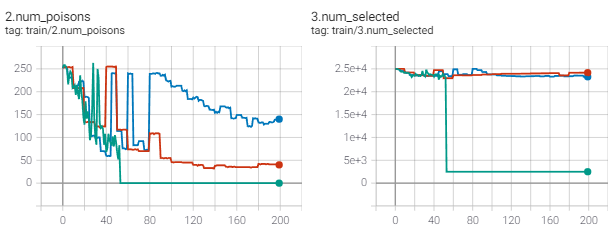
8.1 Dropping Low-confidence Centers
Drop an example if it has higher than 0.5 confidence in classes other than the ground-truth class.
-
•
As the training proceeds, we are selecting less poisons but more low-confidence poisons.
-
•
Poisons selected at the beginning of the training are mostly high-confidence ones; poisons selected at the later training are mostly low-confidence poisons.
8.1.1 Comparing Subset Sizes
Comparing to larger subsets, smaller subsets contains fewer low-confidence poisons while having relatively the same amount of high-confidence poisons.
30% subset, updating every 10 epochs
Every test accuracy is around 92%. Successful poisoned datasets: 1, 13, 19, 23, 24, 29, 35, 42, 49
20% subset, updating every 10 epochs
Every test accuracy is around 91%. Successful poisoned datasets: 1, 13, 19, 23, 26, 35, 48, 49
10% subset, updating every 10 epochs
Every test accuracy is around 85%. Successful poisoned datasets: 29, 35
8.1.2 Comparing Updating Frequencies
Updating the subsets more frequently can help the model to achieve a higher test accuracy but does not ensure a lower poisoning success rate.
10% subset, updating every 5 epochs
Every test accuracy is around 86%. Successful poisoned datasets: 24, 35
10% subset, updating every 1 epoch
Every test accuracy is around 87%. Successful poisoned datasets: 13, 29, 49
8.2 Dropping Small Clusters
8.2.1 Dropping Centers of Small Clusters
After selecting the subset, we drop centers if their clusters have only 1 example (themselves.) For the 20 poisoned datasets, training for 200 epochs only with centers of large clusters gives an average accuracy around 81%-82% test accuracy and the poison success rate is 5% (only dataset #1 succeeded.)
8.2.2 Dropping Small Clusters
To further improve the test accuracy, we need to train with more examples. Instead of training the model with only the centers of the large clusters, we use all the examples in these clusters.
9 Requirements of Poisoned Datasets
Because the SOTA adversarial poisoning defense is based on a 40-epoch training pipeline instead of the most commonly used 200-epoch one, for a fair comparison, we only consider poisoned datasets whose target has a similar confidence when tested on two clean models: one trained for 40 epochs, and the other trained for 200 epochs.
Among the 20 poisoned datasets listed in Section 1, the target of #1 #23, #24, #27, #29, #35 does not satisfy our requirement.The confidence of their targets is usually below 0.7 for one of the model.
For some other datasets like #13, 19, 42, 49, their targets have a very high confidence around 0.98 but not as high as 0.99. It’s surprising to see that these targets are having a high potential of being poisoned as well.
10 Comparing with Random Baselines (TODO)
11 Comparing with SOTA Defenses
11.1 Reproducing the Results
| Defense | Dataset | Accuracy | Poisoned? |
|---|---|---|---|
| None | 1 | 91.87% | Epoch 20 |
| None | 2 | 92.29% | Epoch 20 |
| None | 6 | 92.20% | Epoch 20 |
| Adversarial | 1 | 91.20% | |
| Madry | 1 | 89.90% | Epoch 20 |
| Activation Clustering | 1 | 84.83% | Epoch 10 |
| DeepKNN | 1 | 92.04% | Epoch 20 |
| Adversarial | 2 | 89.86% | |
| Madry | 2 | 89.92% | Epoch 10 |
| Activation Clustering | 2 | 85.84% | |
| DeepKNN | 2 | 91.11% | Epoch 10 |
| Adversarial | 6 | 89.55% | |
| Madry | 6 | 90.35% | Epoch 20 |
| Activation Clustering | 6 | 83.12% | Epoch 10 |
| DeepKNN | 6 | 92.05% | Epoch 20 |