Characterization of the Thermospheric Mean Winds and Circulation during Solstice using ICON/MIGHTI Observations
Abstract
Using the horizontal neutral wind observations from the MIGHTI instrument onboard NASA’s ICON (Ionospheric Connection Explorer) spacecraft with continuous coverage, we determine the climatology of the mean zonal and meridional winds and the associated mean circulation at low- to middle latitudes (S–40∘N) for Northern Hemisphere summer solstice conditions between 90 km and 200 km altitudes, specifically on 20 June 2020 solstice as well as for a one-month period from 8 June–7 July 2020 and for Northern winter season from 16 December 2019–31 January 2020, which spans a 47-day period, providing full local time coverage. The data are averaged within appropriate altitude, longitude, latitude, solar zenith angle, and local time bins to produce mean wind distributions. The geographical distributions and local time variations of the mean horizontal circulation are evaluated. The instantaneous horizontal winds exhibit a significant degree of spatiotemporal variability often exceeding m s-1. The daily averaged zonal mean winds demonstrate day-to-day variability. Eastward zonal winds and northward (winter-to-summer) meridional winds are prevalent in the lower thermosphere, which provides indirect observational evidence of the eastward momentum deposition by small-scale gravity waves. The mean neutral winds and circulation exhibit smaller scale structures in the lower thermosphere (90–120 km), while they are more homogeneous in the upper thermosphere, indicating the increasingly dissipative nature of the thermosphere. The mean wind and circulation patterns inferred from ICON/MIGHTI measurements can be used to constrain and validate general circulation models, as well as input for numerical wave models.
Journal of Geophysical Research - Space Physics
George Mason University, Department of Physics and Astronomy, Space Weather Lab, Fairfax, VA, USA. U.S. Naval Research Laboratory, Washington D.C., USA. Max Planck Institute for Solar System Research, Göttingen, Germany UC Berkeley, Space Sciences Laboratory, Berkeley, CA, USA. High Altitude Observatory, NCAR, Boulder, CO, USA COSMIC Program UCAR/UCP, Boulder, CO, USA
Erdal Yiğiteyigit@gmu.edu
Mean zonal and meridional winds are derived for Northern summer and winter solstice conditions from ICON/MIGHTI observations
Horizontal winds exhibit a significant degree of spatiotemporal variability, exceeding m s-1.
Zonal and meridional mean winds exhibit reversal in the lower thermosphere.
Distributions of mean winds and circulation are more homogeneous in the upper thermosphere than lower thermosphere.
Plain Language Summary
Atmospheric horizontal winds (i.e., motion of the neutral air), composed of zonal (east-west) and meridional (north-south) components, play an important role for the energy and momentum balance of the atmosphere and ionosphere. Due primarily to a lack of observations, winds in the thermosphere are not well sampled. In this study we use the horizontal winds measured from 90–200 km altitude by the MIGHTI instrument onboard NASA’s ICON (Ionospheric Connection Explorer) spacecraft to generate two-dimensional maps of zonal and meridional winds, and of the resulting horizontal motion (or circulation) in the thermosphere for Northern Hemisphere solstice conditions. Specifically, winds at solstice (20 June 2020) and a one-month Northern summer solstitial period (8 June–7 July 2020) and a 47-day winter solstitial period (16 December 2019–31 January 2020) have been analyzed. Mean winds show significant spatial variation as a function of time, often demonstrating tidal variability.
1 Introduction
Earth’s thermosphere extending from 90 km upwards is the outermost region of the atmosphere, where satellites orbit the planet and a substantial portion of solar ultraviolet (UV) radiation is absorbed by atmospheric gases. This rarefied and highly dissipative region is influenced by a broad spectrum of internal atmospheric waves propagating upward from the lower atmosphere (Hickey \BOthers., \APACyear2011; Pancheva \BBA Mukhtarov, \APACyear2012; Yiğit \BBA Medvedev, \APACyear2015; Oberheide \BOthers., \APACyear2015; Gavrilov \BOthers., \APACyear2020; Pancheva \BOthers., \APACyear2020; Forbes \BOthers., \APACyear2021; Dhadly, Emmert, Drob, McCormack\BCBL \BBA Niciejewski, \APACyear2018) and by solar and geomagnetic processes (i.e., space weather) from above (Schunk \BBA Sojka, \APACyear1996; Emmert, \APACyear2015; Yiğit, Knížová\BCBL \BOthers., \APACyear2016; Deng \BOthers., \APACyear2018; Ward \BOthers., \APACyear2021; Shiokawa \BBA Georgieva, \APACyear2021; Dhadly, Emmert, Drob, Conde\BCBL \BOthers., \APACyear2018). The forces acting on the neutral flow are rarely in balance in the thermosphere, thus giving rise to an enhanced spatiotemporal variability with turbulent to global scales.
The goal of this paper is to characterize the thermospheric mean zonal and meridional winds, and circulation during solstice at low- to midlatitudes (10∘S–40∘N) using observations from the MIGHTI (Michelson Interferometer for Global High-resolution Thermospheric Imaging) instrument (Englert \BOthers., \APACyear2017) onboard NASA’s ICON (Ionospheric Connection Explorer) spacecraft during 2020 Northern Hemisphere solstice conditions. Due primarily to poor observational coverage, neutral winds have been insufficiently characterized at thermospheric altitudes. Horizontal winds and the associated circulation play an essential role in the energy and momentum budget of the thermosphere and ionosphere. They modulate upwelling/downwelling of air, influence the critical filtering and dissipation of internal atmospheric waves propagating upward, drive low-latitude ionospheric electrodynamics, transport major chemical species (e.g., \ceO, \ceN2, \ceNO), generate neutral drag on the ions, and redistribute thermospheric energy and momentum in general. Thermospheric winds are primarily horizontal, however, in the regions of convergence or divergence, upwelling or downwelling (i.e., vertical motion) can occur as a consequence of the principal of conservation of mass (Rishbeth \BOthers., \APACyear1969; R\BPBIW. Smith, \APACyear1998). Therefore, characterization of the mean winds is essential for our understanding of the thermosphere-ionosphere system as a whole.
Various methods were utilized to observe winds over a broad range of altitudes from the upper mesosphere to the thermosphere. However, lower thermospheric winds are more routinely observed than in the upper thermosphere. A summary of historical and current observations is presented by other researchers (e.g., Drob \BOthers., \APACyear2008, \APACyear2015; Dhadly \BOthers., \APACyear2019). Chemical release wind measurements carried out in different sites around the world can provide profiles of wind velocity and high vertical resolution wind shear from 80 – 140 km (Larsen, \APACyear2002; Lehmacher \BOthers., \APACyear2022). Incoherent scatter radars around the world use measured ion drifts to derive neutral winds from km (Zhang \BOthers., \APACyear2003; Hysell \BOthers., \APACyear2014). Meteor echoes and meteor radars are used to retrieve wind profiles between km (Oppenheim \BOthers., \APACyear2009; Conte \BOthers., \APACyear2022). Various types of ground-based Fabry-Perot Interferometers (FPI) have been employed since the 1980s across the globe to understand neutral wind dynamics of the upper and lower thermospheric winds (Conde \BBA Smith, \APACyear1995; Meriwether, \APACyear2006; Aruliah \BOthers., \APACyear2010; Makela \BOthers., \APACyear2012).
Satellites can provide measurements of thermospheric winds at a broad range of thermospheric altitudes. Dynamic Explorer 2 (DE2), was the first to monitor upper thermospheric neutral winds from space utilizing a FPI (Killeen \BBA Roble, \APACyear1988). The wind imaging interferometer (WINDII) aboard the Upper Atmosphere Research Satellite (UARS) retrieved neutral winds based on the interfermetric limb measurements of the visible airglow emissions of 557.7 nm \ceO^1S (green line) and 630.0 nm \ceO^1D (redline) between 90 and 300 km (Emmert \BOthers., \APACyear2001; \APACciteatitleThe Wind Imaging Interferometer (WINDII) on the Upper Atmosphere Research Satellite: A 20 YEAR perspective, \APACyear2012). Thermosphere, Ionosphere, Mesosphere Energetics and Dynamics/TIMED Doppler Interferometer (TIMED/TIDI) primarily focused on monitoring MLT winds, launched in 2001 is still operational after 20 years in orbit (Niciejewski \BOthers., \APACyear2006). Cross-track winds were derived from accelerometer measurements between 250 km and 400 km by the GOCE (Gravity Field and Steady-State Ocean Circulation Explorer (Doornbos \BOthers., \APACyear2014)) and CHAMP (CHAllenging Minisatellite Payload) satellite (Liu \BOthers., \APACyear2006; Lieberman \BOthers., \APACyear2013).
Despite the extensive measurements by ground-based and space-borne instruments, thermospheric winds have been insufficiently sampled so far. Much of the understanding of the thermospheric winds is based on dedicated first-principle global scale modeling (e.g., Geisler, \APACyear1966; Richmond \BOthers., \APACyear1992; Vichare \BOthers., \APACyear2012; Miyoshi \BOthers., \APACyear2014; Yiğit, Frey\BCBL \BOthers., \APACyear2016; Deng \BOthers., \APACyear2018) and empirical models are routinely used to study the global behavior of winds (Drob \BOthers., \APACyear2015; Dhadly \BOthers., \APACyear2019). Depending on the type of model and observations, model-data agreement is often partially achieved (e.g., Tang \BOthers., \APACyear2021). Thermospheric wind is an essential input parameter for ionospheric models and a better representation of neutral winds is needed for improved space weather modeling (David \BOthers., \APACyear2014). While models are powerful tools to study the different forces shaping the winds, often the simulated winds are insufficiently constrained in models, therefore ground-based and space-borne measurements of neutral winds are crucial for validating first principal models and to obtain a more complete physical understanding of thermospheric dynamics.
Although ICON has started observing the thermosphere only recently, MIGHTI observations have already been used to study thermospheric winds and to compare them to other ground-based and space-borne instruments. Recent studies have validated some aspects of ICON horizontal winds with respect to Fabry-Perot interferometers and meteor radars (Harding \BOthers., \APACyear2021; Makela \BOthers., \APACyear2021; Chen \BOthers., \APACyear2022). Dhadly \BOthers. (\APACyear2021) compared MIGHTI winds to the University of Michigan TIMED Doppler Interferometer (TIDI) level 3 data, contributing to the validation of MIGHTI winds as well as providing guidance towards improving TIDI winds. In addition, this study revealed the longitudinal variations in neutral winds associated with non-migrating tides, which are currently missing from the existing wind climatologies. Forbes \BOthers. (\APACyear2021) analyzed coincident ICON measurements of neutral horizontal winds, ion drifts, and densities and demonstrated a direct link between the day-to-day variability of the wave-4 structure in the E-region and drifts and densities of ions in the F-region ionosphere. More recently, England \BOthers. (\APACyear2022)’s analysis of MIGTHI winds have shown that strong wind shear is a common feature of the lower thermosphere between 100-130 km. Yamazaki \BOthers. (\APACyear2022) have analyzed concurrent observations from COSMIC-2 and ICON/MIGHTI wind and found a correlation between the negative vertical shear of the eastward wind and the occurrence rate of the sporadic E layer. Characterization of varying fields is often represented in the form of appropriately defined mean, which requires a sufficient degree of observational coverage in space and time. The averaging for a field variable that is often conducted over time and longitude
| (1) |
is generally referred to as “zonal mean”, if spans all longitudes. In this paper, we perform averaging of ICON/MIGHTI neutral winds over longitude, latitude and local time, and generally call the results “mean winds” as well. Besides the physical importance of winds and their mean structure discussed above, they are routinely used to validate theory and global scale models (or general circulation models) in the middle and upper atmosphere (e.g., Lieberman \BOthers., \APACyear2000; Garcia \BOthers., \APACyear2007; Dempsey \BOthers., \APACyear2021; Griffith \BOthers., \APACyear2021; Yiğit \BOthers., \APACyear2021; Koval \BOthers., \APACyear2022).
This paper analyzes the thermospheric horizontal winds between 90 and 200 km during June solstice conditions as observed in 2020 by ICON/MIGHTI . Next section describes the MIGHTI neutral wind measurements used in this study; Section 3 presents the results for the solstice wind distribution and circulation; Section 4 provides a discussion of the observed winds, and a summary and conclusions are given in Section 5.
2 Materials and Methods
2.1 ICON Mission and Data
The ICON mission was launched in 2019 and has been surveying the low-latitude thermosphere-ionosphere system above 90 km in unprecedented detail. Its primary goal is to explore Earth’s thermosphere-ionosphere system and its connection to geospace as well as terrestrial drivers (Immel \BOthers., \APACyear2018). The MIGHTI wind observations are based on the Doppler shift measurements the of the green line ( nm) and red line ( nm) emissions of atomic oxygen. In this paper, we analyze the cardinal winds (i.e., zonal and meridional components) from the MIGHTI instrument (Englert \BOthers., \APACyear2017). The details of the wind retrieval algorithm are described in the work by Harding \BOthers. (\APACyear2017). In the following, we outline the data selection, quality, and spatiotemporal coverage.
In this study, we focus only on the MIGHTI green line neutral winds, which cover the altitude range from 90 to 200 km during daytime and 90 to 115 km both daytime and nighttime. Typically, MIGHTI daytime line of sight (LOS) wind observations are available at a 30-s cadence, while nighttime LOS wind measurements are available at a 60-s cadence. Northward and eastward components of the winds are obtained by pairing these LOS wind measurements of MIGHTI A and MIGHTI B sensors, which are taken approximately 8 minutes apart.
The quality of MIGHTI/ICON data was taken into account in the analyses. Each wind measurement was assigned a data quality flag corresponding to “good”, “good, but use with caution”, and “bad”. We removed all data with bad quality and also excluded outliers with wind magnitudes exceeding 300 m s-1. The result is shown in Figure 15, where the zonal winds are plotted with different quality flags. The typical accuracy of winds derived from the green line emission is 12 m s-1 or better, as compared with meteor radars (Harding \BOthers., \APACyear2021). It is seen that such procedure leaves a significant amount of data to maintain solid statistics.
In general, strong mean winds (jets) develop in both hemispheres in the middle atmosphere during solstices. They produce enhanced wave filtering and/or modify propagation conditions for internal atmospheric waves with great dynamical implications for the upper atmosphere. Therefore, the solstice winds and circulation are highly variable and interesting to study. Gravity waves and tides significantly affect the mean flow in the whole atmospheric system. During the Northern winter season additional effects of planetary waves and occurrence of sudden stratospheric warming (SSW) events can complicate the interpretation of observations. Therefore, we have focused in this study primarily on the Northern Hemisphere summer solstice (Sections 3.1–3.2). However, in order to complement June/July solstice results, we have added a complementary analysis for December 2019–January 2020 Northern winter solstice (Section 3.3.), which did not include sudden warming events.
2.2 ICON coverage
Figure 1 illustrates the spatiotemporal ICON data coverage for 20 June 2020, after having removed the bad quality data. This subset for the analysis contains 2206 individual wind profiles. Panels show the longitude, latitude, and local time coverage as a function of UTC. It is seen that all longitudes and latitudes between –10∘ and +40∘ are well covered. There are some nighttime data gaps, however, overall all local times were observed. Panels and present the altitude coverage as a function of latitude and local time. It is seen that during daytime, the altitude coverage extends into the upper thermosphere, while the nighttime observations are available only between 90–115 km. Also, latitudes between –10∘ and +10∘ are not observed above 115 km on 20 June, since they coincide with nighttime. The latitude-longitude distribution highlights the good spatial coverage between –10∘ and +40∘ for all longitudes, with some data gaps around 300∘ longitude in the Southern Hemisphere associated with South Atlantic Anomaly (SAA). The latitude-solar zenith angle distribution of measurements (panel ) at 106 km suggests that the Northern Hemisphere is covered primarily at daytime, while the Southern Hemisphere latitudes are observed at nighttime. Longitude-solar zenith angle variations at 106 km (panel h) show that, for a given longitude, both nighttime and daytime data are available except in the region around 300∘ longitude.
A single day observation is not sufficient to produce a wind climatology. Therefore, in order to obtain a more consistent picture of mean winds and circulation, we have used one month of continuous ICON observations from 8 June to 7 July 2020, representative of Northern Hemisphere summer solstice conditions. Neutral wind measurements were binned with respect to altitude, latitude, longitude, local time and solar zenith angle with bin sizes of 5 km, 5∘, 30∘, 1-2 h, and 10∘ bins, respectively. Figure 2 shows the latitude and solar zenith angle coverage along with the corresponding distributions of the zonal and meridional winds at 106 km during this period. The daily mean F10.7 cm solar radio flux and geomagnetic Kp-index variations shown in panels and f indicate quiet solar and geomagnetic conditions. The latitudes between 10∘S and 40∘N are continuously covered, however, the latter period of June 2020, the southern latitudes are more sparsely sampled than northern latitudes. Also, while all solar zenith angles between 10–140∘ are observed, the nighttime, in general, is observed more sparsely than daytime. The zonal and meridional winds at 106 km are generally up to m s-1 throughout this period, exhibiting noticeable degree of day-to-day variability.
3 Results
3.1 Zonal and Meridional Winds on 20 June 2020
Figure 3 shows variations of the zonal (upper panels) and meridional (lower panels) winds with altitude, longitude, latitude, and local time on 20 June 2020. The profiles are plotted without any binning. The average of all vertical profiles are shown with the red line. The zonal and meridional winds demonstrate a high degree of spatiotemporal variability. They are generally faster at higher altitudes, occasionally exceeding m s-1. Also, the daytime winds observed in the Northern Hemisphere are faster than those during nighttime at low-latitudes. Note also that the intermittent values of the winds are much larger than their average quantity. Therefore, the latter should be treated with caution as not being representative of instantaneous numbers.
In order to study the observed wind variability, we have evaluated in Figure 4 the occurrence rates of the wind speeds binned in 5 m s-1 intervals on 20 June 2020 at three representative altitude layers 94–103 km, 106–114 km, and 194–202 km such that each layer included equal number of data points. The speeds shown as a function of number of measurements exhibit a Gaussian distribution generally centered around slow speeds. The associated standard deviations, and , which are a proxy for wind variability, are shown in the upper left corner. The nighttime wind variabilities are greater than daytime ones and increase with height. It should be noted that the reported standard deviations are the root mean-square of wind variability and observational errors, which vary with height.
Figures 5 and 6 present the altitude distribution of the zonal and meridional winds, respectively, binned as functions of latitude, longitude, local time, and solar zenith angle, where red and blue shadings represent positive (eastward, northward) and negative (westward, southward) wind values, respectively. It is seen that the behavior of the observed zonal and meridional winds in the lower thermosphere (90–110 km) is remarkably different than in the upper thermosphere. Zonal winds are predominantly eastward in the lower thermosphere, in particular, in northern latitudes between 10-40∘N, with magnitudes of up to 40 m s-1. Above 110 km, they are clearly westward, have speeds exceeding –70 m s-1 and essentially associated with daytime values. The eastward wind regime in the lower thermosphere itself exhibits a substantial degree of variability, when viewed as a function of longitude, local time, and solar zenith angle. For example, the daytime lower thermospheric winds are more eastward compared to those during nighttime. Meridional winds exhibit alternating patterns of flow direction with altitude. They are predominantly southward during daytime in the lower thermosphere between 90–100 km; northward between 100–120 km with speeds reaching 60 m s-1; southward between 120–190 km, and northward again around 190-200 km, especially around noontime, where the winds above 110 km correspond to daytime measurements. The features near the terminator in Figures 5c,d are potentially an artifact associated with low airglow signal, which are expected to be corrected in the next version of the wind data.
3.2 Thermospheric Mean Winds and Circulation during Northern Hemisphere Summer Solstice
A diurnal mean provides a short-term glimpse of the circulation, however it is not sufficient for deriving a more accurate view of the climatology of mean winds due to limitations of the orbital coverage to one day and intrinsic variability of the wind field. Therefore, we analyzed one month of continuous ICON observations from 8 June to 7 July 2020, which are representative of the solstitial dynamics during the Northern Hemisphere summer.
Figure 7 shows the sequence of diurnal-mean altitude-latitude cross-sections of the zonal winds. It clearly shows that the winds strongly vary from day to day. Eastward winds with 10–40 m s-1 speeds are a robust feature of the midlatitude lower thermosphere between 90 and 110 km. The westward winds during daytime dominate above 120 km. Their speeds vary from –10 to –80 m s-1, depending on the latitude, and amplify towards the end of June and beginning of July.
We next determine the Northern Hemisphere summer solstitial climatology of the horizontal winds by averaging over all measurements between 8 June and 7 July shown in Figure 7. The results are plotted in Figure 8 in the form of altitude-latitude and altitude-local time distributions for both the zonal (upper panels) and meridional (lower panels) components. In the lower thermosphere, the eastward winds are up to 40 m s-1, and the daytime westward mean zonal wind in the upper thermosphere can exceed –60 m s-1, especially between and N. The westward mean zonal winds decrease around 160 km, such that the jet exhibits a split in altitude, especially, between 10-40∘N. In the lower thermosphere, meridional winds are weakly southward (up to –20 m s-1) between 90–105 km and northward between 105–120 km. Above 120 km, the meridional winds are directed southward with speeds occasionally exceeding –60 m s-1, for example at low-latitudes of the Southern Hemisphere during daytime after dawn and before dusk. The meridional winds around N are, generally, slower than at low-latitudes. In the lower thermosphere, both zonal and meridional components exhibit a distinct local time variability, when all observed latitudes are considered. Overall, the observed monthly-mean daytime meridional winds are directed southward and nighttime winds are northward.
Another view of the observed winds is presented in Figure 9, where the latitude-local time cross-sections of the mean zonal (left) and meridional (right) winds are shown at three representative thermospheric altitudes. Within the 90–105 km layer, the zonal winds are mainly eastward at midlatitudes around dawn and dusk and vary semidiurnally. At equatorial latitudes, the winds are eastward in the morning sector and westward in the afternoon, suggesting a diurnal variation. Meridional winds are southward during day and northward at night, which is indicative of a diurnal signal as well. Higher up in the lower thermosphere between 105–120 km, mean zonal winds exhibit a more complex latitude-local time variability, however, meridional winds overall maintain a diurnal behavior at low-latitudes. In the upper thermosphere, the zonal winds are strongly westward at midlatitudes around dawn exceeding 100 m s-1, moderately westward in general during day, and reverse their direction to strong eastward flow before dusk. Again, the low airglow signal could have potentially affected the magnitude of these winds at the terminator. Southward meridional winds dominate in the upper thermosphere during day, similar to the lower thermosphere. They indicate the global north-to-south branch of the solstitial circulation cell in the upper atmosphere.
Figure 10 presents the latitude-longitude cross-sections of the zonal and meridional winds at three representative altitudes in the thermosphere. It shows that the monthly-mean morphology of the horizontal winds, i.e., wind magnitudes and directions, significantly changes in the lower thermosphere between 90 and 120 km. Within the 90–105 km layer, eastward winds of up to 40 m s-1 and southward winds of up to –30 m s-1 are prevalent in the Northern Hemisphere. The Southern Hemisphere low-latitudes are characterized by relatively slow westward winds. Around 105–120 km altitude, zonal winds in the Northern Hemisphere reverse the direction to westward and the northward flow becomes more prevalent compared to that at 90–105 km. The upper thermosphere at 185–200 km is dominated by westward and southward winds with speeds exceeding – m s-1 and –40 m s-1, respectively. The latter are a part of the pole-to-pole solstitial meridional circulation. These upper thermosphere winds are, generally, much faster and more homogeneous than in the lower thermosphere.
Atmospheric circulation associated with neutral winds play an important dynamical role in redistribution of momentum, energy, and mass in the thermosphere. The associated latitude-local time and latitude-longitude and distributions of the mean horizontal circulation are seen in terms of velocity vectors in Figures 11 and 12 at three representative altitudes in the thermosphere. This representation of the winds shows the direction as well as the flow speeds. Upward and downward directed vectors represent northward (towards the North Pole) and southward flow (towards the South Pole). While vectors directed to the right and left are for eastward and westward flow, respectively, in latitude-longitude cross-sections, they facilitate an interpretation of the winds relatively to the day-night sectors in latitude-local time plots. For example, winds flowing from the dayside to the nightside or vice versa would be revealed. A large degree of spatiotemporal variability is seen especially within the lower thermosphere. Eastward and southward winds prevail in the layer between 90-105 km and westward and northward as well as southward flows are found within 105–120 km. Between 90-105 km, dusk-to-dawn and nighttime poleward flow is followed by a daytime equatorward flow. The mean circulation between 105–120 km exhibits the greatest degree of complexity in terms of varying scale sizes and vortices, generally directed westward during day and eastward during night diverging around the subsolar point. Generally flow speeds are in the order of 50 m s-1. In the upper thermosphere, the observed daytime circulation is more easily discernible with clear diverging patterns around the subsolar point. Geographically south-westward circulation prevails with flow speeds exceeding 100 m s-1 at midlatitudes.
3.3 Thermospheric Mean Winds and Circulation during Northern Hemisphere Winter Solstice
So far we discussed the Northern Hemisphere summer season. Energy deposition from the Sun varies seasonally changing the differential heating and the pressure gradient force, which alters the circulation patterns, hence atmospheric wave propagation and its effects.
In order to complement the results presented above, we next analyze the winds and circulation patterns during the Northern Hemisphere winter. Figure 13 shows the altitude-latitude and altitude-local time distributions of the mean zonal and meridional winds averaged from 16 December 2019–31 January 2020, which is representative of the December solstice (or Northern winter) conditions. They are presented in a manner similar to June solstice mean winds (Figure 8). Note that this period does not include any stratospheric sudden warming (SSW) events (Roy \BBA Kuttippurath, \APACyear2022). It is seen that the zonal winds are westward (with magnitudes 40 m s-1) at low-latitudes and eastward at midlatitudes ( with magnitudes 20 m s-1), relatively slower than the summer winds. During winter, slow meridional winds are seen between 90–120 km, and strong eastward daytime winds prevail above 120 km. Local time variations in the lower thermosphere indicate a semidiurnal variation of the zonal winds and a diurnal variation of the meridional winds in the lower thermosphere, which are qualitatively somewhat similar to summer conditions, however, the wintertime daytime northward and nighttime southward phase of the meridional wind variations are different compared to the summer one. In the upper thermosphere, daytime meridional winds are northward exceeding 60 m s-1 at midlatitudes and flow easterly at dawn, and somewhat westerly and easterly at dusk.
Figure 14 shows the associated horizontal circulation during Northern winter season, as was done for the summer solstice (Figure 12). In the lower thermosphere, the circulation is overall easterly and southward (winter-to-summer), with geographically varying intensity. The upper thermosphere during daytime is dominated by a westward and northward (summer-to-winter) flow, becoming dominated by meridional component at midlatitudes.
4 Discussion
We have presented the mean zonal and meridional winds on 20 June 2020 as well as averaged over a one-month summer solstice period (8 June–7 July 2020) and 47-day winter solstice period (16 December 2019–31 January 2020), using continuous measurements of ICON/MIGHTI. The climatology of thermospheric horizontal circulation for the summer and winter solstice periods have been constructed for the first time. We next discuss dynamical forces influencing the winds and some of the noteworthy features of the observations, comparing our analysis to previous studies.
4.1 Dynamical Forces that Control Upper Atmospheric Winds
Multiple observations demonstrate that winds are extremely variable, especially in the lower thermosphere (e.g., Larsen, \APACyear2002; Larsen \BBA Fesen, \APACyear2009; Lehmacher \BOthers., \APACyear2022). In order to characterize their climatology, the data have to be averaged using appropriate bins over multiple days. What processes drive the mean and variable structure of the winds is of great interest. For this, it is instructive to discuss first the dynamical forces that control the motion of an air parcel. The complete momentum balance for neutral winds is given by (Yiğit, \APACyear2018, p. 112)
| (2) |
where is the neutral wind vector, is the thermodynamic pressure, with temperature , mass density , universal gas constant , and molar mass ; is gravitational acceleration, is the rotation rate of Earth, is the viscous shear stress, is the velocity of particles of species , which the neutrals with collision frequencies collide with, and is the momentum deposition by eddies or small-scale waves. On the right hand side of (2) from left to right the momentum balance terms are advective forcing, pressure gradient force, gravity, Coriolis force, viscous stress, frictional drag due to interactions of neutrals with charged particles, e.g., ion drag, and wave-induced momentum deposition. For an incompressible atmosphere the viscous shear stress is proportional to the vector laplacian of the wind velocity, i.e., , where is the kinematic viscosity and is the dynamic viscosity. In numerical models, the wave-induced momentum forcing is often not resolved and has to be parameterized (e.g., Yiğit \BOthers., \APACyear2008; Medvedev \BBA Yiğit, \APACyear2019). With improving resolution, global numerical models are increasingly able to capture a larger portion of subgrid-scale wave effects (e.g., Miyoshi \BOthers., \APACyear2014). Depending on the altitude, latitude, local time, and time scales of motion, various combinations of these dynamical forces shape the neutral wind circulation. In general, atmospheric dynamics is nonlinear, which can lead to winds and circulation over a broad spectrum of spatiotemporal scales and complexity, as demonstrated by ICON/MIGHTI wind analysis presented earlier.
4.2 Thermospheric Winds and Circulation during Solstice
In order to illustrate one possible way of studying wind variability seen in Figure 3, we have plotted the zonal and meridional wind speeds as a function of their occurrence rates on 20 June 2020 (Figure 4.) They generally exhibit a Gaussian distribution centered around slow speeds. Larger standard deviation found at night suggests that winds are more variable during night, which, in turn, indicates an elevated atmospheric wave activity. This is also suggested by more variable wind vectors at night (Figure 11). The atmosphere is in general less dissipative at night due, for example, to smaller molecular viscosity, providing more favorable propagation conditions for small-scale waves. The wind variability is found to increase with height, which could be linked to larger wind speeds at higher altitudes and growing with height wave amplitudes.
If dissipative effects such as wave breaking/saturation and viscosity are ignored in (2), then the large-scale behavior of the thermospheric mean winds is controlled primarily by pressure gradient force generated by the differential heating by the Sun and, to a secondary degree, by inertia (advection), ion drag, and Coriolis force, with the latter being negligible at equatorial latitudes. This simplified force balance should yield westward (eastward) mean zonal winds in the summer (winter) hemisphere and summer to winter mean meridional flow, with associated upwelling in the summer hemisphere and downwelling in the winter hemisphere as a consequence of mass continuity (Forbes, \APACyear2007). However, as observed by ICON/MIGHTI, solstitial zonal mean winds are consistently eastward in the upper mesosphere and lower thermosphere (MLT) between 90–110 km (Figures 5, 8) with increasing magnitude from low- to middle-latitudes. This feature of the zonal winds is associated with the eastward gravity wave momentum deposition in the MLT, as has been demonstrated in a number of general circulation modeling studies (Garcia \BOthers., \APACyear2007; Yiğit \BOthers., \APACyear2009; Miyoshi \BBA Yiğit, \APACyear2019; Lilienthal \BOthers., \APACyear2020; Griffith \BOthers., \APACyear2021). Eastward mean winds of up to 10–40 m s-1 were also seen around 10-40∘N in the monthly mean wind climatologies compiled as part of the Upper Atmosphere Research Satellite Reference Atmosphere Project UARS (Swinbank \BBA Ortland, \APACyear2003) and at northern midlatitudes in meteor and MF radar measurements (Conte \BOthers., \APACyear2017; Tang \BOthers., \APACyear2021; Portnyagin \BBA Solovjeva, \APACyear2000). They are a general feature of the summer midlatitudes in the MLT (Drob \BOthers., \APACyear2008; A\BPBIK. Smith, \APACyear2012). The observed dawn-dusk asymmetry in the lower thermospheric winds is noticeable as well (Figure 5c).
Lower thermospheric winds have been routinely observed by incoherent scatter radars (ISR) and meteor radars. Portnyagin \BOthers. (\APACyear1999)’s analysis of seasonal variations of the mean zonal wind observed by ground-based radars and WINDII at 95 km shows eastward winds of 40–50 m s-1 at midlatitudes for Northern Hemisphere summer conditions, which is similar to ICON/MIGHTI measurements. Zhang \BOthers. (\APACyear2003) used the Millstone Hill incoherent scatter radar (42.6∘N) to study the seasonal climatology of zonal and meridional winds in the ionospheric -region (94–130 km) and compared with WINDII observations. These results shown in their figures 2 and 3 demonstrate semidiurnal variations during all seasons. Our monthly mean zonal and meridional winds during the solstice viewed as altitude-local time cross-sections indicate a semidiurnal variation as well (Figure 8). Although the Millstone ISR provides data at a fixed latitude and here we have included all latitudes between 10∘S-40∘N, the phases of the semidiurnal variations in mean winds are quite similar. Overall, differences in the magnitudes are probably due to differences in latitude and seasonal binning.
ICON/MIGHTI provides evidence that the mean meridional winds in the MLT reverse their direction. The northward mean meridional flow (i.e., from winter to summer) seen in the MLT is opposite to the radiatively driven mean meridional flow, which is due to the direct response of the circulation to the eastward gravity wave momentum deposition in the MLT (Holton, \APACyear1983). A simple force balance based on the Transformed Eulerian Mean (TEM) analysis illustrates the role of the zonal wave forcing in driving the mean residual circulation at midlatitudes:
| (3) |
where is the total zonal force due to small-scale and non-zonal eddies/waves, is the Coriolis parameter at midlatitudes, and is the meridional component of the residual circulation (), where is the vertical component, and the overbar indicates an appropriate averaging as seen in (1). For steady-state conditions, (3) implies that the mean meridional circulation (or transport) is primarily driven by wave dissipation, i.e., . Around the midlatitutude MLT, small-scale gravity waves are the primary contributor to the zonal body force. Diurnal migrating tide-gravity wave interactions are an important mechanism of wind variability, especially in the low-latitude MLT (Miyahara \BBA Forbes, \APACyear1991; Watanabe \BBA Miyahara, \APACyear2009; Yiğit \BBA Medvedev, \APACyear2017).
Above 120 km, radiative processes and ion-neutral coupling (i.e., ion drag), which is proportional to the relative velocity of neutrals and ions moving within the magnetic field, become increasingly important in driving the horizontal circulation. ICON/MIGHTI observations show that the zonal winds are predominantly westward and southward (i.e., directed from summer to winter hemisphere) in the upper thermosphere (Figures 5–12). This large-scale flow is maintained by the pressure gradient force, modulated by ion drag and Coriolis effect. Molecular viscosity, which increases exponentially with height, smooths out smaller-scale motions, as can be seen in daytime circulation and winds between 185–200 km (Figures 11–12).
Recently, Drob \BOthers. (\APACyear2015) have updated the Horizontal Wind Model (HWM14) and provided a comparison against WINDII climatologies of Emmert \BOthers. (\APACyear2002) and an older version of HWM. Our altitude-local time analysis of mean winds at 200 km (Figures 9e-f) can qualitatively be compared with their June solstice climatology (day 180) at 250 km. There is a general agreement concerning the morphology of the mean winds. Westward zonal winds prevail during day and eastward winds around dusk at low- to midlatitudes in the Northern Hemisphere. Meridional winds are generally northward during morning and southward during afternoon.
In order to complement the northern summer solstice results, we have also compiled northern winter winds and circulation, including data from 16 December 2019 – 31 January 2020, during which no SSWs occurred (Roy \BBA Kuttippurath, \APACyear2022). Although the data sampling is not the same between these seasons, the results can be at least qualitatively compared. There is certainly a certain degree of asymmetry between the summer and winter seasons in the Northern Hemisphere in terms of the magnitude and spatial distribution of winds and circulation. The mean zonal winds are much weaker during winter than summer. The lower thermospheric westward wind reversal (Figure 13a) is also weaker in magnitude than the eastward reversal during summer (Figure 8), which qualitatively agrees with previous wind compilations in this region.
The summer-winter differences in circulation can be caused by a combination of seasonal changes in pressure forces, upward propagation conditions for gravity waves, tides, and planetary waves. Since dynamical conditions (westerly winds) are favorable for the upward propagation of planetary waves in the winter hemisphere and not in the summer hemisphere with easterlies (Yiğit \BBA Medvedev, \APACyear2016), presumably planetary waves contribute significantly to the differences between the two seasons.
5 Summary and Conclusions
We have presented the mean behavior of the thermospheric zonal and meridional winds at 90–200 km as observed by the MIGHTI instrument onboard NASA’s ICON spacecraft between 10∘S and 40∘N. A comprehensive picture of the mean zonal and meridional winds and horizontal circulation has been shown for a single solstice day, 20 June 2020, and using a month of continuous observations from 8 June–7 July 2020, representative of Northern Hemisphere solstice conditions, and a 47-day Northern Hemisphere winter solstice period from 16 December 2019–31 January 2020, primarily focusing on the northern summer solstice season.
The main inferences of our analysis of ICON/MIGHTI northern summer solstice winds are as follows:
-
1.
Altitude, longitude, latitude, and local time profiles of winds show that the typical instantaneous zonal and meridional winds during solstice can exceed 150 m s-1, with with magnitudes increasing with altitude.
-
2.
We have evaluated the occurrence rates of the wind speeds observed by ICON/MIGHTI on 20 June 2020 at three representative altitude bins 94–103 km, 106–114 km, and 194–202 km, such that each altitude bin included equal number of data. The speeds as a function of number of measurements exhibit a Gaussian distribution centered around small values. The nighttime magnitudes of the wind are greater than during day and increase as a function of height. Larger standard deviation at night suggests more variability during night, which indicate more atmospheric wave activity.
-
3.
Thermospheric mean winds are up to m s-1 and depend strongly on altitude, latitude, longitude, and local time. Local time variations of the mean winds exhibit diurnal and semidiurnal variations.
-
4.
Mean winds and circulation change substantially within the lower thermosphere (90–120 km). Eastward and southward flow between 90–105 km change to a northward and westward flow within 105–120 km. Upper thermospheric winds are generally characterized by a westward and southward (i.e., directed from the summer-to-winter) flow in the Northern Hemisphere with diverging flow from the post-noon sector at midlatitudes. The upper thermospheric wind system is more homogeneous compared to the lower thermospheric one, which exhibits spatial variations at smaller scales and vortex patterns, especially around 105–120 km.
-
5.
The observed eastward mean flow and the northward (winter-to-summer) meridional flows in the lower thermosphere are a consequence of eastward gravity wave momentum forcing there. ICON/MIGHTI observations are capable of demonstrating vertical coupling induced by waves. These features are in a good agreement with previous observations and modeling.
-
6.
Despite the seasonal differences in the data sampling size due to data gap issues, we have qualitatively compared the northern summer and winter winds. Zonal winds during winter are clearly slower than summer zonal winds. Overall, an asymmetry between the summer and winter seasons in terms of the magnitude and spatial distribution of winds and circulation is evident, which is presumably due to the differences in planetary wave propagation and interaction with the mean flow as well as to differences in the generation, propagation, and filtering in gravity waves and tides between winter and summer seasons.
-
7.
In the upper thermosphere, the morphology of the ICON/MIGHTI mean winds is, in general, in a good agreement with previous wind climatologies based on WINDII and HWM14.
The mean wind and circulation patterns inferred in this study using ICON/MIGHTI measurements can be used to constrain and validate general circulation models or as an input for numerical wave models. They also serve for an indirect validation of parameterized subgrid-scale processes, which control the large-scale winds and circulation. This work is expected to contribute towards filling in the observational gap with horizontal winds in the thermosphere.
Acknowledgements.
This work was supported by NASA (Grant Number 80NSSC22K0016). ICON is supported by NASA’s Explorers Program through contracts NNG12FA45C and NNG12FA42I.Data Availability Statement
The horizontal wind data (version 4) used in this study are available at the ICON data center (https://icon.ssl.berkeley.edu/Data).
References
- Aruliah \BOthers. (\APACyear2010) \APACinsertmetastarAruliah2010{APACrefauthors}Aruliah, A\BPBIL., Griffin, E\BPBIM., Yiu, H\BHBIC\BPBIC\BPBII., McWhirter, I.\BCBL \BBA Charalambous, A. \APACrefYearMonthDay2010. \BBOQ\APACrefatitleSCANDI - an all-sky Doppler imager for studies of thermospheric spatial structure SCANDI - an all-sky Doppler imager for studies of thermospheric spatial structure.\BBCQ \APACjournalVolNumPagesAnn. Geophys.282549–567. {APACrefDOI} 10.5194/angeo-28-549-2010 \PrintBackRefs\CurrentBib
- Chen \BOthers. (\APACyear2022) \APACinsertmetastarChen_etal22{APACrefauthors}Chen, Z., Liu, Y., Du, Z., Fan, Z., Sun, H.\BCBL \BBA Zhou, C. \APACrefYearMonthDay2022. \BBOQ\APACrefatitleValidation of MIGHTI/ICON Atmospheric Wind Observations over China Region Based on Meteor Radar and Horizontal Wind Model (HWM14) Validation of MIGHTI/ICON Atmospheric Wind Observations over China Region Based on Meteor Radar and Horizontal Wind Model (HWM14).\BBCQ \APACjournalVolNumPagesAtmosphere71078. {APACrefDOI} 10.3390/atmos13071078 \PrintBackRefs\CurrentBib
- Conde \BBA Smith (\APACyear1995) \APACinsertmetastarConde1995{APACrefauthors}Conde, M.\BCBT \BBA Smith, R\BPBIW. \APACrefYearMonthDay1995. \BBOQ\APACrefatitleMapping thermospheric winds in the auroral zone Mapping thermospheric winds in the auroral zone.\BBCQ \APACjournalVolNumPagesGeophys. Res. Lett.22223019–3022. {APACrefDOI} 10.1029/95GL02437 \PrintBackRefs\CurrentBib
- Conte \BOthers. (\APACyear2022) \APACinsertmetastarConte_etal22{APACrefauthors}Conte, J\BPBIF., Chau, J\BPBIL., Liu, A., Qiao, Z., Fritts, D\BPBIC., Hormaechea, J\BPBIL.\BDBLMilla, M\BPBIA. \APACrefYearMonthDay2022. \BBOQ\APACrefatitleComparison of MLT Momentum Fluxes Over the Andes at Four Different Latitudinal Sectors Using Multistatic Radar Configurations Comparison of MLT Momentum Fluxes Over the Andes at Four Different Latitudinal Sectors Using Multistatic Radar Configurations.\BBCQ \APACjournalVolNumPagesJ. Geophys. Res. Atmos.1274e2021JD035982. {APACrefDOI} 10.1029/2021JD035982 \PrintBackRefs\CurrentBib
- Conte \BOthers. (\APACyear2017) \APACinsertmetastarConte_etal17{APACrefauthors}Conte, J\BPBIF., Chau, J\BPBIL., Stober, G., Pedatella, N., Maute, A., Hoffmann, P.\BDBLMurphy, D\BPBIJ. \APACrefYearMonthDay2017. \BBOQ\APACrefatitleClimatology of semidiurnal lunar and solar tides at middle and high latitudes: Interhemispheric comparison Climatology of semidiurnal lunar and solar tides at middle and high latitudes: Interhemispheric comparison.\BBCQ \APACjournalVolNumPagesJ. Geophys. Res. Space Physics12277750–7760. {APACrefDOI} 10.1002/2017JA024396 \PrintBackRefs\CurrentBib
- David \BOthers. (\APACyear2014) \APACinsertmetastarDavid_etal14{APACrefauthors}David, M., Sojka, J\BPBIJ.\BCBL \BBA Schunk, R\BPBIW. \APACrefYearMonthDay2014. \BBOQ\APACrefatitleSources of uncertainty in ionospheric modeling: The neutral wind Sources of uncertainty in ionospheric modeling: The neutral wind.\BBCQ \APACjournalVolNumPagesJOURNAL of Geophysical Research: Space Physics11986792–6805. {APACrefDOI} 10.1002/2014JA020117 \PrintBackRefs\CurrentBib
- Dempsey \BOthers. (\APACyear2021) \APACinsertmetastarDempsey_etal21{APACrefauthors}Dempsey, S\BPBIM., Hindley, N\BPBIP., Moffat-Griffin, T., Wright, C\BPBIJ., Smith, A\BPBIK., Du, J.\BCBL \BBA Mitchell, N\BPBIJ. \APACrefYearMonthDay2021. \BBOQ\APACrefatitleWinds and tides of the Antarctic mesosphere and lower thermosphere: One year of meteor-radar observations over Rothera (68∘S, 68∘W) and comparisons with WACCM and eCMAM Winds and tides of the Antarctic mesosphere and lower thermosphere: One year of meteor-radar observations over Rothera (68∘S, 68∘W) and comparisons with WACCM and eCMAM.\BBCQ \APACjournalVolNumPagesJ. Atmos. Sol.-Terr. Phys.212105510. {APACrefDOI} 10.1016/j.jastp.2020.105510 \PrintBackRefs\CurrentBib
- Deng \BOthers. (\APACyear2018) \APACinsertmetastarDeng_etal18{APACrefauthors}Deng, Y., Sheng, C., Tsurutani, B\BPBIT.\BCBL \BBA Mannucci, A\BPBIJ. \APACrefYearMonthDay2018. \BBOQ\APACrefatitlePossible Influence of Extreme Magnetic Storms on the Thermosphere in the High Latitudes Possible Influence of Extreme Magnetic Storms on the Thermosphere in the High Latitudes.\BBCQ \APACjournalVolNumPagesSpace Weather167802–813. {APACrefDOI} 10.1029/2018SW001847 \PrintBackRefs\CurrentBib
- Dhadly, Emmert, Drob, Conde\BCBL \BOthers. (\APACyear2018) \APACinsertmetastarDhadly2018{APACrefauthors}Dhadly, M\BPBIS., Emmert, J\BPBIT., Drob, D\BPBIP., Conde, M., Doornbos, E., Shepherd, G.\BDBLRidley, A. \APACrefYearMonthDay2018. \BBOQ\APACrefatitleSeasonal Dependence of Geomagnetic Active-Time Northern High-Latitude Upper Thermospheric Winds Seasonal Dependence of Geomagnetic Active-Time Northern High-Latitude Upper Thermospheric Winds.\BBCQ \APACjournalVolNumPagesJournal of Geophysical Research: Space Physics1231739–754. {APACrefDOI} 10.1002/2017JA024715 \PrintBackRefs\CurrentBib
- Dhadly \BOthers. (\APACyear2019) \APACinsertmetastarDhadly2019{APACrefauthors}Dhadly, M\BPBIS., Emmert, J\BPBIT., Drob, D\BPBIP., Conde, M\BPBIG., Aruliah, A., Doornbos, E.\BDBLRidley, A\BPBIJ. \APACrefYearMonthDay2019. \BBOQ\APACrefatitleHL-TWiM Empirical Model of High-Latitude Upper Thermospheric Winds HL-TWiM Empirical Model of High-Latitude Upper Thermospheric Winds.\BBCQ \APACjournalVolNumPagesJournal of Geophysical Research: Space Physics1242019JA027188. {APACrefDOI} 10.1029/2019JA027188 \PrintBackRefs\CurrentBib
- Dhadly, Emmert, Drob, McCormack\BCBL \BBA Niciejewski (\APACyear2018) \APACinsertmetastarDhadly2018b{APACrefauthors}Dhadly, M\BPBIS., Emmert, J\BPBIT., Drob, D\BPBIP., McCormack, J\BPBIP.\BCBL \BBA Niciejewski, R\BPBIJ. \APACrefYearMonthDay2018. \BBOQ\APACrefatitleShort-Term and Interannual Variations of Migrating Diurnal and Semidiurnal Tides in the Mesosphere and Lower Thermosphere Short-term and interannual variations of migrating diurnal and semidiurnal tides in the mesosphere and lower thermosphere.\BBCQ \APACjournalVolNumPagesJournal of Geophysical Research: Space Physics12387106-7123. {APACrefDOI} https://doi.org/10.1029/2018JA025748 \PrintBackRefs\CurrentBib
- Dhadly \BOthers. (\APACyear2021) \APACinsertmetastarDhadly_etal21{APACrefauthors}Dhadly, M\BPBIS., Englert, C\BPBIR., Drob, D\BPBIP., Emmert, J\BPBIT., Niciejewski, R.\BCBL \BBA Zawdie, K\BPBIA. \APACrefYearMonthDay2021. \BBOQ\APACrefatitleComparison of ICON/MIGHTI and TIMED/TIDI Neutral Wind Measurements in the Lower Thermosphere Comparison of ICON/MIGHTI and TIMED/TIDI Neutral Wind Measurements in the Lower Thermosphere.\BBCQ \APACjournalVolNumPagesJ. Geophys. Res. Space Physics12612e2021JA029904. {APACrefDOI} 10.1029/2021JA029904 \PrintBackRefs\CurrentBib
- Doornbos \BOthers. (\APACyear2014) \APACinsertmetastardoornbos2014{APACrefauthors}Doornbos, E., Bruinsma, S\BPBIL., Fritsche, B., Koppenwallner, G., Visser, P., Van Den IJssel, J.\BCBL \BBA Teixeira da Encarnação, J. \APACrefYearMonthDay2014. \BBOQ\APACrefatitleGOCE+ Theme 3: Air density and wind retrieval using GOCE data final report GOCE+ Theme 3: Air density and wind retrieval using GOCE data final report.\BBCQ \APACjournalVolNumPagesTech. Rep.Tech. Rep.4000102847/NL/EL, TU Delft, Netherlands. \PrintBackRefs\CurrentBib
- Drob \BOthers. (\APACyear2008) \APACinsertmetastarDrob_etal08{APACrefauthors}Drob, D\BPBIP., Emmert, J\BPBIT., Crowley, G., Picone, J\BPBIM., Shepherd, G\BPBIG., Skinner, W.\BDBLVincent, R\BPBIA. \APACrefYearMonthDay2008. \BBOQ\APACrefatitleAn empirical model of the Earth’s horizontal wind fields: HWM07 An empirical model of the earth’s horizontal wind fields: Hwm07.\BBCQ \APACjournalVolNumPagesJ. Geophys. Res. Space Physics113A12. {APACrefDOI} 10.1029/2008JA013668 \PrintBackRefs\CurrentBib
- Drob \BOthers. (\APACyear2015) \APACinsertmetastarDrob_etal15{APACrefauthors}Drob, D\BPBIP., Emmert, J\BPBIT., Meriwether, J\BPBIW., Makela, J\BPBIJ., Doornbos, E., Conde, M.\BDBLKlenzing, J\BPBIH. \APACrefYearMonthDay2015. \BBOQ\APACrefatitleAn update to the Horizontal Wind Model (HWM): The quiet time thermosphere An update to the Horizontal Wind Model (HWM): The quiet time thermosphere.\BBCQ \APACjournalVolNumPagesEarth Sp. Sci.27301–319. \PrintBackRefs\CurrentBib
- Emmert (\APACyear2015) \APACinsertmetastarEmmert15{APACrefauthors}Emmert, J\BPBIT. \APACrefYearMonthDay2015. \BBOQ\APACrefatitleThermospheric mass density: A review Thermospheric mass density: A review.\BBCQ \APACjournalVolNumPagesAdv. Space Res.565773–824. {APACrefDOI} 10.1016/j.asr.2015.05.038 \PrintBackRefs\CurrentBib
- Emmert \BOthers. (\APACyear2001) \APACinsertmetastarEmmert_etal01{APACrefauthors}Emmert, J\BPBIT., Fejer, B\BPBIG., Fesen, C\BPBIG., Shepherd, G\BPBIG.\BCBL \BBA Solheim, B\BPBIH. \APACrefYearMonthDay2001. \BBOQ\APACrefatitleClimatology of middle- and low-latitude daytime F region disturbance neutral winds measured by Wind Imaging Interferometer (WINDII) Climatology of middle- and low-latitude daytime F region disturbance neutral winds measured by Wind Imaging Interferometer (WINDII).\BBCQ \APACjournalVolNumPagesJ. Geophys. Res.106A1124,701-24,712. \PrintBackRefs\CurrentBib
- Emmert \BOthers. (\APACyear2002) \APACinsertmetastarEmmert_etal02{APACrefauthors}Emmert, J\BPBIT., Fejer, B\BPBIG., Shepherd, G\BPBIG.\BCBL \BBA Solheim, B\BPBIH. \APACrefYearMonthDay2002. \BBOQ\APACrefatitleAltitude dependence of middle and low-latitude daytime thermospheric disturbance winds measured by WINDII: WINDII Daytime disturbance winds Altitude dependence of middle and low-latitude daytime thermospheric disturbance winds measured by WINDII: WINDII Daytime disturbance winds.\BBCQ \APACjournalVolNumPagesJ. Geophys. Res. Space Physics107A12SIA 19–1–SIA 19–15. {APACrefDOI} 10.1029/2002JA009646 \PrintBackRefs\CurrentBib
- England \BOthers. (\APACyear2022) \APACinsertmetastarEngland_etal22{APACrefauthors}England, S\BPBIL., Englert, C\BPBIR., Harding, B\BPBIJ., Triplett, C\BPBIC., Marr, K., Harlander, J\BPBIM.\BDBLImmel, T\BPBIJ. \APACrefYearMonthDay2022. \BBOQ\APACrefatitleVertical Shears of Horizontal Winds in the Lower Thermosphere Observed by ICON Vertical Shears of Horizontal Winds in the Lower Thermosphere Observed by ICON.\BBCQ \APACjournalVolNumPagesGeophys. Res. Lett.4911e2022GL098337. {APACrefDOI} 10.1029/2022GL098337 \PrintBackRefs\CurrentBib
- Englert \BOthers. (\APACyear2017) \APACinsertmetastarEnglert_etal17{APACrefauthors}Englert, C\BPBIR., Harlander, J\BPBIM., Brown, C\BPBIM., Marr, K\BPBID., Miller, I\BPBIJ., Stump, J\BPBIE.\BDBLImmel, T\BPBIJ. \APACrefYearMonthDay2017. \BBOQ\APACrefatitleMichelson Interferometer for Global High-Resolution Thermospheric Imaging (MIGHTI): Instrument Design and Calibration Michelson Interferometer for Global High-Resolution Thermospheric Imaging (MIGHTI): Instrument Design and Calibration.\BBCQ \APACjournalVolNumPagesSpace Sci. Rev.2121553–584. {APACrefDOI} 10.1007/s11214-017-0358-4 \PrintBackRefs\CurrentBib
- Forbes (\APACyear2007) \APACinsertmetastarForbes07{APACrefauthors}Forbes, J\BPBIM. \APACrefYearMonthDay2007. \BBOQ\APACrefatitleDynamics of the upper mesosphere and thermosphere Dynamics of the upper mesosphere and thermosphere.\BBCQ \APACjournalVolNumPagesJ. Meteor. Soc. Japan85B193–213. \PrintBackRefs\CurrentBib
- Forbes \BOthers. (\APACyear2021) \APACinsertmetastarForbes_etal21{APACrefauthors}Forbes, J\BPBIM., Zhang, X., Heelis, R., Stoneback, R., Englert, C\BPBIR., Harlander, J\BPBIM.\BDBLImmel, T\BPBIJ. \APACrefYearMonthDay2021. \BBOQ\APACrefatitleAtmosphere-Ionosphere (A-I) Coupling as Viewed by ICON: Day-to-Day Variability Due to Planetary Wave (PW)-Tide Interactions Atmosphere-Ionosphere (A-I) Coupling as Viewed by ICON: Day-to-Day Variability Due to Planetary Wave (PW)-Tide Interactions.\BBCQ \APACjournalVolNumPagesJ. Geophys. Res. Space Physics1266e2020JA028927. {APACrefDOI} 10.1029/2020JA028927 \PrintBackRefs\CurrentBib
- Garcia \BOthers. (\APACyear2007) \APACinsertmetastarGarcia_etal07{APACrefauthors}Garcia, R\BPBIR., Marsh, D\BPBIR., Kinnison, D\BPBIE., Boville, B\BPBIA.\BCBL \BBA Sassi, F. \APACrefYearMonthDay2007. \BBOQ\APACrefatitleSimulations of secular trends in the middle atmosphere Simulations of secular trends in the middle atmosphere.\BBCQ \APACjournalVolNumPagesJ. Geophys. Res.112. {APACrefDOI} 10.1029/2006JD007485 \PrintBackRefs\CurrentBib
- Gavrilov \BOthers. (\APACyear2020) \APACinsertmetastarGavrilov_etal20{APACrefauthors}Gavrilov, N\BPBIM., Kshevetskii, S\BPBIP.\BCBL \BBA Koval, A\BPBIV. \APACrefYearMonthDay2020. \BBOQ\APACrefatitleThermal effects of nonlinear acoustic-gravity waves propagating at thermospheric temperatures matching high and low solar activity Thermal effects of nonlinear acoustic-gravity waves propagating at thermospheric temperatures matching high and low solar activity.\BBCQ \APACjournalVolNumPagesJ. Atmos. Sol.-Terr. Phys.105381. {APACrefDOI} 10.1016/j.jastp.2020.105381 \PrintBackRefs\CurrentBib
- Geisler (\APACyear1966) \APACinsertmetastarGeisler66{APACrefauthors}Geisler, J\BPBIE. \APACrefYearMonthDay1966. \BBOQ\APACrefatitleAtmospheric winds in the middle latitude F-region Atmospheric winds in the middle latitude F-region.\BBCQ \APACjournalVolNumPagesJ. Atmos. Terr. Phys.288703–720. {APACrefDOI} 10.1016/0021-9169(66)90020-1 \PrintBackRefs\CurrentBib
- Griffith \BOthers. (\APACyear2021) \APACinsertmetastarGriffith_etal21{APACrefauthors}Griffith, M\BPBIJ., Dempsey, S\BPBIM., Jackson, D\BPBIR., Moffat-Griffin, T.\BCBL \BBA Mitchell, N\BPBIJ. \APACrefYearMonthDay2021. \BBOQ\APACrefatitleWinds and tides of the Extended Unified Model in the mesosphere and lower thermosphere validated with meteor radar observations Winds and tides of the Extended Unified Model in the mesosphere and lower thermosphere validated with meteor radar observations.\BBCQ \APACjournalVolNumPagesAnn. Geophys.393487–514. {APACrefDOI} 10.5194/angeo-39-487-2021 \PrintBackRefs\CurrentBib
- Harding \BOthers. (\APACyear2021) \APACinsertmetastarHarding_etal21{APACrefauthors}Harding, B\BPBIJ., Chau, J\BPBIL., He, M., Englert, C\BPBIR., Harlander, J\BPBIM., Marr, K\BPBID.\BDBLImmel, T\BPBIJ. \APACrefYearMonthDay2021. \BBOQ\APACrefatitleValidation of ICON-MIGHTI Thermospheric Wind Observations: 2. Green-Line Comparisons to Specular Meteor Radars Validation of ICON-MIGHTI Thermospheric Wind Observations: 2. Green-Line Comparisons to Specular Meteor Radars.\BBCQ \APACjournalVolNumPagesJ. Geophys. Res. Space Physics1263e2020JA028947. {APACrefDOI} 10.1029/2020JA028947 \PrintBackRefs\CurrentBib
- Harding \BOthers. (\APACyear2017) \APACinsertmetastarHarding_etal17{APACrefauthors}Harding, B\BPBIJ., Makela, J\BPBIJ., Englert, C\BPBIR., Marr, K\BPBID., Harlander, J\BPBIM., England, S\BPBIL.\BCBL \BBA Immel, T\BPBIJ. \APACrefYearMonthDay2017. \BBOQ\APACrefatitleThe MIGHTI Wind Retrieval Algorithm: Description and Verification The MIGHTI Wind Retrieval Algorithm: Description and Verification.\BBCQ \APACjournalVolNumPagesSpace Sci. Rev.2121585–600. {APACrefDOI} 10.1007/s11214-017-0359-3 \PrintBackRefs\CurrentBib
- Hickey \BOthers. (\APACyear2011) \APACinsertmetastarHickey_etal11{APACrefauthors}Hickey, M\BPBIP., Walterscheid, R\BPBIL.\BCBL \BBA Schubert, G. \APACrefYearMonthDay2011. \BBOQ\APACrefatitleGravity wave heating and cooling of the thermosphere: Sensible heat flux and viscous flux of kinetic energy Gravity wave heating and cooling of the thermosphere: Sensible heat flux and viscous flux of kinetic energy.\BBCQ \APACjournalVolNumPagesJ. Geophys. Res.116. {APACrefDOI} 10.1029/2011JA016792 \PrintBackRefs\CurrentBib
- Holton (\APACyear1983) \APACinsertmetastarHolton83{APACrefauthors}Holton, J\BPBIR. \APACrefYearMonthDay1983. \BBOQ\APACrefatitleThe influence of gravity wave breaking on the general circulation of the middle atmosphere The influence of gravity wave breaking on the general circulation of the middle atmosphere.\BBCQ \APACjournalVolNumPagesJ. Atmos. Sci.402497–2507. \PrintBackRefs\CurrentBib
- Hysell \BOthers. (\APACyear2014) \APACinsertmetastarHysell_etal14{APACrefauthors}Hysell, D\BPBIL., Larsen, M\BPBIF.\BCBL \BBA Sulzer, M\BPBIP. \APACrefYearMonthDay2014. \BBOQ\APACrefatitleHigh time and height resolution neutral wind profile measurements across the mesosphere/lower thermosphere region using the Arecibo incoherent scatter radar High time and height resolution neutral wind profile measurements across the mesosphere/lower thermosphere region using the Arecibo incoherent scatter radar.\BBCQ \APACjournalVolNumPagesJ. Geophys. Res. Space Physics11932345–2358. {APACrefDOI} 10.1002/2013JA019621 \PrintBackRefs\CurrentBib
- Immel \BOthers. (\APACyear2018) \APACinsertmetastarImmel_etal18{APACrefauthors}Immel, T\BPBIJ., England, S\BPBIL., Mende, S\BPBIB., Heelis, R\BPBIA., Englert, C\BPBIR., Edelstein, J.\BDBLSirk, M\BPBIM. \APACrefYearMonthDay2018. \BBOQ\APACrefatitleThe Ionospheric Connection Explorer Mission: Mission Goals and Design The Ionospheric Connection Explorer Mission: Mission Goals and Design.\BBCQ \APACjournalVolNumPagesSpace Sci. Rev.2141553–584. {APACrefDOI} 10.1007/s11214-017-0449-2 \PrintBackRefs\CurrentBib
- Killeen \BBA Roble (\APACyear1988) \APACinsertmetastarKilleen1988{APACrefauthors}Killeen, T\BPBIL.\BCBT \BBA Roble, R\BPBIG. \APACrefYearMonthDay1988. \BBOQ\APACrefatitleThermosphere dynamics: Contributions from the first 5 years of the Dynamics Explorer Program Thermosphere dynamics: Contributions from the first 5 years of the Dynamics Explorer Program.\BBCQ \APACjournalVolNumPagesReviews of Geophysics262329–367. {APACrefDOI} 10.1029/RG026i002p00329 \PrintBackRefs\CurrentBib
- Koval \BOthers. (\APACyear2022) \APACinsertmetastarKoval_etal22{APACrefauthors}Koval, A\BPBIV., Gavrilov, N\BPBIM., Pogoreltsev, A\BPBII.\BCBL \BBA Kandieva, K\BPBIK. \APACrefYearMonthDay2022. \BBOQ\APACrefatitleDynamical Impacts of Stratospheric QBO on the Global Circulation up to the Lower Thermosphere Dynamical Impacts of Stratospheric QBO on the Global Circulation up to the Lower Thermosphere.\BBCQ \APACjournalVolNumPagesJ. Geophys. Res. Atmos.1274e2021JD036095. {APACrefDOI} 10.1029/2021JD036095 \PrintBackRefs\CurrentBib
- Larsen (\APACyear2002) \APACinsertmetastarLarsen02{APACrefauthors}Larsen, M\BPBIF. \APACrefYearMonthDay2002. \BBOQ\APACrefatitleWinds and shears in the mesosphere and lower thermosphere: Results from four decades of chemical release wind measurements Winds and shears in the mesosphere and lower thermosphere: Results from four decades of chemical release wind measurements.\BBCQ \APACjournalVolNumPagesJ. Geophys. Res.107A8. {APACrefDOI} 10.1029/2001JA000218 \PrintBackRefs\CurrentBib
- Larsen \BBA Fesen (\APACyear2009) \APACinsertmetastarLarsenfesen09{APACrefauthors}Larsen, M\BPBIF.\BCBT \BBA Fesen, C\BPBIG. \APACrefYearMonthDay2009. \BBOQ\APACrefatitleAccuracy issues of the existing thermospheric wind models: can we rely on them in seeking solutions to wind-driven problems? Accuracy issues of the existing thermospheric wind models: can we rely on them in seeking solutions to wind-driven problems?\BBCQ \APACjournalVolNumPagesAnn. Geophys.272277–-2284. \PrintBackRefs\CurrentBib
- Lehmacher \BOthers. (\APACyear2022) \APACinsertmetastarLehrmacher_etal22{APACrefauthors}Lehmacher, G\BPBIA., Larsen, M\BPBIF.\BCBL \BBA Zanetti, J. \APACrefYearMonthDay2022. \BBOQ\APACrefatitleMesoscale Spatial Variability of Lower Thermospheric Winds During the Anomalous Transport Rocket Experiment Mesoscale Spatial Variability of Lower Thermospheric Winds During the Anomalous Transport Rocket Experiment.\BBCQ \APACjournalVolNumPagesJ. Geophys. Res. Space Physics1275e2022JA030378. {APACrefDOI} 10.1029/2022JA030378 \PrintBackRefs\CurrentBib
- Lieberman \BOthers. (\APACyear2013) \APACinsertmetastarLieberman_etal13{APACrefauthors}Lieberman, R\BPBIS., Akmaev, R\BPBIA., Fuller‒Rowell, T\BPBIJ.\BCBL \BBA Doornbos, E. \APACrefYearMonthDay2013. \BBOQ\APACrefatitleThermospheric zonal mean winds and tides revealed by CHAMP Thermospheric zonal mean winds and tides revealed by CHAMP.\BBCQ \APACjournalVolNumPagesGeophys. Res. Lett.40102439–2443. {APACrefDOI} 10.1002/grl.50481 \PrintBackRefs\CurrentBib
- Lieberman \BOthers. (\APACyear2000) \APACinsertmetastarLieberman_etal00{APACrefauthors}Lieberman, R\BPBIS., Smith, A\BPBIK., Franke, S\BPBIJ., Vincent, R\BPBIA., Isler, J\BPBIR., Manson, A\BPBIH.\BDBLTsuda, T. \APACrefYearMonthDay2000. \BBOQ\APACrefatitleComparison of mesospheric and lower thermospheric residual wind with High Resolution Doppler Imager, medium frequency, and meteor radar winds Comparison of mesospheric and lower thermospheric residual wind with High Resolution Doppler Imager, medium frequency, and meteor radar winds.\BBCQ \APACjournalVolNumPagesJ. Geophys. Res. Atmos.105D2227023–27035. {APACrefDOI} 10.1029/2000JD900363 \PrintBackRefs\CurrentBib
- Lilienthal \BOthers. (\APACyear2020) \APACinsertmetastarLilienthal_etal20{APACrefauthors}Lilienthal, F., Yiğit, E., Samtleben, N.\BCBL \BBA Jacobi, C. \APACrefYearMonthDay2020. \BBOQ\APACrefatitleVariability of Gravity Wave Effects on the Zonal Mean Circulation and Migrating Terdiurnal Tide as Studied With the Middle and Upper Atmosphere Model (MUAM2019) Using a Nonlinear Gravity Wave Scheme Variability of gravity wave effects on the zonal mean circulation and migrating terdiurnal tide as studied with the middle and upper atmosphere model (MUAM2019) using a nonlinear gravity wave scheme.\BBCQ \APACjournalVolNumPagesFront. Astron. Space Sci.20207:588956. {APACrefDOI} 10.3389/fspas.2020.588956 \PrintBackRefs\CurrentBib
- Liu \BOthers. (\APACyear2006) \APACinsertmetastarLiuH_etal06{APACrefauthors}Liu, H., Lühr, H., Watanabe, S., Köhler, W., Henize, V.\BCBL \BBA Visser, P. \APACrefYearMonthDay2006. \BBOQ\APACrefatitleZonal winds in the equatorial upper thermosphere: Decomposing the solar flux, geomagnetic activity, and seasonal dependencies Zonal winds in the equatorial upper thermosphere: Decomposing the solar flux, geomagnetic activity, and seasonal dependencies.\BBCQ \APACjournalVolNumPagesJ. Geophys. Res. Space Physics111A7. {APACrefDOI} 10.1029/2005JA011415 \PrintBackRefs\CurrentBib
- Makela \BOthers. (\APACyear2021) \APACinsertmetastarMakela_etal21{APACrefauthors}Makela, J\BPBIJ., Baughman, M., Navarro, L\BPBIA., Harding, B\BPBIJ., Englert, C\BPBIR., Harlander, J\BPBIM.\BDBLImmel, T\BPBIJ. \APACrefYearMonthDay2021. \BBOQ\APACrefatitleValidation of ICON-MIGHTI Thermospheric Wind Observations: 1. Nighttime Red-Line Ground-Based Fabry-Perot Interferometers Validation of ICON-MIGHTI Thermospheric Wind Observations: 1. Nighttime Red-Line Ground-Based Fabry-Perot Interferometers.\BBCQ \APACjournalVolNumPagesJ. Geophys. Res. Space Physics1262e2020JA028726. {APACrefDOI} 10.1029/2020JA028726 \PrintBackRefs\CurrentBib
- Makela \BOthers. (\APACyear2012) \APACinsertmetastarMakela2012{APACrefauthors}Makela, J\BPBIJ., Meriwether, J\BPBIW., Ridley, A\BPBIJ., Ciocca, M.\BCBL \BBA Castellez, M\BPBIW. \APACrefYearMonthDay2012. \BBOQ\APACrefatitleLarge-scale measurements of thermospheric dynamics with a multisite Fabry-Perot interferometer network: Overview of plans and results from midlatitude measurements Large-scale measurements of thermospheric dynamics with a multisite Fabry-Perot interferometer network: Overview of plans and results from midlatitude measurements.\BBCQ \APACjournalVolNumPagesInt. J. Geophys.20123872140. {APACrefDOI} 10.1155/2012/872140 \PrintBackRefs\CurrentBib
- Medvedev \BBA Yiğit (\APACyear2019) \APACinsertmetastarMedvedevYigit19{APACrefauthors}Medvedev, A\BPBIS.\BCBT \BBA Yiğit, E. \APACrefYearMonthDay2019. \BBOQ\APACrefatitleGravity Waves in Planetary Atmospheres: Their Effects and Parameterization in Global Circulation Models Gravity waves in planetary atmospheres: Their effects and parameterization in global circulation models.\BBCQ \APACjournalVolNumPagesAtmosphere10531. {APACrefDOI} 10.3390/atmos10090531 \PrintBackRefs\CurrentBib
- Meriwether (\APACyear2006) \APACinsertmetastarMeriwether2006{APACrefauthors}Meriwether, J. \APACrefYearMonthDay2006. \BBOQ\APACrefatitleStudies of thermospheric dynamics with a Fabry–Perot interferometer network: A review Studies of thermospheric dynamics with a fabry–perot interferometer network: A review.\BBCQ \APACjournalVolNumPagesJournal of Atmospheric and Solar-Terrestrial Physics68131576-1589. {APACrefDOI} https://doi.org/10.1016/j.jastp.2005.11.014 \PrintBackRefs\CurrentBib
- Miyahara \BBA Forbes (\APACyear1991) \APACinsertmetastarMiyaharaForbes91{APACrefauthors}Miyahara, S.\BCBT \BBA Forbes, J\BPBIM. \APACrefYearMonthDay1991. \BBOQ\APACrefatitleInteractions between gravity waves and the diurnal tide in the mesosphere and lower thermosphere Interactions between gravity waves and the diurnal tide in the mesosphere and lower thermosphere.\BBCQ \APACjournalVolNumPagesJ. Meteor. Soc. Japan69523–531. \PrintBackRefs\CurrentBib
- Miyoshi \BOthers. (\APACyear2014) \APACinsertmetastarMiyoshi_etal14{APACrefauthors}Miyoshi, Y., Fujiwara, H., Jin, H.\BCBL \BBA Shinagawa, H. \APACrefYearMonthDay2014. \BBOQ\APACrefatitleA global view of gravity waves in the thermosphere simulated by a general circulation model A global view of gravity waves in the thermosphere simulated by a general circulation model.\BBCQ \APACjournalVolNumPagesJ. Geophys. Res. Space Physics1195807–5820. {APACrefDOI} 10.1002/ 2014JA019848 \PrintBackRefs\CurrentBib
- Miyoshi \BBA Yiğit (\APACyear2019) \APACinsertmetastarMiyoshiYigit19{APACrefauthors}Miyoshi, Y.\BCBT \BBA Yiğit, E. \APACrefYearMonthDay2019. \BBOQ\APACrefatitleImpact of gravity wave drag on the thermospheric circulation: Implementation of a nonlinear gravity wave parameterization in a whole atmosphere model Impact of gravity wave drag on the thermospheric circulation: Implementation of a nonlinear gravity wave parameterization in a whole atmosphere model.\BBCQ \APACjournalVolNumPagesAnn. Geophys.37955–969. {APACrefDOI} 10.5194/angeo-37-955-2019 \PrintBackRefs\CurrentBib
- Niciejewski \BOthers. (\APACyear2006) \APACinsertmetastarNiciejewski2006{APACrefauthors}Niciejewski, R., Wu, Q., Skinner, W., Gell, D., Cooper, M., Marshall, A.\BDBLOrtland, D. \APACrefYearMonthDay2006. \BBOQ\APACrefatitleTIMED Doppler Interferometer on the Thermosphere Ionosphere Mesosphere Energetics and Dynamics satellite: Data product overview TIMED Doppler Interferometer on the Thermosphere Ionosphere Mesosphere Energetics and Dynamics satellite: Data product overview.\BBCQ \APACjournalVolNumPagesJournal of Geophysical Research111A11A11S90. {APACrefDOI} 10.1029/2005JA011513 \PrintBackRefs\CurrentBib
- Oberheide \BOthers. (\APACyear2015) \APACinsertmetastarOberheide_etal15{APACrefauthors}Oberheide, J., Shiokawa, K., Gurubaran, S., Ward, W\BPBIE., Fujiwara, H., Kosch, M\BPBIJ.\BDBLTakahashi, H. \APACrefYearMonthDay2015. \BBOQ\APACrefatitleThe geospace response to variable inputs from the lower atmosphere: a review of the progress made by Task Group 4 of CAWSES-II The geospace response to variable inputs from the lower atmosphere: a review of the progress made by Task Group 4 of CAWSES-II.\BBCQ \APACjournalVolNumPagesProgress in Earth and Planetary Sciences2. {APACrefDOI} 10.1186/s40645-014-0031-4 \PrintBackRefs\CurrentBib
- Oppenheim \BOthers. (\APACyear2009) \APACinsertmetastarOppenheim_etal09{APACrefauthors}Oppenheim, M\BPBIM., Sugar, G., Slowey, N\BPBIO., Bass, E., Chau, J\BPBIL.\BCBL \BBA Close, S. \APACrefYearMonthDay2009. \BBOQ\APACrefatitleRemote sensing lower thermosphere wind profiles using non-specular meteor echoes Remote sensing lower thermosphere wind profiles using non-specular meteor echoes.\BBCQ \APACjournalVolNumPagesGeophys. Res. Lett.369L09817. {APACrefDOI} 10.1029/2009GL037353 \PrintBackRefs\CurrentBib
- Pancheva \BBA Mukhtarov (\APACyear2012) \APACinsertmetastarPanchevaMukhtarov12{APACrefauthors}Pancheva, D.\BCBT \BBA Mukhtarov, P. \APACrefYearMonthDay2012. \BBOQ\APACrefatitleGlobal response of the ionosphere to atmospheric tides forced from below: Recent progress based on satellite measurements Global response of the ionosphere to atmospheric tides forced from below: Recent progress based on satellite measurements.\BBCQ \APACjournalVolNumPagesSpace Sci. Rev.1681-4175–209. \PrintBackRefs\CurrentBib
- Pancheva \BOthers. (\APACyear2020) \APACinsertmetastarPancheva_etal20{APACrefauthors}Pancheva, D., Mukhtarov, P., Hall, C., Meek, C., Tsutsumi, M., Pedatella, N.\BDBLManson, A. \APACrefYearMonthDay2020. \BBOQ\APACrefatitleClimatology of the main (24-h and 12-h) tides observed by meteor radars at Svalbard and Tromsø: Comparison with the models CMAM-DAS and WACCM-X Climatology of the main (24-h and 12-h) tides observed by meteor radars at Svalbard and Tromsø: Comparison with the models CMAM-DAS and WACCM-X.\BBCQ \APACjournalVolNumPagesJ. Atmos. Sol.-Terr. Phys.207105339. {APACrefDOI} 10.1016/j.jastp.2020.105339 \PrintBackRefs\CurrentBib
- Portnyagin \BBA Solovjeva (\APACyear2000) \APACinsertmetastarPortnyagin00{APACrefauthors}Portnyagin, Y\BPBII.\BCBT \BBA Solovjeva, T\BPBIV. \APACrefYearMonthDay2000. \BBOQ\APACrefatitleGlobal empirical wind model for the upper mesosphere/lower thermosphere. I. Prevailing wind. Global empirical wind model for the upper mesosphere/lower thermosphere. i. prevailing wind.\BBCQ \APACjournalVolNumPagesAnnales Geophysicae18300–315. \PrintBackRefs\CurrentBib
- Portnyagin \BOthers. (\APACyear1999) \APACinsertmetastarPortnyagin_etal99{APACrefauthors}Portnyagin, Y\BPBII., Solovjova, T\BPBIV.\BCBL \BBA Wang, D\BPBIY. \APACrefYearMonthDay1999. \BBOQ\APACrefatitleSome results of comparison between the lower thermosphere zonal winds as seen by the ground-based radars and WINDII on UARS Some results of comparison between the lower thermosphere zonal winds as seen by the ground-based radars and WINDII on UARS.\BBCQ \APACjournalVolNumPagesEarth Planets Space517701–709. {APACrefDOI} 10.1186/BF03353228 \PrintBackRefs\CurrentBib
- Richmond \BOthers. (\APACyear1992) \APACinsertmetastarRichmond_etal92{APACrefauthors}Richmond, A\BPBID., Ridley, E\BPBIC.\BCBL \BBA Roble, R\BPBIG. \APACrefYearMonthDay1992. \BBOQ\APACrefatitleA thermosphere/ionosphere general circulation model with coupled electrodynamics A thermosphere/ionosphere general circulation model with coupled electrodynamics.\BBCQ \APACjournalVolNumPagesGeophys. Res. Lett.19601–604. \PrintBackRefs\CurrentBib
- Rishbeth \BOthers. (\APACyear1969) \APACinsertmetastarRishbeth_etal69{APACrefauthors}Rishbeth, H., Moffett, R.\BCBL \BBA Bailey, G. \APACrefYearMonthDay1969. \BBOQ\APACrefatitleContinuity of air motion in the mid-latitude thermosphere Continuity of air motion in the mid-latitude thermosphere.\BBCQ \APACjournalVolNumPagesJ. Atmos. Terr. Phys.3181035–1047. {APACrefDOI} 10.1016/0021-9169(69)90103-2 \PrintBackRefs\CurrentBib
- Roy \BBA Kuttippurath (\APACyear2022) \APACinsertmetastarroy_2022_DynamicalEvolutionSudden{APACrefauthors}Roy, R.\BCBT \BBA Kuttippurath, J. \APACrefYearMonthDay2022. \BBOQ\APACrefatitleThe Dynamical Evolution of Sudden Stratospheric Warmings of the Arctic Winters in the Past Decade 2011–2021 The dynamical evolution of Sudden Stratospheric Warmings of the Arctic winters in the past decade 2011–2021.\BBCQ \APACjournalVolNumPagesSN Appl. Sci.44105. {APACrefDOI} 10.1007/s42452-022-04983-4 \PrintBackRefs\CurrentBib
- Schunk \BBA Sojka (\APACyear1996) \APACinsertmetastarSchunkSojka96{APACrefauthors}Schunk, R\BPBIW.\BCBT \BBA Sojka, J\BPBIJ. \APACrefYearMonthDay1996. \BBOQ\APACrefatitleIonosphere-thermosphere space weather Ionosphere-thermosphere space weather.\BBCQ \APACjournalVolNumPagesJ. Atmos. Terr. Phys.581527–1574. \PrintBackRefs\CurrentBib
- Shiokawa \BBA Georgieva (\APACyear2021) \APACinsertmetastarShiokawaGeorgieva21{APACrefauthors}Shiokawa, K.\BCBT \BBA Georgieva, K. \APACrefYearMonthDay2021. \BBOQ\APACrefatitleA review of the SCOSTEP’s 5-year scientific program VarSITI—Variability of the Sun and Its Terrestrial Impact A review of the SCOSTEP’s 5-year scientific program VarSITI—Variability of the Sun and Its Terrestrial Impact.\BBCQ \APACjournalVolNumPagesProgress in Earth and Planetary Sciences8121. {APACrefDOI} 10.1186/s40645-021-00410-1 \PrintBackRefs\CurrentBib
- A\BPBIK. Smith (\APACyear2012) \APACinsertmetastarSmith12{APACrefauthors}Smith, A\BPBIK. \APACrefYearMonthDay2012. \BBOQ\APACrefatitleGlobal dynamics of the MLT Global dynamics of the MLT.\BBCQ \APACjournalVolNumPagesSurv. Geophys.33. {APACrefDOI} 10.1007/s10712-012-9196-9 \PrintBackRefs\CurrentBib
- R\BPBIW. Smith (\APACyear1998) \APACinsertmetastarSmith98{APACrefauthors}Smith, R\BPBIW. \APACrefYearMonthDay1998. \BBOQ\APACrefatitleVertical winds: a tutorial Vertical winds: a tutorial.\BBCQ \APACjournalVolNumPagesJ. Atmos. Sol.-Terr. Phys.601425–1434. \PrintBackRefs\CurrentBib
- Swinbank \BBA Ortland (\APACyear2003) \APACinsertmetastarSwinbankOrtland03{APACrefauthors}Swinbank, R.\BCBT \BBA Ortland, D\BPBIA. \APACrefYearMonthDay2003. \BBOQ\APACrefatitleCompilation of wind data for the Upper Atmosphere Research Satellite (UARS) Reference Atmosphere Project Compilation of wind data for the upper atmosphere research satellite (UARS) reference atmosphere project.\BBCQ \APACjournalVolNumPagesJ. Geophys. Res.108(D19). {APACrefDOI} 10.1029/2002JD003135 \PrintBackRefs\CurrentBib
- Tang \BOthers. (\APACyear2021) \APACinsertmetastarTang_etal21{APACrefauthors}Tang, Q., Zhou, Y., Du, Z., Zhou, C., Qiao, J., Liu, Y.\BCBL \BBA Chen, G. \APACrefYearMonthDay2021. \BBOQ\APACrefatitleA Comparison of Meteor Radar Observation over China Region with Horizontal Wind Model (HWM14) A Comparison of Meteor Radar Observation over China Region with Horizontal Wind Model (HWM14).\BBCQ \APACjournalVolNumPagesAtmosphere12198. {APACrefDOI} 10.3390/atmos12010098 \PrintBackRefs\CurrentBib
- Vichare \BOthers. (\APACyear2012) \APACinsertmetastarVichare_etal12{APACrefauthors}Vichare, G., Ridley, A.\BCBL \BBA Yiğit, E. \APACrefYearMonthDay2012. \BBOQ\APACrefatitleQuiet-time low latitude ionospheric electrodynamics in the non-hydrostatic Global Ionosphere–Thermosphere Model Quiet-time low latitude ionospheric electrodynamics in the non-hydrostatic global ionosphere–thermosphere model.\BBCQ \APACjournalVolNumPagesJ. Atmos. Sol.-Terr. Phys.80161–172. {APACrefDOI} 10.1016/j.jastp.2012.01.009 \PrintBackRefs\CurrentBib
- Ward \BOthers. (\APACyear2021) \APACinsertmetastarWard_etal21{APACrefauthors}Ward, W., Seppälä, A., Yiğit, E., Nakamura, T., Stolle, C., Laštovička, J.\BDBLPallamraju, D. \APACrefYearMonthDay2021. \BBOQ\APACrefatitleRole Of the Sun and the Middle atmosphere/thermosphere/ionosphere In Climate (ROSMIC): a retrospective and prospective view Role Of the Sun and the Middle atmosphere/thermosphere/ionosphere In Climate (ROSMIC): a retrospective and prospective view.\BBCQ \APACjournalVolNumPagesProgress in Earth and Planetary Sciences8147. {APACrefDOI} 10.1186/s40645-021-00433-8 \PrintBackRefs\CurrentBib
- Watanabe \BBA Miyahara (\APACyear2009) \APACinsertmetastarWatanabeMiyahara09{APACrefauthors}Watanabe, S.\BCBT \BBA Miyahara, S. \APACrefYearMonthDay2009. \BBOQ\APACrefatitleQuantification of the gravity wave forcing of the migrating diurnal tide in a gravity wave–resolving general circulation model Quantification of the gravity wave forcing of the migrating diurnal tide in a gravity wave–resolving general circulation model.\BBCQ \APACjournalVolNumPagesJ. Geophys. Res.114. {APACrefDOI} 10.1029/2008JD011218 \PrintBackRefs\CurrentBib
- \APACciteatitleThe Wind Imaging Interferometer (WINDII) on the Upper Atmosphere Research Satellite: A 20 YEAR perspective (\APACyear2012) \APACinsertmetastarShepherd_etal12\BBOQ\APACrefatitleThe Wind Imaging Interferometer (WINDII) on the Upper Atmosphere Research Satellite: A 20 YEAR perspective The wind imaging interferometer (WINDII) on the upper atmosphere research satellite: A 20 year perspective.\BBCQ \APACrefYearMonthDay2012. \APACjournalVolNumPagesRev. Geophys.502n/a–n/a. {APACrefURL} http://dx.DOI.org/10.1029/2012RG000390 {APACrefDOI} 10.1029/2012RG000390 \PrintBackRefs\CurrentBib
- Yamazaki \BOthers. (\APACyear2022) \APACinsertmetastarYamazaki_etal22{APACrefauthors}Yamazaki, Y., Arras, C., Andoh, S., Miyoshi, Y., Shinagawa, H., Harding, B\BPBIJ.\BDBLStolle, C. \APACrefYearMonthDay2022. \BBOQ\APACrefatitleExamining the Wind Shear Theory of Sporadic E With ICON/MIGHTI Winds and COSMIC-2 Radio Occultation Data Examining the Wind Shear Theory of Sporadic E With ICON/MIGHTI Winds and COSMIC-2 Radio Occultation Data.\BBCQ \APACjournalVolNumPagesGeophys. Res. Lett.491e2021GL096202. {APACrefDOI} 10.1029/2021GL096202 \PrintBackRefs\CurrentBib
- Yiğit (\APACyear2018) \APACinsertmetastarYigit18{APACrefauthors}Yiğit, E. \APACrefYear2018. \APACrefbtitleAtmospheric and Space Sciences: Ionospheres and Plasma Environments (Volume 2) Atmospheric and space sciences: Ionospheres and plasma environments (volume 2). \APACaddressPublisherSpringer, Netherlands. {APACrefDOI} 10.1007/978-3-319-62006-0 \PrintBackRefs\CurrentBib
- Yiğit \BOthers. (\APACyear2021) \APACinsertmetastarYigit_etal21a{APACrefauthors}Yiğit, E., Alexander, A\BPBIS.\BCBL \BBA Ern, M. \APACrefYearMonthDay2021. \BBOQ\APACrefatitleEffects of Latitude-Dependent Gravity Wave Source Variations on the Middle and Upper Atmosphere Effects of Latitude-Dependent Gravity Wave Source Variations on the Middle and Upper Atmosphere.\BBCQ \APACjournalVolNumPagesFront. Astron. Space Sci.7. {APACrefDOI} 10.3389/fspas.2020.614018 \PrintBackRefs\CurrentBib
- Yiğit \BOthers. (\APACyear2008) \APACinsertmetastarYigit_etal08{APACrefauthors}Yiğit, E., Aylward, A\BPBID.\BCBL \BBA Medvedev, A\BPBIS. \APACrefYearMonthDay2008. \BBOQ\APACrefatitleParameterization of the effects of vertically propagating gravity waves for thermosphere general circulation models: Sensitivity study Parameterization of the effects of vertically propagating gravity waves for thermosphere general circulation models: Sensitivity study.\BBCQ \APACjournalVolNumPagesJ. Geophys. Res.113. {APACrefDOI} 10.1029/2008JD010135 \PrintBackRefs\CurrentBib
- Yiğit, Frey\BCBL \BOthers. (\APACyear2016) \APACinsertmetastarYigit_etal16a{APACrefauthors}Yiğit, E., Frey, H\BPBIU., Moldwin, M\BPBIB., Immel, T\BPBIJ.\BCBL \BBA Ridley, A\BPBIJ. \APACrefYearMonthDay2016. \BBOQ\APACrefatitleHemispheric differences in the response of the upper atmosphere to the August 2011 geomagnetic storm: A simulation study Hemispheric differences in the response of the upper atmosphere to the august 2011 geomagnetic storm: A simulation study.\BBCQ \APACjournalVolNumPagesJ. Atmos. Sol.-Terr. Phys.14113–26. {APACrefDOI} 10.1016/j.jastp.2015.10.002 \PrintBackRefs\CurrentBib
- Yiğit, Knížová\BCBL \BOthers. (\APACyear2016) \APACinsertmetastarYigit_etal16b{APACrefauthors}Yiğit, E., Knížová, P\BPBIK., Georgieva, K.\BCBL \BBA Ward, W. \APACrefYearMonthDay2016. \BBOQ\APACrefatitleA review of vertical coupling in the Atmosphere-Ionosphere system: Effects of waves, sudden stratospheric warmings, space weather, and of solar activity A review of vertical coupling in the atmosphere-ionosphere system: Effects of waves, sudden stratospheric warmings, space weather, and of solar activity.\BBCQ \APACjournalVolNumPagesJ. Atmos. Sol.-Terr. Phys.1411–12. {APACrefDOI} http://dx.DOI.org/10.1016/j.jastp.2016.02.011 \PrintBackRefs\CurrentBib
- Yiğit \BBA Medvedev (\APACyear2015) \APACinsertmetastarYigitMedvedev15{APACrefauthors}Yiğit, E.\BCBT \BBA Medvedev, A\BPBIS. \APACrefYearMonthDay2015. \BBOQ\APACrefatitleInternal wave coupling processes in Earth’s atmosphere Internal wave coupling processes in Earth’s atmosphere.\BBCQ \APACjournalVolNumPagesAdv. Space Res.555983–1003. {APACrefDOI} 10.1016/j.asr.2014.11.020 \PrintBackRefs\CurrentBib
- Yiğit \BBA Medvedev (\APACyear2016) \APACinsertmetastarYigitMedvedev16{APACrefauthors}Yiğit, E.\BCBT \BBA Medvedev, A\BPBIS. \APACrefYearMonthDay2016. \BBOQ\APACrefatitleRole of gravity waves in vertical coupling during sudden stratospheric warmings Role of gravity waves in vertical coupling during sudden stratospheric warmings.\BBCQ \APACjournalVolNumPagesGeosci. Lett.311-13. {APACrefDOI} 10.1186/s40562-016-0056-1 \PrintBackRefs\CurrentBib
- Yiğit \BBA Medvedev (\APACyear2017) \APACinsertmetastarYigitMedvedev17{APACrefauthors}Yiğit, E.\BCBT \BBA Medvedev, A\BPBIS. \APACrefYearMonthDay2017. \BBOQ\APACrefatitleInfluence of parameterized small-scale gravity waves on the migrating diurnal tide in Earth’s thermosphere Influence of parameterized small-scale gravity waves on the migrating diurnal tide in earth’s thermosphere.\BBCQ \APACjournalVolNumPagesJ. Geophys. Res. Space Physics1224846–4864. {APACrefDOI} 10.1002/2017JA024089 \PrintBackRefs\CurrentBib
- Yiğit \BOthers. (\APACyear2009) \APACinsertmetastarYigit_etal09{APACrefauthors}Yiğit, E., Medvedev, A\BPBIS., Aylward, A\BPBID., Hartogh, P.\BCBL \BBA Harris, M\BPBIJ. \APACrefYearMonthDay2009. \BBOQ\APACrefatitleModeling the effects of gravity wave momentum deposition on the general circulation above the turbopause Modeling the effects of gravity wave momentum deposition on the general circulation above the turbopause.\BBCQ \APACjournalVolNumPagesJ. Geophys. Res.114. {APACrefDOI} 10.1029/2008JD011132 \PrintBackRefs\CurrentBib
- Zhang \BOthers. (\APACyear2003) \APACinsertmetastarZhang_etal03{APACrefauthors}Zhang, S\BPBIP., Goncharenko, L\BPBIP., Salah, J\BPBIE., Roble, E\BPBIG.\BCBL \BBA Shepherd, G\BPBIG. \APACrefYearMonthDay2003. \BBOQ\APACrefatitleClimatology of neutral winds in the lower thermosphere over Millstone Hill (42.6∘N) observed from ground and from space Climatology of neutral winds in the lower thermosphere over Millstone Hill (42.6∘N) observed from ground and from space.\BBCQ \APACjournalVolNumPagesJ. Geophys. Res.108A1. {APACrefDOI} 10.1029/2002JA009512 \PrintBackRefs\CurrentBib
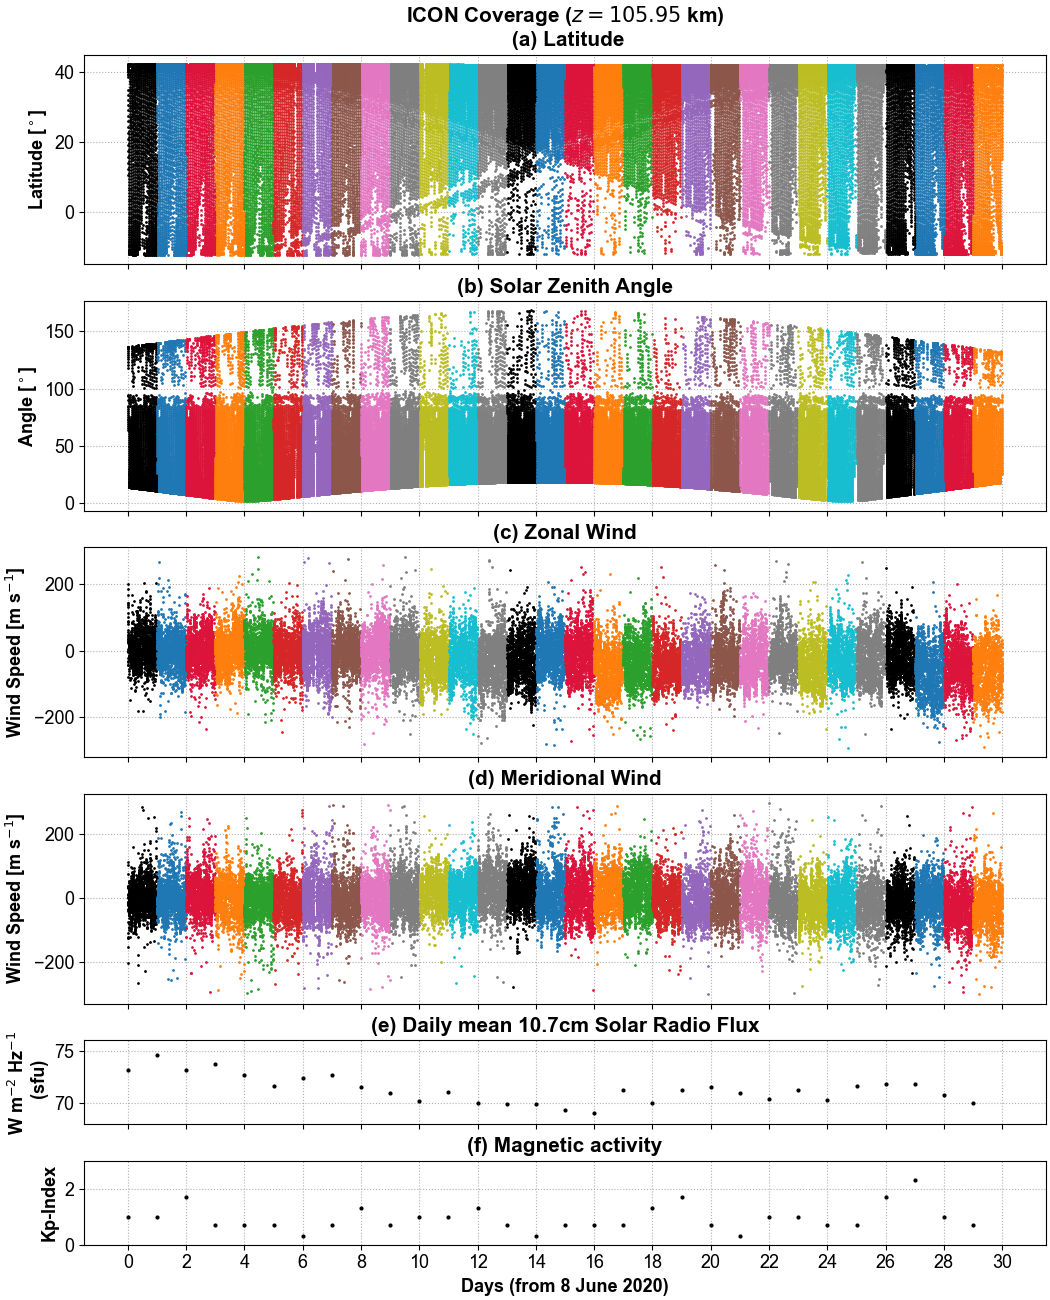
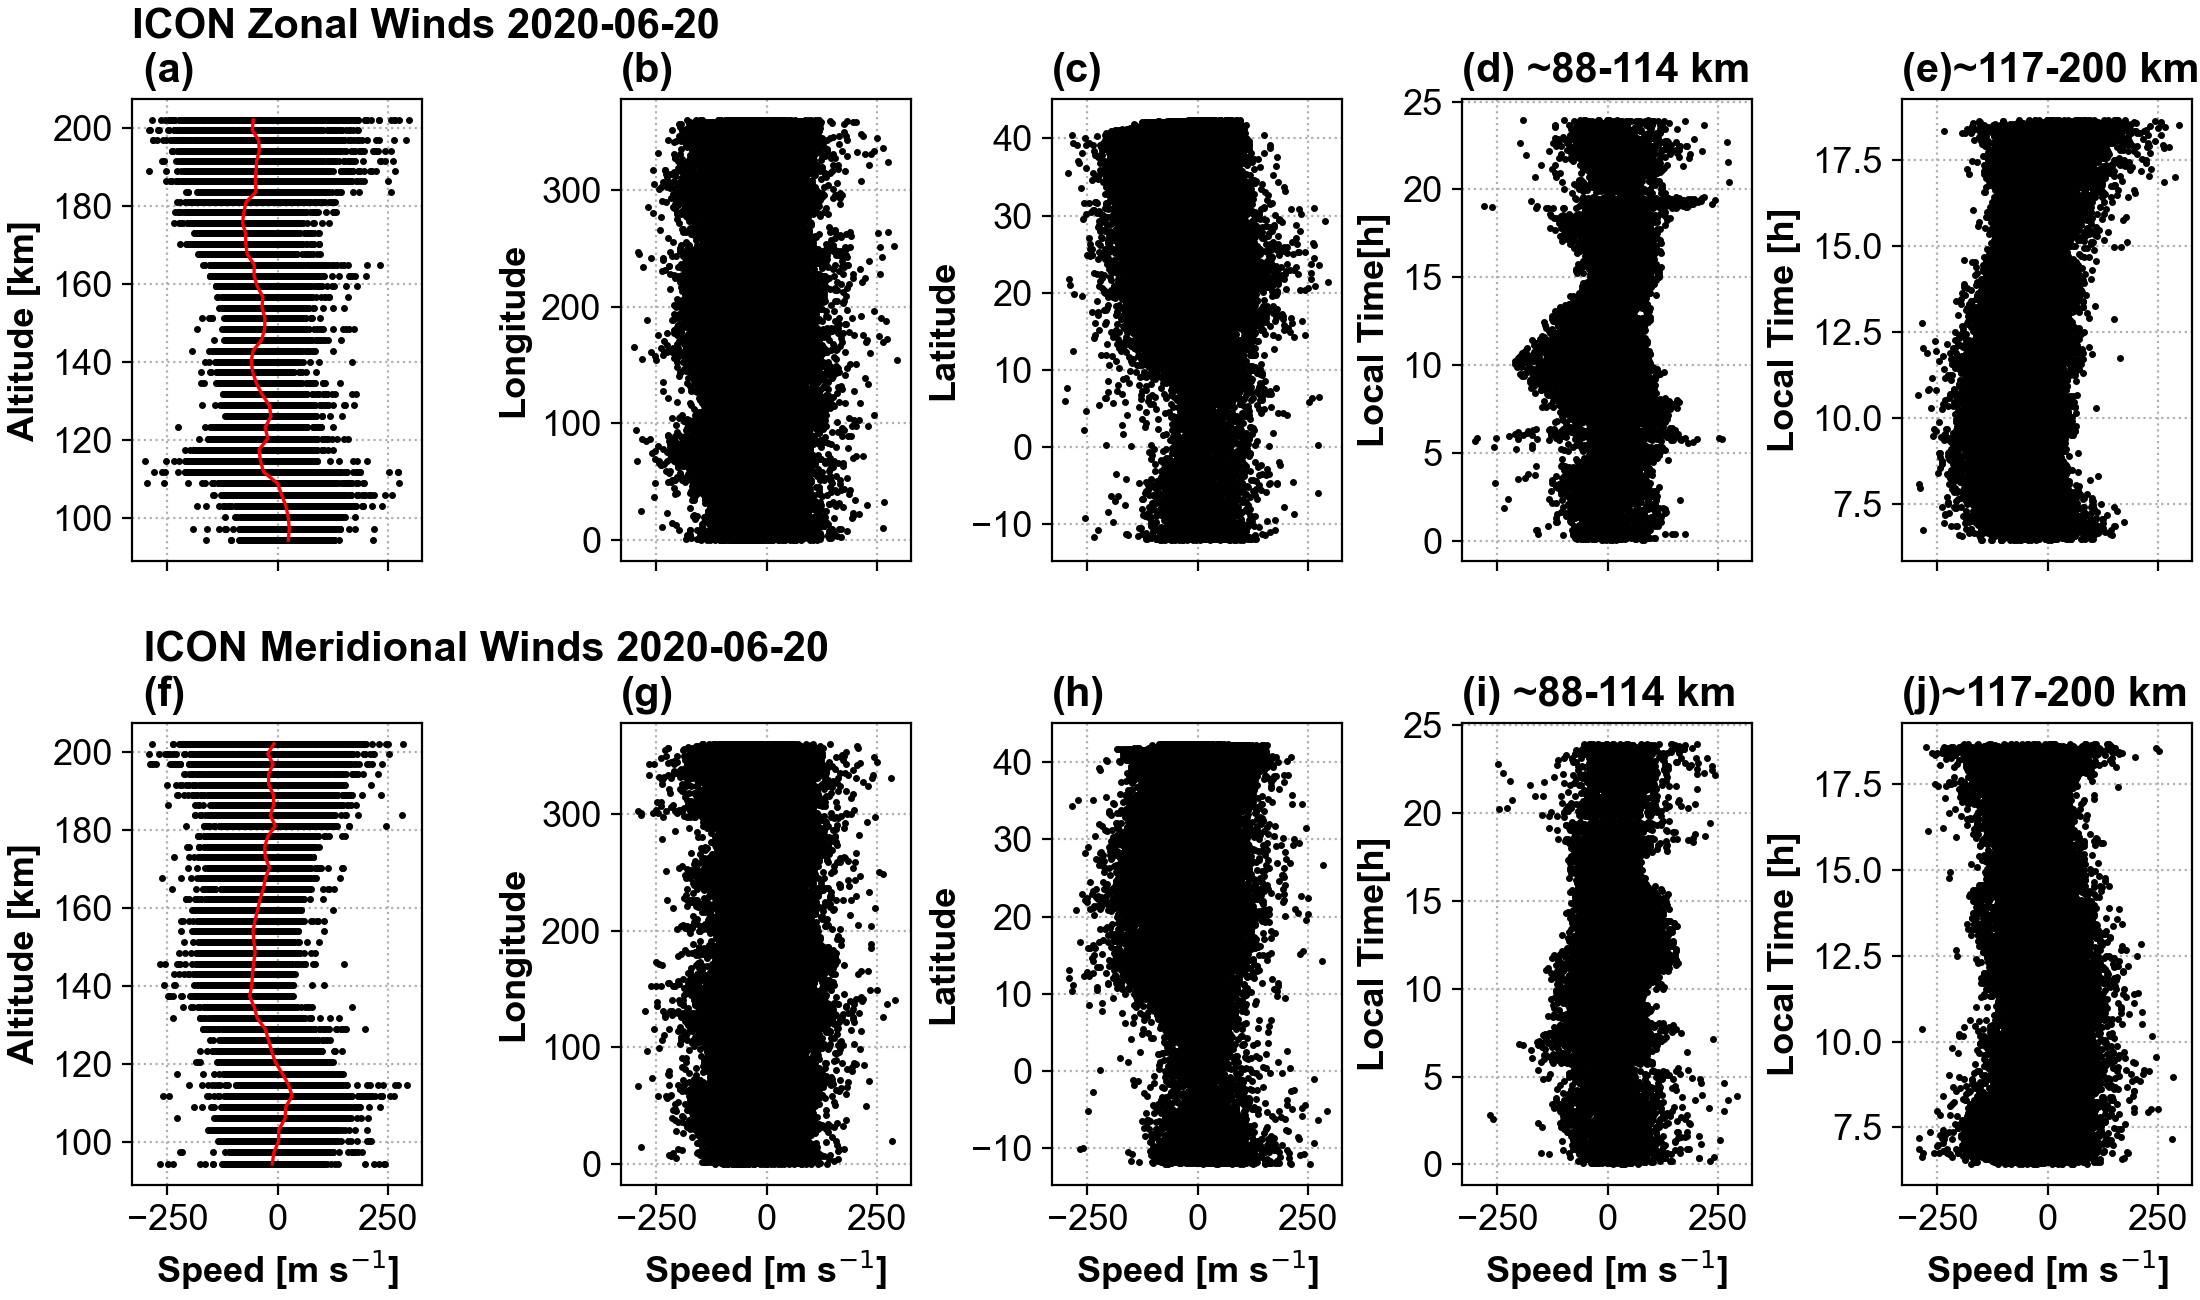
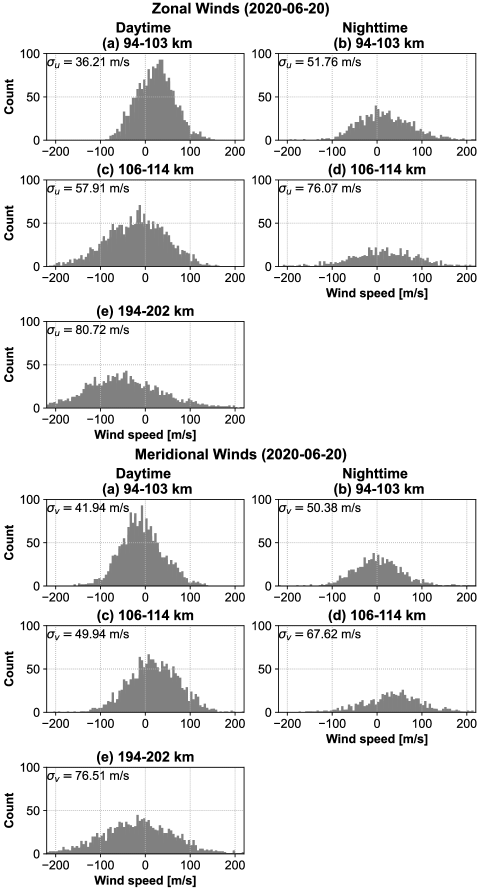
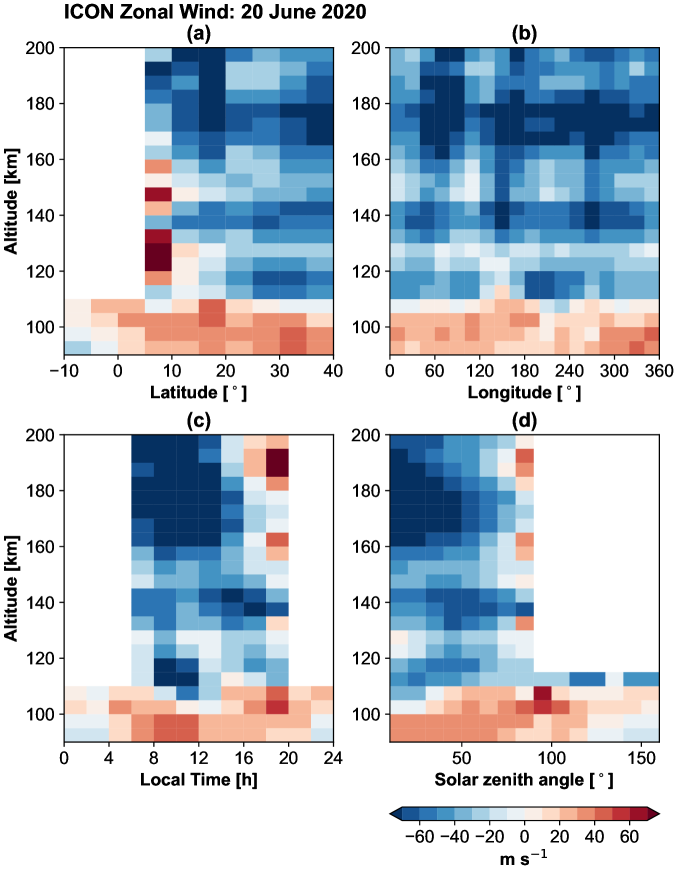
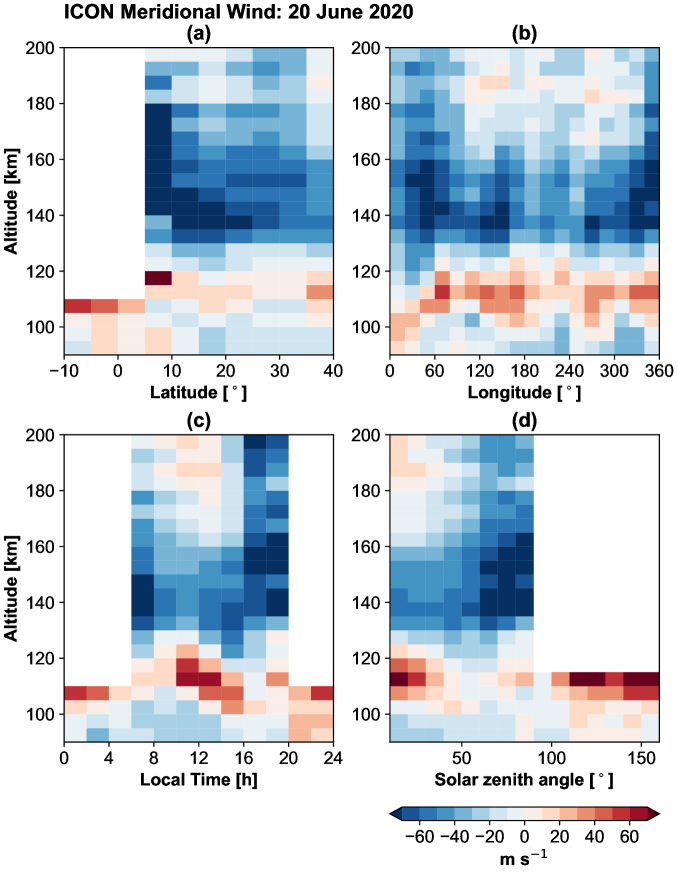
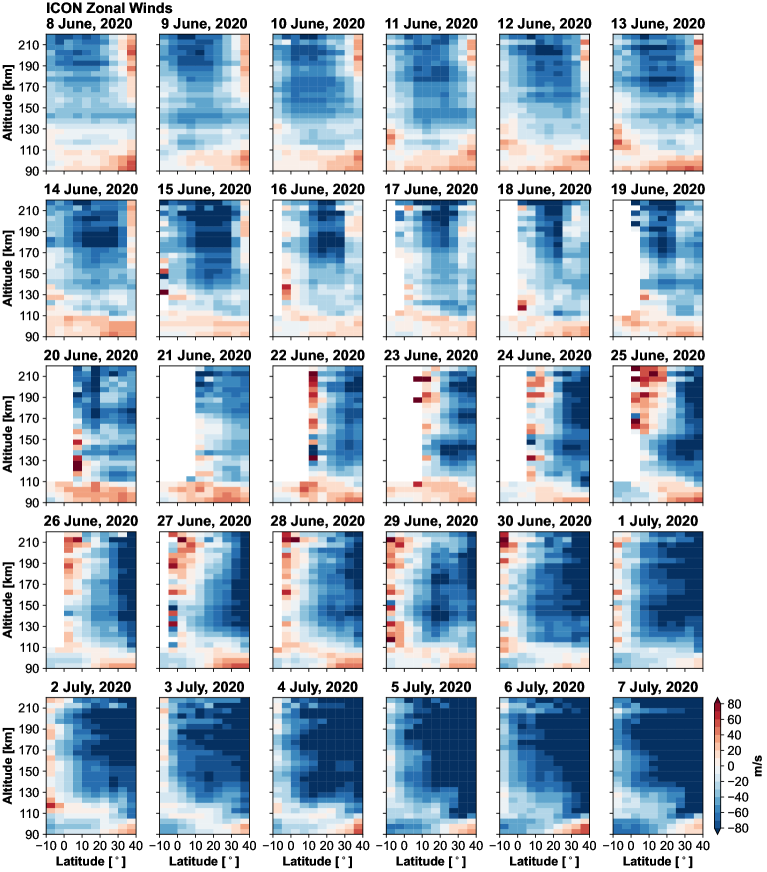
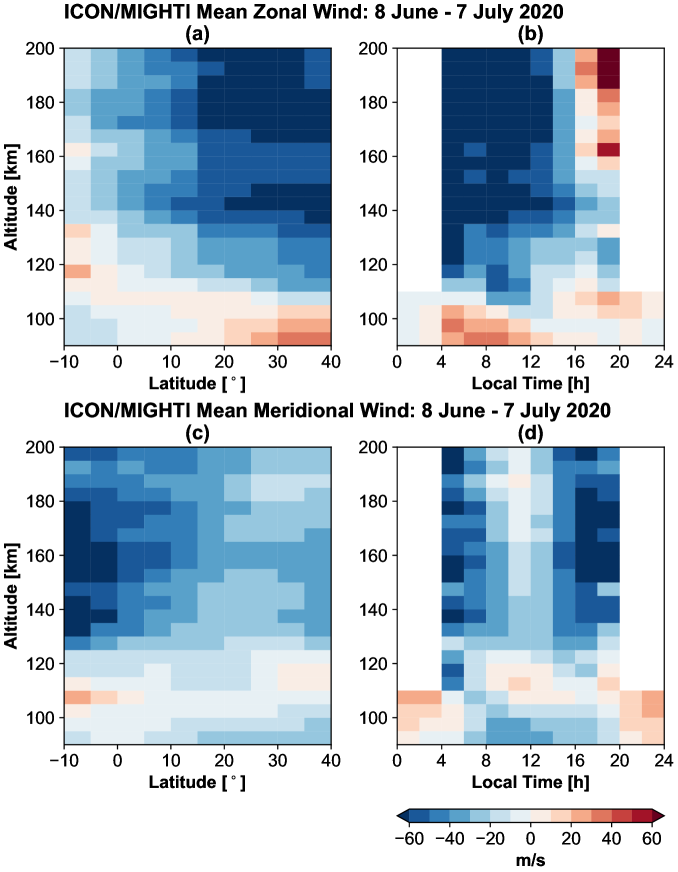
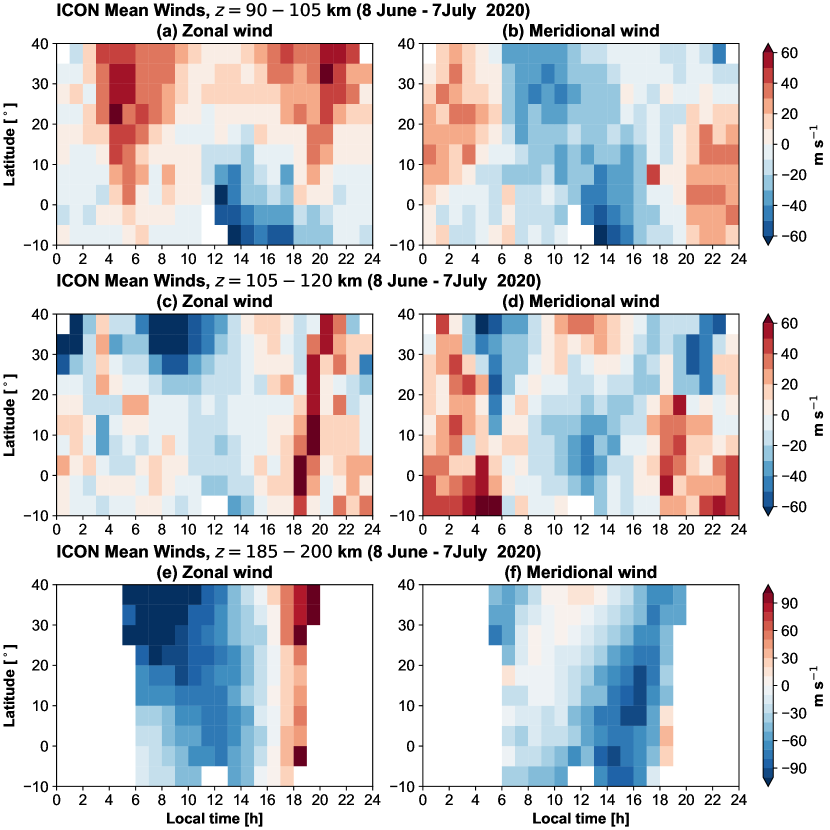
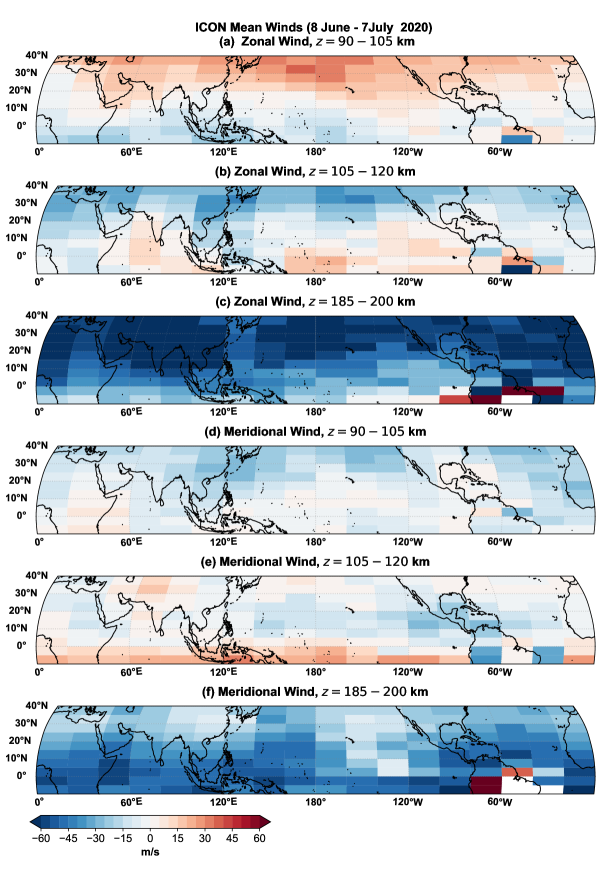
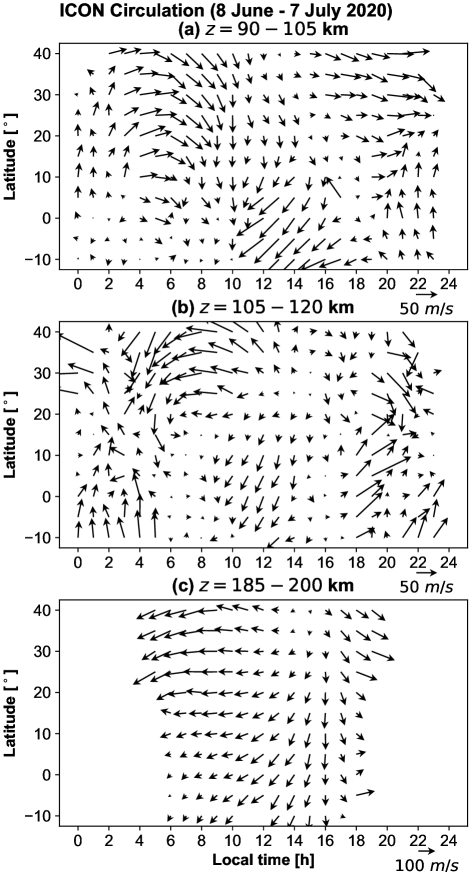
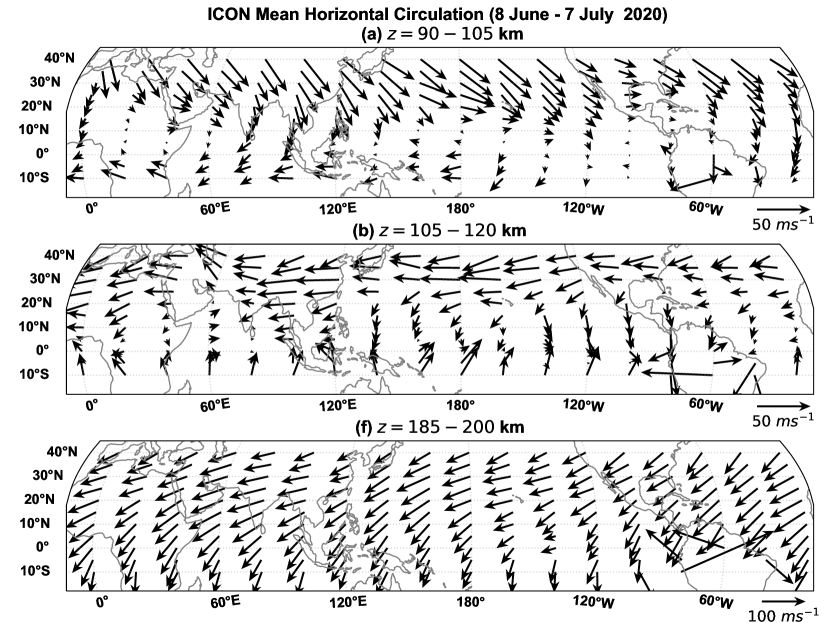
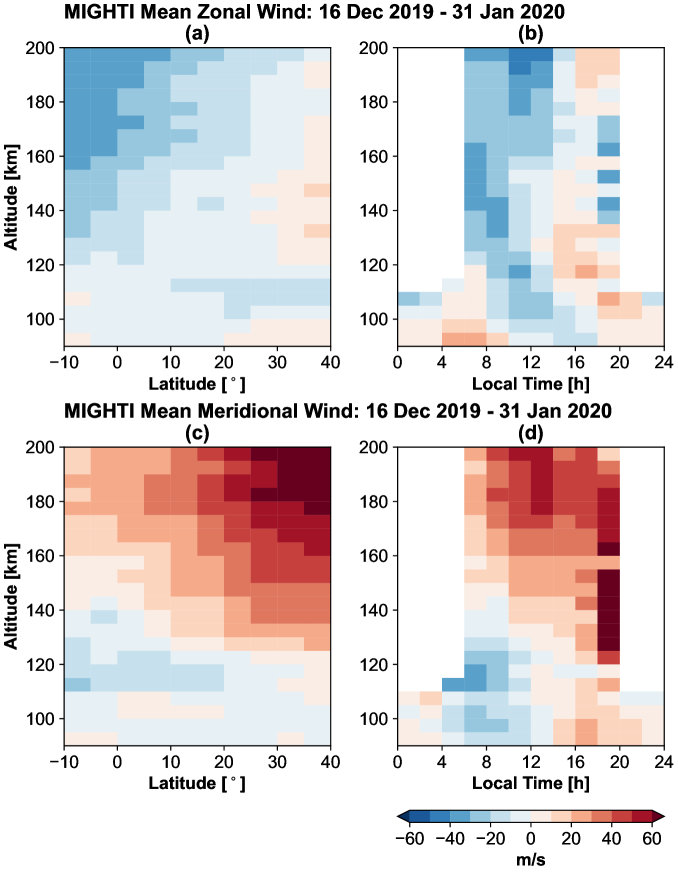
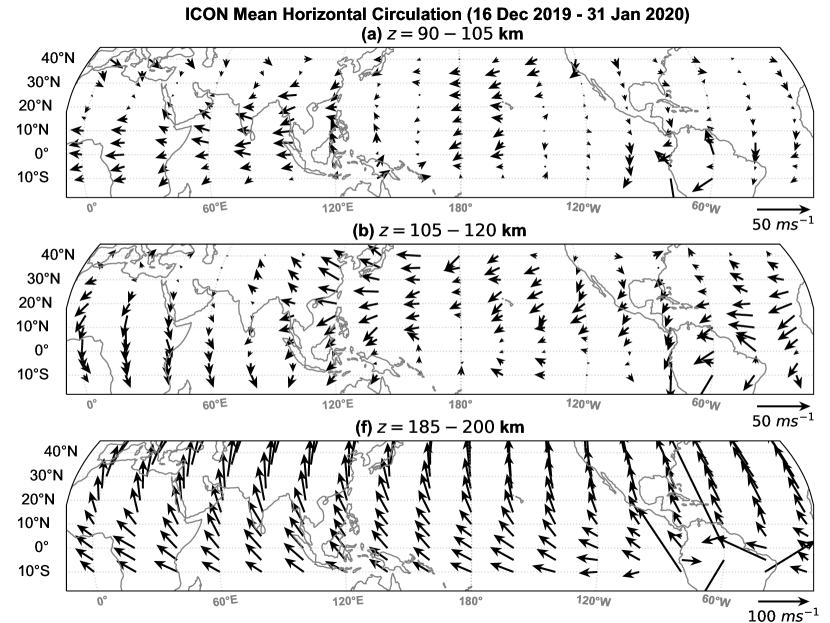
Appendix A Data quality
We have removed data with quality less than 0.5 and filtered outliers by removing wind magnitudes exceeding 300 m s-1. We illustrated the effect of this filtering for zonal winds in Figure 15.