Quantitative study of the hardening in the Alpha Magnetic Spectrometer nuclei spectra at a few hundred GV
Abstract
The most significant feature in the cosmic-ray (CR) nuclei spectra is the spectral hardening at a few hundred GV. It is important to know whether the hardening of different nuclei species is the same or not for constructing CR sources and propagation models. In this work, we collect the recently released AMS-02 CR nuclei spectra of primary species (proton, helium, carbon, oxygen, neon, magnesium, silicon, and iron), secondary species (lithium, beryllium, boron, and fluorine), and hybrid species (nitrogen, sodium, and aluminum) and study the break positions and the spectral index differences (less and greater than the break rigidity) of the spectral hardening quantitatively. The results show us that the CR nuclei spectral hardening at a few hundred GV has hybrid origins. In detail, the dominating factors of the spectral hardening for primary and secondary CR nuclei species are different: the former comes from the superposition of different kinds of CR sources, while the latter comes from the propagation process. Both of these factors influence all kinds of CR nuclei spectra, just with different weights.
1 Introduction
The space station experiment Alpha Magnetic Spectrometer (AMS-02) improves the measurement precision of the cosmic-ray (CR) fluxes by an order of the systematics (Aguilar et al., 2013) and deepens our understanding of CRs. Based on the precision data observed by these excellent experiments represented by AMS-02, CR physics has entered a precision-driven era. More and more fine structures have been observed in CR spectra.
Up to now, AMS-02 has released all the spectra of nuclei species up to the atomic number 14 (silicon) based on its first seven years observation, including the primary CR species: proton, helium (He), carbon (C), oxygen (O), neon (Ne), magnesium (Mg), and silicon (Si) (Aguilar et al., 2021, 2020); the secondary CR species: lithium (Li), beryllium (Be), boron (B), and fluorine (F) (Aguilar et al., 2021, 2021a); the hybrid CR species: nitrogen (N), sodium (Na), and aluminum (Al) (Aguilar et al., 2018, 2021b). In addition, the spectrum of heavy primary species iron (Fe) also has been released (Aguilar et al., 2021c).
From an overall perspective, the downward trends of the secondary CR species are more serious than the primary ones, and the hybrid ones are in the middle of both. This corresponds to the origin of the secondary CR nuclei species which are produced in collisions of primary CR particles with the interstellar medium (ISM). Most of these CR nuclei species show spectral hardening at a few hundred GV, which is the most significant feature in AMS-02 nuclei spectra. The degrees of the hardening for different CR nuclei species reflect directly to the origin of the hardening, and then point to the features of CR source and propagation (Niu, 2021). With the accumulation of the CR event, the uncertainties in the spectra (especially in high rigidity regions) becomes smaller and smaller. It is both necessary and possible to carry out quantitative studies on these CR nuclei spectra, which could provide us a global view when we go further into the research of CRs.
Physically speaking, the observed CR spectra are produced by the synthetic effects of the primary source injection spectra, the propagation process, and the solar modulation; even so, it is helpful to analyze the observed CR spectra directly which are always the starting point for building CR models. Although such kind of works have been simply performed in the AMS-02 data released papers (Aguilar et al., 2021, 2020, 2021b), they did not always use the independent break power law formulas for different CR nuclei species (such as using one group of parameters to fit the spectral of He, C, and O, and using another group of parameters to fit Ne, Mg, and Si). It would cover the differences between the CR species in one group. As a result, an independent fittings to each of the CR nuclei species via a uniform method could not only provide us a detailed quantitative comparison between these species, but also give us a global view for guiding the improvements of current CR models.111Our previous work (Niu, 2021) performed a similar research based on an old data set from AMS-02, which showed large correlations of systematic errors. An updated data set will give us more reasonable and complete results.
In the following, we first introduce the methods in Section 2; the results are shown in Section 3; the discussions are presented in Section 4.
2 Materials and Methods
Because the spectral hardening happens at a few hundred GV, the data points whose rigidity less than 45 GV are discarded in this work. In such case, we can avoid to handle the solar modulation and fit these CR nuclei spectra using a break power law directly. A break in 100-1000 GV is used to describe the position of the spectral hardening in each of the CR nuclei species.
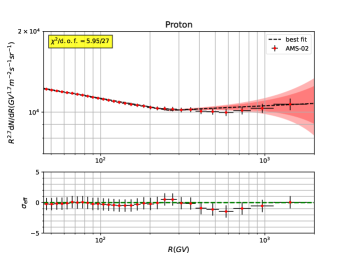
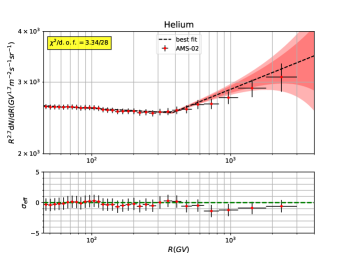
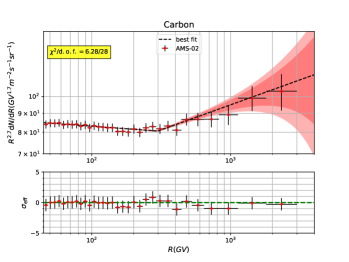
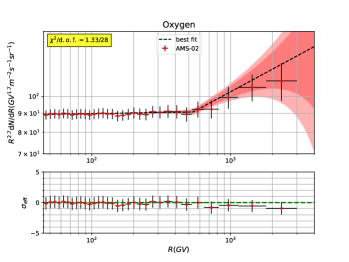
The following formula is used to describe each of the AMS-02 nuclei spectra (including the primary CR species: proton, He, C, O, Ne, Mg, Si, and Fe; the secondary CR species: Li, Be, B, and F; the hybrid CR species: N, Na, Al) when the rigidity is greater than 45 GV:
| (1) |
where is the flux of CR, is the normalization constant, and and are the spectral indexes less and greater than the break rigidity , and denotes the species of nuclei. The errors used in our fitting are the quadratic sum of statistical and systematic errors.
The Markov Chain Monte Carlo (MCMC) framework is employed to determine the posterior probability distributions (PDF) and uncertainties of the spectral parameters for different CR nuclei species.222The python module emcee (Foreman-Mackey et al., 2013) is employed to perform the MCMC sampling. Some such examples can be referred to Niu & Li (2018); Niu et al. (2019); Niu (2022) and references therein.
3 Results
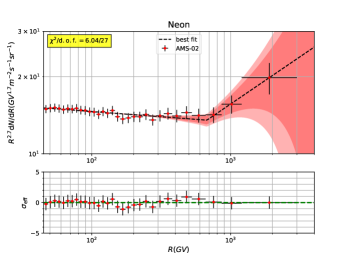
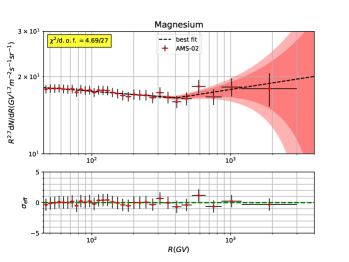
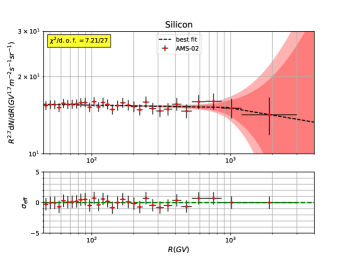
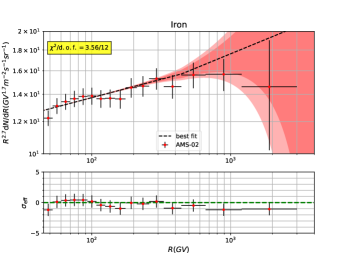
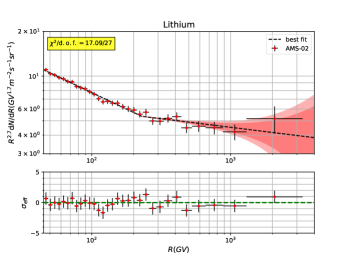
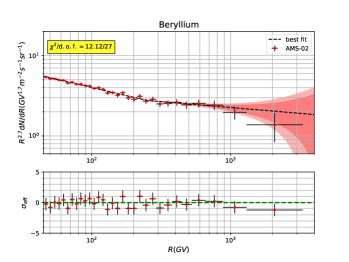
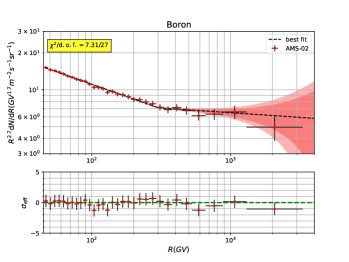
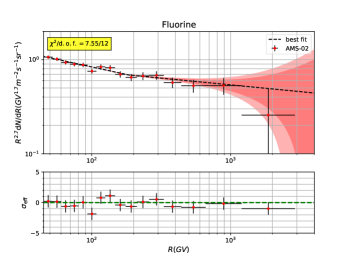
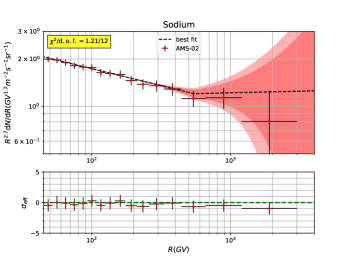
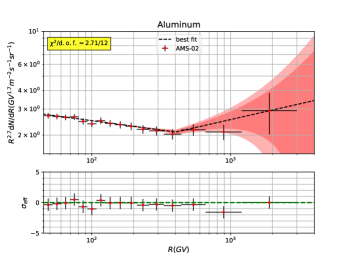
The best-fit values and the allowed intervals from 5th percentile to 95th percentile of the parameters , , , and are listed in Table 1, together with the reduced of each fitting.333The information of the parameter is not listed in the table, which is not important in the subsequent analysis. The PDF of is derived from that of and . The best-fit results and the corresponding residuals of the primary, the secondary, and the hybrid CR species are given in Figure 1, 2, and 3, respectively.444Note that in the lower panel of subfigures in Figs. 1, 2, and 3, the is defined as where and are the points which come from the observation and model calculation; and are the statistical and systematic standard deviations of the observed points.
| Species | |||||
|---|---|---|---|---|---|
| proton | -2.808 [-2.814, -2.796] | -2.671 [-2.693, -2.613] | 259 [244, 348] | 0.137 [0.112,0.192] | 5.95/27 = 0.22 |
| Helium | -2.719 [-2.727, -2.709] | -2.570 [-2.602, -2.501] | 367 [318, 488] | 0.149 [0.115,0.215] | 3.34/28 = 0.12 |
| Carbon | -2.727 [-2.746, -2.707] | -2.559 [-2.619, -2.479] | 306 [217, 438] | 0.168 [0.107,0.245] | 6.28/28 = 0.22 |
| Oxygen | -2.694 [-2.709, -2.678] | -2.500 [-2.599, -2.392] | 529 [409, 676] | 0.194 [0.093,0.306] | 1.33/28 = 0.05 |
| Neon | -2.741 [-2.759, -2.719] | -2.362 [-2.568, -2.079] | 660 [542, 849] | 0.379 [0.161,0.658] | 6.04/27 = 0.22 |
| Magnesium | -2.742 [-2.765, -2.721] | -2.609 [-2.724, -2.529] | 414 [323, 464] | 0.133 [0.011,0.219] | 4.69/27 = 0.17 |
| Silicon | -2.709 [-2.729, -2.690] | -2.792 [-3.299, -2.477] | 923 [873, 994] | -0.083 [-0.585,0.230] | 7.21/27 = 0.27 |
| Iron | -2.614 [-2.647, -2.573] | -2.542 [-2.756, -2.390] | 392 [315, 544] | 0.072 [-0.171,0.239] | 3.56/12 = 0.30 |
| Lithium | -3.146 [-3.174, -3.109] | -2.836 [-2.905, -2.665] | 216 [177, 322] | 0.310 [0.239,0.470] | 17.09/27 = 0.63 |
| Beryllium | -3.102 [-3.131, -3.066] | -2.848 [-2.967, -2.657] | 247 [195, 415] | 0.254 [0.122,0.449] | 12.12/27 = 0.45 |
| Boron | -3.103 [-3.128, -3.075] | -2.765 [-2.899, -2.601] | 308 [225, 436] | 0.338 [0.201,0.492] | 7.31/27 = 0.27 |
| Fluorine | -3.016 [-3.091, -2.951] | -2.844 [-3.007, -2.712] | 189 [163, 216] | 0.172 [-0.289,0.347] | 7.55/12 = 0.63 |
| Nitrogen | -2.925 [-2.955, -2.883] | -2.694 [-2.753, -2.574] | 199 [157, 325] | 0.231 [0.158,0.335] | 15.42/27 = 0.57 |
| Sodium | -2.913 [-2.958, -2.873] | -2.657 [-3.213, -2.372] | 558 [442, 629] | 0.256 [-0.293,0.558] | 1.21/12 = 0.10 |
| Aluminum | -2.827 [-2.870, -2.785] | -2.487 [-2.733, -2.268] | 401 [270, 500] | 0.340 [0.076,0.574] | 2.71/12 = 0.23 |

Generally speaking, the reduced s of all the CR nuclei species are smaller than 1.0, which indicates the success of the break power law to describe the spectra. But some too small reduced s imply an improper treatment of the data errors. The improvement of the treatment needs additional information about the correlation matrix of systematic errors of AMS-02 data. Some detailed discussions of this topic can be found in Derome et al. (2019); Weinrich et al. (2020); Heisig et al. (2020). One should note that the reduced s in Table 1 do not have the absolute meaning of goodness-of-fit, although they can be compared with each other.
4 Discussions
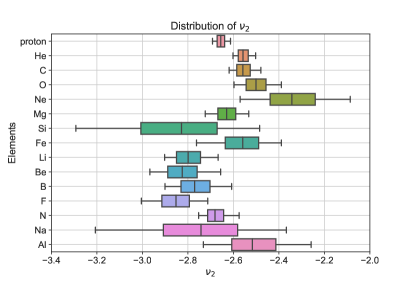
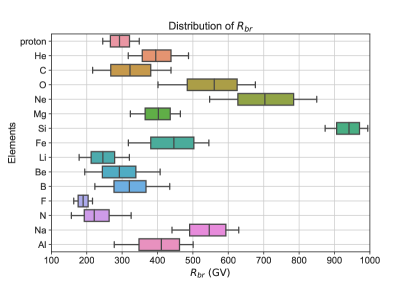
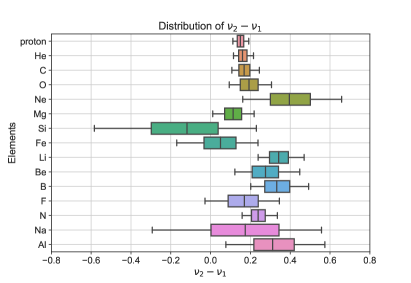
In order to get a clear representation and comparison of the fitted parameters of the different nuclei species, the boxplots555A box plot or boxplot is a method for graphically depicting groups of numerical data through their quartiles. In our configurations, the band inside the box shows the median value of the dataset, the box shows the quartiles, and the whiskers extend to show the rest of the distribution which are edged by the 5th percentile and the 95th percentile. of the spectral parameters are used to show the distributions of , , , and in Figure 4.
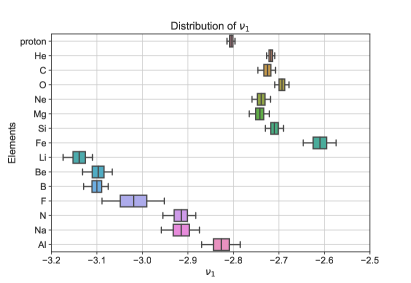
In the boxplots of in Figure 4, the secondary species have smallest values, then the hybrid species, and then the primary CR species. It is obvious that the values of proton and Fe are significantly different from that of the other primary CR species. The former are always referred to the p/He anomaly, which is generally ascribed to the particle-dependent acceleration mechanisms occurring in galactic CR sources (see for e.g. Vladimirov et al. (2012)). And many specific mechanisms are proposed to interpret this anomaly (see for e.g. Erlykin & Wolfendale (2015); Malkov et al. (2012); Fisk & Gloeckler (2012); Ohira & Ioka (2011); Tomassetti (2015a)). The later comes from the significantly larger interaction cross sections with the ISM of Fe than those of lighter nuclei species (He, C, O, Ne, Mg, and Si) (Aguilar et al., 2021c). For the secondary CR nuclei species, the value of F is larger than that of others, which indicates that the propagation of heavy CRs (from F to Si) might be different from that of light CRs (from He to O). For the hybrid CR nuclei species, the value of Al is larger than that of N and Na. This is a direct sign of its higher proportion of primary components compared with N and Na (see Aguilar et al. (2018, 2021b) for more details). One should note that a trend is implied in this subfigure: if we consider the values in one group of CR nuclei species (primary, secondary or hybrid), they increase with the increasing of atomic number. Whether this trend is just a coincidence, or it comes from an undiscovered mechanism (such as a charge or mass dependent acceleration or propagation) should be tested in future.
In the boxplots of in Figure 4, the uncertainties are larger than that of because of the fewer data points with larger uncertainties in high rigidity region. Roughly speaking, the values of the primary CR nuclei species are larger than that of the secondary species (except that of Si with quite large uncertainty). For hybrid CR nuclei species, N has a value with low uncertainty of about 2%, which is the same as the one for proton and within the uncertainty of the other primary species; the uncertainty of Na is about 20%, which is similar to that of Si (about 18% - 19%); the of Al has an uncertainty of about 9% - 10%, and is similar to the values of the primary ones, which indicates its flux in high rigidity region is dominated by the primary component.
In the boxplots of in Figure 4, it shows that the break positions are significantly different between some of the CR nuclei species, especially in the case of primary and hybrid species. On the contrary, the break positions of the secondary CR nuclei species are distribute around 200-400 GV, which are a bit more concentrated and indicate they might have a common origin. If the spectral hardening of the secondary CR nuclei species (Li, Be, B, and F) mainly comes from their parents species (C, N, O, Ne, Na, Mg, Al, Si), their break position should have similar distributions. Considering the heavy secondary CR nuclei species F, it is thought to be produced mostly by the collisions of heavy nuclei (such as Ne, Mg, and Si) with the ISM, but its break position distributes around 200 GV, which is significantly different from its parents species (all of them are larger than 300 GV). This is a definite evidence that the spectral hardening in the secondary CR nuclei species does NOT dominately inherit from its parents species, and the main factor of their hardening comes from propagation (such as in Blasi et al. (2012); Tomassetti (2012, 2015a, 2015b); Feng et al. (2016); Génolini et al. (2017); Jin et al. (2016); Guo & Yuan (2018a, b); Liu et al. (2018); Niu et al. (2019); Boschini et al. (2020a, b); Niu (2022)). Moreover, such diffuse distributions of the break positions of the primary CR nuclei species cannot be dominately reproduced by a uniform acceleration mechanism in CR sources or in propagation process, and the superposition of different kinds of sources (with different spectral index and element abundances) seems to be the only natural explanation (such as in Yuan et al. (2011); Yue et al. (2019); Yuan et al. (2020); Niu (2021)).
In the boxplots of in Figure 4, some of the values inherit large uncertainties from , especially for Ne, Si, Fe, Na, and Al. Generally speaking, the values are the same for primary, secondary, and hybrid species within the uncertainties. As the measurement of the spectral hardening, the of Si and Fe distribute around zero, which demonstrates the spectral hardening in these two species is not statistical significant. Moreover, it shows that the values of some primary CR nuclei species whose spectra have relative smaller uncertainties (proton, He, C, O, and Mg) are systematically smaller than that of the secondary species Li, Be, and B, which is the reason why some precious works claimed AMS-02 data (including the spectra or spectra ratio of Li, Be, B, C, and O) favors a break in diffusion coefficient index rather than a break in the primary source injection (see, e.g., Génolini et al. (2017); Niu & Xue (2020)). What’s more interesting is that the of F seems to be systematically smaller than that of Li, Be, and B. If we follow the conclusion obtained above (the spectral hardening of the secondary CR nuclei species dominately comes from the propagation process), it is an indication that the propagation properties of heavy cosmic rays, from F to Si, are different from those of light cosmic rays, from He to O (Aguilar et al., 2021a).
5 Summary
In summary, for the primary CR nuclei species, although and have similar values within uncertainties (except the of proton and Fe with special reasons), the significant different values of indicate that their spectral hardening cannot come from an uniform mechanism in CR sources or propagation process. A natural origin of the hardening is the superposition of different kinds of CR sources, which in the one hand can be corresponding to the galactic averaged CR sources and a local CR source (such as Geminga SNR (Zhao et al., 2022) and the superflares from nearby M dwarfs (Ohm & Hoischen, 2018)), and on the other hand can be correspond to different kinds of CR factories: such as the different population of supernova remnants (Aharonian et al., 2004), galactic center (Scherer et al., 2022), novas (H.E.S.S. Collaboration, 2022), active red dwarf stars (Sinitsyna et al., 2021), etc. In both cases, as long as the CR sources have different elemental abundances, it will produce different and values for different CR nuclei species. The combination of the above two cases is also possible (Zhang et al., 2022).
For the secondary CR nuclei species, their concentrated values of are different from that of their parents species, which denies the possibility of the inheritance from the primary species and favors the propagation origin (such as the spatial dependent propagation (Tomassetti, 2012; Guo et al., 2016)). Here, the different propagation regions can be corresponding to the structures of the galaxy (i.e., the galaxy center, the bulk, the disk, the halo, and even the spiral arms), in which the densities of ISM are different and thus they have different propagation environments.
As a result, the dominating factors of the spectral hardening for primary and secondary CR nuclei species are different. Of course, these factors will influence all the CR nuclei species spectra, regardless of the primary, the secondary or the hybrid ones, just with different weights. The hybrid origins of the CR nuclei spectral hardening at a few hundred GV are also confirmed by Niu (2022) via a propagation model. This hybrid origins will not only produce a break at about 200 GV in secondary/primary ratios (such as B/C and B/O), which corresponds to the dominating spectral hardening for secondary species; but also produce breaks greater than 200 GV in secondary/primary ratios, which corresponds to the dominating spectral hardening for primary species. These predictions are confirmed by the recently released B/C and B/O ratio from DAMPE (DAMPE Collaboration, 2022). Moreover, the slightly different and distributions between the F and Li/Be/B show some hints that the propagation properties of heavy CRs are different from those of light CRs.
Acknowledgments
Jia-Shu Niu would like to thank Hui-Fang Xue and Jue-Ran Niu for providing a quiet working environment. This research was supported by the National Natural Science Foundation of China (NSFC) (No. 12005124 and No. 12147215).
References
- Aguilar et al. (2013) Aguilar, M., Alberti, G., & Alpat et al, B. 2013, Phys. Rev. Lett., 110, 141102, doi: 10.1103/PhysRevLett.110.141102
- Aguilar et al. (2018) Aguilar, M., Ali Cavasonza, L., & Alpat et al, B. 2018, Phys. Rev. Lett., 121, 051103, doi: 10.1103/PhysRevLett.121.051103
- Aguilar et al. (2020) Aguilar, M., Ali Cavasonza, L., & Ambrosi et al, G. 2020, Phys. Rev. Lett., 124, 211102, doi: 10.1103/PhysRevLett.124.211102
- Aguilar et al. (2021) Aguilar, M., Ali Cavasonza, L., Ambrosi, G., et al. 2021, Phys. Rep., 894, 1, doi: 10.1016/j.physrep.2020.09.003
- Aguilar et al. (2021a) Aguilar, M., Cavasonza, L. A., Allen, M. S., et al. 2021a, Phys. Rev. Lett., 126, 081102, doi: 10.1103/PhysRevLett.126.081102
- Aguilar et al. (2021b) Aguilar, M., Cavasonza, L. A., Alpat, B., et al. 2021b, Phys. Rev. Lett., 127, 021101, doi: 10.1103/PhysRevLett.127.021101
- Aguilar et al. (2021c) Aguilar, M., Cavasonza, L. A., Allen, M. S., et al. 2021c, Phys. Rev. Lett., 126, 041104, doi: 10.1103/PhysRevLett.126.041104
- Aharonian et al. (2004) Aharonian, F. A., Akhperjanian, A. G., Aye, K. M., et al. 2004, Nature, 432, 75, doi: 10.1038/nature02960
- Blasi et al. (2012) Blasi, P., Amato, E., & Serpico, P. D. 2012, Phys. Rev. Lett., 109, 061101, doi: 10.1103/PhysRevLett.109.061101
- Boschini et al. (2020a) Boschini, M. J., Della Torre, S., Gervasi, M., et al. 2020a, ApJ, 889, 167, doi: 10.3847/1538-4357/ab64f1
- Boschini et al. (2020b) —. 2020b, ApJS, 250, 27, doi: 10.3847/1538-4365/aba901
- DAMPE Collaboration (2022) DAMPE Collaboration. 2022, Science Bulletin, doi: https://doi.org/10.1016/j.scib.2022.10.002
- Derome et al. (2019) Derome, L., Maurin, D., Salati, P., et al. 2019, A&A, 627, A158, doi: 10.1051/0004-6361/201935717
- Erlykin & Wolfendale (2015) Erlykin, A. D., & Wolfendale, A. W. 2015, Journal of Physics G Nuclear Physics, 42, 075201, doi: 10.1088/0954-3899/42/7/075201
- Feng et al. (2016) Feng, J., Tomassetti, N., & Oliva, A. 2016, Phys. Rev. D, 94, 123007, doi: 10.1103/PhysRevD.94.123007
- Fisk & Gloeckler (2012) Fisk, L. A., & Gloeckler, G. 2012, ApJ, 744, 127, doi: 10.1088/0004-637X/744/2/127
- Foreman-Mackey et al. (2013) Foreman-Mackey, D., Hogg, D. W., Lang, D., & Goodman, J. 2013, PASP, 125, 306, doi: 10.1086/670067
- Génolini et al. (2017) Génolini, Y., Serpico, P. D., & Boudaud et al, M. 2017, Phys. Rev. Lett., 119, 241101, doi: 10.1103/PhysRevLett.119.241101
- Guo et al. (2016) Guo, Y.-Q., Tian, Z., & Jin, C. 2016, ApJ, 819, 54, doi: 10.3847/0004-637X/819/1/54
- Guo & Yuan (2018a) Guo, Y.-Q., & Yuan, Q. 2018a, Chinese Physics C, 42, 075103, doi: 10.1088/1674-1137/42/7/075103
- Guo & Yuan (2018b) —. 2018b, Phys. Rev. D, 97, 063008, doi: 10.1103/PhysRevD.97.063008
- Heisig et al. (2020) Heisig, J., Korsmeier, M., & Winkler, M. W. 2020, Physical Review Research, 2, 043017, doi: 10.1103/PhysRevResearch.2.043017
- H.E.S.S. Collaboration (2022) H.E.S.S. Collaboration. 2022, Science, 10, abn0567, doi: 10.1126/science.abn0567
- Jin et al. (2016) Jin, C., Guo, Y.-Q., & Hu, H.-B. 2016, Chinese Physics C, 40, 015101, doi: 10.1088/1674-1137/40/1/015101
- Liu et al. (2018) Liu, W., Yao, Y.-h., & Guo, Y.-Q. 2018, ApJ, 869, 176, doi: 10.3847/1538-4357/aaef39
- Malkov et al. (2012) Malkov, M. A., Diamond, P. H., & Sagdeev, R. Z. 2012, Phys. Rev. Lett., 108, 081104, doi: 10.1103/PhysRevLett.108.081104
- Niu (2021) Niu, J.-S. 2021, Chinese Physics C, 45, 041004, doi: 10.1088/1674-1137/abe03d
- Niu (2022) —. 2022, ApJ, 932, 37, doi: 10.3847/1538-4357/ac6d5a
- Niu & Li (2018) Niu, J.-S., & Li, T. 2018, Phys. Rev. D, 97, 023015, doi: 10.1103/PhysRevD.97.023015
- Niu et al. (2019) Niu, J.-S., Li, T., & Xue, H.-F. 2019, ApJ, 873, 77, doi: 10.3847/1538-4357/ab0420
- Niu & Xue (2020) Niu, J.-S., & Xue, H.-F. 2020, J. Cosmology Astropart. Phys, 2020, 036, doi: 10.1088/1475-7516/2020/01/036
- Ohira & Ioka (2011) Ohira, Y., & Ioka, K. 2011, ApJ, 729, L13, doi: 10.1088/2041-8205/729/1/L13
- Ohm & Hoischen (2018) Ohm, S., & Hoischen, C. 2018, MNRAS, 474, 1335, doi: 10.1093/mnras/stx2806
- Scherer et al. (2022) Scherer, A., Cuadra, J., & Bauer, F. E. 2022, A&A, 659, A105, doi: 10.1051/0004-6361/202142401
- Sinitsyna et al. (2021) Sinitsyna, V. G., Sinitsyna, V. Y., & Stozhkov, Y. I. 2021, Astronomische Nachrichten, 342, 342, doi: 10.1002/asna.202113931
- Tomassetti (2012) Tomassetti, N. 2012, ApJ, 752, L13, doi: 10.1088/2041-8205/752/1/L13
- Tomassetti (2015a) —. 2015a, ApJ, 815, L1, doi: 10.1088/2041-8205/815/1/L1
- Tomassetti (2015b) —. 2015b, Phys. Rev. D, 92, 081301(R), doi: 10.1103/PhysRevD.92.081301
- Vladimirov et al. (2012) Vladimirov, A. E., Jóhannesson, G., & Moskalenko et al, I. V. 2012, ApJ, 752, 68, doi: 10.1088/0004-637X/752/1/68
- Weinrich et al. (2020) Weinrich, N., Génolini, Y., Boudaud, M., Derome, L., & Maurin, D. 2020, A&A, 639, A131, doi: 10.1051/0004-6361/202037875
- Yuan et al. (2020) Yuan, Q., Qiao, B.-Q., Guo, Y.-Q., Fan, Y.-Z., & Bi, X.-J. 2020, Frontiers of Physics, 16, 24501, doi: 10.1007/s11467-020-0990-4
- Yuan et al. (2011) Yuan, Q., Zhang, B., & Bi, X.-J. 2011, Phys. Rev. D, 84, 043002, doi: 10.1103/PhysRevD.84.043002
- Yue et al. (2019) Yue, C., Ma, P.-X., & Yuan et al, Q. 2019, Frontiers of Physics, 15, 24601, doi: 10.1007/s11467-019-0946-8
- Zhang et al. (2022) Zhang, Y., Liu, S., & Zeng, H. 2022, MNRAS, 511, 6218, doi: 10.1093/mnras/stac470
- Zhao et al. (2022) Zhao, B., Liu, W., Yuan, Q., et al. 2022, ApJ, 926, 41, doi: 10.3847/1538-4357/ac4416