Probing the Structure and Evolution of BASS AGN through Eddington Ratios
Abstract
We constrain the intrinsic Eddington ratio () distribution function for local AGN in bins of low and high obscuration [ and ], using the Swift-BAT 70-month/BASS DR2 survey. We interpret the fraction of obscured AGN in terms of circum-nuclear geometry and temporal evolution. Specifically, at low Eddington ratios (), obscured AGN outnumber unobscured ones by a factor of , reflecting the covering factor of the circum-nuclear material (0.8, or a torus opening angle of ). At high Eddington ratios (), the trend is reversed, with % of AGN having , which we suggest is mainly due to the small fraction of time spent in a highly obscured state. Considering the Eddington ratio distribution function of narrow-line and broad-line AGN from our prior work, we see a qualitatively similar picture. To disentangle temporal and geometric effects at high , we explore plausible clearing scenarios such that the time-weighted covering factors agree with the observed population ratio. We find that the low fraction of obscured AGN at high is primarily due to the fact that the covering factor drops very rapidly, with more than half the time spent with covering factor. We also find that nearly all obscured AGN at high- exhibit some broad-lines. We suggest that this is because the height of the depleted torus falls below the height of the broad-line region, making the latter visible from all lines of sight.
1 Introduction
To study active galactic nuclei (AGN) comprehensively, across multiple wavelengths, we must disentangle confounding observational selection effects, to measure the underlying physical quantities like AGN mass, luminosity, and accretion rate. For example, although unobscured AGN dominate optically-selected samples of highly luminous sources (e.g., Richards et al., 2002) they end up being a minority in the census of the total population (e.g., Treister et al., 2004; Gilli et al., 2007; Treister et al., 2009; Ananna et al., 2019). Similarly, radio-selected samples are dominated by radio-loud AGN, which also constitutes a very small fraction of the overall AGN population (e.g., Best et al., 2005; Stawarz, 2010). To get at the underlying demographics, it is important to account for both selection biases and measurement uncertainties. In the last fifteen years, high-energy X-ray telescopes such as Swift-BAT, INTEGRAL and NuSTAR have provided nearly unbiased X-ray-detected samples of AGN, where biases only become significant for the most heavily obscured sources (see Ricci et al., 2015; Koss et al., 2016; Ananna et al., 2022). The Swift-BAT 70–month survey provided the most sensitive map above 10 keV (Baumgartner et al., 2013). Using optical and infrared spectroscopy, the BAT AGN spectroscopic survey (BASS) provided morphology, masses, redshifts, luminosity and obscuring column density for 752 non-blazar AGN, including 292 Type 2 AGN (Ricci et al., 2017a; Koss et al., 2022a, b). The 98% completeness in black hole mass estimates for unbeamed AGN outside of the Galactic plane comes from broad emission lines and from velocity dispersion of stars within the host galaxy bulges (Mejía-Restrepo et al., 2022; Koss et al., 2022b, c).
In Ananna et al. (2022; henceforth A22) we used a Bayesian inference methodology (described in detail in §3 of A22, summarized here in §2) to calculate the bias-corrected intrinsic black hole mass function (BHMF) and Eddington ratio distribution function (ERDF) of local AGN (i.e., ), divided into optical broad-line/Type 1 and narrow-line/Type 2 AGN categories. The bias correction accounted for both Eddington bias and the effect of obscuration on apparent source brightness (and thus, obscuration-dependent survey depth). A22 found the shape of the BHMFs of Type 1 and Type 2 AGN to be in agreement. However, the distributions of Eddington ratios of Type 1 and Type 2 AGN were significantly different, and these differences prompt an interesting interpretation with far-reaching implications for AGN unification.
The original AGN unification scheme was purely geometric: viewing angle explained the major distinctions amongst different types of AGN. However, AGN are variable sources, sometimes changing from one type to another (e.g. Urry & Padovani, 1995; Marchese et al., 2012; Braito et al., 2014; Trakhtenbrot et al., 2019; Green et al., 2022). A luminosity-dependent interpretation referred to as the receding torus model (e.g., Lawrence, 1991; Simpson, 2005; Oh et al., 2015) suggested that as AGN luminosity increases, since the dust sublimation radius increases, this causes the inner edge of the obscuring torus to recede. This idea was supported by the results of Ueda et al. (2003), La Franca et al. (2005), Barger et al. (2005), Simpson (2005), Treister et al. (2008), who found a decreasing fraction of obscured AGN with luminosity.
Analysis of the BASS sample supports an alternate interpretation, where Eddington ratio rather than luminosity is the parameter that regulates how obscuring matter is distributed around AGN. Ricci et al. (2017b) used the observed BAT sample to study fractions of obscured AGN in two luminosity bins as a function of Eddington ratio. The obscured fractions in the two bins were very similar, and decreased with increasing Eddington ratio, implying that the torus structure is more fundamentally dependent on Eddington ratio than on luminosity. This interpretation is known as the radiation-regulated unification model. The intrinsic Eddington ratio distribution function analysis for broad-line/narrow-line AGN in A22 is also in agreement with these results. Ricci et al. (2022), which is a companion paper to our analysis in this work, uses the updated BASS DR2 data (Koss et al., 2022a, b) to reaffirm this version of the unification scheme, and discusses evolution along the obscurationEddington ratio plane.
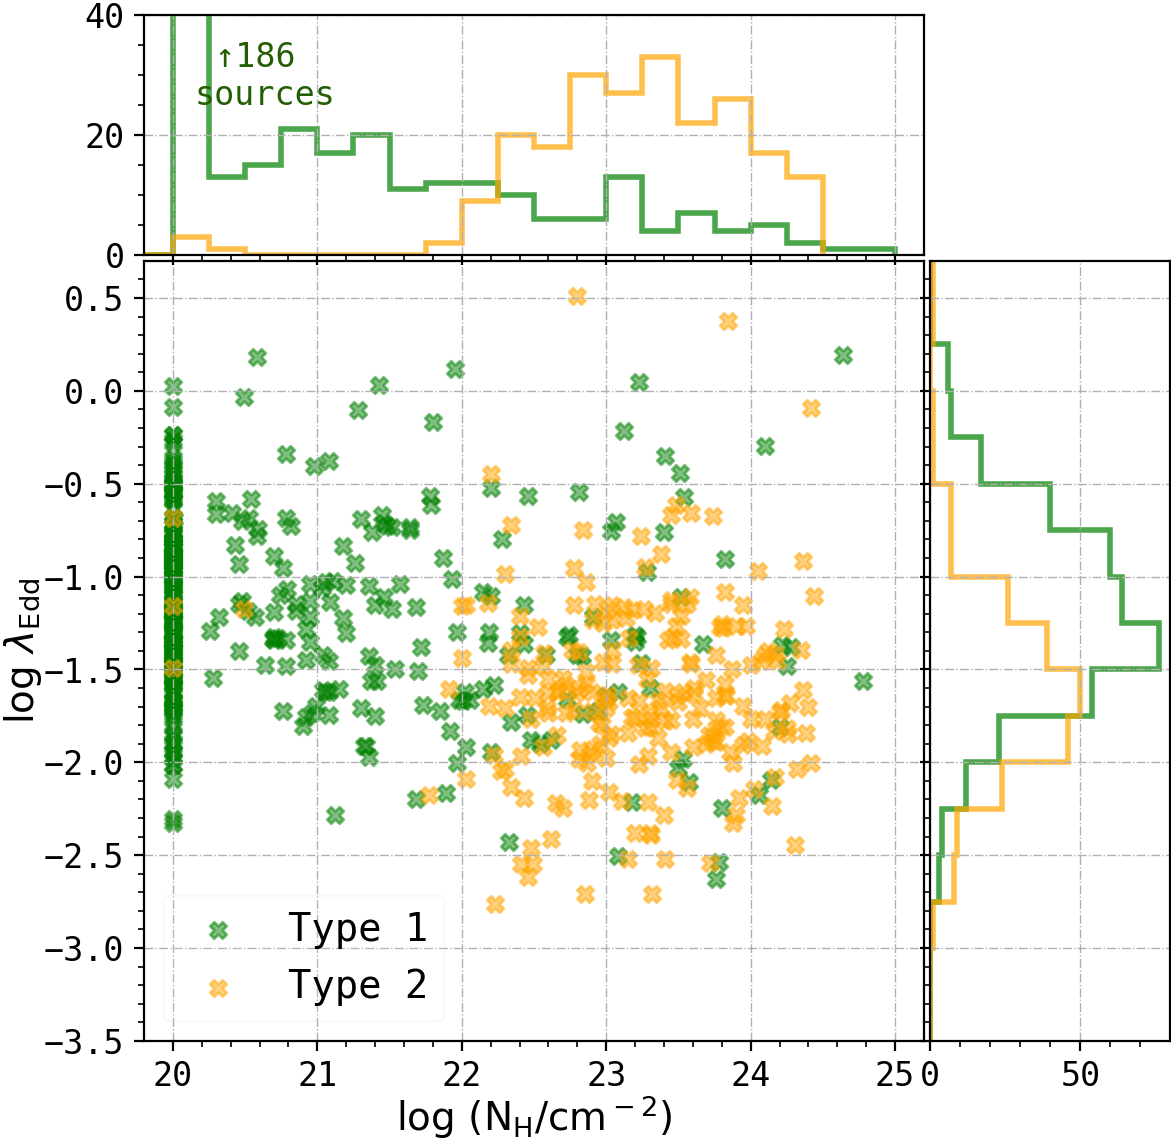
Here, we report the intrinsic space density of AGN as a function of Eddington ratio in bins of obscuration, quantified by equivalent hydrogen column density, . Specifically, we divide the AGN into sub-samples according to the : and . Intrinsic ERDFs constrained in the X-ray-based column density measurements allow us to study this AGN sample from a different perspective and compare with the ERDFs derived earlier by A22 using Type 1/Type 2 (optical broad-line/narrow-line) categorization. Moreover, X-ray-based column densities provide direct insight into line-of-sight circum-nuclear obscuration, and facilitate comparison with theoretical predictions. Figure 1 shows the distribution of observed Type 1 and Type 2 AGN in - space. The number of objects in each obscuration bin is given in Table 1.
Our paper is structured as follows: in §2, we discuss the data and the analysis methodology. In §3, we present our results, and in § 4 we offer a physically motivated interpretation of our results, divided into high- and low- regimes, in the context of geometric unification and transition. In § 5, we present our conclusions. We adopt a CDM cosmology with , , and throughout this paper.
| bin | b | ||||
|---|---|---|---|---|---|
| 301 (6) | |||||
| -4.29 | |||||
| -4.26 | |||||
| 285 (4) | |||||
| -3.42 | |||||
| -3.42 |
2 Analysis
Our main sample follows the same selection criteria as A22, and includes all unbeamed AGN over an absolute galactic latitude of , and fall within , and (i.e., a total of 586 sources from the mass, redshift and range where the BASS sample is most complete; see Figure 1 in A22). We use the masses, redshifts (Koss et al., 2022a), X-ray luminosities and obscuration measurements (Ricci et al., 2017a) for BASS DR2 sample to calculate Eddington ratios for these AGN.
2.1 Intrinsic Eddington Ratio Distribution Functions
While previous studies have constrained the Eddington ratio distribution function for Type 1/broad-line AGN (e.g., Kelly & Shen, 2013; Schulze et al., 2015), A22 was the first to constrain the intrinsic Eddington ratio distribution function for obscured Type 2/narrow-line AGN. We briefly describe the method here (more details in §3.4 of A22). Using a Bayesian ensemble sampler with 50 walkers (Foreman-Mackey et al., 2013), we maximize the likelihood for the following function:
| (1) |
where is a convolution of the intrinsic AGN mass function and distribution (constrained together), co-moving volume element, the area-flux curve (i.e., selection function) of the survey(s), redshift evolution function, and absorption function. As is a probability distribution function, it is normalized by integrating this product over all observables:
| (2) | ||||
where is the convolution of mass and Eddington ratio distribution functions. The parametric form of the intrinsic Eddington ratio distribution function is a double-power law:
| (3) |
is the selection function (area-flux curve for BAT 70-month survey; Baumgartner et al., 2013), is the intrinsic absorption function for BAT AGN (from Ricci et al., 2015), as we assume negligible redshift evolution over the range, and is the co-moving volume element. The term allows us to convolve uncertainty in mass measurement. We assume Gaussian scatter in mass and luminosity measurement with different dispersions in A22. We report results for both and cases in § 3, and find that the functions agree within 1 over the range of considered here, so only the first case is shown in the figures for clarity. The 1 random errors on the functions are calculated using the covariance matrix, which we derive from the MCMC chain. The formula for this error estimation is given in Appendix C of A22. Note that assuming a functional form such as double-power law leads to smaller errors than more flexible approaches for constraining space densities (e.g., Buchner et al., 2015; Ananna et al., 2020). We assume that the shape of the ERDF is independent of mass, because in § 4.4 of A22, we showed that for the mass range considered for this sample [], the shape of the ERDF does not change when constrained in two mass bins independently: [ and ].
2.2 Evolution of AGN Covering factor at high Eddington Ratio
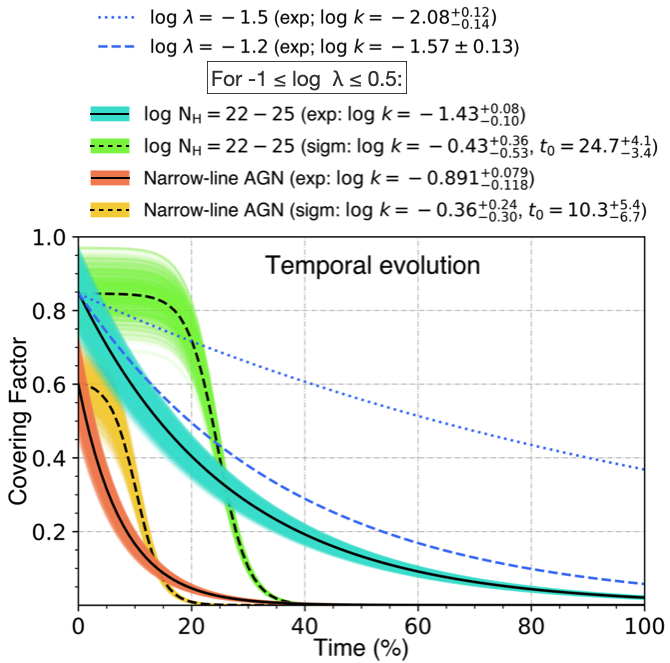
When the torus is stable, the ratio of obscured to overall AGN space density is equal to the population averaged covering factor of the torus. When the radiation pressure is very high (e.g., at high , the torus is unstable, and its geometry is time-dependent). To disentangle the geometric and temporal aspects at high (theoretically at ; see § 4.1), we consider two simple parametric models of how the covering factor varies over time at high . We assume that after AGN are triggered from a low- phase to high , they typically start with a high covering factor (% for torus and for narrow-line only AGN, as shown in the lower panel of Figure 2). As obscuring matter is removed because of the increased radiation pressure around an AGN, its covering factor should decrease. We consider two scenarios for the temporal dependence: (i) the rate at which the covering factor decreases is highest when there is more obscuring matter, or (ii) the covering factor initially decreases slowly due to shielding from obscuring matter, and then decreases more rapidly as more and more matter is removed. Both scenarios end with the covering factor decreasing asymptotically such that it may approach zero, depending on the obscured/overall ratio. We do not force the final covering factor to equal zero at the end of the high phase as IR studies of luminous quasars show residual dust even for luminous optical quasars (e.g., Hall et al., 2004; Hopkins et al., 2004), essentially allowing the data to decide the final covering factor. We use exponential and sigmoid functions to model the behavior for scenarios (i) and (ii), respectively:
| (4) | ||||
Figure 3 shows the simulated evolution derived for a sample of 1000 AGN with the average observed covering factors [drawn from a normal distribution of for torus, and for the narrow-line AGN]. Given a set of parameters, we calculate the average covering factor for these 1000 AGN over 100 time steps. To calculate the time-averaged covering factor for these 1000 objects, we draw random times from the lifetime of each AGN, and average over the whole population. We repeat this 100 times for each set of parameters to account for the stochasticity in selecting different time steps, and choose the median. We use a Bayesian ensemble sampler to optimize these functions to reproduce the obscured/overall ratio (shown in Figure 2) using a Gaussian likelihood function:
| (5) | ||||
where C(t) is defined in Eqn. 4, and only the parameter k is constrained for scenario (i).
3 Results
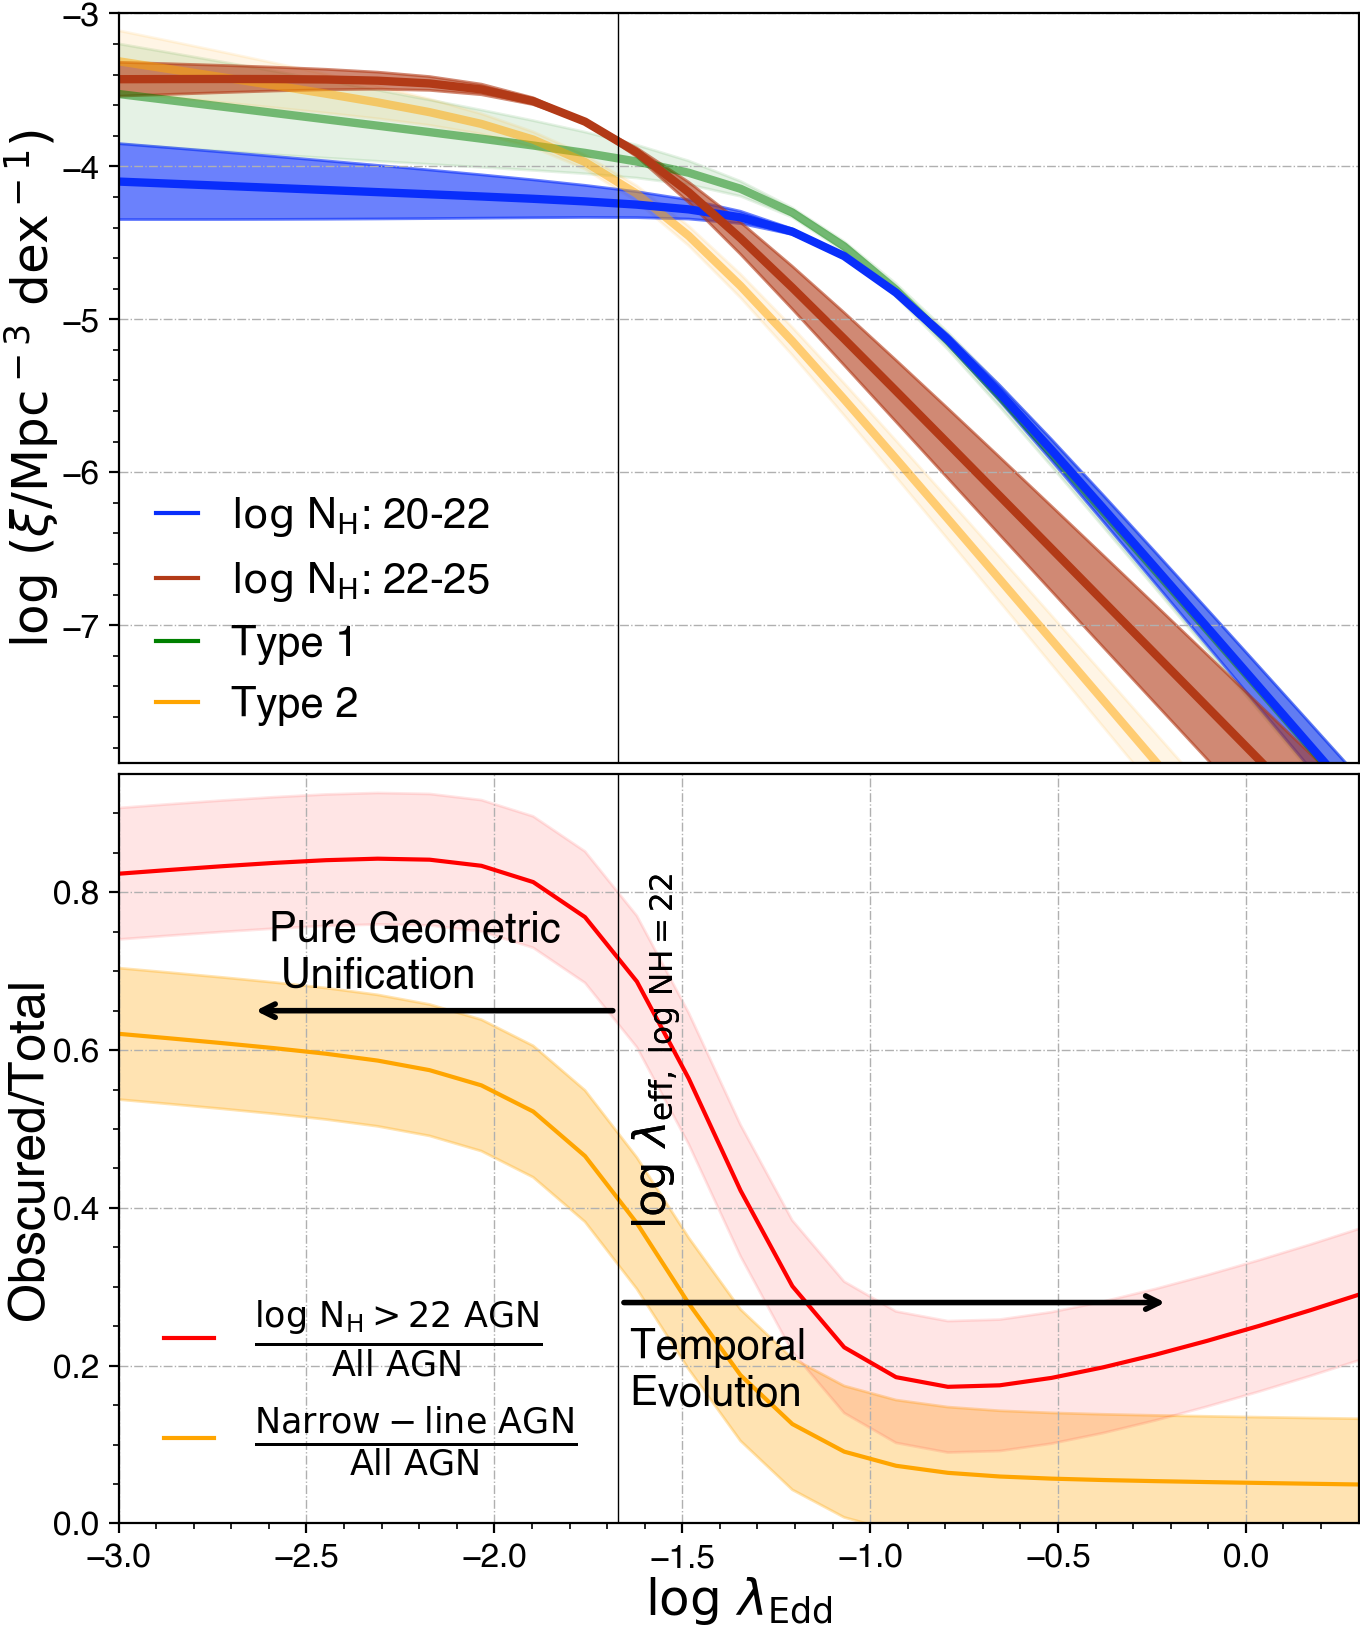
The intrinsic Eddington ratio distribution function in bins of is presented in Table 1 and Figure 2. The top panel of Figure 2 shows the selection bias and measurement uncertainty-corrected Eddington ratio distributions of unabsorbed [: ] and absorbed AGN bins [: ], along with the Type 1/Type 2 ERDFs from A22. The bottom panel shows the fraction of Type 2 AGN and : AGN as a function of , calculated by dividing the ERDFs of these populations by the ERDF of all AGN.
Figure 3, shows the evolution of the geometric covering factor at high (see Eq. 4). These model parameters ( and ) are constrained using the ratio of obscured to the total population shown in Fig. 2, at , -1.2, and averaged over . The average ratios for the last bin are and , for X-ray and optical measure of obscuration, respectively.
4 Discussion
In this work, we calculate the Eddington ratio distribution functions for obscured and unobscured AGN using X-ray measures of . We compare these functions to the ERDF for Type 1 and Type 2 AGN calculated in A22 using the same sample (all ERDFs shown in Fig. 2).
At low Eddington ratio, when the circum-nuclear torus is presumably stable, the ratio of the space density of obscured AGN to all AGN reflects the average covering factor of the torus. In § 4.1, we discuss the torus at low-, below the theoretical threshold where radiation pressure exceeds the gravitational pull. At high , in contrast, the gas and dust are blown away, so this ratio reflects the time-averaged covering factor. In § 4.2, we consider the ERDF and obscured/overall ratio at higher , and explore the time dependence of the covering factor using simple physically motivated models described in § 2.2.
4.1 Low- Region: Geometric Unification
Fabian et al. (2006, 2008) pointed out that the standard Eddington ratio is calculated for fully ionized gas, whereas for partially ionized cold gas, the scattering cross-section is higher, and therefore the “effective Eddington limit” () for such gas is lower. That is, colder, less ionized gas can be removed from near the AGN at lower levels of radiation pressure and thus lower Eddington limit.
In order to compare our results quantitatively with this theoretical picture, we check whether , the break in the power-law form of the Eddington ratio distribution function (see Eqn. 3), corresponds to the effective Eddington ratio for dusty gas at high densities. The value of from Fig. 1 in Fabian et al. (2008) represents the ratio of scattering cross sections for dusty gas compared to ionized gas (see Eqn. 2 from Fabian et al., 2008), or equivalently, to /. That is, the break, , should occur at (for ). For , for , which is in excellent agreement with the Fabian et al. (2008) predicted value, .
Under for obscured gas, both theoretically and as indicated by observations ( according to Fabian et al., 2008 and our results, and more conservatively), the radiation pressure is too low to blow away the obscuring matter. The simple scenario that emerges from this low- region is that the pure geometric unification model (Antonucci, 1993; Urry & Padovani, 1995; Netzer, 2015) applies in this regime, where the covering factor of the torus (equal to the ratio of obscured to all AGN in this regime ) could be as high as 83%. However, the BLR is completely blocked for only 60% of the total solid angle, which could be indicative of clumpiness in the torus structure (e.g., Ramos Almeida et al., 2009; Stalevski et al., 2012; Elitzur, 2012) allowing some broad-line visibility even with obscuring matter along our line of sight.
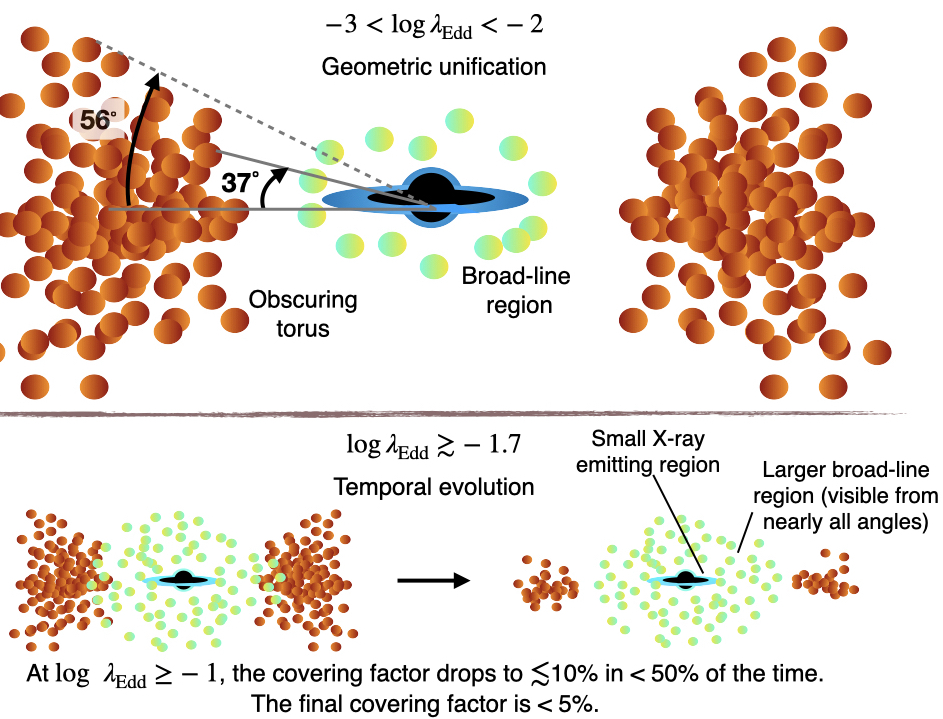
Semi-analytical models (e.g., Venanzi et al., 2020) find that the densest gas sinks closer to the equatorial plane of the AGN, due to asymmetry of the radiation field (). If the pure geometric unification model applies, this would mean that our view of the BLR is blocked when looking through angles closer to the equatorial region, whereas at angles higher above the equatorial plane, obscuring matter is distributed more sparsely, and therefore the BLR is more likely to be visible. According to our calculations with the BASS sample, at , the torus rises as high as [calculated using ; similarly, the torus opening angle ], while the BLR is completely blocked by dense matter up to above the equatorial plane. A schematic of the geometric unification model, along with these angles and the clumpy structure of the torus, is shown in the top panel of Figure 4.
4.2 High- Region: Transitional Timescales
The high- region gives rise to some seemingly contradictory observational signatures. While overall population studies such as ours indicate that the covering factor at high should be very low if geometric unification applies (e.g., lower panel of Figure 2, Figure 3 of Ricci et al., 2017b), observed obscured AGN which are found at these have very high covering factors. Ricci et al. (2017c) finds that among local ultra-luminous infrared galaxies (ULIRGs), the torus covering factor is as high as 95%, and most of these AGN are in late stages of mergers. A recent study of 57 ULIRGs (Yamada et al., 2021) also finds a high covering factor of 66% at . This is quantitatively at odds with a population-averaged covering factor of % at these (from Fig. 2). While ULIRGs represent only a small fraction of the overall AGN population, they dominate infrared samples because they have a lot of dust and they have high covering factors and high . Other obscured high- populations include red quasars (e.g., Glikman et al., 2004, 2012; Banerji et al., 2015; Glikman et al., 2018), and Hot Dust-Obscured Galaxies (HotDOGs, e.g., Assef et al., 2016; Vito et al., 2018). Some X-ray selected studies also find that heavily dust-reddened quasars are in a radiatively driven blow-out phase (Lansbury et al., 2020).
In other words, infrared-selected quasars have high covering factors and high . Yet, according to Figure 2, we should find a much smaller obscured/overall ratio, implying a much smaller torus covering factor if simple geometric unification were the cause. As most of these studies conclude that these high-, obscured AGN are in a transitional state, we suggest that the low obscured/overall ratio at high is indicative of the duration of the obscured phase. That is, the time-averaged covering factor is low (%), while infrared studies select luminous/high- sources that are still in a dust-obscured phase.
To disentangle the geometric and temporal aspects of the evolution of the covering factor, we consider two simple time-dependent parametric models of evolution, described in § 2.2. In Figure 3, we show these functions constrained using the obscured/overall ratio (from Figure 2) at and , and over the range. We find that for the first model (the sigmoid function), in which the decay of the covering factor might start slowly due to shielding from dense obscuring matter, then accelerate as more matter is removed, the covering factor for the torus approaches zero within 40% of the time spent at . The sigmoid function therefore somewhat contradicts infrared studies that find evidence of residual dust around luminous SDSS quasars. The second model (exponential function) accommodates slower decay of the X-ray detected covering factor, even though the part of the torus that completely blocks the BLR is depleted inwithin 30% of the AGN lifetime. The persistent covering factors, calculated using X-ray obscuration measurements, at , and are , 5% and 2%, respectively, indicate that at lower , more obscuring matter remains around the AGN at the end of the active phase. The bottom panels of Figure 4 shows a schematic of this transition, with the residual dust ( by the end of the phase) in the right panel.
While the exponential function allows a gradual decrease in covering factor, the sigmoid function behaves almost like a step function. If we interpret the sigmoid function as a limiting case where the high- obscured/total ratio is decided purely by timescale (i.e., an obscured/total ratio of % means % of the time is spent fully obscured, and ()% of the time is spent in the almost fully unobscured state), then the percentage of time spent fully obscured by torus is %. The narrow-line only covering factor will be depleted within % of the time, so that for about 15% of the time the AGN will appear broad-line and obscured. This estimate agrees well with the Glikman et al. (2012) and Glikman et al. (2018) results, which suggested that the duration of the red-quasar phase is 15–20% of the total quasar lifetime.
As both Figures 2 and 3 show, the X-ray measure of obscured/overall ratio at high- is higher than the Type 2/overall ratio. A likely interpretation for this is that the former indicates a time-averaged covering factor, while the latter indicates an increase in the size of the broad-line region relative to the torus. When the scale height of the BLR region is higher than that of the torus, the BLR should be visible even from equatorial lines of sight, as shown in the bottom right panel of Figure 4. This depletion of torus/rise of the BLR happens within 30% of the time spent at (see Fig. 3). We do an order-of-magnitude calculation using well-established constraints on the duration of unobscured quasar accretion, which is roughly the Salpeter time of years (Martini, 2003; Hopkins et al., 2006; Worseck et al., 2007; Gonçalves et al., 2008). Using the functions shown in Figure 3, we estimate that after being triggered to , it takes 20–30% of the time (3–30 Myr) to transition into a completely broad-line phase.
5 Conclusions
This work presents the first intrinsic Eddington ratio distribution functions for X-ray-obscured and -unobscured AGN, constrained using the local BASS sample. These ERDFs show that there are times as many obscured as unobscured AGN at low , while the reverse is true at high , with times as many unobscured as obscured AGN.
Reasoning that the circum-nuclear obscuration is relatively stable at , we interpret that population ratio in purely geometric terms. A ratio of 4:1 corresponds to an % covering factor, meaning that a simple obscuring torus would rise 56∘ above the equatorial plane. The Type 2 to overall AGN space density ratio, determined by A22, is somewhat smaller, %, with broad optical lines seen in roughly one quarter of high- AGN. This suggests that the obscuring torus is clumpy. Recent simulations suggest that obscuration is densest near the equatorial plane (e.g., Venanzi et al., 2020). In that case, all broad-lines are blocked within 37∘ of the plane by tightly packed obscuring matter, with some open lines of sight between 37∘ and 56∘. The top panel of Figure 4 shows a schematic representation of this clumpy torus, with geometry derived from the ERDF ratios.
At high Eddington ratios, the fraction of obscured AGN is much smaller. Additionally, the obscured fraction is much lower for narrow-line AGN (%) than for AGN with (%, see bottom panel of Fig. 2). Infrared-selected luminous, high-, obscured AGN have very high covering factors (66-95%; see § 4.2), —much higher than the observed population average. This tension can be resolved if the highly covered phase is short-lived and infrared-luminous, so that infrared selection preferentially finds ULIRGs, red quasars, and HotDOGs.
To disentangle the geometric and temporal aspects at high , we considered two simple physically motivated models of the decline in covering factor with time (Fig. 3), constrained by the obscured/overall ratios at high . Using these models, we find that it takes approximately 50% of the lifetime of the high- phase (i.e., at ) to reduce the covering factor from 80% to 10%. The covering factor is at the end of the high- phase. Additionally, the broad-line region becomes visible along all lines of sight within 20–30% of the time (orange and yellow lines in Fig. 3), possibly indicating that the height of the broad-line region is higher than that of the obscuring torus, making it visible along all lines of sight, as shown in the bottom right panel of Figure 4.
Acknowledgments
We thank the referee for thoughtful comments that helped us greatly improve this paper. This paper is part of a series presented by the BASS Collaboration. Specifically, this is BASS XXXVIII. T.T.A. support from NASA through ADAP award NNH22ZDA001N. T.T.A. and R.C.H. acknowledge support from NASA through ADAP award 80NSSC19K0580, and the National Science Foundation through CAREER award 1554584. C.M.U. acknowledges support from the National Science Foundation under Grant No. AST-1715512, and from NASA through ADAP award 80NSSC18K0418. P.N. acknowledges the Black Hole Initiative (BHI) at Harvard University, which is supported by grants from the Gordon and Betty Moore Foundation and the John Templeton Foundation. B.T. acknowledges support from the Israel Science Foundation (grant number 1849/19) and from the European Research Council (ERC) under the European Union’s Horizon 2020 research and innovation program (grant agreement number 950533). M.K. acknowledges support from NASA through ADAP award NNH16CT03C. M.B. acknowledges support from the YCAA Prize Postdoctoral Fellowship. K.O. acknowledges the support of the Korea Astronomy and Space Science Institute under the R&D program (Project No. 2022-1-830-06) supervised by the Ministry of Science and ICT and from the National Research Foundation of Korea (NRF-2020R1C1C1005462). We acknowledge funding support through ANID programs: Millennium Science Initiative NCN19_058 (E.T.), and ICN12_009 (FEB); CATA-BASAL - ACE210002 (E.T., F.E.B.) and FB210003 (E.T., F.E.B., C.R.); FONDECYT Regular - 1190818 (E.T., F.E.B.) and 1200495 (F.E.B., E.T.); and FONDECYT Iniciacion 11190831 (C.R.). This work was performed in part at the Aspen Center for Physics, which is supported by National Science Foundation grant PHY-1607611.
References
- Ananna et al. (2020) Ananna, T. T., Treister, E., Urry, C. M., et al. 2020, ApJ, 889, 17, doi: 10.3847/1538-4357/ab5aef
- Ananna et al. (2019) —. 2019, ApJ, 871, 240, doi: 10.3847/1538-4357/aafb77
- Ananna et al. (2022) Ananna, T. T., Weigel, A. K., Trakhtenbrot, B., et al. 2022, ApJS, 261, 9, doi: 10.3847/1538-4365/ac5b64
- Antonucci (1993) Antonucci, R. 1993, ARA&A, 31, 473, doi: 10.1146/annurev.aa.31.090193.002353
- Assef et al. (2016) Assef, R. J., Walton, D. J., Brightman, M., et al. 2016, The Astrophysical Journal, 819, 111, doi: 10.3847/0004-637X/819/2/111
- Banerji et al. (2015) Banerji, M., Alaghband-Zadeh, S., Hewett, P. C., & McMahon, R. G. 2015, Monthly Notices of the Royal Astronomical Society, 447, 3368, doi: 10.1093/mnras/stu2649
- Barger et al. (2005) Barger, A. J., Cowie, L. L., Mushotzky, R. F., et al. 2005, AJ, 129, 578, doi: 10.1086/426915
- Baumgartner et al. (2013) Baumgartner, W. H., Tueller, J., Markwardt, C. B., et al. 2013, ApJS, 207, 19, doi: 10.1088/0067-0049/207/2/19
- Best et al. (2005) Best, P. N., Kauffmann, G., Heckman, T. M., et al. 2005, MNRAS, 362, 25, doi: 10.1111/j.1365-2966.2005.09192.x
- Braito et al. (2014) Braito, V., Reeves, J. N., Gofford, J., et al. 2014, The Astrophysical Journal, 795, 87, doi: 10.1088/0004-637X/795/1/87
- Buchner et al. (2015) Buchner, J., Georgakakis, A., Nandra, K., et al. 2015, ApJ, 802, 89, doi: 10.1088/0004-637X/802/2/89
- Elitzur (2012) Elitzur, M. 2012, The Astrophysical Journal, 747, L33, doi: 10.1088/2041-8205/747/2/L33
- Fabian et al. (2006) Fabian, A. C., Celotti, A., & Erlund, M. C. 2006, Monthly Notices of the Royal Astronomical Society, 373, L16, doi: 10.1111/j.1745-3933.2006.00234.x
- Fabian et al. (2008) Fabian, A. C., Vasudevan, R. V., & Gandhi, P. 2008, Monthly Notices of the Royal Astronomical Society, 385, L43, doi: 10.1111/j.1745-3933.2008.00430.x
- Foreman-Mackey et al. (2013) Foreman-Mackey, D., Hogg, D. W., Lang, D., & Goodman, J. 2013, PASP, 125, 306, doi: 10.1086/670067
- Gilli et al. (2007) Gilli, R., Comastri, A., & Hasinger, G. 2007, A&A, 463, 79, doi: 10.1051/0004-6361:20066334
- Glikman et al. (2004) Glikman, E., Gregg, M. D., Lacy, M., et al. 2004, ApJ, 607, 60, doi: 10.1086/383305
- Glikman et al. (2012) Glikman, E., Urrutia, T., Lacy, M., et al. 2012, ApJ, 757, 51, doi: 10.1088/0004-637X/757/1/51
- Glikman et al. (2018) Glikman, E., Lacy, M., LaMassa, S., et al. 2018, ApJ, 861, 37, doi: 10.3847/1538-4357/aac5d8
- Gonçalves et al. (2008) Gonçalves, T. S., Steidel, C. C., & Pettini, M. 2008, The Astrophysical Journal, 676, 816, doi: 10.1086/527313
- Green et al. (2022) Green, P. J., Pulgarin-Duque, L., Anderson, S. F., et al. 2022, The Astrophysical Journal, 933, 180, doi: 10.3847/1538-4357/ac743f
- Hall et al. (2004) Hall, P., Hopkins, P., Strauss, M., Richards, G., & Brinkmann, J. 2004, in Astronomical Society of the Pacific Conference Series, Vol. 311, AGN Physics with the Sloan Digital Sky Survey, ed. G. T. Richards & P. B. Hall, 65. https://arxiv.org/abs/astro-ph/0312281
- Hopkins et al. (2006) Hopkins, P. F., Somerville, R. S., Hernquist, L., et al. 2006, ApJ, 652, 864, doi: 10.1086/508503
- Hopkins et al. (2004) Hopkins, P. F., Strauss, M. A., Hall, P. B., et al. 2004, AJ, 128, 1112, doi: 10.1086/423291
- Kelly & Shen (2013) Kelly, B. C., & Shen, Y. 2013, ApJ, 764, 45, doi: 10.1088/0004-637X/764/1/45
- Koss et al. (2016) Koss, M. J., Assef, R., Baloković, M., et al. 2016, ApJ, 825, 85, doi: 10.3847/0004-637X/825/2/85
- Koss et al. (2022a) Koss, M. J., Ricci, C., Trakhtenbrot, B., et al. 2022a, ApJS, 261, 2, doi: 10.3847/1538-4365/ac6c05
- Koss et al. (2022b) Koss, M. J., Trakhtenbrot, B., Ricci, C., et al. 2022b, ApJS, 261, 1, doi: 10.3847/1538-4365/ac6c8f
- Koss et al. (2022c) —. 2022c, ApJS, 261, 6, doi: 10.3847/1538-4365/ac650b
- La Franca et al. (2005) La Franca, F., Fiore, F., Comastri, A., et al. 2005, ApJ, 635, 864, doi: 10.1086/497586
- Lansbury et al. (2020) Lansbury, G. B., Banerji, M., Fabian, A. C., & Temple, M. J. 2020, Monthly Notices of the Royal Astronomical Society, 495, 2652, doi: 10.1093/mnras/staa1220
- Lawrence (1991) Lawrence, A. 1991, MNRAS, 252, 586, doi: 10.1093/mnras/252.4.586
- Marchese et al. (2012) Marchese, E., Braito, V., Della Ceca, R., Caccianiga, A., & Severgnini, P. 2012, Monthly Notices of the Royal Astronomical Society, 421, 1803, doi: 10.1111/j.1365-2966.2012.20445.x
- Martini (2003) Martini, P. 2003, QSO Lifetimes, arXiv. http://arxiv.org/abs/astro-ph/0304009
- Mejía-Restrepo et al. (2022) Mejía-Restrepo, J. E., Trakhtenbrot, B., Koss, M. J., et al. 2022, The Astrophysical Journal Supplement Series, 261, 5, doi: 10.3847/1538-4365/ac6602
- Netzer (2015) Netzer, H. 2015, ARA&A, 53, 365, doi: 10.1146/annurev-astro-082214-122302
- Oh et al. (2015) Oh, K., Yi, S. K., Schawinski, K., et al. 2015, ApJS, 219, 1, doi: 10.1088/0067-0049/219/1/1
- Ramos Almeida et al. (2009) Ramos Almeida, C., Levenson, N. A., Rodríguez Espinosa, J. M., et al. 2009, ApJ, 702, 1127, doi: 10.1088/0004-637X/702/2/1127
- Ricci et al. (2015) Ricci, C., Ueda, Y., Koss, M. J., et al. 2015, ApJ, 815, L13, doi: 10.1088/2041-8205/815/1/L13
- Ricci et al. (2017a) Ricci, C., Trakhtenbrot, B., Koss, M. J., et al. 2017a, ApJS, 233, 17, doi: 10.3847/1538-4365/aa96ad
- Ricci et al. (2017b) —. 2017b, Nature, 549, 488, doi: 10.1038/nature23906
- Ricci et al. (2017c) Ricci, C., Bauer, F. E., Treister, E., et al. 2017c, MNRAS, 468, 1273, doi: 10.1093/mnras/stx173
- Ricci et al. (2022) Ricci, C., Ananna, T. T., Temple, M. J., et al. 2022, arXiv e-prints, arXiv:2209.00014. https://arxiv.org/abs/2209.00014
- Richards et al. (2002) Richards, G. T., Fan, X., Newberg, H. J., et al. 2002, AJ, 123, 2945, doi: 10.1086/340187
- Schulze et al. (2015) Schulze, A., Bongiorno, A., Gavignaud, I., et al. 2015, MNRAS, 447, 2085, doi: 10.1093/mnras/stu2549
- Simpson (2005) Simpson, C. 2005, MNRAS, 360, 565, doi: 10.1111/j.1365-2966.2005.09043.x
- Stalevski et al. (2012) Stalevski, M., Fritz, J., Baes, M., Nakos, T., & Popović, L. Č. 2012, MNRAS, 420, 2756, doi: 10.1111/j.1365-2966.2011.19775.x
- Stawarz (2010) Stawarz, L. 2010, in Astronomical Society of the Pacific Conference Series, Vol. 427, Accretion and Ejection in AGN: a Global View, ed. L. Maraschi, G. Ghisellini, R. Della Ceca, & F. Tavecchio, 357
- Trakhtenbrot et al. (2019) Trakhtenbrot, B., Arcavi, I., MacLeod, C. L., et al. 2019, The Astrophysical Journal, 883, 94, doi: 10.3847/1538-4357/ab39e4
- Treister et al. (2008) Treister, E., Krolik, J. H., & Dullemond, C. 2008, ApJ, 679, 140, doi: 10.1086/586698
- Treister et al. (2009) Treister, E., Urry, C. M., & Virani, S. 2009, ApJ, 696, 110, doi: 10.1088/0004-637X/696/1/110
- Treister et al. (2004) Treister, E., Urry, C. M., Chatzichristou, E., et al. 2004, ApJ, 616, 123, doi: 10.1086/424891
- Ueda et al. (2003) Ueda, Y., Akiyama, M., Ohta, K., & Miyaji, T. 2003, ApJ, 598, 886, doi: 10.1086/378940
- Urry & Padovani (1995) Urry, C. M., & Padovani, P. 1995, PASP, 107, 803, doi: 10.1086/133630
- Venanzi et al. (2020) Venanzi, M., Hönig, S., & Williamson, D. 2020, The Astrophysical Journal, 900, 174, doi: 10.3847/1538-4357/aba89f
- Vito et al. (2018) Vito, F., Brandt, W. N., Stern, D., et al. 2018, Monthly Notices of the Royal Astronomical Society, 474, 4528, doi: 10.1093/mnras/stx3120
- Worseck et al. (2007) Worseck, G., Fechner, C., Wisotzki, L., & Dall’Aglio, A. 2007, Astronomy and Astrophysics, Volume 473, Issue 3, October III 2007, pp.805-818, 473, 805, doi: 10.1051/0004-6361:20077585
- Yamada et al. (2021) Yamada, S., Ueda, Y., Tanimoto, A., et al. 2021, The Astrophysical Journal Supplement Series, 257, 61, doi: 10.3847/1538-4365/ac17f5