Polar Dust Emission in Quasar IR SEDs and Its Correlation with Narrow Line Regions
Abstract
Polar dust has been found to play an important role in the mid-infrared emission of nearby Seyfert nuclei. If and how often polar dust exists among the quasar population is unknown due to the lack of spatially-resolved observations. In this Letter, we report correlations between the prominence of AGN forbidden line emission (commonly associated with the narrow line region) and the dust mid-IR energy output among the archetypal Palomar-Green quasar sample and other bright type-1 AGNs drawn from the SDSS, Spitzer and WISE archives. The AGN mid-IR color differences traced by WISE W2 ()W3 () and W2 ()W4 (), and near-IR to mid-IR SEDs constrained with 2MASS, WISE and Spitzer data have clear trends with the relative strength of the forbidden line regions traced by the optical [O III] and mid-IR [O IV] emission lines. These observations indicate that, where the lines are strong, a large fraction of the AGN emission at m comes from dust in the forbidden line regions. We find that the widely quoted universal AGN template is a result of averaging quasar SEDs with different levels of polar dust emission above the torus output and that the typical intrinsic IR SED of compact torus dust emission alone falls with increasing wavelength past 5 m (in ). In addition, the association of polar dust with the forbidden lines suggests an alternative to the receding torus hypothesis for the decrease in infrared output with increasing AGN luminosity.
1 Introduction
In the unification model of active galactic nuclei (AGNs), the mid-IR emission is assumed to originate from a compact torus-like obscuring structure surrounding the central engine (Antonucci, 1993; Urry & Padovani, 1995). This concept has been widely adopted to interpret the infrared emission of AGNs (e.g., Fritz et al. 2006; Nenkova et al. 2008; Stalevski et a. 2012; see reviews in e.g., Netzer 2015). Ground-based high resolution imaging of nearby Seyfert nuclei allows direct constraints on the dust morphology of AGN mid-IR emission at 10 m down to a few tens of parsecs (pc), and interferometry can reach pc-scale features. However, instead of a compact pc-scale torus, such observations have frequently revealed dust structures extending 10-100 pc along the polar direction (e.g., Bock et al., 2000; Radomski et al., 2003; Hönig et al., 2013; López-Gonzaga et al., 2016; Asmus et al., 2016) and challenged the classical picture.
In fact, the existence of AGN-heated dust on larger scales in the narrow line region (NLR), preferentially along the polar direction, was suggested long ago (e.g., Netzer & Laor, 1993; Dopita et al., 2002) and directly revealed by, e.g., the early spatially-resolved mid-IR observations of the archetypal type-2 AGN NGC 1068 and type-1 AGN NGC 4151 where the extended dust emission at 10 is co-spatial with the NLR morphology (e.g., Bock et al., 2000; Radomski et al., 2003). Recent observations of larger AGN samples frequently report that the extended mid-IR emission is aligned with NLR position angle, suggesting this behavior is characteristic of many AGNs (e.g., López-Gonzaga et al., 2016; Asmus et al., 2016; Alonso-Herrero et al., 2021). Notably, Asmus (2019) selected AGNs with strong mid-IR [O IV]25.89 m emission for mid-IR interferometry observations and found polar emission in nearly every member of the sample, supporting the association of AGN mid-IR polar emission with NLRs.
Nevertheless, addressing the prevalence of extended polar dust is difficult observationally, as mid-IR observations with sufficient spatial resolution are limited to the nearest objects with preferred inclination angles. However, Lyu & Rieke (2018) suggest that the polar dust component can leave distinct features in the AGN IR spectral energy distribution (SED) to allow its identification, and argue that the typical NLR clouds can naturally host the dust grains responsible for the polar dust emission. If confirmed, such an association could extend our understanding of the incidence of polar dust to much more distant objects and allow new insights into the AGN IR SED variations.
In this Letter, we investigate whether there is a direct connection between the dust responsible for the AGN mid-IR emission and the gas producing the narrow line emission. § 2 summarizes the various optical and mid-IR measurements of AGNs and quasars used for our analysis. We report a correlation between the relative strengths of the AGN NLRs and the behavior of the mid-IR output in § 3. § 4 discusses how this result reshapes our understanding of various AGN properties in general.
2 Sample, Data and Measurements
Our study is focused on three samples:
-
•
PG quasars: this sample consists of the 87 Palomar-Green (PG) quasars selected from the Palomar Bright Quasar Survey (Schmidt & Green, 1983; Boroson & Green, 1992), which have rich IR photometric data from 2MASS, UKIDSS, Spitzer, Herschel and WISE and high-quality Spitzer/IRS spectra in the mid-IR. These sources have served as a foundation for quasar studies over the past four decades. In Lyu et al. (2017); Lyu & Rieke (2017), we used this dataset to study the intrinsic AGN IR SED variations of quasars in detail, laying a basis for the current work;
-
•
SDSS quasars: To increase the sample statistics, we also select 8506 quasars from the DR7 edition of the Sloan Digital Sky Survey (SDSS) Quasar Catalog, with spectroscopy compiled by Shen et al. (2011). We require these objects to be at and to have measurements of [O III] and H. We have identified near- to mid-IR counterparts within a search radius of 3′′ in 2MASS and WISE for 7712 of these quasars (90.7%);
-
•
SDSS-Spitzer AGNs: We also build a third type-1 AGN sample with mid-IR spectra by matching the Spitzer/IRS archive with the broad-line AGNs from the SDSS survey. These type-1 AGNs are identified by FWHM() km/s, either in the DR7 edition of the SDSS Main Galaxy Sample (Hao et al., 2005) or the Quasar Catalog (Shen et al., 2011). The mid-IR spectra are mainly from the Combined Atlas of Sources with Spitzer IRS Spectra (CASSIS; Lebouteiller et al. 2011)111https://cassis.sirtf.com/ with some additional objects from the ATLAS project (Hernán-Caballero & Hatziminaoglou, 2011)222http://www.denebola.org/atlas/. We have visually inspected the mid-IR spectra to make sure that they have adequate signal-to-noise ratios for the 6–30 m continuum as well as the mid-IR [O IV] emission line, and do not have overwhelmingly strong PAH emission or silicate absorption features. In total, there are 209 type-1 AGNs under these criteria.
To trace the NLR, we use forbidden lines of oxygen, [O III]5007Å and [O IV]25.89m; both lines have relatively low ionization energy and extend over large physical scales ( pc) around AGNs. As both lines show correllations with the AGN luminosity (e.g., Diamond-Stanic et al., 2009; Malkan et al., 2017), basing the study on absolute line strengths is not appropriate. Instead, we normalize each of them with another AGN luminosity indicator, namely H and the 4–5 m continuum (traced by the WISE W2 band)333The strength of the former is dominated in type-1 AGNs by the emission of broad-line regions and the latter probes the hot dust emission strength near the AGN sublimation zone, both of which trace common nuclear structures in type-1 AGNs below or near parsec scales (e.g., Kaspi et al., 2005; Lyu et al., 2019) and are believed to be approximate indicators of AGN luminosity(e.g., Malkan et al., 2017; Asmus et al., 2015)., to remove this dependence and trace the relative strength of the NLR.
The optical emission line measurements for PG quasars are taken from Boroson & Green (1992) and for the SDSS quasars from Shen et al. (2011). The mid-IR [O IV] properties of the sample, such as line flux, FWHM and equivalent width (EW), are measured by fitting a single Gaussian function with a local continuum to the observed Spitzer/IRS data with our own customized code.
More detailed information on the sample as well as the relevant data and measurements are provided online at https://github.com/karlan/AGN-MIR-SED-NLR.
3 Results
To characterize the AGN IR emission, we first calculate the IR colors for individual sources and later compute average SED/spectral templates for objects binned by different NLR strengths.
3.1 Trend of Infrared Colors with NLR Strength
To trace the significance of polar infrared emission, we adopt the WISE W2W3 and W2W4 color differences, since (1) W3 () probes the wavelength range where the existence of polar dust is well established and (2) W4 () is near the peak of the expected polar dust SED (e.g., Hönig et al., 2013; Lyu & Rieke, 2018).
The left panels in Figure 1 show how the WISE W2W3 and W2W4 colors indicate stronger mid-IR emission with increasing [O IV]/W2 for both the PG sample and the SDSS-Spitzer sample. Correlations are apparent in both panels. The Spearman’s rank correlation coefficients in the W2W3 bands for the PG and SDSS-Spitzer quasars are 0.476 (=1.383e-05) and 0.601 (=6.03e-22), where is the probability of the null hypothesis that a correlation does not exist. The Spearman’s in W2W4 for PG and SDSS-Spitzer quasars are 0.382 (=6e-4) and 0.531 (=1.282e-16).
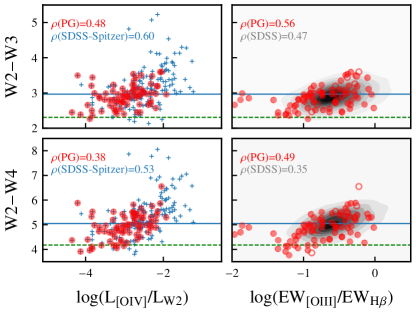
Similar AGN IR color trends also exist for the optical NLR tracer, EW([O III])/EW(H), for both PG and SDSS quasars, as presented in the right panels of Figure 1. The Spearman’s values for the W2W3 color difference for PG and SDSS quasars are 0.487 (=2.98e-06) and 0.349 (=1.1e-239), respectively. The values for W2W4 for PG and SDSS quasars are 0.561 (=0.0) and 0.471 (=3.459e-08), respectively. For the PG sample, we have highlighted those cases with a strong host contribution in the IR with open circles, as measured in (Lyu & Rieke, 2017). For quasars with , the AGN still dominates the mid-IR by 90% (Lyu & Rieke, 2017). That is, the influence of galaxy contamination on these trends is minimal.
3.2 Average SED Templates
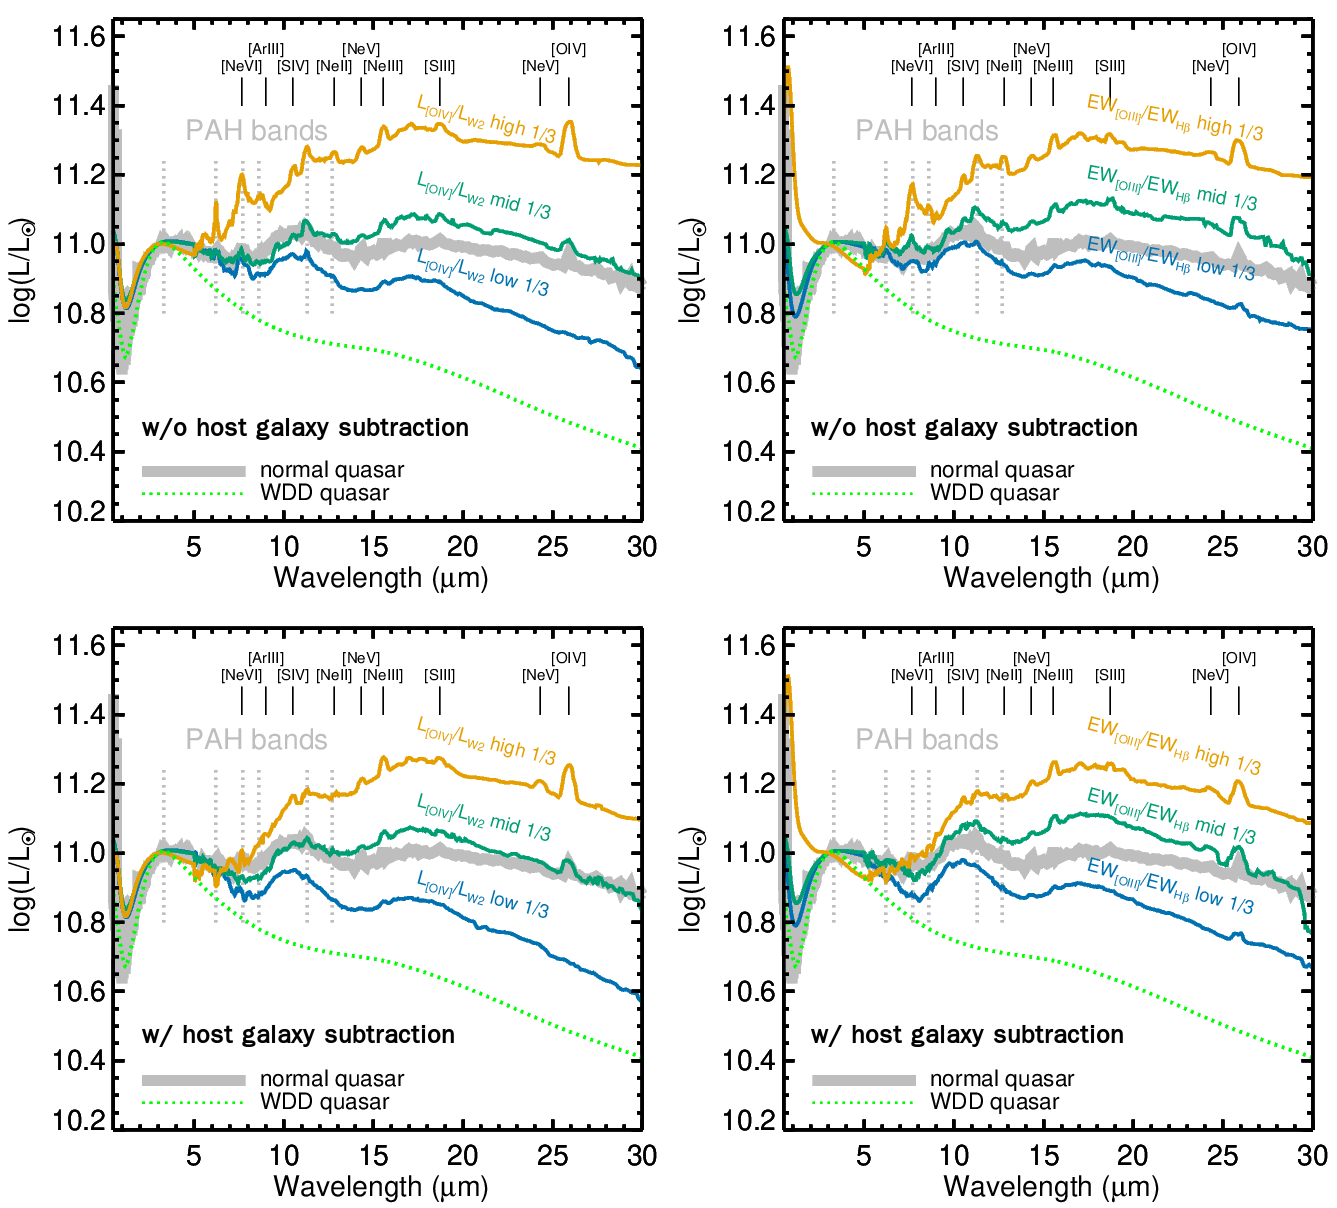
To illustrate further how the forbidden line strength is connected with the nature of the AGN SED, we sorted the PG and SDSS-Spitzer samples into bins of and EW([O III])/EW(H) and derived the corresponding AGN templates for different relative NLR strengths. The vast majority of these objects have Spitzer/IRS spectra that can reveal host galaxy contamination in the mid-IR emission by the detection of the 11.3 m PAH feature. To remove the galaxy contamination, we subtracted a Rieke et al. (2009) star-forming galaxy IR template from the observed Spitzer/IRS spectra to make the peak of any residual 11.3 m PAH feature strength fall below 3- flux uncertainities. As the Spitzer spectra only span the rest-frame 5.5–35 m, we extended the wavelength coverage at shorter wavelengths with the photometric SEDs from 2MASS and WISE. We interpolated the IR photometry of each object in space, smoothed the interpolated SED with a boxcar with the same wavelength grid and replaced it with the mid-IR spectra if available.
We visually investigated these SEDs and dropped any objects that (1) show abnormal SED jumps due to time variability (note that the 2MASS/WISE/Spitzer data are observed at different times; (2) have mid-IR silicate features in absorption; (3) have very strong PAH features that dominate the mid-IR emission; (4) show convincing evidence for non-thermal mid-IR emission (e.g., some BL Lac objects have a falling power-law mid-IR continuum); (5) do not have measurements of the mid-IR [O IV] line strength. After incoporating all these contraints, 177 objects were left. We grouped them into three bins for or EW([O III])/EW(H) with identical sample sizes (59–60 objects), normalized each SED at rest-frame 14.5m where the spectrum is featureless, and computed the median average SEDs as the final templates.
In Figure 2, we show the average templates before (upper panels) and after removing the host galaxy contamination (bottom panels). Perceivable trends with and EW([O III])/EW(H) are present in all the panels. After the host galaxy removal, the resulting AGN SED templates have very weak PAH features and the continuum emission should be dominated by the AGN-heated dust. We can see clearly that the relative strength of the AGN mid-IR (10–30 m) output to that at 3 increases with increasing [O IV]/W2 ratio or [O III]/H ratio. The behavior is consistent with the color trends in Figure 1, but attaches specific SEDs to the trend. In addition, the prominance of the mid-IR forbidden lines, e.g., [Ne II], [Ne III], [Ne V] and [S III], is also associated with an increase of mid-IR continuum strength.
3.3 Robustness of These Correlations
The trends in Figure 1 and Figure 2 should not be affected by extinction. Our study is focused on Type-1 to 1.5 AGNs where the Balmer broad lines are clearly detected and the extinction in the visible is relatively small. As the dust opacity decreases quickly from the optical to the mid-IR (e.g., Gordon et al. 2021), the expected extinction in the W2 and W4 bands and the [OIV] line would be even smaller and can be safely ignored. The W3 band does include the silicate absorption feature but the extinction over the entire broad band is still far less ( 6%; e.g., Rieke & Lebofsky 1985) than in the visible. The [OIII]/H ratio is widely used as being roughly extinction-independent due to their close wavelengths.
The behavior of EW([O III])/EW(H) in Figure 1 might be affected by the Baldwin Effect. As shown by e.g., Kovačević et al. (2010), the Baldwin Effect is similar for [O III] and narrow H. The broad H, however, has a weak and negative Baldwin Effect. The net result would drive down [O III]/H modestly as the AGN luminosity increases. In fact, within the errors the slopes of the ratio of line flux to continuum flux are identical for these lines, i.e., the ratio is independent of luminosity (Wilkes et al., 1999). The Baldwin Effect is less thoroughly observed for the [O IV] line, although Keremedjiev et al. (2009) observe it for other mid-infrared fine structure lines. Again, it will drive down the ratio of the [O IV] line to W2 with increasing luminosity. However, in both cases since the shapes of the infrared SEDs of AGNs , e.g., W2 W3 or W2 W4, do not correlate with luminosity444Although the strength of the infrared SED relative to the visible does correlate with luminosity, see § 4.3., the effect will increase the scatter in Figure 1 but should not contribute to the correlations.
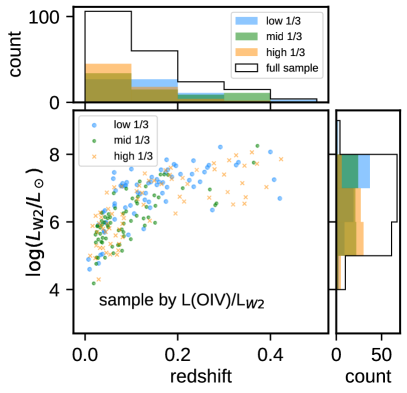
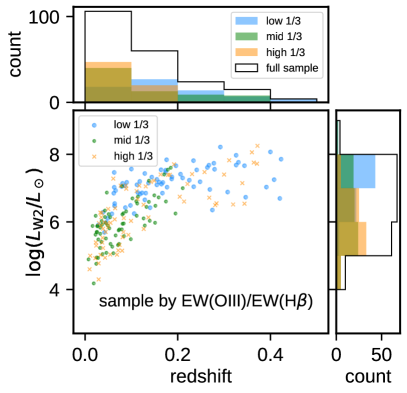
Figure 3 compares the redshift and AGN luminosity distributions of the sub-samples used to compute the average templates in Figure 2. No statistical difference is seen for the sample redshifts. However, the AGN luminosity shows a negative trend with both and EW([O III])/EW(H). As discussed in § 4.3, the NLR strength does have some dependence on the AGN luminosity and thus this AGN luminosity difference is a result of sub-sample definition. For the AGN mid-IR SED and NLR strength correlations presented above, however, we used the ratios of two luminosity indicators to take out this luminosity effect. As a result, our interpretation is not influenced by the sample luminosity.
Lastly, the choice of host galaxy template would not affect our results as the changes of the AGN color after the galaxy subtraction are small, as shown in Figure 1.
In conclusion, none of the factors mentioned above can explain the correlations.
4 Discussion
Previous work by Zhang et al. (2013) reported a correlation between the covering factor for the dust around an AGN and the strength of the wing of the [O III]5007Å line relative to the bolometric luminosity. The results obtained in this work agree generally with that study and our analysis reveals a strong correlation between the relative AGN mid-IR energy output and the relative strength of the NLR emission; i.e., the more prominent the NLR region, the stronger the dust emission in the mid-IR. As shown below, this result expands our understanding of the variations in AGN SEDs we have described previously and can provide new insights to AGN behavior.
4.1 Quasar IR SEDs
In Lyu et al. (2017), we found two major variations in intrinsic IR SEDs compared with “normal” AGNs (e.g., that of Elvis et al., 1994): (1) the warm-dust-deficient (WDD) case has similar hot dust emission at 1–3 as normal objects but is weaker in the mid-IR; and (2) the hot-dust-deficient (HDD) case has weak dust emission throughout the near- and mid-IR. As shown in Figure 1, the WDD template represents the smallest W2W3 and W2W4 color differences seen in quasars; it also appears to be the limiting case for a weak NLR. This suggests that the WDD template represents the compact dust emission associated with the classical torus alone. In Lyu & Rieke (2018) we showed that the normal AGN SED can be approximately reproduced by adding polar dust emission above the WDD template with an effective optical depth . Consistent with this possibility, our semi-empirical SED fitting for all three type-1 AGNs with polar dust constraints from mid-IR interferometry (NGC 3783, ESO 323-77 and NGC 4507) suggested that their nuclear dust emission SED could be WDD.
Particularly for the comparison based on the [O IV] line, the SEDs for weak line emission drop toward longer wavelengths in Figure 2 similarly to the behavior of the HDD and WDD templates. In comparison, the SED for strong line emission lies above even the “normal” template of Lyu et al. (2017). Based on this evidence, we suggest that a large fraction, if not all, the excess emission above the WDD template comes from relatively extended dust associated with the NLR.
The average quasar SEDs derived in the literature show similar dust continua that are described by the normal template and have little evolution with redshift (e.g., see references in Lyu & Rieke, 2018). Given the discussion in the preceding paragraph, this suggests that a large fraction of quasars have a moderate level of polar dust emission. Some 60–70% of the PG quasars have excess AGN dust emission above the WDD template and the average relative fraction of this hypothetical extended dust emission is 50% at 10 , from the comparison of normal and WDD AGN templates (see Figure 2 in Lyu et al., 2017). As most works computing average quasar templates do not differentiate SED properties, the normal-like AGN templates are a result of averaging AGN SEDs with different levels of extended NLR dust emission and different intrinsic torus SEDs, including cases that are relatively brighter in the mid-infrared than even the normal template. This situation is illustrated in Shang et al. (2011), Figure 10, and Lyu & Rieke (2018), Figures 6 & 7. The success of the normal template in SED fitting and decomposition derives directly from its being an overall average, not because it represents all AGNs accurately.
A deeper understanding of the dusty surrounds of AGNs requires decoding the roles of the circumnuclear tori and the polar dust. High resolution imaging (e.g., Bock et al., 2000; Radomski et al., 2003; Alonso-Herrero et al., 2021) and interferometry (e.g., Hönig et al., 2013; Asmus, 2019; Isbell et al., 2022) of nearby AGNs have established that the mid-infrared emission of many of them is dominated by polar dust often shown to be associated directly with their NLRs, rather than being solely the output of compact ( pc) tori. Extending such studies to a significant number of distant and luminous AGNs is not feasible, but the association of mid-infrared color differences with the relative strength of the forbidden oxygen lines shows that a similar situation holds for them. This association is not predicted at all by traditional torus models.
4.2 Role of the NLR and of Winds
From a study of 4200 type-1 AGNs from SDSS, Zhang et al. (2013) also reported correlations between the mid-IR dust emission strength and optical [O III] emission, in their case both normalized by the AGN bolometric luminosity. They decomposed the [O III] emission profiles into core and wing components and found that the correlations are driven by the wing component rather than the core. However, we find similar or even higher correlation coefficients for the entire [O III] emission line, possibly because we compare the W3 and W4 fluxes with the W2 one, i.e, testing the shape of the mid-IR SED rather than the role of the mid-IR in the total luminosity.
Zhang et al. (2013) concluded that dusty outflows launched near the torus, not the more extended NLR, contribute most of the AGN mid-IR emission. However, observations of nearby AGNs such as NGC 1068 (Bock et al., 2000), NGC 4151 (Radomski et al., 2003), and many more (Alonso-Herrero et al., 2021) show that a substantial fraction of the 10 m emission comes from regions well removed from the nucleus, up to tens of pc for luminous systems. This behavior is consistent with our finding substantial correlations with the integrated oxygen line strengths rather than just the broad components.
Baron & Netzer (2019) also used the [O III] and WISE data to explore the role of winds. Their sample of AGNs was matched closely in narrow [O III] luminosity between cases with only narrow [O III] and those with a significant broad component in the [O III] line profile, indicative of winds. They compare color differences in the WISE bands for these two samples. There is a convincing case for the systems with winds to have stronger emission in W4 (22 m) than those without but mixed results for a stronger excess in W3 (12 m).
Alonso-Herrero et al. (2021) compare high resolution images at 10 m with ALMA images of submm emission by dust and the distribution of CO (3-2). The variety of configurations and overall complexity undermines any universal and simple interpretation. They find in the most extended cases that the 10 m emission has sizes of 50 160 pc, much less than the kpc sizes derived from the models of Baron & Netzer (2019). However, the groundbased data are insensitive to low surface brightness extended source components.
The polar dust emission seen by mid-IR interferometry is on a different scale from the 50 160 pc dusty narrow line regions seen in imaging. However, as pointed out by Lyu & Rieke (2018), this extended dust structure is expected to have a temperature gradient that makes the dust emission size change as a function of the observed wavelength. In fact, a simple SED model featuring diffuse dust distributed over 100 pc scales proposed in the same work matched the observed polar dust sizes at . This argument is illustrated by the GRAVITY (Gravity Collaboration et al., 2020), MATISSE (Gámez Rosas et al., 2022), and imaging Bock et al. (2000) observations of NGC 1068. The first reveals a ring-like structure at K-band (m), the second shows dust emission at –12 mostly consistent with a polar wind, and the third shows extended emission on 100 pc scales to the full extent of the bright forbidden line region seen at 12.5 m and suggests even greater extent at 24.5 m. Further extent at low surface brightness at 12.8 m is also shown by Galliano et al. (2005).
The questions about the interpretation of the extended mid-IR emission should be answered by JWST/MIRI observations, which will obtain images of sufficient resolution and surface brightness sensitivity out through 21 m, thus including the spectral range where, from the work of Baron & Netzer (2019), the wind-associated emission should be brightest.
4.3 Dust Covering Factor vs Luminosity
From comparing AGN IR templates, we can estimate the dust covering factor of the NLR for a typical quasar with a normal IR SED. From the calculations in Lyu et al. (2017); Lyu & Rieke (2017), the ratio of dust emission to the AGN accretion disk luminosity is 0.53 and 0.37 for the normal and WDD templates, respectively. Assuming the WDD template represents the SED of the compact torus and any excess IR emission is from the NLR, this would indicate about 37% and 15% of the accretion disk emission is obscured, i.e. “covered”, by the equatorial torus and the polar NLR dust, respectively. In other words, the torus vs. polar dust emission luminosity is about 2.3:1 for the normal quasar population.
Although there is little evidence for a strong redshift evolution of AGN IR SED behavior, the relative strength of the overall AGN mid-IR emission is commonly found to decrease with source luminosity (e.g., Maiolino et al., 2007; Roseboom et al., 2013). In the past, a so-called receding torus has frequently been invoked to explain this observation (e.g. Lawrence, 1991). It posits that the torus dust is destroyed by the increasing AGN luminosity, resulting in less IR emission. Given the very likely connection between the AGN mid-IR emission and dusty NLR, this behavior is likely to arise instead from the well-established reduction in the NLR prominence with increasing AGN luminosity (e.g., Netzer et al., 2006; Stern & Laor, 2012).
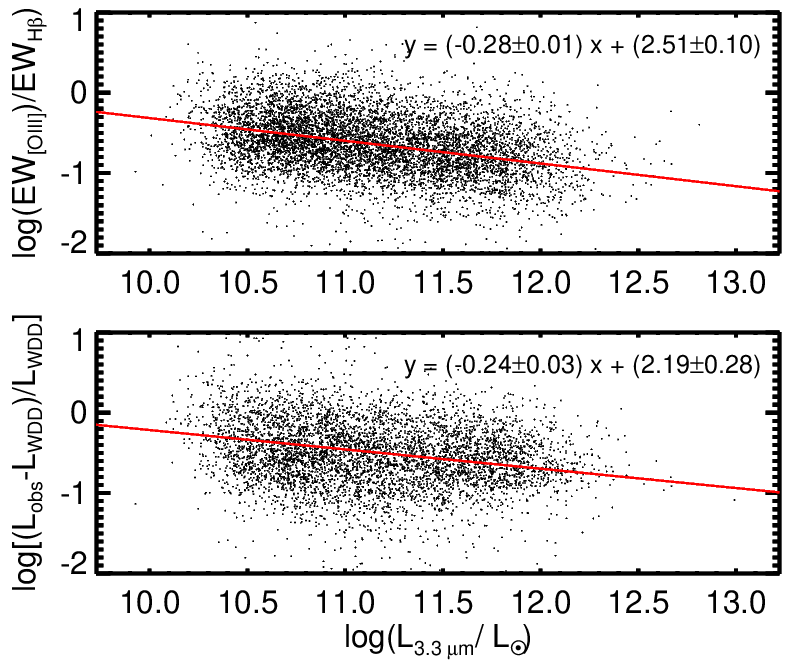
To illustrate this possibility, we present the luminosity dependence of the [O III] relative strength and IR relative excess emission above the WDD template for the SDSS quasar sample in Figure 4. Both parameters show clear negative trends with AGN luminosity with Spearman’s rank correlation coefficient values =0.42 (1e-4) and =0.21 (1e-4), respectively. The Baldwin Effect on [O III]/H is inadequate to account for any significant part of the behavior in the upper panel of the figure (see § 3.3). Fitting these data by linear regression, we find the slopes of the correlations are consistent within uncertainties. In conjunction with the correlations between these two properties shown in Figure 1, this behavior also provides further evidence for the mid-IR emission of lower luminosity AGNs having a substantial component from their NLRs.
5 Summary
We have demonstrated a correlation between the relative strengths of the optical [O III] and mid-IR [O IV] lines and the AGN mid-IR color or SED shape. This indicates that, on average, AGNs with strong forbidden line emission also have a large fraction of emission at emitted by dust in the forbidden line regions. The AGNs with weak forbidden lines have infrared SEDs that drop past 5 m with increasing wavelength in , compared with the flat or rising SEDs on average for those with strong forbidden lines. This difference suggests that the compact circumnuclear torus emits a SED similar to the weak forbidden line case, i.e., as in the warm dust deficient (WDD) template of Lyu et al. (2017). It also implies that 60–70% of the optically-selected blue quasars have a significant level of polar dust emission with a relative contribution at about 50% on average above the WDD template. For a normal quasar with a typical average SED, the fraction of accretion disk UV-optical emission transferred into the infrared is estimated to be 37% and 15% by the equatorial torus and polar dusty NLR, respectively.
We also find that the decrease of the so-called dust covering factor with the increase of AGN luminosity is likely to be a result of the reduction of the forbidden line region rather than a receding torus.
We expect upcoming JWST/MIRI spatially-resolved observations of nearby AGNs to greatly advance our understanding of the extended dust structures surrounding AGNs.
References
- Alonso-Herrero et al. (2021) Alonso-Herrero, A., García-Burillo, S., Hönig, S. F. et al. 2021, A&A, 652, A99, doi = 10.1051/0004-6361/202141219,
- Antonucci (1993) Antonucci, Robert 1993, ARA&A, 31, 473, doi = 10.1146/annurev.aa.31.090193.002353,
- Asmus (2019) Asmus, D. 2019, MNRAS, 489, 2177. doi:10.1093/mnras/stz2289
- Asmus et al. (2015) Asmus, D.,Gandhi, P., Hönig, S. F., Smette, A., & Duschl, W. J. 2015, MNRAS, 454, 766
- Asmus et al. (2016) Asmus, D., Hönig, S. F., & Gandhi, P. 2016, ApJ, 822, 109. doi:10.3847/0004-637X/822/2/109
- Baron & Netzer (2019) Baron, D. & Netzer, H. 2019, MNRAS, 482, 3915. doi:10.1093/mnras/sty2935
- Bock et al. (2000) Bock, J. J., Neugebauer, G., Matthews, K., et al. 2000, AJ, 120, 2904. doi:10.1086/316871
- Boroson & Green (1992) Boroson, Todd A. and Green, Richard F., 1992, ApJS, 80, 109, doi = 10.1086/191661,
- Diamond-Stanic et al. (2009) Diamond-Stanic, Aleksandar M., Rieke, George H., & Rigby, Jane R. 2009, ApJ, 698, 623-631, doi = 10.1088/0004-637X/698/1/623
- Dopita et al. (2002) Dopita, M. A., Groves, B. A., Sutherland, R. S., et al. 2002, ApJ, 572, 753. doi:10.1086/340429
- Elvis et al. (1994) Elvis, Martin, Wilkes, Belinda J., McDowell, Jonathan C. et al. ApJS, 95, 1
- Fritz et al. (2006) Fritz, J., Franceschini, A., & Hatziminaoglou, E. 2006, MNRAS, 366, 767. doi:10.1111/j.1365-2966.2006.09866.x
- Galliano et al. (2005) Galliano, E., Pantin, E., Alloin, D., & Lagage, P. O. 2005, MNRAS, 363, L1
- Gámez Rosas et al. (2022) Gámez Rosas, V., Isbell, J. W., Jaffe, W., et al. 2022, Nature, 602, 403. doi:10.1038/s41586-021-04311-7
- Gordon et al. (2021) Gordon, K. D., Misselt, K. A., Bouwman, J., et al. 2021, ApJ, 916, 33. doi:10.3847/1538-4357/ac00b7
- Gravity Collaboration et al. (2020) Gravity Collaboration, Pfuhl, O., Davies, R., et al. 2020, A&A, 634, A1. doi:10.1051/0004-6361/201936255
- Hao et al. (2005) Hao, L., Strauss, M. A., Tremonti, C. A., et al. 2005, AJ, 129, 1783. doi:10.1086/428485
- Hernán-Caballero & Hatziminaoglou (2011) Hernán-Caballero, A. & Hatziminaoglou, E. 2011, MNRAS, 414, 500. doi:10.1111/j.1365-2966.2011.18413.x
- Hönig (2019) Hönig, S. F. 2019, ApJ, 884, 171. doi:10.3847/1538-4357/ab4591
- Hönig et al. (2013) Hönig, S. F. and Kishimoto, M. and Tristram, K. R. W. et al. 2013, ApJ, 771, 87, doi = 10.1088/0004-637X/771/2/87
- Isbell et al. (2022) Isbell, J.W., Meisenheimer, K., Pott, J.-U. 2022, arXiv:2205.01575
- Kaspi et al. (2005) Kaspi, S., Maoz, D., Netzer, H., et al. 2005, ApJ, 629, 61. doi:10.1086/431275
- Keremedjiev et al. (2009) Keremedjiev, Mark, Hao, Lei, & Charmandaris, Vassilis 2009, ApJ, 690, 1105. doi = 10.1088/0004-637X/690/2/1105,
- Kovačević et al. (2010) Kovačević, J., Popović, L. Č., & Dimitrijević, M. S. 2010, ApJS, 189, 15. doi:10.1088/0067-0049/189/1/15
- Lawrence (1991) Lawrence, A. 1991, MNRAS, 252, 586. doi:10.1093/mnras/252.4.586
- Lebouteiller et al. (2011) Lebouteiller, V., Barry, D. J., Spoon, H. W. W., et al. 2011, ApJS, 196, 8. doi:10.1088/0067-0049/196/1/8
- López-Gonzaga et al. (2016) López-Gonzaga, N., Burtscher, L., Tristram, K. R. W., et al. 2016, A&A, 591, A47. doi:10.1051/0004-6361/201527590
- Lyu et al. (2017) Lyu, J., Rieke, G. H., & Shi, Y. 2017, ApJ, 835, 257. doi:10.3847/1538-4357/835/2/257
- Lyu & Rieke (2017) Lyu, J. & Rieke, G. H. 2017, ApJ, 841, 76. doi:10.3847/1538-4357/aa7051
- Lyu & Rieke (2018) Lyu, J. & Rieke, G. H. 2018, ApJ, 866, 92. doi:10.3847/1538-4357/aae075
- Lyu et al. (2019) Lyu, J., Rieke, G. H., & Smith, P. S. 2019, ApJ, 886, 33. doi:10.3847/1538-4357/ab481d
- Lyu & Rieke (2022) Lyu, J. & Rieke, G. H. 2022, Universe, 8, 304. doi:10.3390/universe8060304
- Maiolino et al. (2007) Maiolino, R., Shemmer, O., Imanishi, M., et al. 2007, A&A, 468, 979. doi:10.1051/0004-6361:20077252
- Malkan et al. (2017) Malkan, Matthew A. and Jensen, Lisbeth D. and Rodriguez, David R. and Spinoglio, Luigi and Rush, Brian 2017, ApJ,c846, 102, doi = 10.3847/1538-4357/aa8302,
- Nenkova et al. (2008) Nenkova, M., Sirocky, M. M., Nikutta, R., et al. 2008, ApJ, 685, 160. doi:10.1086/590483
- Netzer & Laor (1993) Netzer, H. & Laor, A. 1993, ApJ, 404, L51. doi:10.1086/186741
- Netzer et al. (2006) Netzer, H., Mainieri, V., Rosati, P., et al. 2006, A&A, 453, 525. doi:10.1051/0004-6361:20054203
- Netzer (2015) Netzer, H. 2015, ARA&A, 53, 365. doi:10.1146/annurev-astro-082214-122302
- Radomski et al. (2003) Radomski, J. T., Piña, R. K., Packham, C., et al. 2003, ApJ, 587, 117. doi:10.1086/367612
- Rieke & Lebofsky (1985) Rieke, G. H. & Lebofsky, M. J. 1985, ApJ, 288, 618. doi = 10.1086/162827
- Rieke et al. (2009) Rieke, G. H., Alonso-Herrero, A., Weiner, B. J., et al. 2009, ApJ, 692, 556. doi:10.1088/0004-637X/692/1/556
- Roseboom et al. (2013) Roseboom, I. G., Lawrence, A., Elvis, M., et al. 2013, MNRAS, 429, 1494. doi:10.1093/mnras/sts441
- Schmidt & Green (1983) Schmidt, M. & Green, R. F. 1983, ApJ, 269, 352. doi:10.1086/161048
- Shang et al. (2011) Shang, Zhaohui, Brotherton, Michael S., Wills, Beverley J. et al. 2011, ApJS, 196, 1
- Shen et al. (2011) Shen, Y., Richards, G. T., Strauss, M. A., et al. 2011, ApJS, 194, 45. doi:10.1088/0067-0049/194/2/45
- Stalevski et a. (2012) Stalevski, Marko, Fritz, Jacopo, Baes, Maarten, Nakos, Theodoros, & Popović, Luka 2012, MNRAS, 420, 2756, doi = 10.1111/j.1365-2966.2011.19775.x,
- Stern & Laor (2012) Stern, J. & Laor, A. 2012, MNRAS, 426, 2703. doi:10.1111/j.1365-2966.2012.21772.x
- Urry & Padovani (1995) Urry, C. Megan & Padovani, Paolo 1995, PASP, 107, 803 doi = 10.1086/133630
- Wilkes et al. (1999) Wilkes, B. J., Kuraszkiewicz, J., Green, P. J., et al. 1999, ApJ, 513, 76. doi:10.1086/306828
- Zhang et al. (2013) Zhang, K., Wang, T.-G., Yan, L., et al. 2013, ApJ, 768, 22. doi:10.1088/0004-637X/768/1/22