Young Star-Forming Complexes in the Ring
of the S0 galaxy NGC 4324
I.S. Proshina1, A.V. Moiseev2,1, and O.K. Sil’chenko1
Sternberg Astronomical Institute of the Lomonosov Moscow State University, Moscow, Russia1
Special Astrophysical Observatory of the Russian Academy of Sciences, Nizhnij Arkhyz, Russia2
We present the results of our study of starforming regions in the lenticular galaxy NGC 4324. During a complex analysis of multiwavelength observational data – the narrow-band emission-line images obtained with the 2.5-m telescope at the Caucasus Mountain Observatory of the Sternberg Astronomical Institute of the Moscow State University and the archival images in the broad bands of the SDSS, GALEX and WISE surveys – we have detected young starforming complexes (clumps) located in the inner ring of the lenticular galaxy NGC 4324, and we have established a regular pattern of their distribution along the ring, which, nevertheless, changes with time (with age of starforming regions). We suggest several possible evolutionary paths of the lenticular galaxy NGC 4324, of which the accretion of gas-rich satellites or giant clouds (the so-called minor merging) is the most probable one.
Keywords: galactic disks, galactic structure, galactic evolution.
1 INTRODUCTION
Lenticular galaxies, by the definition of this morphological type, are generally believed to be disk galaxies without star formation. A deficit of gas in these early-type galaxies is again traditionally mentioned as being responsible for the absence of star formation in the disks of lenticular galaxies. However, deeper surveys in radio lines have recently shown that, in fact, quite often there is a cold gas in lenticular galaxies, both neutral hydrogen (Sage and Welch 2006; Serra et al. 2012) and molecular gas (Welch and Sage 2003; Welch et al. 2010), that can serve as a fuel for star formation. At the same time, the star formation being observed in some gas-rich lenticular galaxies is usually confined to ring structures (Pogge and Eskridge 1993; Salim et al. 2012) and, probably, may have a different trigger and slightly different physics than does the star formation in the arms of spiral galaxies. There is statistical evidence that the star formation in rings is much more efficient than the star formation in spiral arms (Kormendy and Kennicutt 2004).
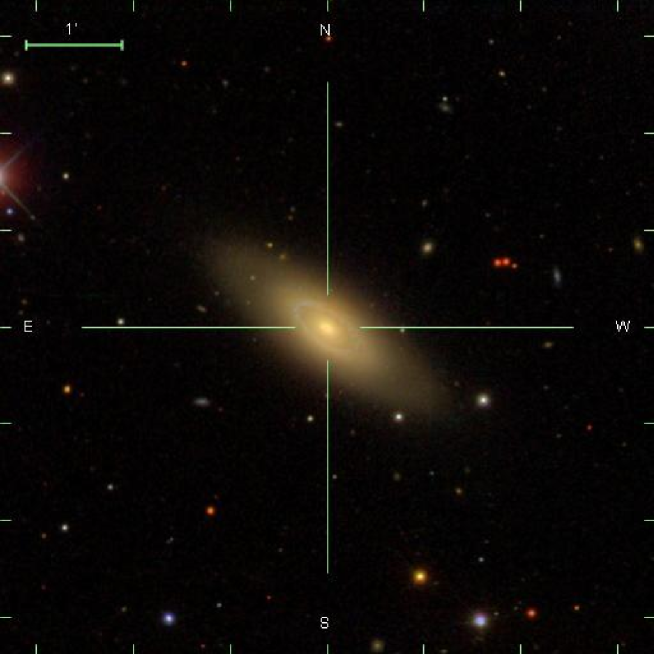
The nearby early-type galaxy NGC 4324 being investigated here is remarkable for its bright blue ring (Fig. 1) embedded in a large-scale stellar disk typical for lenticular galaxies, having a reddish color and without distinct structural features, except the ring. The blue color of the ring points to current or recent star formation within it. The galaxy NGC 4324 was included into the sample of the ATLAS-3D project (Cappellari et al. 2011) and was investigated by means of panoramic spectroscopy. There are also photometric surveys that included NGC 4324. In the ARRAKIS atlas (Comerón et al. 2014), where the ring structures noticeable in the 3.6-m and 4.5-m bands are collected, it is classified as a galaxy with an inner ring, (L)SA(r)0. A bar is suspected when inspecting the image left after the subtraction of the galaxy model constructed from the parameters derived during the decomposition of the image from the S4G survey (Sheth et al. 2010) given in ARRAKIS, although only the ring is pointed out among the distinguished features in the catalogue. However, the presence of a bar in this galaxy is also noted in the HyperLEDA database. According to this database, the galaxy under study is a member of the NGC 4303 group (Garcia 1993). Basic characteristics of the galaxy being investigated are given in Table 1.
| Galaxy | NGC 4324 |
|---|---|
| Morphological type (NED1) | SA(r) |
| (RC32) | 83 |
| (LEDA3) | 12.27m |
| (NED) | –23.43m |
| (LEDA) | 0.92m |
| PAphot (NED) | |
| Inclination iphot (NED) | |
| , km/s (NED) | |
| Distance4, Mpc | 26.2 |
| –19.82m | |
| Metric scale | 127 pc |
| 1NASA/IPAC Extragalactic Database | |
| 2Third Reference Catalogue of Bright Galaxies, de Vaucouleurs et al. (1991) | |
| 3Lyon-Meudon Extragalactic Database | |
| 4Cosmicflow-2, Tully et al.(2013) | |
There is a lot of gas present in this early-type galaxy. For example, an estimate of the molecular hydrogen mass is given in the paper of the ATLAS-3D project by Young et al. (2011): . The maps of the CO distribution and kinematics are shown in the detailed study of the molecular gas within the same project (Alatalo et al. 2013): molecular hydrogen is concentrated in a ring closely following the optically visible ring in morphology and kinematics, and its distribution coincides with the stellar ring and the ionized gas ring. The molecular hydrogen mass in this paper is estimated to be . The coincident kinematic position angles of the lines of nodes of the stellar disk, , the molecular, , and ionized, , gas obtained in ATLAS-3D (Krajnović et al. 2011; Davis et al. 2011a) suggest that the morphology and rotation of the molecular and ionized gas and the stellar disk (in the vicinity of the ring) coincide. The normalized surface brightness profile of the molecular gas emission with its peak at a radius of , almost at the radius of the stellar ring, given the poorer spatial resolution of the CO observations, is shown in Davis et al. (2011b).
The earliest neutral hydrogen mass estimates are given in Krumm and Salpeter (1979) and Giovanardi et al. (1983); they are M⊙ and M⊙, respectively. According to Cortese and Hughes (2009), the galaxy under study contains M⊙ of neutral hydrogen. As regards the distribution of neutral hydrogen in the galaxy, it is reported in Duprie and Schneider (1996) that neutral hydrogen is detected at distances up to two optical radii, i.e., it is distributed over the whole disk and beyond rather than concentrated only in the ring, consistent with the position-velocity map in Hoffman et al. (1989).
It is not surprising that with such amount of gas, with 50–100 million solar masses of H2 being confined to a narrow range in radius, young stars are formed in the ring of the galaxy NGC 4324. We have already studied NGC 4324 spectroscopically: these were observations with a long slit at the South African Large Telescope (SALT) (Proshina et al. 2019) and observations with a scanning Fabry-Perot interferometer at the 6-m BTA telescope (Sil’chenko et al. 2019). Our previous study (Proshina et al. 2019) showed the presence of bright emission lines in the spectrum of this galaxy and nonuniformity of the distribution of starforming sites along the slit; the H intensity peaks at the ring at a distance of from the center. The ring of the galaxy is also excellently seen in the ultraviolet in the data by the GALEX space telescope survey (Bouquin et al. 2018). We decided to investigate the pattern of star formation in the ring of NGC 4324 by combining the GALEX data and our own narrow-band photometric imaging of the galaxy in the ionized gas H emission that characterizes the current star formation rates (SFRs) on a timescale up to 10 Myr. In the next section we describe our observations, then list our results on the characteristics of starforming regions in the ring, and then present a discussion of our results and conclusions.
2 OBSERVATIONS AND DATA ANALYSIS
We decided to take full images of the galaxy NGC 4324 in narrow photometric bands centered on the H and [NII]6583 emission lines with the MaNGaL instrument – a mapper with a tunable filter. A detailed description of the instrument is given in Moiseev et al. (2020). The small bandwidth of the tunable filter, 13 Å, allows an image in each emission line to be taken separately. This, in turn, allows us to compare the fluxes in emission lines and to determine the gas excitation mechanisms based on diagnostic diagrams. The observations were carried out on April 17, 2018, with the 2.5-m telescope at the Caucasus Mountain Observatory (Shatsky et al. 2020). The total exposure time was 1500 s for the H line image, 3000 s for the [NII]6583 line image, and 1500 s for the image in the red continuum adjacent to the lines. The scale of all images was 0.66 arcsec per pixel ( binning); the seeing allowed maps with a spatial resolution of 1.5 arcsec to be constructed. We described the technique for subtracting the continuum images from the narrow-band MaNGaL emission-line data to obtain ”pure” emission-line images, including the calibration of the observed fluxes in energy units and the correction of the images for the overlapping wings of close emission lines due to the finite spectral resolution of the instrument, in Sil’chenko et al. (2020).
In addition, for a more comprehensive analysis of the star formation process we used the ultraviolet (UV) images of the galaxy under study obtained with the GALEX space telescope retrieved from the public Mikulski Archive for Space Telescopes (MAST), and its optical images from SDSS DR9 (Ahn et al. 2012), as well as its image in the W4 band at 22 m obtained with the WISE space telescope from the public NASA/IPAC archive. Table 2 gives the identifiers of the observing programs, the dates of observations, and the exposure times of the UV images of NGC 4324 used by us.
| Band | ProgID | The date of the observations | Exposure time, s |
|---|---|---|---|
| FUV | AIS 228 0001 sg28 | March 31, 2004 | 106.5 |
| NUV | AIS 228 0001 sg27 | March 31, 2004 | 200 |
| NUV | MISGCSN1 13360 0229 | April 1, 2011 | 1739.7 |
| NUV | GI6 001033 GUVICS033 | March 18, 2010 | 1668.2 |
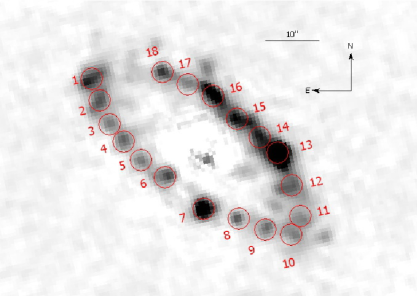
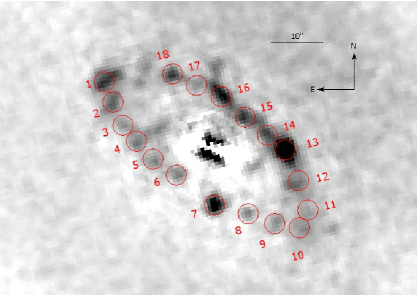
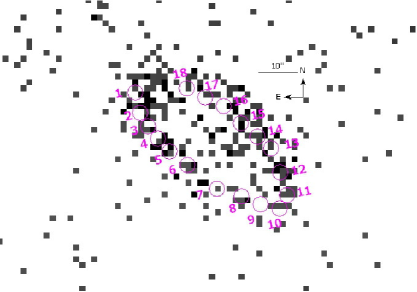
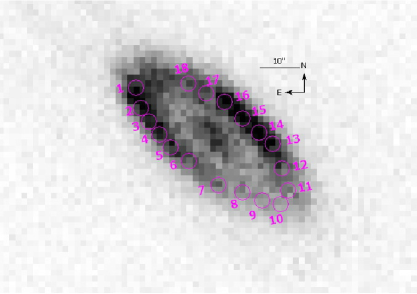
Compact emission-line regions in the ring (clumps) are clearly seen on the H and [NII]6583 intensity maps with the subtracted continuum. The typical size of the clumps turned out to be about , or 0.5 kpc. The emission-line flux was integrated in apertures of such a size. Figure 2 (upper row) shows the galaxy’s images in the narrow H and [NII]6583 emission lines with the apertures centered on the clumps and numbered along the ring. The same apertures were also superimposed on the UV images in the FUV and NUV bands and on the WISE/W4 image. The fluxes of the clumps were measured in the specified apertures. For the UV images the fluxes were converted to magnitudes using the calibration equations from Morrissey et al. (2007). The derived magnitudes were corrected for dust absorption in our Galaxy using the photometric calibrations from the NED ( for NGC 4324). The UV fluxes were corrected for intrinsic absorption in the galaxy using the infrared dust radiation estimates based on the WISE/W4 data.
3 THE RESULTS
3.1 The gas excitation diagnostics
Table 3 gives the measured emission-line fluxes and metallicity estimates for the ionized gas in the regions where we detect the dominant contribution of star formation to the gas excitation. The emission-line ratio [NII]6583/H was corrected for the overlapping of the line wings in the MaNGaL band, according to the calibration by Moiseev et al. (2020).
| No. | Flux in H, | (H), | EW (H), | |||
|---|---|---|---|---|---|---|
| erg/s/cm2 | erg/s/kpc2 | Å | Pettini, Pagel(2004) | Marino(2013) | ||
| 1 | 3.60E-15 | 1.69E+39 | ||||
| 2 | 2.74E-15 | 1.32E+39 | ||||
| 3 | 1.94E-15 | 1.05E+39 | ||||
| 4 | 2.17E-15 | 1.16E+39 | ||||
| 5 | 1.99E-15 | 1.09E+39 | ||||
| 6 | 2.66E-15 | 1.36E+39 | ||||
| 7 | 5.34E-15 | 2.41E+39 | 8.62 | 8.51 | ||
| 8 | 1.87E-15 | 1.00E+39 | ||||
| 9 | 2.20E-15 | 1.10E+39 | 8.66 | 8.55 | ||
| 10 | 2.05E-15 | 0.96E+39 | ||||
| 11 | 2.18E-15 | 1.04E+39 | 8.67 | 8.55 | ||
| 12 | 2.99E-15 | 1.43E+39 | ||||
| 13 | 1.44E-14 | 5.97E+39 | 8.59 | 8.49 | ||
| 14 | 4.07E-15 | 1.91E+39 | 8.67 | 8.55 | ||
| 15 | 3.94E-15 | 1.91E+39 | 8.66 | 8.55 | ||
| 16 | 4.66E-15 | 2.14E+39 | 8.65 | 8.54 | ||
| 17 | 1.89E-15 | 1.05E+39 | ||||
| 18 | 2.58E-15 | 1.30E+39 | ||||
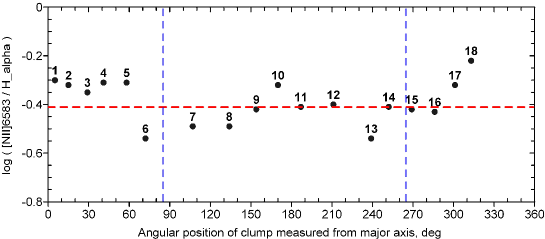
There are several methods by which the gas excitation mechanism can be determined. The first criterion involves the diagnostic diagrams proposed by Baldwin et al. (1981), the so-called BPT diagrams, which allow the mechanisms of gas excitation by shock waves or active nuclei to be separated from the excitation by UV radiation from young OB stars based on emission-line intensity ratios. By using the model calculations of these diagrams from Kewley et al. (2006), we adopted the threshold value of below which the gas may be considered as being excited exclusively by radiation from young stars. At the same time, we adopt in the ring, according to the measurement of the longslit spectrum of NGC 4324 in our previous paper (Proshina et al. 2019). Another criterion proposed by Zhang et al. (2017) is related to the H surface brightness at which the emission is assumed to be produced by the gas ionization by radiation from young stars: erg s-1 kpc-2. Yet another criterion for the identification of starforming regions is related to the equivalent width of the H emission line. For example, Binette et al. (1994) and Cid Fernandes et al. (2011) suggested a threshold value of EW(H) = 3 Å; values below 3 Å may be produced by diffuse ionized gas (DIG) regions. However, Lacerda et al. (2018) suggested a different threshold value of EW(H), 14 Å. The ambiguity of this criterion stems from the fact that in the case of projecting the starforming regions onto a bright underlying structure (for example, when the starforming regions are not far from a galactic bulge), the contribution of this underlying structure should be taken into account, that reduces the reliability of assigning the measured emission-line equivalent widths precisely to the distinguished gas emission region. In the case of our galaxy, the ring of NGC 4324 is the inner one, with a radius kpc, and, therefore, the contribution of the underlying stellar population of the galaxy should be taken into account, which we did. For confident identification of the clumps with regions of current star formation we apply all three criteria.
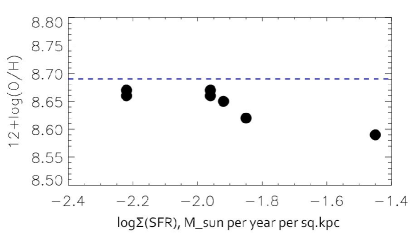
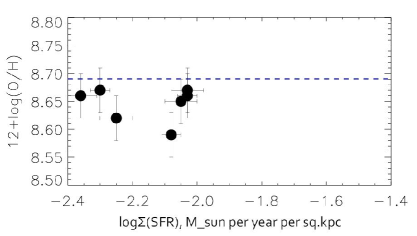
It is for the clumps, where the gas is excited by young stars, that we can estimate the gas metallicity from the ratio of the fluxes in the [NII]6583 and H emission lines using, for comparison, two calibrations from Pettini and Pagel (2004) and Marino et al. (2013). Figure 3 shows how the gas metallicity changes from the clump to the clump with their SFR. When considering the ”instantaneous” SFR determined from the H flux, this dependence for SFRs above yr-1 kpc-2 is the inverse one. When averaging the SFRs on a timescale of hundreds Myr, using the NUV-flux indicator, this anticorrelation is washed out. This can be probably explained by a short duration of local starbursts: as the chemical evolution in the clump advances, the gas is locally depleted, while the gas metallicity reaches saturation (Ascasibar et al. 2015). The solar metallicity is the final point of the chemical evolution: the gas metallicity reaches a plateau near the solar value, when the density of the young stellar population begins to exceed locally the gas density (Ascasibar et al. 2015). Note that the clumps with a low SFR in Fig. 3 do not fall on the extension of the above dependence. Most likely, the reason is that, in fact, the emission of these clumps is largely produced by shock processes, and these clumps were attributed to the starforming ones formally, because their H surface brightness exceeds only marginally the critical value of erg s-1 kpc-2 suggested by Zhang et al. (2017).
3.2 Star formation rate estimates
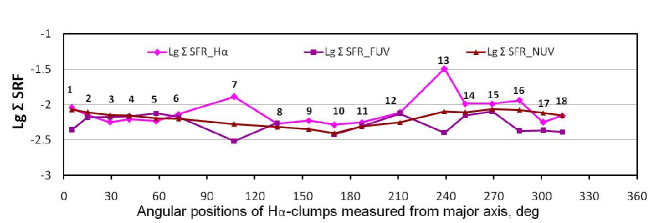
The SFRs used to construct the dependence in Fig. 3 were calculated from the fluxes that we have measured based on the MaNGaL map in the H emission line; the calibration of SFR through H is from the review by Kennicutt and Evans (2012). The H fluxes were corrected for the intrinsic dust absorption in the galaxy; to make the correction for dust, we used the galaxy’s image taken with the WISE space telescope in the W4-band (22 m) and retrieved by us in the open NASA/IPAC archive. The H emission is a star formation tracer on a short timescale which does not exceed 10 Myr. The review by Kennicutt and Evans (2012) also provides the calibrations to calculate the SFRs from the measured UV fluxes, which are SFR tracers on longer timescales – from 100 to 200 Myr. We carried out these calculations using the FUV and NUV images of NGC 4324 from the GALEX space telescope (also by taking into account the UV dust absorption in the galaxy under study using the WISE image in the W4-band). The SFR estimates obtained through the NUV fluxes from three observing programs (AIS, MIS, and GI) are quite consistent; the availability of three independent measurements in the NUV band allows us both to calculate the mean values and to estimate the errors of the derived SFRs. The plot of the SFR density variation along the ring of NGC 4324 (Fig. 4) turns out to be very curious: a drop in the SFR surface density derived from the FUV flux is observed just where intense star formation from the flux in the H emission line is now observed (clumps 7 and 13). According to the remark by Calzetti (2013), this is typical for a very short timescale, when the star formation lasts at present no more than 2 Myr. In this case, the estimates obtained from the UV fluxes based on the calibrations by Kennicutt and Evans (2012) should be multiplied by a factor of 3.45. Thus, we conclude that the starbursts in these clumps have begun quite recently (within 10 Myr). The stars that could be formed during a previous starburst (200 Myr ago) cannot contribute now to the FUV luminosity having already exploded, or their luminosity peak has now shifted to the NUV, leading to the observed dip in the FUV (clumps 7, 13, 16, 17, 18, 1). It is worth noting that the curve tracing the SFRs calculated from the NUV flux is almost horizontal and, therefore, this indicator, the NUV data, is better to determine the mean SFR along the ring. It can be assumed that the star formation began first in clumps 2-3-4, then in 5-6, 14-15, and 8-12, subsequently in 16-17-18-1, then in the clump 7 and in the clump 13 – the most recent starburst (possibly a recurrent one, 200 Myr after the previous one).
3.3 Orientation of the Gaseous Disk of NGC 4324 from the Ionized Gas Rotation Velocity Field
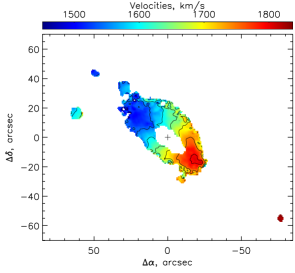
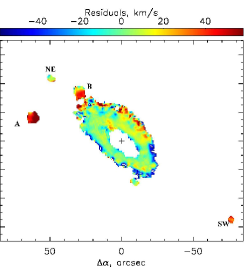

In our previous paper (Sil’chenko et al. 2019) we presented, among the data for a sample of 18 lenticular galaxies, our panoramic spectroscopy for NGC 4324 in the H emission line obtained with a scanning Fabry-Perot interferometer of the 6-m telescope of the Special Astrophysical Observatory. A more detailed analysis of the data presented now in Fig. 5 has shown that the gas is mostly involved in circular rotation being confined to a plane inclined to our line of sight at an angle of and with a line of nodes oriented in the sky at a position angle of (the radial range for our analysis is ). This inclination, in principle, is consistent with the inclination estimated from our isophotal analysis for the inner galactic stellar disk (Proshina et al. 2019), , as it must be in the case of circular gas rotation in the main stellar disk plane. However, emission-line clumps whose velocities differ significantly, up to 70 km s-1, from the model of extrapolated circular rotation with a flat curve V(R), are visible in the outer disk regions and in the immediate vicinity of the galaxy. Below in the Discussion we will use these data to justify the hypothesis of external gas accretion onto NGC 4324.
3.4 Regularity of the Distribution of Clumps along the Ring
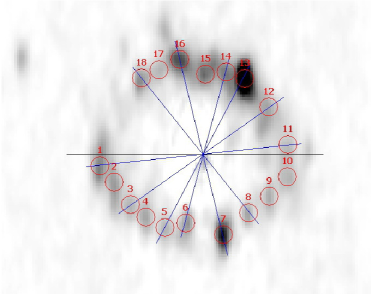
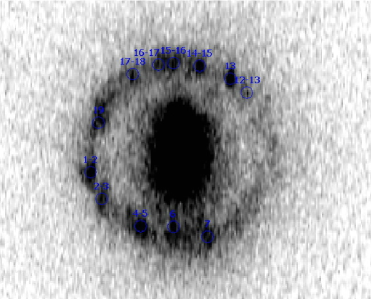
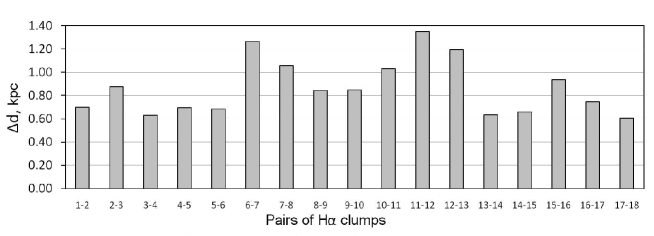
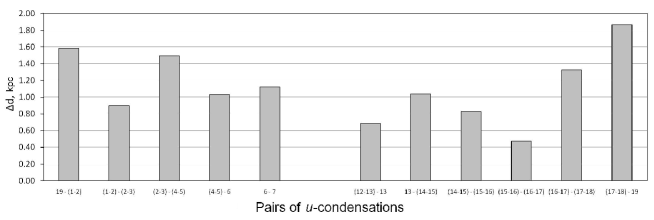
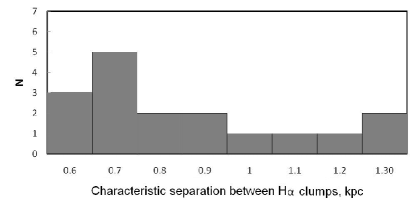
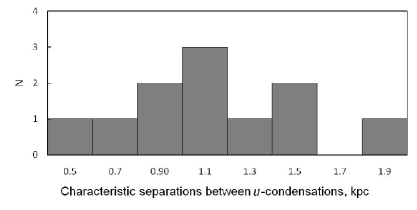
To estimate the characteristic separation between the clumps in the H emission line and between young star complexes in the -band, we deprojected the MaNGaL image of the galaxy in the H and the SDSS image in the -band. For this purpose, we rotated the original images to put the line of nodes along the horizontal direction, and then stretched them vertically by adopting the inclination , in accordance with the kinematic inclination derived by analyzing the two-dimensional ionized gas velocity field measured with the Fabry-Perot interferometer. We applied the same orientation angles to deproject both images, because the ionized gas observed by us lies in the same plane as do the stars – this is suggested by the consistent kinematics of the gas and stars revealed by us through our spectroscopic long-slit observations (Proshina et al. 2019). Figure 6 shows the deprojected images of NGC 4324 in the H emission line and in the -band and the separations between the centers of the adjacent clumps extracted from these images. In the deprojected H image it can be clearly seen that the gaseous ring under study is intrinsically elliptical, which is typical for resonance rings (Buta 1995), with the resonance rings being predominantly elongated perpendicular to the bar – the so-called R1-type ring. An interesting manifestation of symmetry is that the localization of the starforming regions in the ring is pairwise, a half-turn of the galaxy apart (in Fig. 6, left, these pairs are connected by the straight-line segments). Is this a manifestation of the dynamical impact of the bar on the gas compression in the ring and the onset of star formation in the clumps? Figure 7 presents the distributions of clump separations. For the image that records the star formation just begun (the map in the H emission line), the separations between clumps are grouped to one value, 0.65 – 0.7 kpc; the second maximum of the histogram (near 1.3 kpc) probably corresponds to the double characteristic separation, or to a ”missed” clump. On the -band map corresponding to ”older” starforming regions this regularity disappears.
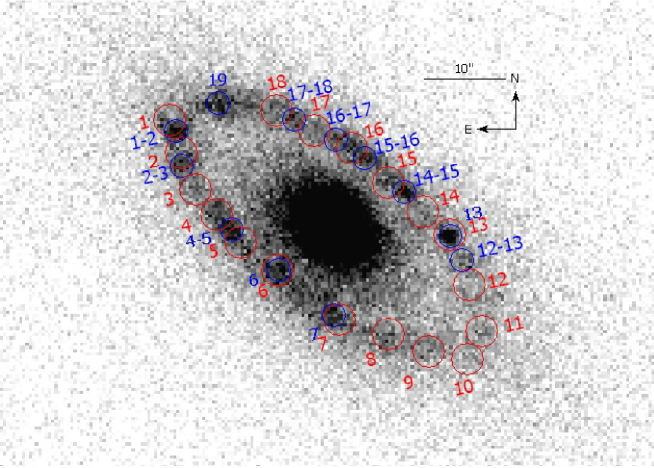
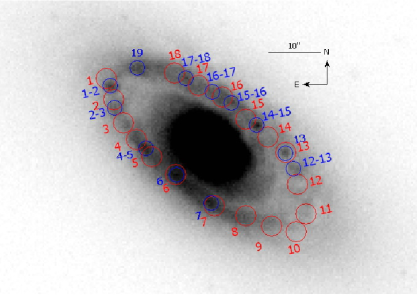
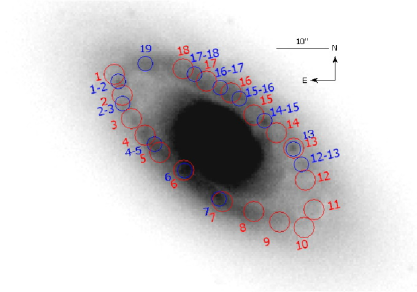
Figures 8 and 9 show the SDSS images of the galaxy in the , , and bands with the positions of the clumps found the -band image (blue circles) and in the H image (red circles) superposed on them. The clumps visible in the -band are basically well-matured complexes of star clusters. It can be seen that only clumps 6, 7, and 13 coincide on the H and -band maps. Many of the star complexes, which are bright in the continuum, are visible in the gaps between H clumps, for example, 1-2, 4-5, 12-13, 14-15, 15-16, 16-17, and 17-18; or at some offset from them, for example, complex 2-3; while complex 19, which has no analog in the narrow-band H and [NII]6583 images, is clearly seen in the images in both blue broad-band and filters. Recall that the most characteristic separation between H clumps found by us above is 0.7 kpc, while the characteristic separation between star complexes in the -band is 1.05 and 1.5 kpc (Fig. 7). All of this taken together points to triggered star formation that occurs when the walls of the giant HI shells around young star complexes collide (Efremov and Elmegreen 1998; Egorov et al. 2015). Since the characteristic separation between clumps is different for different wavelengths and since the ”visibility” of starforming regions at different wavelengths is related to their age (the youngest ones are clearly seen in the H emission line, the middle-aged ones are seen in the UV, and after 1–2 Gyr we see the complexes to be bright in and ), there is the propagation of star formation along the ring that leads to a change in the characteristic separations between starforming complexes with time, as demonstrated by the histograms in Fig. 7. We cannot present an analogous histogram for the middle-aged starforming regions, because the GALEX space telescope observations in the NUV band had a spatial resolution of , which exceeds the sizes of the clumps and is comparable to the expected separations between them in the UV. Thus, in the GALEX data the structure of the starforming ring is washed out.
4 DISCUSSION AND CONCLUSIONS
Previously, a regular distribution of starforming regions has already been noted in the linear structures of disk galaxies. It is typical, for example, for tidal tails of interacting galaxies (Sotnikova and Reshetnikov 1998). It can be also encountered in spiral arms of galaxies (Efremov 2010; Gusev and Efremov 2013; Elmegreen et al. 2018). For instance, Efremov (2010) reported on star complexes having 0.6 kpc in size distributed like a chain along the north-western arm of the Andromeda galaxy with a typical spacing of 1.1 kpc, which, according to the author, reflects a regularity in the distribution of magnetic field lines. While investigating the regular chains of starforming complexes in the grand-design spiral galaxy NGC 628, Gusev and Efremov (2013) revealed characteristic separations between complexes that are a multiple of 0.4 kpc. Elmegreen et al. (2018) detected a regularity in the distribution of infrared clumps along filaments with a characteristic separation of 0.41 kpc in the dusty spiral galaxy M 100. In their recent paper, Gusev and Shimanovskaya (2020) noted such a regularity in the distribution of starforming regions along the resonance ring of the barred spiral galaxy NGC 6217 with a characteristic separation between star complexes of 0.7 kpc. It is reported in the same paper that this is the first case when a regularity in the distribution of starforming regions is observed in ring structures. Now we see that this case is not unique. The ring in NGC 4324 may also be a resonance one: although no large-scale bar is seen in the galaxy, our isophotal analysis (Proshina et al. 2019), in particular, the jump in the ellipticity of isophotes at a radius of , points to a triaxial structure of the central part of the galaxy elongated approximately along the minor axis of the isophotes. The regularity in the distribution of starforming complexes in the ring of NGC 4324 suggests that the physical star formation mechanisms over local scales are the same in spiral and lenticular galaxies, while the differences arise when we start the analysis of large-scale structures: in spiral galaxies the major star formation occurs in spiral density waves, while in gas-rich lenticular galaxies it is organized into ring structures (Pogge and Eskridge 1993; Salim et al. 2012).
Since we definitely diagnose current and recent star formation in the ring of this lenticular galaxy and since the characteristic distance between the centers of clumps is 0.67 kpc, we can probably relate this size with the scale of inhomogeneities during the development of a gravitational instability which leads also to star formation. It is of interest to estimate the critical gas surface density and to compare it with the observed one. It is found from theoretical calculations (Ledoux 1951) that the perturbations with the following wavelengths are unstable:
| (1) |
where is the epicyclic frequency. From the ionized gas rotation curve calculated by us (Fig. 5), which is close to the circular velocity within the galactic potential due to the collisional nature of the gaseous subsystem, we see that the galaxy rotates rigidly up to the outer edge of the ring, . Under the assumption of rigid rotation, we obtain s-1 in the ring. Taking kpc, from Eq. (1) we then obtain pc-2. Let us now calculate the observed molecular gas surface density in the ring by assuming, according to Alatalo et al. (2013), that the radial extent of the ring does not exceed and :
Since the observed gas surface density is found to be lower than its critical value and since we still observe star formation in the ring, this implies that, first, apart from the molecular gas, there is neutral hydrogen in the ring which we neglected in our calculations due to the lack of information about its quantitative content precisely in the ring, and, second, some additional factors leading to a gravitational instability and the onset of star formation are in action. One of the additional factors may be the so-called feedback from starforming regions, namely, gas compression by the giant gaseous shells expanding away from the starforming regions. It is also interesting that the parts of the ring where the ionized gas emission-line clumps show excitation by young stars are close in their azimuthal position to the ends of the oval structure (Fig. 10). Such a configuration may be associated with the so-called ansae, i.e., the regions of enhanced brightness at the ends of the bar. Although it is pointed out in the study by Martinez-Valpuesta et al. (2007) that current star formation proceeds very rarely in ansae, but for example, in NGC 4151, which, as NGC 4324, has no bar, but has an oval at the center, the ansae exhibit the blue colour and the H emission line.
We can estimate the mass of the star complexes using the SDSS images in the and bands as well as the mass-to-light calibrations from Bell et al. (2003). Since the ring is the inner one, the contribution of the underlying disk should be taken into account in the aperture photometry of the starforming regions. For example, clump 13 is, in our view, the most suitable object for estimating the mass by the method described above, because this clump is the youngest and the most compact, as it was seen from the above analysis. We measured the fluxes in the and bands, converted them to magnitudes, and corrected them for the extinction in our Galaxy using the extinction coefficients from the NED for the SDSS photometric bands: and . For the clump 13 the colour was found to be . Next, using Table 7 from Bell et al. (2003), we determine the ratio and the mass of the young star complex of . Several more largest clumps (7, 1-2, 14-15) also have a stellar mass of . Such a mass of the star complexes is consistent with their size of 0.5 kpc while considering the gravitational instability of a gas (Cowie 1981).
The problem on the origin of the gas observed in the ring of this galaxy remains open: whether it is the gas that was returned by evolved stars of the galaxy or it has an accretional (external) origin. The consistent kinematics of the stellar and gaseous components argues for the first assumption. The mechanisms for the transfer of evolved gas from the galactic center to the periphery are considered in Marinacci et al. (2010). As regards the interaction with the environment, in the paper by Morales et al. (2018), which is devoted to searching for tidal features in nearby galaxies, NGC 4324 was assigned to the galaxies in which no such features were detected. However, there is also another variant of accretion – minor mergers. If a gas-rich satellite of the galaxy had an orbital spin aligned with its rotation and if it fell in the plane of the stellar disk of NGC 4324, then this pattern of motion of the satellite could lead to gas accumulation in the disk of the galaxy under study without any apparent signatures of interaction. The inflowing gas is accumulated in the ring having a resonant nature associated with the rotation of the triaxial structure at the galactic center (whose presence is suggested by the circumstantial evidence given above). Moreover our additional analysis of the gas line-of-sight velocity map in the H line from Sil’chenko et al. (2019) presented above shows the presence of HII regions located far from the ring and rotating in the same plane and with velocities that more or less correspond to the galactic rotation at these radii. Our long-slit spectroscopic study (Proshina et al. 2019) showed clumps of emission in the H and [N II] lines at great distances from the center, up to 12 kpc, with the gas velocities lying on a ”plateau”, i.e., coinciding with the velocity of the main galactic disk. At the same time, deviations from the circular flat-disk rotation model are also observed for three of the four outer HII regions that do not lie on the major axis of the isophotes (Fig. 5, middle). This most likely points to some inclination of the outer orbits of gaseous clouds – to a warp of the gaseous disk probably associated with the capture of material from a plane that is not exactly coplanar with the stellar disk. Among the outer H regions, region A (Fig. 5) is also seen in the continuum in the galaxy’s blue images from SDSS with an absolute magnitude ; it is probably an irregular gas-rich satellite of NGC 4324. According to our MaNGaL data, the nitrogen to H line ratio allows the oxygen abundance in the gas to be estimated: with the calibrations from Pettini and Pagel (2004) and Marino et al. (2013) this estimate is , i.e., half the solar one and lower than the estimates for the outer NE and SW HII regions belonging to the galactic disk ().
All these observational evidences confirm the hypothesis about the possible feeding of the disk in the lenticular galaxy with gas through the infall of gas-rich satellites and/or giant clouds. This aligned pattern of accretion of the satellites contributes to the star formation in the accreted gas, as was noted previously in Sil’chenko et al. (2019). Clumps are formed in the ring due to the gravitational instability, in which star formation ignits. The subsequent star formation triggers in the gaseous ring are probably the shock waves from evolving complexes of massive OB stars – the first formed clusters of young stars in the gaseous clumps. In addition, the infall of a satellite or a giant gas cloud onto the galactic disk can serve as a trigger of another starburst. Thus, the chain of ”gaseous clumps – star complexes” observed by us is a chain of the propagation of star formation both in space (in the ring) and in time. To clarify the question about the origin of the gas, we need a detailed mapping of NGC 4324 in the 21-cm HI line for both the galaxy itself and its environment.
5 ACKNOWLEDGMENTS
The study of the star-forming rings in S0 galaxies was supported by the Russian Foundation for Basic Research (project no. 18-02-00094). O.K. Sil’chenko also thanks the Interdisciplinary Scientific and Educational School of the Moscow State University ”Fundamental and Applied Space Research”. In our work we used data from the NASA/IPAC Extragalactic Database (NED) operated by the Jet Propulsion Laboratory of the California Institute of Technology under contract with NASA and data the Lyon–Meudon HyperLEDA database. For our analysis we also invoked data from the GALEX and WISE space telescopes. The NASA GALEX data were taken from the Mikulski Archive for Space Telescopes (MAST). The WISE data used by us were taken from the NASA/IPAC archive operated by the Jet Propulsion Laboratory of the California Institute of Technology under contract with the National Aeronautics and Space Administration.
References
- [1] C. P. Ahn, R. Alexandroff, C. Allende Prieto, S. F. Anderson, T. Anderton, B. H. Andrews, E. Aubourg, S. Bailey, et al., ApJ Suppl. Ser. 203, Aid.21 (2012).
- [2] K. Alatalo, T. A. Davis, M. Bureau, et al., MNRAS 432, 1796 (2013).
- [3] Y. Ascasibar, M. Gavilán, M. Pinto, et al., MNRAS 448, 2126 (2015)
- [4] J. A. Baldwin, M. M. Phillips, R. Terlevich, PASP 93, 5 (1981)
- [5] E. F. Bell, D. H. McIntosh, N. Katz, M. D. Weinberg, ApJ Suppl. Ser. 149, 289 (2003)
- [6] L. Binette, C. G. Magris, G. Stasińska, A. G. Bruzual, A& A 292, 13 (1994)
- [7] A. Y. K. Bouquin, A. Gil de Paz, J. C. Munoz Mateos, et al., ApJ Suppl. Ser. 234, Aid.18 (2018)
- [8] R. Buta, ApJ Suppl. Ser. 96, 39 (1995)
- [9] D. Calzetti, In: Secular Evolution of Galaxies, Eds. J. Falcon-Barroso and J. H. Knapen, Cambridge, UK: Cambridge Univ. Press, p. 419 (2013)
- [10] M. Cappellari, E. Emsellem, D. Krajnovic, R. M. McDermid, N. Scott, G. A. Verdoes Kleijn, L. M. Young, K. Alatalo, et al., MNRAS 413, 813 (2011)
- [11] R. Cid Fernandes, G. Stasińska, A. Mateus, N. Vale Asari, MNRAS 413, 1687 (2011)
- [12] S. Comerón, H. Salo, E. Laurikainen, et al., A& A 562, A121 (2014)
- [13] L. Cortese, T. M. Hughes, MNRAS 400, 1225 (2009)
- [14] L. L. Cowie, ApJ 245, 66 (1981)
- [15] T. A. Davis, M. Bureau, L. M. Young, K. Alatalo, L. Blitz, M. Cappellari, N. Scott, et al., MNRAS 414, 968 (2011a).
- [16] T. A. Davis, K. Alatalo, M. Sarzi, M. Bureau, L. M. Young, L. Blitz, P. Serra, A. F. Crocker, et al., MNRAS 417, 882 (2011b).
- [17] T. A. Davis, K. Alatalo, M. Bureau, M. Cappellari, N. Scott, L. M. Young, L. Blitz, et al., MNRAS 429, 534 (2013).
- [18] K. Duprie, S. Schneider, AJ112, 937 (1996)
- [19] Yu. N. Efremov, MNRAS 405, 1531 (2010)
- [20] Yu. N. Efremov, B. G. Elmegreen, MNRAS 299, 643 (1998)
- [21] O. V. Egorov, T. A. Lozinskaya, A. V. Moiseev, Astron. Astrophys. Trans. 29, 17 (2015)
- [22] B. G. Elmegreen, D. M. Elmegreen, Yu. N. Efremov, ApJ 863, Aid.59 (2018)
- [23] A. M. Garcia, A& A Suppl. 100, 47 (1993)
- [24] C. Giovanardi, G. Helou, E. E. Salpeter, N. Krumm, ApJ 267, 35 (1983)
- [25] A. S. Gusev, Yu. N. Efremov, MNRAS 434, 313 (2013)
- [26] A. S. Gusev, E. V. Shimanovskaya, A& A 640, L7 (2020)
- [27] G. L. Hoffman, B. M. Lewis, G. Helou, et al., ApJ Suppl. Ser. 69, 65 (1989)
- [28] R. C. Kennicutt Jr., N. J. Evans II, Ann. Rev. Astron. Astrophys. 50, 531 (2012)
- [29] L. J. Kewley, B. Groves, R. Kauffmann, T. Heckman, MNRAS 372, 961 (2006)
- [30] J. Kormendy, R. C. Kennicutt Jr., Ann. Rev. Astron. Astrophys. 42, 603 (2004)
- [31] D. Krajnović, E. Emsellem, M. Cappellari, et al., MNRAS 414, 2923 (2011)
- [32] N. Krumm, E. E. Salpeter, ApJ 228, 64 (1979)
- [33] E. A. D. Lacerda, R. Cid Fernandes, G. S. Couto, et al., MNRAS 474, 3727 (2018)
- [34] P. Ledoux, Annales d’Astrophysique 14, 438 (1951)
- [35] F. Marinacci, J. Binney, F. Fraternali, C. Nipoti, L. Ciotti, P. Londrillo, MNRAS 404, 1464 (2010)
- [36] R. A. Marino, F. F. Rosales-Ortega, S. F. Sańchez, et al., A& A 559, A114 (2013)
- [37] I. Martinez-Valpuesta, J. H. Knapen, R. Buta, AJ 134, 1863 (2007)
- [38] A. Moiseev, A. Perepelitsyn, and D. Oparin, Experimental Astronomy 50, 199 (2020)
- [39] G. Morales, D. Martinez-Delgado, E. K. Grebel, A. P. Cooper, B. Javanmardi, A. Miskolczi, A& A 614, A143 (2018)
- [40] P. Morrissey, T. Conrow, T. A. Barlow, et al., ApJ Suppl. Ser. 173, 682 (2007)
- [41] M. Pettini, B. E. J. Pagel, MNRAS 348, L59 (2004)
- [42] R. W. Pogge, P. B. Eskridge, AJ 106, 1405 (1993)
- [43] I. S. Proshina, A. Yu. Kniazev, O. K. Sil’chenko, AJ 158, 5 (2019)
- [44] L. J. Sage, G. A. Welch, ApJ 644, 850 (2006)
- [45] S. Salim, J. J. Fang, R. M. Rich, et al., ApJ 755, Aid.105 (2012)
- [46] P. Serra, T. Oosterloo, R. Morganti, et al., MNRAS 422, 1835 (2012)
- [47] N. Shatsky, A. Belinski, A. Dodin, et al., In: Ground-Based Astronomy in Russia. 21st Century, p.127 (2020)
- [48] K. Sheth, M. Regan, J. L. Hinz, et al., PASP 122, 1397 (2010)
- [49] O. K. Sil’chenko, A. V. Moiseev, and O. V. Egorov, ApJ Suppl. Ser. 244, Aid. 6 (2019)
- [50] O. K. Sil’chenko, A. V. Moiseev, and D. V. Oparin, Astronomy Letters 46, 289 (2020)
- [51] N. Ya. Sotnikova, V. P. Reshetnikov, Astronomy Letters 24, 73 (1998)
- [52] R. B. Tully, H. M. Courtois, A. E. Dolphin, et al., AJ 146, Aid.86 (2013)
- [53] G. de Vaucouleurs, A. de Vaucouleurs, H. G. Corwin, Jr., et al., Third Reference Catalogue of Bright Galaxies. Volume I: Explanations and References. New York: Springer (1991)
- [54] G. A. Welch, L. J. Sage, ApJ 584, 260 (2003)
- [55] G. A. Welch, L. J. Sage, L. M. Young, ApJ 725, 100 (2010)
- [56] L. M. Young, M. Bureau, T. A. Davis, F. Combes, R. M. McDermid, K. Alatalo, L. Blitz, M. Bois, et al., MNRAS 414, 940 (2011)
- [57] K. Zhang, R. Yan, K. Bundy, et al., MNRAS 466, 3217 (2017)