Present address: ]University of Manchester. Schuster Building. M13 9PL, United KingdomPresent address: ]LPNHE, Sorbonne Université, Université de Paris, CNRS/IN2P3, 75005 Paris, FrancePresent address: ]Hassan II University, Faculty of Sciences, Aïn Chock, BP 5366 Maarif, Casablanca 20100, MoroccoPresent address: ]Univ. Bordeaux, CNRS, LP2i Bordeaux, UMR 5797, F-33170 Gradignan, FrancePresent address: ]University of California, Department of Physics, Berkeley, CA 94720-7300, USA and Lawrence Berkeley National Laboratory, Berkeley, CA 94720-8153, USA
Stereo Collaboration
Interpreting Reactor Antineutrino Anomalies with Stereo data
Abstract
Anomalies in past neutrino measurements have led to the discovery that these particles have non-zero mass and oscillate between their three flavors when they propagate. In the 2010’s, similar anomalies observed in the antineutrino spectra emitted by nuclear reactors have triggered the hypothesis of the existence of a supplementary neutrino state that would be sterile i.e. not interacting via the weak interaction [1]. The Stereo experiment [2, 3, 4, 5, 6] was designed to study this scientific case that would potentially extend the Standard Model of Particle Physics. Here we present a complete study based on our full set of data with significantly improved sensitivity. Installed at the ILL (Institut Laue Langevin) research reactor, Stereo has accurately measured the antineutrino energy spectrum associated to the fission of 235U. This measurement confirms the anomalies whereas, thanks to the segmentation of the Stereo detector and its very short mean distance to the core (10 m), the same data reject the hypothesis of a light sterile neutrino. Such a direct measurement of the antineutrino energy spectrum suggests instead that biases in the nuclear experimental data used for the predictions [7, 8] are at the origin of the anomalies. Our result supports the neutrino content of the Standard Model and establishes a new reference for the 235U antineutrino energy spectrum. We anticipate that this result will allow to progress towards finer tests of the fundamental properties of neutrinos but also to benchmark models and nuclear data of interest for reactor physics [9, 10] and for observations of astrophysical or geo-neutrinos [11, 12].
Introduction
Reactor antineutrinos have played an important role in the history of neutrino physics contributing to the discovery of that particle in 1956 [13]. They are produced after the fission process during the beta-decay of fission fragments. Thus, intense antineutrino fluxes with a known flavour are produced by nuclear reactors, allowing to study precisely their properties. The increased accuracy in both prediction and measurements has paved the way for the study of neutrino oscillations with essential results in the determination of mass splitting and mixing angles [14, 15, 16, 17] that define the frequency and amplitude of such oscillations. A major advance in this field was the measurement of total beta spectra associated with the fission of 235U , 239Pu and 241Pu performed in the 1980s [18, 19, 20]. The shape of these spectra was measured with a magnetic spectrometer [21] and the absolute normalisation determined by neutron capture reactions on gold and lead targets replacing the fissile isotopes for the calibration of the apparatus. A numerical procedure was then defined to convert these beta spectra into antineutrino spectra [22] which served as a reference for decades. In 2011, a re-evaluation of this procedure, called the ”Huber-Mueller” model (HM) [7, 8] led to two ”Reactor Antineutrino Anomalies” (RAA) in the comparison with data: the measured antineutrino rates were about 6% below predictions on average [1] and a shape distortion was observed by experiments at power reactors in the form of a ”bump” between 5 and 6 MeV with an amplitude of about 10% [15, 16, 17, 23]. The disappearance of reactor antineutrinos as a function of their distance travelled from the reactor being the expected manifestation of an oscillation phenomenon, it was proposed that a new, fast oscillation towards an additional neutrino could explain the RAA deficit. From the existing constraints on the electroweak sector of the Standard Model [24], this neutrino must be sterile, i.e. not coupling with the weak interaction; to be compatible with previous neutrino data its mass would be expected in the 1 eV range [1]. The mixing of fission electron antineutrinos with a sterile neutrino state of such a mass can be approximately described by the two-flavor oscillation formula
| (1) |
with the amplitude of the mixing, the square mass splitting between sterile and standard neutrino states, the distance between the emission and detection vertices and the energy of the antineutrino.
The Stereo experiment
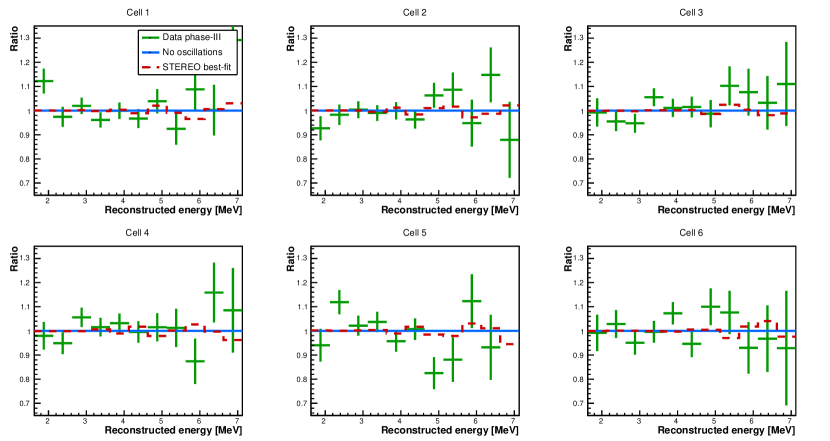
The Stereo detector was installed in 2016 at the ILL high-flux research reactor in Grenoble. From Eq.1, a coupling with an 1-eV sterile neutrino would result in spectral distortions over a few metres, as a function of the distance to the reactor core. This phenomenon is exploited by the segmentation of the target volume of Stereo into 6 identical cells (Figure 1). The sterile neutrino hypothesis is thus tested by the comparison of the 6 measured spectra, independent of any prediction of the emitted spectrum.
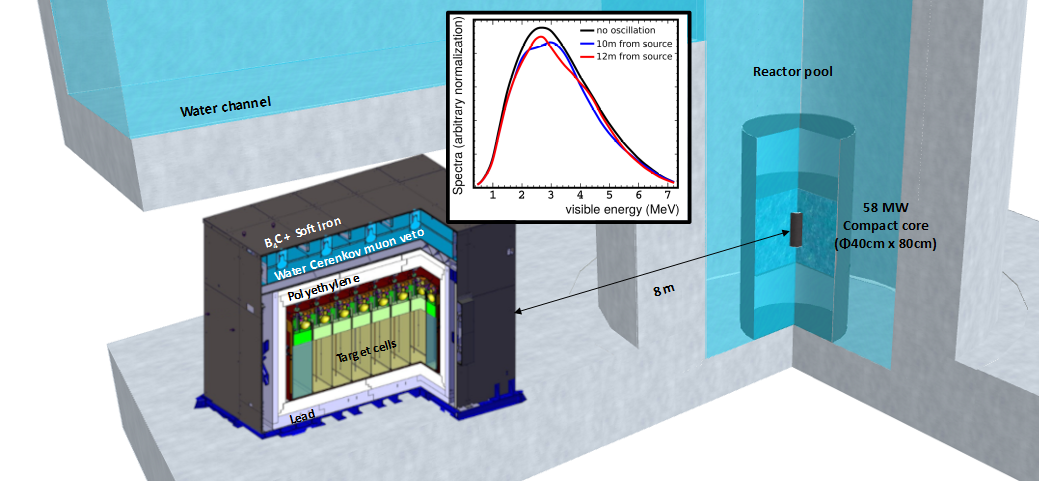
Antineutrinos are detected via the inverse beta decay (IBD) described by , with a mature technology of Gadolinium-loaded liquid scintillator [27]. The kinetic and annihilation energies deposited in the liquid by the positron form a prompt signal followed by the delayed signal of the neutron capture on gadolinium (17 s mean capture time) and its subsequent de-excitation -cascade of 8 MeV total energy.
With a mean reactor power of 52.76 0.77 MW during the Stereo lifetime, the average rate of detected antineutrinos after all the selection cuts (see Methods section) is 394/day. For the Stereo experiment exposed to cosmic rays at the Earth surface and surrounded by other experiments using the ILL neutron beams, background rejection is a major challenge. Therefore, heavy lead and polyethylene shielding, distributed in the walls of the casemate and in the support structure around the detector, isolate the target volume from external and neutron fluxes. Active rejection of the dominant cosmic ray background is also implemented: the top of the detector is covered by a muon veto and the pulse shape discrimination (PSD) capabilities of the liquid scintillator are exploited. The latter allows to reject the signals of fast neutrons coming from the interaction of cosmic rays around the detector. The combination of all these techniques brings the residual rate of accepted cosmic background events comparable to that of the antineutrinos. It is then precisely measured and subtracted thanks to the alternation of 50 days reactor cycles with nuclear fuel reloading or maintenance periods.
This ”ON-OFF” subtraction implies a very precise control of the detector response throughout the whole data taking period. For this purpose, all the reactor and detector parameters are continuously monitored in order to correct for instabilities. Weekly calibration campaigns correct the slow drifts of the detector response and the same procedure of energy reconstruction is applied to the data and the simulation, which is a key tool to describe this response. In order to mitigate long-term effects the parameters of the simulation are fine-tuned to match calibration data at central dates of each of the two major data collection phases. Thus detection systematic uncertainties could be reduced down to the 1% level (cf. Extended Data Fig. 2 and Methods section).
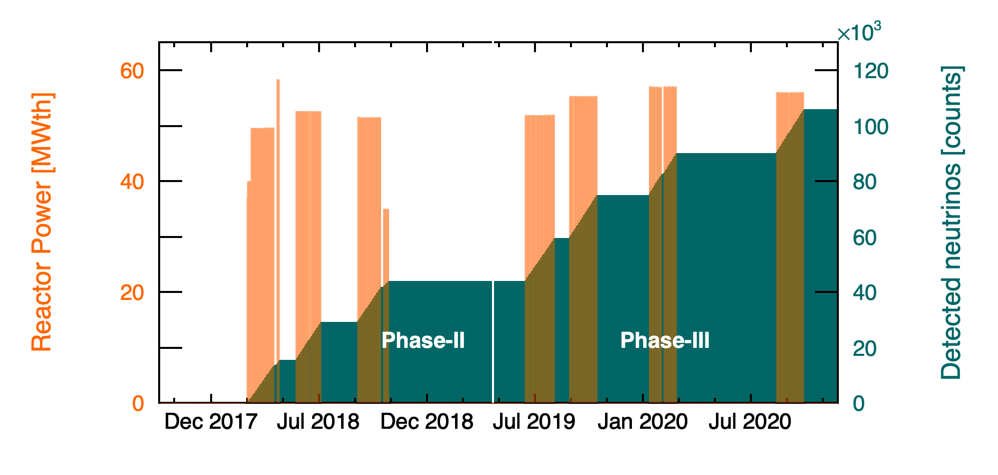
Here we present the Stereo results based on 107558 antineutrinos detected from October 2017 until the experiment was shut down in November 2020. This period gathers all the high quality data collected after the repair of detector defects in summer 2017 [4]. It corresponds to 273 reactor-ON days and 520 reactor OFF days, divided in two main data taking periods labelled as phase-II and phase-III (Extended Data Fig. 1).
Rejection of the sterile neutrino hypothesis
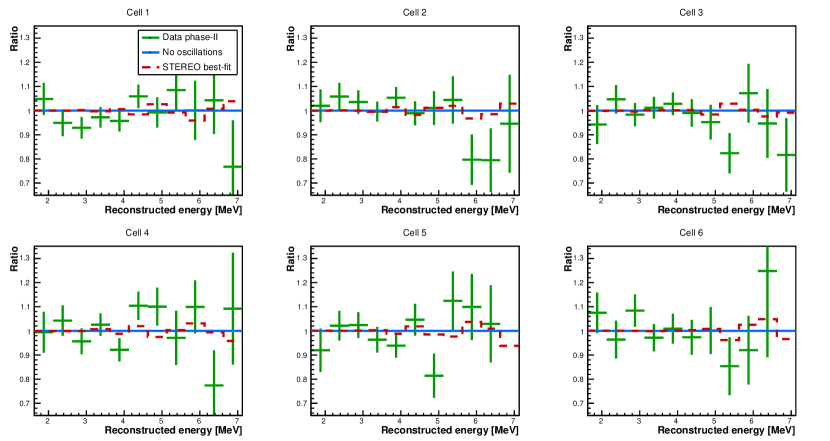
The discrepancies between the predicted and observed antineutrino spectra render difficult the choice of an external oscillation-free reference spectrum for the sterile neutrino search. Thus, to realise a prediction-independent sterile neutrino search, in Stereo we leverage the significant dependence with the distance of the induced oscillation pattern for our baseline range (roughly 9 to 11 m). The different hypotheses for the parameters of the sterile neutrino were tested by comparing the 6 independent antineutrino spectra recorded from the 6 cells to a common model where all experimental systematic uncertainties are propagated. We adopt a profile approach and use as a test statistic the difference between the minimum (where all but the parameters are left free in the fit), and the global minimum (where the sterile neutrino parameters have also been optimised). Since Wilk’s theorem conditions are not met [28], we follow Feldman and Cousins’ prescription [29] and compute the distributions for each hypothesis using pseudo-experiments. When the p-value for the observed data given the hypothesis is , we exclude the corresponding point in the parameter space at the 95% Confidence Level (CL).
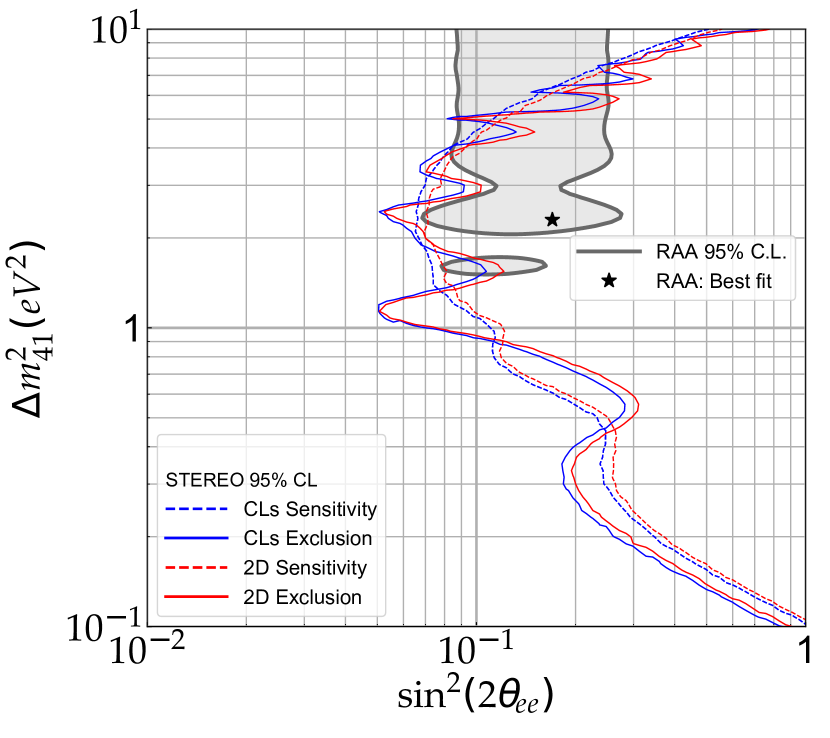
Our analysis excludes a large fraction of the parameter space favoured by the RAA at 95% CL or greater (see Figure 2). Additionally, we find that the best-fit points of the oscillation signals reported by the Neutrino-4 [31] and the Neos-Reno [32] collaborations are excluded with significances of 3.3 and 2.8, respectively. We also observe that our data are compatible with the no oscillation hypothesis with a p-value of 0.52. Thus, a few eV mass sterile neutrino explanation to the Reactor Antineutrino Anomaly is ruled out by Stereo data. Other experiments reach the same conclusion [33, 34].
Interest in the high region (short wavelength oscillation) has been renewed recently by the results of the BEST experiment [35], which confirm the Gallium anomaly. Sensitivity in this part of the parameter space is limited for Stereo due to the baseline ranges of our setup. Such sterile neutrino mass values are however in strong tension with Cosmic Microwave Background analyses [36], and will be probed by the KATRIN experiment [37].
Reference Uranium-235 antineutrino spectrum
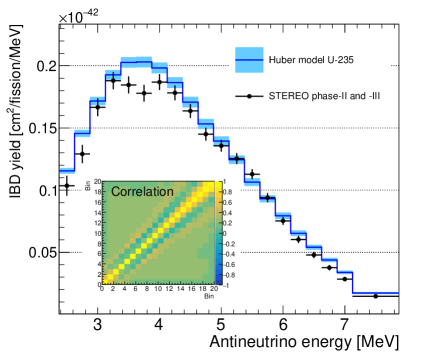
The precise control of the detector response [4] combined with a good precision on the reactor power [5] allows to extend Stereo ’s analysis to study the shape and absolute normalisation of the antineutrino spectrum. The highly enriched 235U fuel (HEU) used at ILL gives access to the antineutrino spectrum emitted by the fission of this single isotope, complementary to commercial reactors whose low enriched fuel (LEU) induces fission fractions distribution between 235U , 239Pu , 238U and 241Pu . As the 6 single-cell spectra are compatible with each other, the analysis of the antineutrino spectrum is performed by combining the selection of events in the 6 cells of the target volume. A spectrum is thus obtained as a function of the reconstructed energy deposited in the scintillator by the positron. However we provide a reference spectrum directly usable by the community by using a procedure to deconvolute the energy spectrum from the response of the detector. The method is based on a fit of the spectrum in antineutrino energy to the spectrum in reconstructed positron energy through the detector response matrix, the latter being derived from the Monte-Carlo simulation of the detector. The statistical fluctuations and the finite energy resolution of the detector induce numerical instabilities in this procedure. They are regularized by a Tikhonov type approach [6, 38]. Biases of the method are encoded in a filter matrix provided in [39]; applying this filter matrix to a spectrum prediction ensures ensures an unbiased comparison with the unfolded Stereo spectrum, shown in Figure 3.a. This spectrum corresponds to the largest sample of pure 235U fission antineutrinos from a single experiment to date. The details of the systematic uncertainties relevant for this analysis are given in the Methods section.
| a | b |
|---|---|
 |
 |
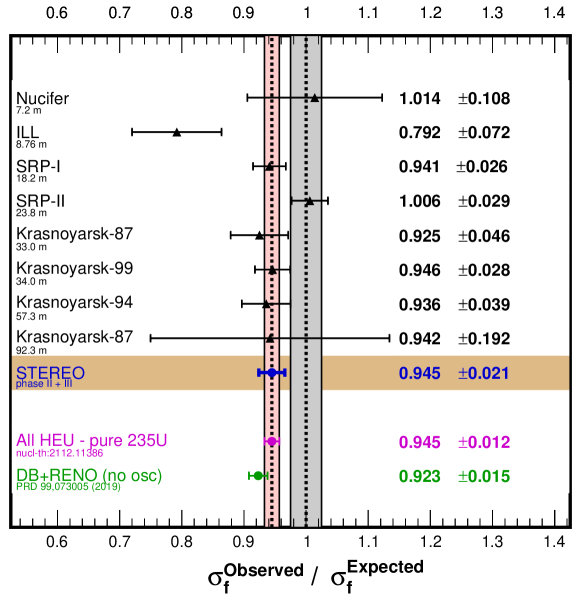
A specificity of Stereo is to control the absolute normalization of the measurement. Thus the integral of the spectrum provides the most precise measurement of the production of antineutrinos by the fission of 235U from a HEU reactor. It shows a deficit of % compared to the HM model, in excellent agreement with the world average (Extended Data Fig. 10), and confirms the prominent role of 235U in the RAA.
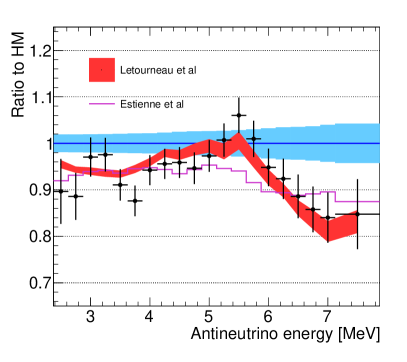
Beyond this global deficit, the Stereo measurement also clearly highlights a spectral distortion compared to the HM model (Figure 3.b) that cannot be explained by an oscillation. There is thus a strong tension between this prediction, derived from the conversion of the total beta spectrum from 235U fissions and that of the measured total antineutrino spectrum. A much better agreement with the Stereo results is obtained by the most recent summation models [9, 10]. Such approach, complementary to the conversion (HM) method, builds a prediction with the sum of the antineutrino spectra of all fission products taken from the nuclear databases (Figure 3.b). A key ingredient of these models is the correction of the beta strengths involved in the decay of fission products. Experimentally it is difficult to measure beta transitions to the highly excited levels of the daughter nucleus, because of the high density of states and the complex gamma cascades that are associated [42]. This results in a well-known bias in nuclear databases that tend to underestimate the contribution of low energy beta transitions. It seems that correcting this bias is a key element in bringing the summation models into agreement with the Stereo results [10].
Impact and Outlook
The Stereo experiment provides the most accurate measurement to date of the antineutrino spectrum from pure 235U fission, corrected for the detector response. It is intended to be used by the particle physics community as a reference spectrum for future high precision reactor experiments, such as the determination of the mass hierarchy of neutrinos [43] or the low-energy tests of the Standard Model with the since recently accessible process of Coherent Elastic Neutrino-Nucleus Scattering [44]. Observations of astrophysical [11] or geo-neutrinos [12] consider reactor antineutrinos as a background source and would also benefit from an improved description of their flux. For these purposes, all the results as well as the elements necessary to reproduce them are made publicly available [39].
We find significant deviation in normalisation and shape with respect to the HM prediction while at the same time we reject with high confidence level the hypothesis of a sterile neutrino of mass around 1 eV. Our findings support the conclusions of a recent global analysis of all neutrino data collected at reactors [45], which points to a normalisation bias in the beta spectrum from 235U fission on which the HM prediction is anchored as the most likely explanation for the overall deficit. The involved nuclear data (neutron capture on lead and associated electron conversion) are being questioned. A recent direct measurement of the ratio of 235U to 239Pu fission beta spectra [46], found to be 5% lower than the ratio of the initial beta spectra [19, 20], supports this hypothesis.
The comparison of our reference 235U spectrum with the most recent summation models illustrates a paradigm shift where a direct measurement of fission antineutrino spectra such as that of Stereo becomes a benchmark for nuclear data. Beyond its relevance for fundamental physics of neutrinos, this measurement of the total antineutrino spectrum from 235U has the potential to constrain the evaluated fission data with, in particular, a sensitivity to the fission yields [47, 48] and to the description of the beta transitions of fission products [9, 10]. Our reference spectrum as well as the associated gain in reliability and accuracy of the nuclear data finds direct applications in the operation and surveillance of reactors [49, 50].
References
- Mention et al. [2011] G. Mention, M. Fechner, T. Lasserre, T. A. Mueller, D. Lhuillier, M. Cribier, and A. Letourneau, The Reactor Antineutrino Anomaly, Phys. Rev. D 83, 073006 (2011), arXiv:1101.2755 [hep-ex] .
- Allemandou et al. [2018] N. Allemandou et al. (STEREO), The STEREO Experiment, JINST 13 (07), P07009, arXiv:1804.09052 [physics.ins-det] .
- H. Almazán et al. [2018] H. Almazán et al. (STEREO Collaboration), Sterile neutrino constraints from the stereo experiment with 66 days of reactor-on data, Phys. Rev. Lett. 121, 161801 (2018), arXiv:1806.02096 [hep-ex] .
- Almazán et al. [2020a] H. Almazán et al. (STEREO), Improved sterile neutrino constraints from the STEREO experiment with 179 days of reactor-on data, Phys. Rev. D 102, 052002 (2020a), arXiv:1912.06582 [hep-ex] .
- Almazán et al. [2020b] H. Almazán et al. (STEREO), Accurate Measurement of the Electron Antineutrino Yield of 235U Fissions from the STEREO Experiment with 119 Days of Reactor-On Data, Phys. Rev. Lett. 125, 201801 (2020b), arXiv:2004.04075 [hep-ex] .
- Almazán et al. [2021] H. Almazán et al. (STEREO), First antineutrino energy spectrum from 235U fissions with the STEREO detector at ILL, J. Phys. G 48, 075107 (2021), arXiv:2010.01876 [hep-ex] .
- Mueller et al. [2011] T. A. Mueller et al., Improved Predictions of Reactor Antineutrino Spectra, Phys. Rev. C 83, 054615 (2011), arXiv:1101.2663 [hep-ex] .
- Huber [2011] P. Huber, On the determination of anti-neutrino spectra from nuclear reactors, Phys. Rev. C 84, 024617 (2011), [Erratum: Phys.Rev.C 85, 029901 (2012)], arXiv:1106.0687 [hep-ph] .
- Estienne et al. [2019] M. Estienne et al., Updated Summation Model: An Improved Agreement with the Daya Bay Antineutrino Fluxes, Phys. Rev. Lett. 123, 022502 (2019), arXiv:1904.09358 [nucl-ex] .
- Letourneau et al. [2022] A. Letourneau et al., On the origin of the reactor antineutrino anomalies in light of a new summation model with parameterized beta transitions, (2022), arXiv:2205.14954 [hep-ph] .
- Lagage [1985] P. O. Lagage, Nuclear power stations as a background source for antineutrino astronomy, Nature 316, 420 (1985).
- Leyton et al. [2017] M. Leyton, S. Dye, and J. Monroe, Exploring the hidden interior of the Earth with directional neutrino measurements, Nat. Commun. 8, 15989 (2017).
- Cowan et al. [1956] C. L. Cowan, F. Reines, F. B. Harrison, H. W. Kruse, and A. D. McGuire, Detection of the free neutrino: A Confirmation, Science 124, 103 (1956).
- Abe et al. [2008] S. Abe et al. (KamLAND), Precision Measurement of Neutrino Oscillation Parameters with KamLAND, Phys. Rev. Lett. 100, 221803 (2008), arXiv:0801.4589 [hep-ex] .
- de Kerret et al. [2020] H. de Kerret et al. (Double Chooz), Double Chooz measurement via total neutron capture detection, Nature Phys. 16, 558 (2020), arXiv:1901.09445 [hep-ex] .
- An et al. [2017] F. P. An et al. (Daya Bay), Measurement of electron antineutrino oscillation based on 1230 days of operation of the Daya Bay experiment, Phys. Rev. D 95, 072006 (2017), arXiv:1610.04802 [hep-ex] .
- Bak et al. [2018] G. Bak et al. (RENO), Measurement of Reactor Antineutrino Oscillation Amplitude and Frequency at RENO, Phys. Rev. Lett. 121, 201801 (2018), arXiv:1806.00248 [hep-ex] .
- Von Feilitzsch et al. [1982] F. Von Feilitzsch, A. A. Hahn, and K. Schreckenbach, EXPERIMENTAL BETA SPECTRA FROM PU-239 AND U-235 THERMAL NEUTRON FISSION PRODUCTS AND THEIR CORRELATED ANTI-NEUTRINOS SPECTRA, Phys. Lett. B 118, 162 (1982).
- Schreckenbach et al. [1985] K. Schreckenbach, G. Colvin, W. Gelletly, and F. Von Feilitzsch, DETERMINATION OF THE ANTI-NEUTRINO SPECTRUM FROM U-235 THERMAL NEUTRON FISSION PRODUCTS UP TO 9.5-MEV, Phys. Lett. B 160, 325 (1985).
- Hahn et al. [1989] A. A. Hahn, K. Schreckenbach, G. Colvin, B. Krusche, W. Gelletly, and F. Von Feilitzsch, Anti-neutrino Spectra From 241Pu and 239Pu Thermal Neutron Fission Products, Phys. Lett. B 218, 365 (1989).
- Mampe et al. [1978] W. Mampe, K. Schreckenbach, P. Jeuch, B. Maier, F. Braumandl, J. Larysz, and T. von Egidy, The double focusing iron-core electron-spectrometer ”BILL” for high resolution (n, e-) measurements at the high flux reactor in Grenoble, Nuclear Instruments and Methods 154, 127 (1978).
- Vogel [2007] P. Vogel, Conversion of electron spectrum associated with fission into the antineutrino spectrum, Phys. Rev. C 76, 025504 (2007), arXiv:0708.0556 [hep-ph] .
- Ko et al. [2017] Y. J. Ko et al. (NEOS), Sterile Neutrino Search at the NEOS Experiment, Phys. Rev. Lett. 118, 121802 (2017), arXiv:1610.05134 [hep-ex] .
- Schael et al. [2006] S. Schael et al. (ALEPH, DELPHI, L3, OPAL, SLD, LEP Electroweak Working Group, SLD Electroweak Group, SLD Heavy Flavour Group), Precision electroweak measurements on the resonance, Phys. Rept. 427, 257 (2006), arXiv:hep-ex/0509008 .
- de Gouvêa [2016] A. de Gouvêa, Neutrino mass models, Annual Review of Nuclear and Particle Science 66, 197 (2016), https://doi.org/10.1146/annurev-nucl-102115-044600 .
- Abazajian et al. [2006] K. N. Abazajian et al., Light Sterile Neutrinos: A White Paper, (2006), arXiv:hep-ex/1204.5379 .
- Buck et al. [2019] C. Buck, B. Gramlich, M. Lindner, C. Roca, and S. Schoppmann, Production and Properties of the Liquid Scintillators used in the Stereo Reactor Neutrino Experiment, JINST 14 (01), P01027, arXiv:1812.02998 [physics.ins-det] .
- Neumair and Agostini [2020] B. Neumair and M. Agostini, Statistical methods in sterile neutrino experiments, J. Phys. Conf. Ser. 1468, 012175 (2020).
- Feldman and Cousins [1998] G. J. Feldman and R. D. Cousins, A Unified approach to the classical statistical analysis of small signals, Phys. Rev. D 57, 3873 (1998), arXiv:physics/9711021 .
- Qian et al. [2016] X. Qian, A. Tan, J. J. Ling, Y. Nakajima, and C. Zhang, The Gaussian CLs method for searches of new physics, Nucl. Instrum. Meth. A 827, 63 (2016), arXiv:1407.5052 [hep-ex] .
- Serebrov et al. [2021] A. P. Serebrov, R. M. Samoilov, V. G. Ivochkin, A. K. Fomin, V. G. Zinoviev, P. V. Neustroev, V. L. Golovtsov, S. S. Volkov, A. V. Chernyj, O. M. Zherebtsov, M. E. Chaikovskii, A. L. Petelin, A. L. Izhutov, A. A. Tuzov, S. A. Sazontov, M. O. Gromov, V. V. Afanasiev, M. E. Zaytsev, A. A. Gerasimov, and V. V. Fedorov, Search for sterile neutrinos with the neutrino-4 experiment and measurement results, Phys. Rev. D 104, 032003 (2021).
- Atif et al. [2022] Z. Atif et al. (RENO, NEOS), Search for sterile neutrino oscillations using RENO and NEOS data, Phys. Rev. D 105, L111101 (2022), arXiv:2011.00896 [hep-ex] .
- Andriamirado et al. [2021] M. Andriamirado et al. (PROSPECT Collaboration), Improved short-baseline neutrino oscillation search and energy spectrum measurement with the PROSPECT experiment at HFIR, Phys. Rev. D 103, 032001 (2021).
- Alekseev and Skrobova [2022] I. G. Alekseev and N. Skrobova, Recent results of the DANSS experiment, PoS NuFact2021, 143 (2022).
- Barinov et al. [2022] V. V. Barinov et al., Results from the Baksan Experiment on Sterile Transitions (BEST), Phys. Rev. Lett. 128, 232501 (2022), arXiv:2109.11482 [nucl-ex] .
- Aghanim et al. [2020] N. Aghanim et al. (Planck), Planck 2018 results. VI. Cosmological parameters, Astron. Astrophys. 641, A6 (2020), [Erratum: Astron.Astrophys. 652, C4 (2021)], arXiv:1807.06209 [astro-ph.CO] .
- Aker et al. [2022] M. Aker et al. (KATRIN), Improved eV-scale sterile-neutrino constraints from the second KATRIN measurement campaign, Phys. Rev. D 105, 072004 (2022), arXiv:2201.11593 [hep-ex] .
- Almazán et al. [2022] H. Almazán et al. (Stereo, Prospect), Joint Measurement of the 235U Antineutrino Spectrum by Prospect and Stereo, Phys. Rev. Lett. 128, 081802 (2022), arXiv:2107.03371 [nucl-ex] .
- [39] Supplementary materials, available under this link.
- Strumia and Vissani [2003] A. Strumia and F. Vissani, Precise quasielastic neutrino/nucleon cross-section, Physics Letters B 564, 42 (2003), arXiv:astro-ph/0302055 .
- McCutchan [2022] E. McCutchan, Evaluated Nuclear Structure Data File, https://www.nndc.bnl.gov/ensdf/ (2022).
- Hardy et al. [1977] J. Hardy, L. Carraz, B. Jonson, and P. Hansen, The essential decay of pandemonium: A demonstration of errors in complex beta-decay schemes, Physics Letters B 71, 307 (1977).
- An et al. [2016] F. An et al. (JUNO), Neutrino Physics with JUNO, J. Phys. G 43, 030401 (2016), arXiv:1507.05613 [physics.ins-det] .
- Abdullah et al. [2022] M. Abdullah et al., Coherent elastic neutrino-nucleus scattering: Terrestrial and astrophysical applications, in 2022 Snowmass Summer Study (2022) arXiv:2203.07361 [hep-ph] .
- Akindele et al. [2022] O. A. Akindele et al. (CONNIE, CHILLAX, CONUS), High Energy Physics Opportunities Using Reactor Antineutrinos, in 2022 Snowmass Summer Study (2022) arXiv:2203.07214 [hep-ex] .
- Kopeikin et al. [2021] V. Kopeikin, M. Skorokhvatov, and O. Titov, Reevaluating reactor antineutrino spectra with new measurements of the ratio between U235 and Pu239 spectra, Phys. Rev. D 104, L071301 (2021), arXiv:2103.01684 [nucl-ex] .
- Sonzogni et al. [2016] A. A. Sonzogni, E. A. McCutchan, T. D. Johnson, and P. Dimitriou, Effects of Fission Yield Data in the Calculation of Antineutrino Spectra for U235(n,fission) at Thermal and Fast Neutron Energies, Phys. Rev. Lett. 116, 132502 (2016).
- Hayes et al. [2015] A. C. Hayes, J. L. Friar, G. T. Garvey, D. Ibeling, G. Jungman, T. Kawano, and R. W. Mills, Possible origins and implications of the shoulder in reactor neutrino spectra, Phys. Rev. D 92, 033015 (2015), arXiv:1506.00583 [nucl-th] .
- Bowden et al. [2007] N. S. Bowden et al., Experimental results from an antineutrino detector for cooperative monitoring of nuclear reactors, Nucl. Instrum. Meth. A 572, 985 (2007), arXiv:physics/0612152 .
- Boireau et al. [2016] G. Boireau et al. (NUCIFER), Online Monitoring of the Osiris Reactor with the Nucifer Neutrino Detector, Phys. Rev. D 93, 112006 (2016), arXiv:1509.05610 [physics.ins-det] .
- Agostinelli et al. [2003] S. Agostinelli et al., Geant4—a simulation toolkit, Nucl. Instr. Meth. Phys. Res. A 506, 250 (2003).
- [52] X. Mougeot, Betashape: A new code for improved analytical calculations of beta spectra, EPJ Web Conf., 146 (2017).
- Mention et al. [2017] G. Mention, M. Vivier, J. Gaffiot, T. Lasserre, A. Letourneau, and T. Materna, Reactor antineutrino shoulder explained by energy scale nonlinearities?, Phys. Lett. B 773, 307 (2017), arXiv:1705.09434 [hep-ex] .
- Litaize et al. [2015] O. Litaize, O. Serot, and L. Berge, Fission modelling with FIFRELIN, Eur. Phys. J. A 51, 177 (2015).
- Almazán et al. [2019] H. Almazán et al. (STEREO), Improved STEREO simulation with a new gamma ray spectrum of excited gadolinium isotopes using FIFRELIN, The European Physical Journal A 55, 183 (2019), arXiv:1905.11967 .
- H. Almazán et al. [2022] H. Almazán et al. (STEREO Collaboration), Improved FIFRELIN de-excitation model for neutrino applications, arXiv:2207.10918 [hep-ex] (2022).
- [57] L.-R. Labit, Very short baseline neutrino oscillations study with the STEREO detector at ILL; calibration of the STEREO detector, PhD thesis, Université Savoie Mont Blanc, 2021.
Methods
Data taking
The Stereo experiment has taken data from November 2016 to November 2020. In the first phase of the experiment (Nov. 2016 - Feb. 2017) the response of the detector was affected by several defects of the acrylic components of the inner detector: the light collection in cell 4 and in the front gamma-catcher was reduced by a factor about 2.5 due to a leak of mineral oil optically coupling the PMTs and the acrylic buffers; the cross-talk between cells significantly increased over time due to ingress of liquid scintillator inside the sandwich structure of most acrylic walls. Taking advantage of a long maintenance period of the reactor the detector was repaired during summer 2017 and the subsequent phase 2 (Oct. 2017 - Apr. 2019) and phase 3 (Apr. 2019 - Nov. 2020) of data taking were shown to be far more stable with very similar responses from all target cells. All results reported here are based on the high quality data from these last two phases (see Extended Data Fig. 1). They contain about twice as much data as in previous Stereo publications [4, 5, 6, 3].
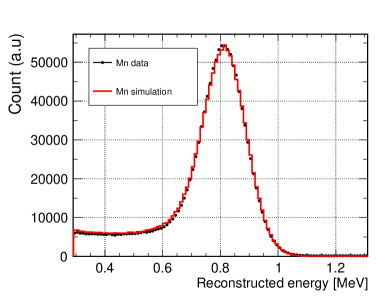
Weekly calibration runs are performed by inserting a 54Mn source at 5 different heights above the bottom of the target (10 cm, 30 cm, 45 cm, 60 cm and 80 cm) in each of the 6 cells, with the exception of cell 3 where a similar tube is present but used to fill the liquid scintillator. In addition, full calibration campaigns are performed every few months with a complete set of sources (137Cs, 54Mn, 65Zn, 42K, 60Co, 24Na and 241Am-9Be) covering the neutrino energy range and inducing various topologies of energy deposits (single , multi-, +neutron). Some of these sources had much higher rate than antineutrino interactions. In order to be sure that the baseline voltage of the electronics has been recovered between every two events, only events with at least s to the previous event are considered in the analysis of calibration runs.
Detector response
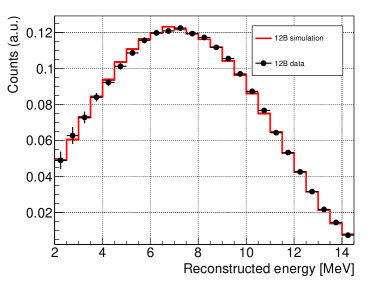
The precise control of the STEREO detector response is a prerequisite to extract all observables for neutrino physics. The accurate description of the detector response in the GEANT4 [51] simulation is thus validated with a dataset as complete as possible and independent of the neutrino data. In addition to calibration data from sources, two cosmic rays interactions were also studied: the -peak at 2.2 MeV induced by the capture of spallation neutrons, created predominantly in the surrounding lead shielding, on hydrogen; and the -decay spectrum of 12B nuclei, generated by muon capture on 12C in the scintillator. These cosmogenic events are more uniformly distributed in the detector volume than source events (produced around calibration tubes) and provide complementary information. The calculation of the beta spectrum of 12B has been updated with respect to previous analyses [6] by including more complete calculations of the correction terms to Fermi theory. The prediction of the BetaShape code [52] is chosen as the new reference and provided in the supplementary materials [39].
Energy scale
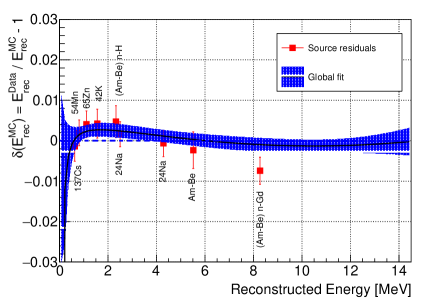
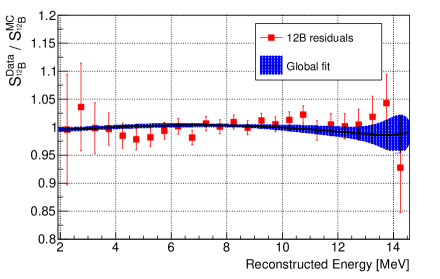
The quality of the energy scale is estimated from the residuals between data and simulation using all the control data mentioned above. For radioactive sources it is the position of the reconstructed -peaks that is used, whereas in the case of 12B it is the shape of the beta spectrum. These two pieces of information are combined in a global fit of the possible relative distortions between the energy scales of the data and the simulation. The source residuals provide a direct measure of these distortions. Their propagation in the shape of the beta spectrum, more complex, is described by the formalism presented in [53]. Extended Data Fig. 2 shows all residuals at the target level (averaged over all cells) with an example of global fit using a polynomial of order three as a model for the distortions. Higher order polynomial as well as a very general Kernel Density Estimation (KDE) approach are also used. The energy scale uncertainty for any given cell is found to be 1%, not correlated between cells, and 0.4% at the target level. The same results apply to both data collection phases.
Stability of energy reconstruction
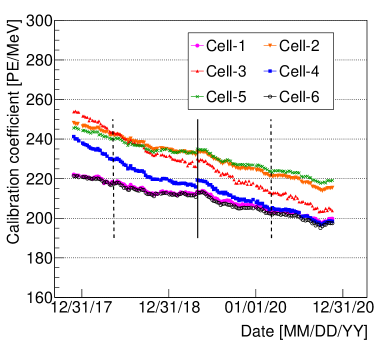
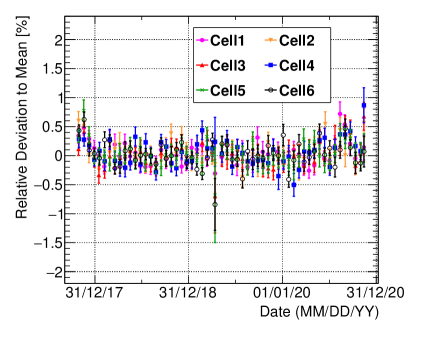
As the detector response evolves with time, two fine-tunings of the simulation are performed to align the simulated to the experimental distributions of charges on central dates of each phase (28/04/2018 for phase-II and 28/02/2020 for phase-III). The evolution of the detector before, between and after these tuning dates is accurately monitored with the weekly 54Mn calibration runs by computing calibration coefficients (CCs) using the formalism described in [4]. Extended Data Fig. 3.a shows a continuous decrease of collected photo-electrons in each cell for the same energy deposits of the source. The 10 to 20% amplitude across the whole duration of the experiment is mainly attributed to the loss of transparency of the liquid scintillator. The monitoring of the position of the n-H peak from cosmic events, performed for the same period of time using this set of CCs (Extended Data Fig. 3.b), demonstrates a remarkable time stability of the energy reconstruction with 0.25% associated uncertainty achieved for each cell.
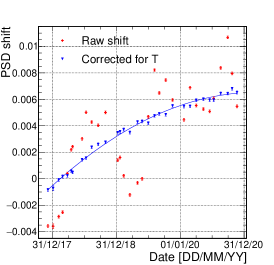
Stability of Pulse Shape Discrimination variable
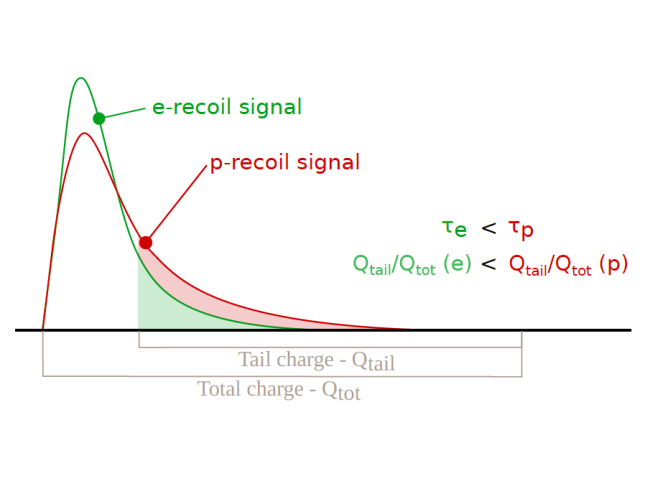
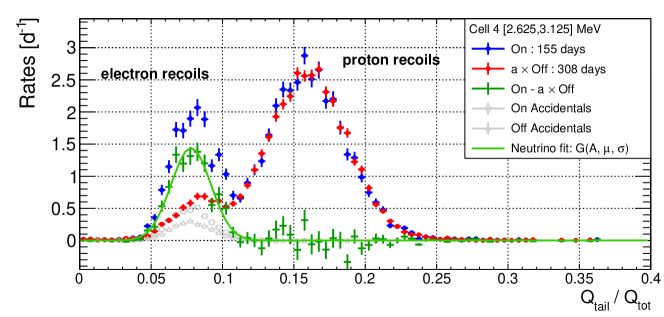
The Pulse Shape Discrimination (PSD) variable is an important observable used to discriminate electron-like and proton-like energy deposits, the prompt signal of an IBD event being electron-like while the dominant fast neutron background induced by cosmic rays being proton-like. The liquid scintillator used in Stereo has the ability to perform Pulse Shape Discrimination: the time distribution of emitted scintillation photons, and of the subsequent charge output of the PMTs, depends on the density of energy deposition in the liquid. Proton recoils produce excited states of the scintillator molecules that have longer de-excitation time, leading to an enhancement of the late part () of the output electronic pulse (cf. Extended Data Fig. 4.a). The PSD variable, defined as the fraction of charge in the late part of the pulse: , therefore discriminates between electron-like deposits and proton-like deposits [27]. The discrimination between these two populations can be seen with antineutrino data on Extended Data Fig. 5.a.
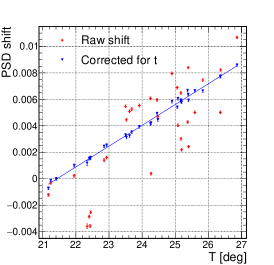
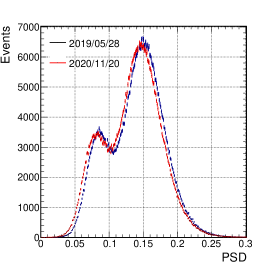
However the shape of the light pulses is sensitive to the time evolution of the liquid scintillator properties. Increase in temperature dilates the liquid and reduces the effective density of energy deposition shifting the PSD variable to lower value. Degradation of the optical properties of the liquid (transparency) reduces the separation of the e-like and p-like populations. An example of the discrepancy of PSD distributions between the beginning and end of phase-III is displayed on Extended Data Fig. 4.b.
The evolution of the PSD variable is not taken into account by the calibration strategy presented in the previous paragraph. It requires a dedicated correction, based on the Am-Be source (n+ type) that has a PSD spectrum comparable to that of antineutrinos. The principle is the following: Am-Be calibration data, taken every 1-2 months, are used to monitor the PSD variable (in each cell independently); the parameters ruling the PSD evolution with time and temperature are fitted to Am-Be data to provide a continuous correction of the PSD variable; this correction is applied to antineutrino runs before the extraction of the IBD signal.
The distortion of the PSD at date with respect to a reference date (taken in the middle of the data taking: May 28th, 2019) is expressed with a scaling factor and a shift :
| (2) |
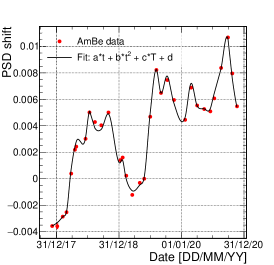
The quantities and are determined for each Am-Be calibration run, every 1-2 months. The continuous evolution is obtained by a fit with a polynomial function of time (second-order) and temperature (first order):
| (3) |
The values of from Am-Be runs and the fitted are shown for illustration in Extended Data Fig. 4c for cell 4. The expression of the fit function was chosen to be as simple as possible. A first-order polynomial of the temperature provides a good fit to the data (Extended Data Fig. 4.d1); however, a linear dependence on time was not sufficient to correctly describe the evolution of the PSD variable (Extended Data Fig. 4.d2).
It was found that the fit coefficients and do not significantly depend on either the height of the source in the calibration tube or the energy of the events. Therefore the correction was build with calibration runs in the center of each cell ( cm), combining events from a wide energy range: from 1.625 to 4.125 MeV.
The value of the PSD variable for each physics run (either reactor-on or -off) at date , with detector temperature , is then corrected based on the fitted and .
Signal and backgrounds
The extraction of the inverse -decay (IBD) signal relies on two steps. First, the cuts listed in Table 1 are applied: they use the topology of IBD events, with a prompt signal ( kinetic energy deposit and annihilation) followed by a delayed signal ( capture). There are four types of cuts: i) cuts defining the energy range of the prompt and delayed events, ii) cuts to select pairs of prompt-delayed events with appropriate time and space coincidence, iii) topology cuts to ensure that most of the prompt energy is deposited in a single target cell (cells 1-6), and iv) cuts removing cosmogenic background. The cut on PMT asymmetry, for instance, requires the charge to be evenly distributed among all 4 PMTs of the vertex cell, thus removing events happening very close to a single PMT such as muon decays. The selection cuts are applied on both reactor-on (”ON”) and reactor-off (”OFF”) samples. The amount of random coincidences passing these cuts is estimated using an off-time method. A more complete description of all cuts can be found in [4].
| Type | Requirement for passing cut |
|---|---|
| Energy | |
| Coincidence | |
| Topology | Vertex cell in target (cells 1-6) |
| Cell next to vertex cell: (phII) | |
| (phIII) | |
| Cell far from vertex cell: | |
| Cosmic background | No muon in veto 100 s before the prompt |
| No muon in detector 200 s before the prompt | |
| No event in detector 100 s before the prompt and | |
| 100 s after the delayed | |
| PMT asymmetry |
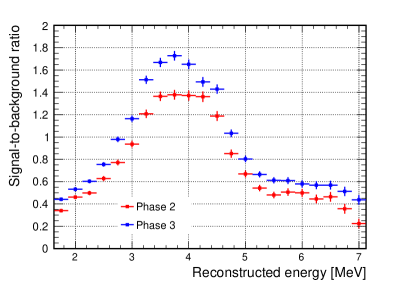
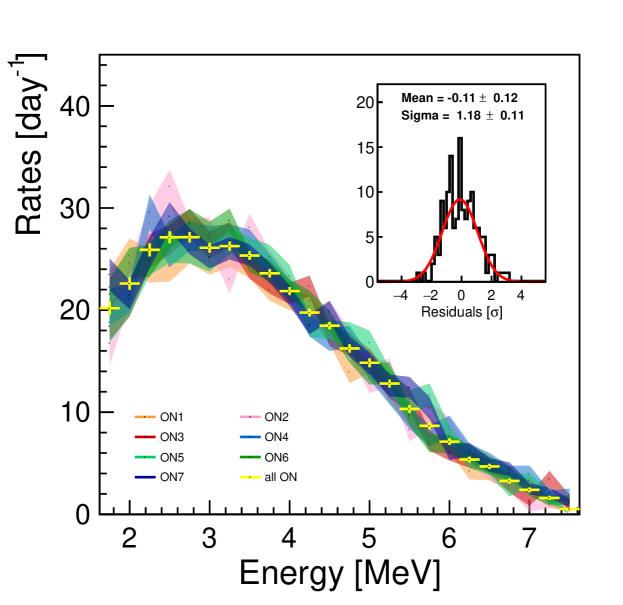
In the second step, a joint fit of ON and OFF PSD distributions is performed in each energy bin; the difference between ON and OFF, fitted by a Gaussian, gives the number of IBD candidates (Extended Data Fig. 5.a) [4]. Event rates are extracted separately for each phase of data taking in order to suppress residual effects from detector ageing. The average signal-to-background ratio is 0.8 for phase-II and 1.0 for phase-III; the higher value for phase-III is due to higher mean reactor power. Extended Data Fig. 5.b displays the energy-dependent signal-to-background ratio: it is limited by random coincidences at low energy and by the decrease in signal intensity at high energy. For the oscillation analysis, the procedure described above provides 12 spectra (6 cells 2 phases) with 11 energy bins (500 keV wide, from 1.625 MeV to 7.125 MeV). Data from the 6 target cells are merged for the spectrum analysis giving 2 input spectra (one per phase) with finer energy binning (22 bins of 250 keV).
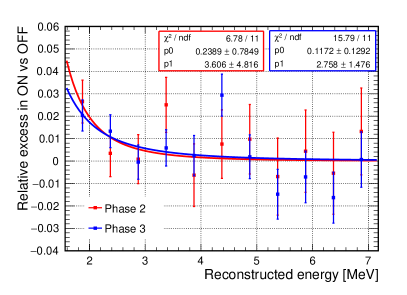
The PSD fit method only accounts for cosmogenic backgrounds that are monitored when the reactor is turned off. To check for correlated background related to reactor operation we directly compared the ON and OFF PSD distributions corrected for the atmospheric pressure instead of fitting a relative normalisation parameter. Any discrepancy could be an indication of backgrounds from the reactor or other instruments neighboring Stereo in ILL’s reactor hall. A hint of an excess of events is found at low energy for the two phases, as shown in Extended Data Fig. 5c. It is fitted by a power law, which is used to correct the neutrino rates (few % correction at low energy, negligible above 3 MeV). However, the origin of this reactogenic background is unclear. It may be produced by fast neutrons, inducing proton recoils in the detector. Such events would not be confused with the annihilation from the IBD signal thanks to Pulse Shape Discrimination; therefore, a 100% uncertainty is added to this background component.
For a global validation of the extraction of neutrino rates the Stereo dataset has been divided into seven ”mini-experiments” each consisting of 1 reactor cycle flanked by OFF reactor periods. Extended Data Fig. 6 shows that the 7 neutrino spectra thus obtained are compatible with each other with a distribution of fluctuations as expected from pure statistics. This cross-check rules out significant spectrum distortions that could be induced by residual effects of the time evolution of the detector response or background.
Neutron efficiency
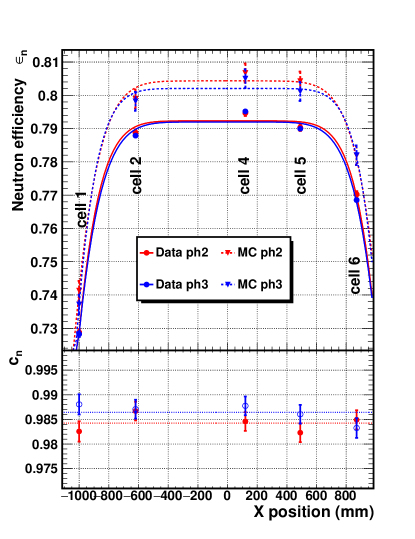
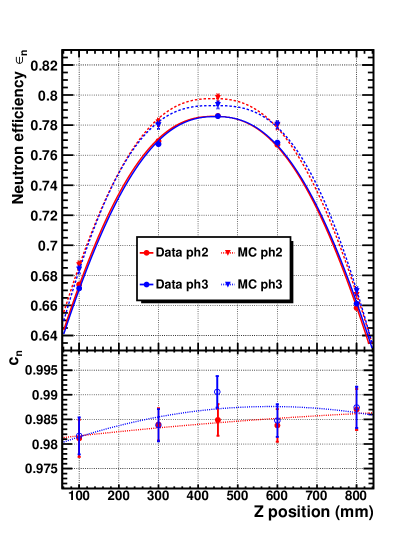
An accurate computation of the selection efficiencies is a key aspect to normalize the experimental rates and compare them to flux predictions. These efficiencies are computed with the Monte-Carlo simulation of the experiment. However, the description of low-energy neutron physics may be imperfect in this simulation; therefore, the efficiency associated to tagging the delayed signal (called neutron efficiency) is validated with calibration data. The 241Am-9Be source, producing correlated pairs (,n) mimicking IBD events, is used to evaluate this efficiency. Its deployment into the target cells at five different heights allows to probe the entire detector volume.
All selection cuts of the delayed signal described in Table 1 are applied, except the 600 mm distance between the prompt and delayed vertices, not relevant for this study. The resulting amount of (,n) pairs is compared to a sample without these cuts, giving the neutron efficiency for measured and simulated events.
A precise modeling of the de-excitation of Gd isotopes after neutron capture is obtained using the FIFRELIN code [54]. New features have been implemented to improve the reliability of the Stereo detector response compared to the previous version [55]: the physics of conversion electrons and the subsequent X-ray emission has been treated more accurately; a better description of the high-energy part of the -ray spectrum has been achieved by taking into account available experimental data on primary -rays; a complete treatment of angular correlations between -rays has been implemented [56].
Due to the high intensity of our Am-Be source inducing a 27 kHz event rate in the detector, many random coincidences have to be removed to get a clean sample of (,n) pairs. They are estimated with an off-time windows search and subtracted statistically. The estimation was improved with respect to the work presented in [4]. The procedure has been validated with two Am-Be simulations: one with high intensity (27 kHz, similar to the data) and another at low intensity (1 Hz) where random coincidences are negligible.
The neutron efficiency is displayed as function of the source position in in Extended Data Fig. 7. The spatial dependence of the efficiency is well reproduced in the simulation, although there is a 1.5% global difference between data and simulation. A 3D spatial model of the efficiency is built by fitting the Am-Be points in data or simulation, assuming the same behaviour in the two horizontal dimensions ( and ). The coefficient
| (4) |
corrects the bias on the selection efficiency due to the imperfect modelling of neutron physics in simulation. The integration of over each cell volume gives a correction factor for the amount of IBD candidates detected in each cell. The cell-averaged coefficient is the same for all cells:
|
(5) |
where part of the uncertainty is correlated [corr] between cells (change in due to source intensity in simulation, discrepancies on due to the choice of the 3D spatial model) and part is uncorrelated [uncorr] between cells (statistical error on measurements, uncertainty on the positions of the Am-Be source in each calibration tube).
Sterile neutrino search
The data recorded in Stereo ’s 6 cells are binned in 11 equally wide 500 keV energy bins from 1.625 to 7.125 MeV in reconstructed energy, separately for the running periods Phase II and III, and are fitted to the predicted spectra by minimising the following :
| (6) | ||||
where stands for the measured IBD rate in the -th energy bin of cell number for running Phase , is the predicted IBD rate in the corresponding bin for the sterile neutrino parameters (), and are the nuisance parameters. The variables apply a cell-independent correction to the predicted spectra of each cell , thus absorbing any possible difference between the spectrum prediction and the observed reactor antineutrino spectrum, rendering the analysis prediction-independent. The statistical uncertainty , stemming from the background subtraction and the signal statistics, is parameterised as a function of the expected number of signal events, which depends on the values of and the sterile neutrino parameters. Indeed, some values of these parameters lead to predicted rates that are significantly different than the measured values, preventing to use the statistical uncertainty directly obtained from the signal extraction. Finally, the nuisance parameters address the systematic uncertainties by allowing for adjustments of the predicted rates within the constraints given by auxiliary measurements of detector response and backgrounds. These constraints are at the percent or sub-percent level and are either uncorrelated (part of energy scale , normalisation , reactor background ) or correlated (part of energy scale , selection cuts , relative normalisation of phases ) between cells. Good systematics control is paramount in the low region as an energy scale shift can mimic slow oscillations. A summary of uncertainties can be found in Extended Data Fig. 8.b.
The distributions required for the statistical analysis of a given hypothesis (, ) are computed by generating pseudo-experiments and fitting them with the of eqn. (6) (Feldman-Cousins approach). The pseudo-experiments are produced by taking the predicted spectrum in each cell and independently fluctuating each energy bin according to a normal distribution whose standard deviation is the statistical uncertainty of the bin . Variations within the systematic uncertainties are also included. A detailed account of the statistical analysis leading to the exclusion contour in the sterile neutrino parameter space (, ) is given in [4].
Simultaneous optimisation of and while fixing and to zero allow us to compare our data to the predicted spectrum for the no sterile neutrino hypothesis. This hypothesis is a good fit of the data (goodness-of-fit is 25%), as can be seen in Extended Data Fig. 9.
A further independent sterile neutrino search was performed as a crosscheck [57]. An analytical parameterization of the detector response was built for the Phase II period. The systematic uncertainties on this detector response model were determined by fitting the cosmogenic 12B data and comparing the resulting response model to the one obtained from the Geant4 simulation. The Phase II data, binned in 250 keV bins, was then fitted to the predicted spectra for each cell. The prediction was computed on the fly by the software by convolving a common reactor antineutrino spectrum with each cell’s detector response function. This approach allows for a more natural treatment of the systematics, detector- as well as spectrum-related, since the corresponding parameters can be left free to vary during the fit. Thus, all reactor spectrum bins between 2.75 and 7.25 MeV in antineutrino energy were free to vary in the fit. Additionally, 15 detector response parameters per cell were left free in the fit, including 3 for energy-scale and 4 concerning the energy resolution. The resulting exclusion contour was found to be compatible with the published analysis of the Phase-II data [4].
Spectrum analysis
The systematic uncertainties relevant for the spectrum analysis are given in Extended Data Fig. 8a. The measurement of the aperture of the calibration diaphragm measuring the flow inside the primary circuit of the ILL reactor showed excellent stability, thus confirming the accuracy of the evaluation of the reactor power (1.4% uncertainty).
Two complementary implementations of the Tikhonov approach developped by the Stereo collaboration give the same results. They are presented in details in [6, 38]. The strength of the Tikhonov regularisation is carefully chosen to preserve the shape information of the spectrum at the scale of a few bins, but by definition it dampens the fluctuations between neighbouring bins, which become correlated. For the same reason, a real high-frequency (2-bin) feature in the spectrum will be smoothed out. These two effects are encoded in the covariance matrix and in a filter matrix, available in the supplementary materials [39]. Importantly, models should be folded through the filter matrix to ensure an unbiased comparison with Stereo unfolded spectrum [38].
The HM-based prediction for the IBD rates is built as follows. The antineutrino flux (/fission) is taken as the exponential of a sixth-order polynomial based on Ref. [8]. We then multiply the antineutrino flux by the IBD cross section from Ref. [40]. In order to characterize the spectral distortion around 5.5 MeV, we describe the excess by a Gaussian and built the following model based on the HM prediction :
| (7) |
The comparison with Stereo spectrum is done by passing the prediction (7) through the filter matrix. The fit with the four parameters improves the by 29.0 units compared to the fit with only the normalization offset, corresponding to a statistical significance of 4.6 for the 5.5 MeV distortion. The maximum amplitude of the Gaussian is fitted to be (15.6 5.2)%. This distortion was initially observed by experiments with power reactors with similar parameters. Our result for pure 235U thus indicates that a similar bump is probably present in the fission spectrum of 239Pu . Based on the summation model [10] the distortion in the neutrino spectrum would imply a similar distortion in the beta spectrum. As a possible explanation of why it was not seen in the reference fission beta spectrum measured in the 1980s we suggest that it could be due to a slight change in the calibration of the magnetic spectrometer [21] during the scan of the 2-9 MeV energy range. The high sensitivity to such a kink in energy scale has been discussed in [53].
Data availability
All the results (sterile neutrino search and spectrum analysis) and the elements necessary to reproduce them are provided in the supplementary materials available in Ref. [39].
Acknowledgements
This work is funded by the French National Research Agency (ANR) within the project ANR-13-BS05-0007 and the “Investments for the future” programme ENIGMASS LabEx
(ANR-11-LABX-0012). Authors are grateful for the technical and administrative support of the ILL for the installation and operation of the Stereo detector. We further acknowledge the support of the CEA, the CNRS/IN2P3 and the Max Planck Society.
Extended data
| a | c |
 |
 |
| b | d |
 |
 |
| a | b |
|---|---|
 |
 |
| a | d1 | |
 |
 |
|
| b | c | d2 |
 |
 |
 |
| a | |
|---|---|
 |
|
| b | c |
 |
 |
| a | b |
|---|---|
 |
 |
a. Spectrum analysis systematics
| Type | Source | Uncertainty | Correlations | |
| Energy | Phase | |||
| Energy scale | Energy reconstruction | 0.41% | 1 | 1 |
| Time stability | 0.25% | 1 | 0 | |
| Total | 0.5% | 1 | 0.73 | |
| Signal | Selection cuts | 0% to 2% | 1 | 1 |
| Reactor background | 5% to 0% | 1 | 1 | |
| Non-235U flux | Off equilibrium | 30% | 1 | 1 |
| 28Al | 5% | 1 | 1 | |
| Normalization | Reactor thermal power | 1.4% | 1 | 0.46 |
| Proton number | 1.0% | 1 | 1 | |
| Neutron efficiency | 0.7% | 1 | 0.92 | |
| Neutrino extraction method | 0.7% | 1 | 1 | |
| Solid angle | 0.5% | 1 | 1 | |
| Others [5] | 0.3% | 1 | 1 | |
| Total | 2.1% | 1 | 0.72 | |
b. Oscillation analysis systematics
| Type | Source | Nuisance | Uncertainty | Correlations | ||
| parameter | Energy | Cell | Phase | |||
| Energy scale | Energy reconstruction | 1% | 1 | 0 | 1 | |
| Time stability | 0.25% | 1 | 1 | 0 | ||
| Signal | Selection cuts | 0% to 2% | 1 | 1 | 1 | |
| Reactor background | 5% to 0% | 1 | 0 | 1 | ||
| Normalization | Relative cell volume | 0.83% | 1 | 0 | 1 | |
| Neutron efficiency | 0.63% | 1 | 0 | 0.91 | ||
| Relative norm ph-2/ph-3 | 1.5% | 1 | 1 | - | ||
c. Selection cuts:
| Phase | (MeV) | ||
|---|---|---|---|
| Phase-II | 1.625 | 9.99 | 7.74 |
| Phase-III | 1.06 | 1.04 |
Phase-II
 Phase-III