Can Demographic Factors Improve Text Classification?
Revisiting Demographic Adaptation in the Age of Transformers
Abstract
Demographic factors (e.g., gender or age) shape our language. Previous work showed that incorporating demographic factors can consistently improve performance for various NLP tasks with traditional NLP models. In this work, we investigate whether these previous findings still hold with state-of-the-art pretrained Transformer-based language models (PLMs). We use three common specialization methods proven effective for incorporating external knowledge into pretrained Transformers (e.g., domain-specific or geographic knowledge). We adapt the language representations for the demographic dimensions of gender and age, using continuous language modeling and dynamic multi-task learning for adaptation, where we couple language modeling objectives with the prediction of demographic classes. Our results, when employing a multilingual PLM, show substantial gains in task performance across four languages (English, German, French, and Danish), which is consistent with the results of previous work. However, controlling for confounding factors – primarily domain and language proficiency of Transformer-based PLMs – shows that downstream performance gains from our demographic adaptation do not actually stem from demographic knowledge. Our results indicate that demographic specialization of PLMs, while holding promise for positive societal impact, still represents an unsolved problem for (modern) NLP.
1 Introduction
Demographic factors like social class, education, income, age, or gender, categorize people into specific groups or populations. At the same time, demographic factors both shape and are reflected in our language (e.g., Trudgill, 2000; Eckert and McConnell-Ginet, 2013). A large body of work focused on modeling demographic language variation, especially the correlations between words and demographic factors (Bamman et al., 2014; Garimella et al., 2017; Welch et al., 2020, inter alia). In a similar vein, Volkova et al. (2013) and Hovy (2015) demonstrated that explicitly incorporating demographic information in language representations improves performance on downstream NLP tasks, e.g., topic classification or sentiment analysis. However, these observations rely on approaches that leverage gender-specific lexica to specialize word embeddings and text encoders (e.g., recurrent networks) that have not been pretrained for (general purpose) language understanding. To date, the benefits of demographic specialization have not been tested with Transformer-based (Vaswani et al., 2017) pretrained language models (PLMs), which have been shown to excel on the vast majority of NLP tasks and even surpass human performance in some cases (Wang et al., 2018).
More recent studies focus mainly on monolingual English datasets and introduce demographic features in task-specific fine-tuning Voigt et al. (2018); Buechel et al. (2018), which limits the benefits of demographic knowledge to tasks at hand. In this work, we investigate the (task-agnostic) demographic specialization of PLMs, aiming to impart the associations between demographic categories and linguistic phenomena into the PLMs parameters. If successful, such specialization could benefit any downstream NLP task in which demographic factors (i.e., demographically conditioned language phenomena) matter. For this, we adopt intermediate training paradigms that have been proven effective for the specialization of PLMs for other types of knowledge, e.g., in domain, language, and geographic adaptation (Glavaš et al., 2020; Hung et al., 2022a; Hofmann et al., 2022). To this effect, we perform (i) continued language modeling on text corpora produced by a demographic group and (ii) dynamic multi-task learning (Kendall et al., 2018), wherein we combine language modeling with the prediction of demographic categories.
We evaluate the effectiveness of the demographic PLM specialization on both intrinsic (demographic category prediction) and extrinsic (sentiment classification and topic detection) evaluation tasks across four languages: English, German, French, and Danish, using a multilingual corpus of reviews (Hovy et al., 2015) annotated with demographic information. In line with earlier findings Hovy (2015), our initial experiments based on a multilingual PLM (mBERT; Devlin et al., 2019), render demographic specialization effective: we observe gains in most tasks and settings. Through a set of controlled experiments, where we (1) adapt with in-domain language modeling alone, without leveraging demographic information, (2) demographically specialize monolingual PLMs of evaluation languages, (3) carry out a meta-regression analysis over dimensions that drive the performance, and (4) analyze the topology of the representation spaces of demographically specialized PLMs, we show, however, that most of the original gains can be attributed to confounding effects of language and/or domain specialization.
Our findings indicate that specialization approaches, proven effective for other types of knowledge, fail to adequately instill demographic knowledge into PLMs, making demographic specialization of NLP models an open problem in the age of large pretrained Transformers. Our research code is publicly available at: https://github.com/umanlp/SocioAdapt.
2 Demographic Adaptation
Our goal is to inject demographic knowledge through intermediate PLM training in a task-agnostic manner. To achieve this goal, we train the PLM in a dynamic multi-task learning setup (Kendall et al., 2018), in which we couple masked language modeling (MLM-ing) with predicting the demographic category – gender or age group of the text author. Such multi-task learning setup is designed to force the PLM to learn associations between the language constructs and demographic groups, if these associations are salient in the training corpora.
Masked Language Modeling (MLM).
Following successful work on pretraining via language modeling for domain-adaptation (Gururangan et al., 2020; Hung et al., 2022a), we investigate the effect of running standard MLM-ing on the text corpora of a specific demographic dimension (e.g., gender-related corpora). We compute the MLM loss in the common way, as negative log-likelihood of the true token probability.
Demographic Category Prediction.
In the multi-task learning setup, the representation of the input text, as output by the Transformer, is additionally fed into a classification head that predicts the corresponding demographic category: age (below 35 and above 45111As suggested by Hovy (2015) the split for the age ranges result in roughly equally-sized data sets for each sub-group and is non-contiguous, avoiding fuzzy boundaries.), and gender (female and male). The demographic prediction loss is computed as the standard binary cross-entropy loss.
We experiment with two different ways of predicting the demographic category of the text: (i) from the transformed representation of the sequence start token ([CLS]) and (ii) from the contextualized representations of each masked token. We hypothesized that the former variant, in which we predict the demographic class from the [CLS] token representation, would establish links between more complex demographically condition linguistic phenomena (e.g., syntactic patterns or patterns of compositional semantics that a demographic group might exhibit), whereas the latter – predicting demographic class from representations of masked tokens – is more likely to establish simpler lexical links, i.e., capture the vocabulary differences between the demographic groups.
Multi-Task Learning.
Since both losses can be computed from the same input instances, we opt for joint multi-task learning (MTL) and resort to dynamic MTL based on the homoscedastic uncertainty of the losses, wherein the loss variances are used to balance the contributions of the tasks (Kendall et al., 2018). The intuition is that more effective MTL occurs if we dynamically assign less importance to more uncertain tasks, as opposed to assigning uniform task weights throughout the whole training. Homoscedastic uncertainty weighting in MTL has been effective in different NLP settings (Lauscher et al., 2018; Hofmann et al., 2022). In our scenario, and are measured on different scales in which the model would favor (i.e., be more confident for) one objective than the other. The confidence level of the model prediction for each task would change throughout the training progress: this makes dynamic weighting desirable. We dynamically prioritize the tasks via homoscedastic uncertainties :
| (1) |
where is the variance of the task-specific loss over training instances for quantifying the uncertainty of the task . In practice, we train the network to predict the log variance, , since it is more numerically stable than regressing the variance , as the log avoids divisions by zero. The adjusted losses are then computed as:
| (2) |
The final loss we minimize is the sum of the two uncertainty-adjusted losses: + .
3 Experimental Setup
| gender | age | ||||||||
|---|---|---|---|---|---|---|---|---|---|
| Country | Language | Specialization | SA, AC-SA | TD, AC-TD | Specialization | SA, AC-SA | TD, AC-TD | ||
| F | M | F / M | <35 | >45 | <35 / >45 | ||||
| Denmark | Danish | 1,596,816 | 2,022,349 | 250,485 | 120,805 | 833,657 | 494,905 | 75,300 | 44,815 |
| France | French | 489,778 | 614,495 | 67,305 | 55,570 | 40,448 | 36,182 | 6,570 | 6,120 |
| Germany | German | 210,718 | 284,399 | 28,920 | 30,580 | 66,342 | 47,308 | 5,865 | 8,040 |
| UK | English | 1,665,167 | 1,632,894 | 156,630 | 183,995 | 231,905 | 274,528 | 26,325 | 22,095 |
| US | English | 575,951 | 778,877 | 72,270 | 61,585 | 124,924 | 70,015 | 6,495 | 12,090 |
Here we describe evaluation tasks and provide details on the data used for demographic specialization and downstream evaluation.
Evaluation Tasks.
We follow Hovy (2015) and measure the effects of demographic specialization of PLMs on three text-classification tasks, coupling intrinsic demographic attribute classification (AC) with two extrinsic text classification tasks: sentiment analysis (SA) and topic detection (TD). As an intrinsic evaluation task, AC directly tests if the intermediate demographic specialization results in a PLM that can be more effectively fine-tuned to predict the same demographic classes used in the intermediate specialization: PLMs (vanilla PLM and our demographically specialized counterpart) – are fine-tuned in a supervised fashion to predict the demographic class (gender or age) of the text author. SA is a ternary classification task in which the reviews with ratings of , , and stars represent instances of negative, neutral, and positive class, respectively. TD classifies texts into 5 different topic categories. We report the -measure for each task following Hovy (2015).
Data.
We carry out our core experimentation on the multilingual demographically labeled dataset of reviews (Hovy et al., 2015), created from the internationally popular user review website Trustpilot.222https://www.trustpilot.com/ For comparison and consistency, we work with exactly the same data portions as Hovy (2015): collections that cover (1) two most prominent demographic dimensions – gender and age, with two categories in each (gender: male or female; age: below 35 or above 45333As suggested by Hovy (2015), the split for the age ranges results in roughly equally-sized data sets for each sub-group and is non-contiguous, avoiding fuzzy boundaries.) and (2) five countries (four languages): United States (US), Denmark, Germany, France, and United Kingdom (UK).
To avoid any information leakage, we ensure – for each country-demographic dimension collection (e.g., US, gender) – that there is zero overlap between the portions we select for intermediate demographic specialization and portions used for downstream fine-tuning and evaluation (for AC, SA, and TD). (Specialization). For TD, we aim to eliminate the confounding effect of demographically-conditioned label distributions (e.g., female authors wrote reviews for clothing store more frequently than male authors; vice-versa for electronics & technology). To this effect, we select, for each country, reviews from the five most frequent topics and sample the same number of reviews in each topic for both demographic groups (i.e., male and female for gender; below 35 and above 45 for age). For the intrinsic AC task (i.e., fine-tuning to predict either gender or age category), we report the results for two different review collections: the first is the set of reviews that have, besides the demographic classes, been annotated with sentiment labels (we refer to this as AC-SA) and the second are the reviews that have topic labels (i.e., product/service category; we refer to this portion as AC-TD). For these fine-tuning and evaluation datasets, we make sure that the two demographic classes (male and female for gender under 35 and above 45 for age) are equally represented in each dataset portion (train, development, and test). Table 1 displays the numbers of reviews for each country, demographic aspect, and dataset portion (specialization vs. fine-tuning).
For intermediate specialization of the multilingual model, we randomly sample 100K instances per demographic group from the gender specialization portion and 50K instances each from the texts reserved for age specialization concatenated across all 5 countries. For the specialization of monolingual PLMs, we randomly sample the same number of instances but from the specialization portions of a single country. Following the established procedure (e.g., Devlin et al., 2019; Liu et al., 2019), we dynamically mask 15% of the tokens in the demographic specialization portions for MLM.
Pre-trained language models.
Given that we experiment with Trustpilot data in four different languages, in our core experiments, we resorted to multilingual BERT (mBERT)444We load the bert-base-multilingual-cased weights from HuggingFace Transformers. (Devlin et al., 2019) as the starting PLM. This allows us to merge the (fairly large) specialization portions of Trustpilot in different languages (see Table 1) and run a single multilingual demographic specialization procedure on the combined multilingual review corpus. We then fine-tune the demographically-specialized mBERT and evaluate downstream task performance separately for each of the five countries (using train, development, and test portions of the respective country). We report the results for two different variants of our dynamic multi-task demographic specialization (DS): (1) when the demographic category is predicted from representations of masked tokens (DS-Tok) and (2) when we predict the demographic category from the encoding of the whole sequence (i.e., review; this version is denoted with DS-Seq). We compare these demographic-specialized PLM variants against two baselines: vanilla PLM and PLM specialized on the same review corpora as our MTL variants but only via MLM-ing (i.e., without providing the demographic signal).
Training and Optimization.
In demographic specialization training, we fix the maximum sequence length to subword tokens. We train for epochs in batches of instances and search for the optimal learning rate among the following values: . We apply early stopping based on the development set performance: we stop if the joint MTL loss does not improve for 3 epochs). For downstream fine-tuning and evaluation, we train for maximum epochs in batches of . We search for the optimal learning rate between the following values: and apply early stopping based on the validation set performance (patience: 5 epochs). We use AdamW (Loshchilov and Hutter, 2019) as the optimization algorithm.
4 Results and Discussion
We first discuss the results of multilingual demographic specialization with mBERT as the PLM (§4.1). We then provide a series of control experiments in which we isolate the effects that contribute to performance gains of demographically specialized PLMs (§4.2).
| Demographic: gender | Demographic: age | ||||||||||||||||
| Gender class. | SA | TD | Age class. | SA | TD | ||||||||||||
| Country | Model | AC-SA | AC-TD | F | M | X | F | M | X | AC-SA | AC-TD | <35 | >45 | X | <35 | >45 | X |
| Denmark | mBERT | 64.0 | 61.8 | 69.2 | 64.8 | 67.2 | 59.3 | 58.3 | 59.0 | 57.2 | 64.5 | 62.7 | 62.7 | 62.9 | 56.1 | 52.2 | 53.4 |
| MLM | 65.2 | 63.4 | 69.5 | 65.8 | 67.8 | 59.7 | 58.8 | 59.4 | 65.5 | 65.1 | 63.3 | 62.1 | 63.0 | 57.1 | 52.6 | 54.1 | |
| DS-Seq | 64.9 | 63.5 | 69.9 | 65.7 | 67.7 | 59.7 | 57.8 | 59.1 | 65.2 | 65.2 | 63.1 | 62.9 | 63.0 | 56.9 | 53.3 | 54.5 | |
| DS-Tok | 65.0 | 63.5 | 69.1 | 65.6 | 68.0 | 59.9 | 58.9 | 59.0 | 65.3 | 64.6 | 64.2 | 63.3 | 63.2 | 56.2 | 53.2 | 54.3 | |
| Germany | mBERT | 59.5 | 57.9 | 66.1 | 63.2 | 64.5 | 67.8 | 65.6 | 65.8 | 58.0 | 56.9 | 52.6 | 55.0 | 55.0 | 60.1 | 55.3 | 57.1 |
| MLM | 61.2 | 60.1 | 67.7 | 65.3 | 66.1 | 68.6 | 67.0 | 67.1 | 61.1 | 58.9 | 53.6 | 55.5 | 56.7 | 61.5 | 56.5 | 58.7 | |
| DS-Seq | 60.1 | 60.3 | 66.7 | 64.0 | 65.7 | 67.6 | 65.7 | 66.4 | 56.4 | 58.2 | 53.8 | 55.3 | 55.5 | 60.8 | 57.6 | 59.3 | |
| DS-Tok | 62.9 | 58.3 | 66.8 | 64.3 | 66.8 | 68.3 | 67.0 | 66.7 | 56.6 | 57.4 | 53.0 | 56.5 | 56.7 | 59.3 | 56.5 | 59.3 | |
| US | mBERT | 62.6 | 58.1 | 66.3 | 64.4 | 66.0 | 71.2 | 68.4 | 70.2 | 62.9 | 60.7 | 57.7 | 57.9 | 57.8 | 68.0 | 64.3 | 64.3 |
| MLM | 63.3 | 59.6 | 67.3 | 66.2 | 66.9 | 72.1 | 69.4 | 70.3 | 63.6 | 61.9 | 59.4 | 57.8 | 58.2 | 69.0 | 64.2 | 65.2 | |
| DS-Seq | 63.8 | 59.2 | 67.2 | 66.3 | 67.0 | 72.3 | 69.2 | 70.4 | 60.7 | 61.5 | 59.3 | 57.9 | 58.0 | 69.8 | 64.4 | 65.8 | |
| DS-Tok | 62.2 | 58.8 | 68.0 | 66.4 | 67.3 | 72.8 | 69.5 | 70.5 | 59.7 | 61.2 | 59.9 | 58.6 | 57.8 | 69.2 | 65.4 | 64.9 | |
| UK | mBERT | 61.9 | 63.1 | 71.0 | 69.0 | 69.7 | 70.4 | 67.9 | 68.9 | 65.1 | 65.2 | 63.8 | 63.9 | 63.7 | 64.7 | 67.1 | 66.3 |
| MLM | 63.0 | 65.3 | 72.0 | 70.4 | 71.0 | 70.6 | 67.9 | 69.8 | 65.4 | 65.6 | 62.8 | 62.0 | 63.0 | 65.1 | 67.3 | 67.3 | |
| DS-Seq | 63.4 | 64.9 | 72.9 | 70.9 | 71.7 | 70.6 | 68.2 | 69.8 | 65.3 | 62.8 | 63.8 | 64.9 | 64.9 | 66.0 | 68.1 | 66.5 | |
| DS-Tok | 63.5 | 65.6 | 73.0 | 71.0 | 71.9 | 70.8 | 68.2 | 69.9 | 64.0 | 62.8 | 64.6 | 65.2 | 65.1 | 66.4 | 67.3 | 67.6 | |
| France | mBERT | 63.9 | 61.2 | 69.3 | 67.0 | 67.8 | 44.6 | 42.4 | 43.1 | 55.7 | 56.6 | 59.6 | 57.4 | 61.5 | 52.0 | 47.1 | 49.0 |
| MLM | 64.6 | 62.1 | 69.9 | 67.1 | 68.4 | 45.8 | 43.3 | 44.3 | 56.8 | 57.2 | 59.9 | 59.5 | 61.6 | 52.5 | 47.2 | 50.3 | |
| DS-Seq | 64.1 | 63.1 | 70.6 | 67.3 | 68.4 | 46.0 | 43.4 | 44.2 | 55.1 | 55.5 | 60.4 | 60.3 | 62.8 | 51.1 | 47.3 | 50.3 | |
| DS-Tok | 65.0 | 62.9 | 70.1 | 67.5 | 68.8 | 45.5 | 43.9 | 44.4 | 54.4 | 55.9 | 60.9 | 59.8 | 59.7 | 50.2 | 48.0 | 50.8 | |
| Average | mBERT | 62.4 | 60.4 | 68.4 | 65.7 | 67.0 | 62.7 | 60.5 | 61.4 | 59.8 | 60.8 | 59.3 | 59.4 | 60.2 | 60.2 | 57.2 | 58.0 |
| MLM | 63.5 | 62.1 | 69.3 | 67.0 | 68.0 | 63.4 | 61.3 | 62.2 | 62.5 | 61.7 | 59.8 | 59.4 | 60.5 | 61.0 | 57.6 | 59.1 | |
| DS-Seq | 63.3 | 62.2 | 69.5 | 66.8 | 68.1 | 63.2 | 60.9 | 62.0 | 60.5 | 60.6 | 60.1 | 60.3 | 60.8 | 60.9 | 58.1 | 59.3 | |
| DS-Tok | 63.7 | 61.8 | 69.4 | 67.0 | 68.6 | 63.5 | 61.5 | 62.1 | 60.0 | 60.4 | 60.5 | 60.7 | 60.5 | 60.3 | 58.1 | 59.4 | |
4.1 Multilingual Specialization Results
Table 2 shows the results of gender- and age-specialized mBERT variants – DS-Seq and DS-Tok – on gender and age classification (AC-SA and AC-TD) as intrinsic tasks together with sentiment analysis (SA) and topic detection (TD) as extrinsic evaluation tasks, for each of the five countries encompassed by the Trustpilot datasets (Hovy et al., 2015). The performance of DS-Seq and DS-Tok is compared against the PLM baselines that have not been exposed to demographic information: vanilla mBERT and mBERT with additional MLM-ing on the same Trustpilot data on which DS-Seq and DS-Tok were trained.
Our demographically specialized models generally outperform the vanilla mBERT across the board, both on intrinsic and extrinsic tasks, unsurprisingly with much more prominent gains on the former. The comparison against the domain-adaptation in which mBERT was intermediately trained only MLM-ed on Trustpilot reviews, but without demographic category prediction, however, reveals that much of the gains that DS-Seq and DS-Tok have over vanilla mBERT stem from domain adaptation: somewhat surprisingly, DS models fall behind MLM-based domain adaptation on the intrinsic tasks of gender/age classification (e.g., for age group classification on AC-SA, the DS variants fall short of MLM by 2 points), while exhibiting small but fairly consistent gains over MLM for extrinsic SA and TD tasks, both in gender and age intermediate specialization. Although the gains are not particularly convincing, the SA and TD still seem to favor intermediate demographic specialization, which is in line with findings from Hovy (2015), who also reported small but (mostly) consistent gains for these two tasks.
4.2 Control Experiments
To more precisely measure the contributions of demographic information that DS-* variants incorporate, we design further experiments that control for two key side-effects of demographic specialization: (i) language specialization and (ii) domain adaptation. We then carry out the meta-regression analysis to tease out the individual contributions of language, domain, and demographic knowledge on the performance difference between vanilla mBERT and respective intermediately specialized models (mBERT or monolingual BERT specialized on the data of the same or different domain with or without demographic signal). Finally, we compare the representations spaces of the PLMs – before and after demographic specialization – along the demographic dimension.
Controlling for Language Proficiency.
Massively multilingual Transformers (MMTs) like mBERT or XLM-R Conneau et al. (2020) suffer from the curse of multilinguality Conneau et al. (2020); Lauscher et al. (2020b); Pfeiffer et al. (2020): given a fixed capacity of the Transformer, the representations from an MMT for any individual (high-resource) language will be of lower quality than those of the monolingual PLM, as MMTs share their limited capacity over many languages. It is thus possible that demographic specialization of mBERT on Trustpilot data in our four languages leads to substantial gains over vanilla mBERT (pretrained on 104 languages) primarily because of mBERT’s acquisition of additional language competencies for these four languages.
To test this, we additionally execute demographic specialization individually for each language (i.e., as opposed to a single multilingual specialization), starting from a monolingual PLM of that language555We use the following monolingual PLMs from HuggingFace: bert-base-cased, bert-base-german-cased, dbmdz/bert-base-french-europeana-cased and Maltehb/danish-bert-botxo.. Monolingual PLMs produce higher quality representations for their respective language than mBERT. Because of this, we hypothesize that subjecting them to demographic specialization on Trustpilot is unlikely to improve their “command” of the language substantially. Consequently, should we still see (downstream) gains from demographic specialization for monolingual PLMs, we can be more confident that they stem from the injected demographic information.
| Gender | Age | ||||||
|---|---|---|---|---|---|---|---|
| Country | Model | AC | SA | TD | AC | SA | TD |
| Denmark | BERT | 65.0 | 70.4 | 59.9 | 66.5 | 66.0 | 56.3 |
| MLM | 65.1 | 70.3 | 60.6 | 67.4 | 67.6 | 57.6 | |
| DS-Seq | 65.2 | 70.6 | 60.0 | 67.1 | 67.1 | 56.5 | |
| DS-Tok | 65.1 | 70.6 | 60.8 | 67.2 | 67.2 | 56.7 | |
| Germany | BERT | 59.4 | 64.3 | 67.8 | 58.8 | 57.1 | 58.3 |
| MLM | 60.9 | 65.4 | 67.7 | 60.1 | 58.1 | 59.9 | |
| DS-Seq | 60.1 | 66.2 | 67.8 | 59.8 | 55.8 | 59.1 | |
| DS-Tok | 60.6 | 66.0 | 67.9 | 58.9 | 54.0 | 59.2 | |
| US | BERT | 61.5 | 67.1 | 71.0 | 64.1 | 57.2 | 67.2 |
| MLM | 61.7 | 67.8 | 71.3 | 64.1 | 60.4 | 66.7 | |
| DS-Seq | 61.6 | 68.0 | 71.6 | 65.2 | 59.4 | 67.1 | |
| DS-Tok | 62.1 | 67.9 | 71.6 | 64.3 | 59.4 | 66.7 | |
| UK | BERT | 64.1 | 72.3 | 70.1 | 65.8 | 65.5 | 68.0 |
| MLM | 64.3 | 72.6 | 70.0 | 66.5 | 66.9 | 70.0 | |
| DS-Seq | 64.2 | 72.4 | 70.2 | 65.9 | 67.6 | 69.4 | |
| DS-Tok | 64.1 | 72.2 | 70.3 | 66.0 | 67.1 | 69.2 | |
| France | BERT | 63.6 | 68.6 | 45.1 | 56.5 | 60.3 | 49.6 |
| MLM | 64.1 | 67.6 | 45.5 | 56.4 | 61.6 | 50.2 | |
| DS-Seq | 63.7 | 69.3 | 45.3 | 56.1 | 62.0 | 50.2 | |
| DS-Tok | 63.7 | 69.5 | 45.6 | 56.3 | 61.5 | 50.3 | |
| Average | BERT | 62.7 | 68.5 | 62.8 | 62.3 | 61.2 | 59.9 |
| MLM | 63.2 | 68.7 | 63.0 | 62.9 | 62.9 | 60.9 | |
| DS-Seq | 62.9 | 69.3 | 63.0 | 62.8 | 62.4 | 60.5 | |
| DS-Tok | 63.1 | 69.2 | 63.2 | 62.5 | 61.8 | 60.4 | |
| Task | Selected features | all | -D | -M | -S | -C | -A | |||
| gender | ||||||||||
| AC-SA |
|
0.51 | - | 0.56 | - | 0.63 | 0.62 | |||
| AC-TD |
|
0.51 | - | 0.73 | - | 0.54 | 0.66 | |||
| SA |
|
0.92 | 0.94 | 0.95 | 0.94 | 0.97 | 0.98 | |||
| TD |
|
0.33 | 0.36 | 0.35 | 0.34 | 0.35 | 0.40 | |||
| age | ||||||||||
| AC-SA |
|
1.93 | - | 1.98 | - | 2.31 | 2.02 | |||
| AC-TD |
|
0.68 | - | 0.69 | - | 1.02 | 0.82 | |||
| SA |
|
0.96 | 1.03 | 0.97 | 0.97 | 0.98 | 1.03 | |||
| TD |
|
1.52 | 1.53 | 1.53 | 1.55 | 1.61 | 1.54 | |||
Table 3 shows the effects of demographic specialization on monolingual PLMs of the four languages. For brevity (full results in the Appendix), we average the demographic attribute classification (AC) results from two different test portions from Table 2 (having labels for different downstream tasks, AC-SA and AC-TD); for extrinsic tasks, SA and TD, we report only the score on demographically balanced test sets (denoted “X” in Table 2). The results show that, when we control for language proficiency (as monolingual PLMs are more proficient in their respective language than mBERT), the downstream gains of demographic specialization (on SA and TD) vanish. The DS-Seq and DS-Tok still retain marginal numeric (statistically insignificant) gains over MLM in gender-based specialization, but they lag behind in age-based specialization. Also, both DS-* variants and MLM display only marginal gains with respect to vanilla monolingual BERT models of the four languages: e.g., in gender-specialization and for SA, DS-Tok has an average advantage of over the non-specialized vanilla monolingual BERTs; compare this to a gain of points that mBERT-based DS-Tok has over vanilla mBERT (Table 2). These results question the downstream usefulness of demographic specialization – suggested by findings from prior work Hovy (2015) and our results for multilingual PLMs (Table 2) – if one starts from the most proficient PLM for the concrete language at hand, i.e., a monolingual PLM.
Controlling for Domain Knowledge.
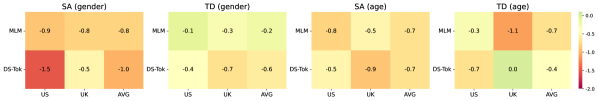
Both simple additional MLM-ing on Trustpilot data, as well as multi-task demographic specialization training (DS-* variants), inject knowledge about the domain-specific language of reviews into the PLM. As shown by previous work Glavaš et al. (2020); Diao et al. (2021); Hung et al. (2022a), domain adaptation generally leads to better downstream performance on in-domain data for any task. We next investigate to which extent the domain specialization is responsible for performance gains. To this end, we perform demographic specialization on (demographically labeled) training data from a different domain: for gender specialization, we use the RtGender (Voigt et al., 2018) consisting of social media posts collected from diverse sources, whereas for age specialization we resort to the Blog Authorship Corpus (BAC; Schler et al., 2006) containing blogposts from blogger.com.
Figure 1 displays the effects of out-of-domain specialization of BERT on downstream SA and TD performance (i.e., performance differences w.r.t. corresponding in-domain specialized models). Since RtGender and BAC are English-only datasets, we report the results only for US and UK (for brevity, we report the performance only on the demographically balanced test sets, i.e., setups indicated with “X” in Table 2; both DS-* variants exhibit very similar behavior, so for brevity, we only display results for DS-Tok; complete results are in the Appendix). Expectedly, the out-of-domain specialization deteriorates the downstream performance for both MLM and DS-Tok. Interestingly, MLM, which is not exposed explicitly to the demographic signal in specialization, tends to suffer less from out-of-domain specialization than the gender-informed DS-Tok. In contrast, age-informed DS-Tok seems to exhibit similar losses as MLM due to out-of-domain specialization. These results further question the hypothesis that demographic information guides downstream gains, suggested by prior work Hovy (2015) and our in-domain specialization results (with mBERT) from Table 2.
Meta-regression Analysis.
Next, we aim to quantify, via a meta-regression analysis, the contributions of individual factors (country, in-domain vs. out-of-domain specialization, language, specialization approach, test set structure) on the task performance (AC-SA, AC-TD, SA, TD). We use the difference in performance between the specialized model and its corresponding vanilla PLM (mBERT or monolingual PLM) as the label (i.e., output, dependent) variable for the regression. We use the following input features (all one-hot encoded) as prediction variables: (i) country/language of fine-tuning/evaluation data, (ii) specialization method (MLM vs. DS-Tok vs. DS-Seq), (iii) in-domain vs. out-of-domain specialization, (iv) whether the starting/vanilla PLM is monolingual (e.g., French BERT) or multilingual (mBERT), (v) and the demographic group from which the fine-tuning/evaluation data comes from (F vs. M vs. X for gender and <35 vs. >45 vs. X for age). We then fit a linear regressor on all data points, using either the full set of features or, in ablations, excluding certain subsets; we report the goodness of fit as average root mean square error (RMSE).
We summarize the results of our meta-regression analysis in Table 4. For each task, we list the selected features paired with the RMSE scores. When we fit regression using all features (all), the country of origin of fine-tuning data (i.e., features Denmark, France, UK, etc.) tends to overall explain the variance of specialization effect on model performance as good as or even better than the specialization approach (demographically-informed DS-* variants and demographically-uninformed MLM). The specialization approach features (MLM, DS-Tok, and DS-Seq), however, do appear among the most important features in most settings, suggesting that knowing the specialization approach does help predict the performance of the specialized model. Note, however, that in terms of assessing whether demographic information generally improves specialization, this needs to be combined with actual task performance results from Tables 2 and 3. For example, feature DS-Tok is among the most important features for SA performance after gender specialization: looking at the results for DS-Tok in both Tables 2 and 3, we see that it achieves, in most cases, scores above MLM – this, in turn, suggests that demographically-informed gender specialization does (regardless of other factors) improve the downstream SA performance. The ablation results offer a complementary view into the importance of individual features: the larger the increase in RMSE when excluding a feature (compared to using all features), the more important the feature is. The regressions in which we exclude the information on the specialization approach (-A) result in the highest RMSE for gender specialization on both extrinsic tasks (SA and TD). In all other setups (AC for both gender and age specialization, as well as SA and TD for age), there is another type of information, the removal of which results in a less predictable specialization effect: for instance, AC after age specialization, the -C setting increases the RMSE the most, representing that features indicating the demographic composition of the country factor of the fine-tuning dataset jointly have the largest effect on performance.
Combining results from Tables 2 and 3 with findings from the meta-regression analysis leads to the overall conclusion that gender-based language specialization of PLMs generally leads to downstream gains, whereas age-based specialization does not.
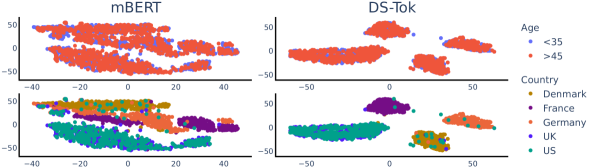
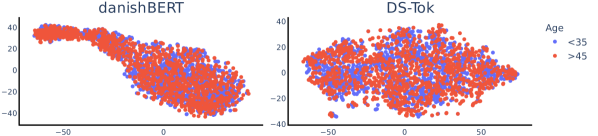
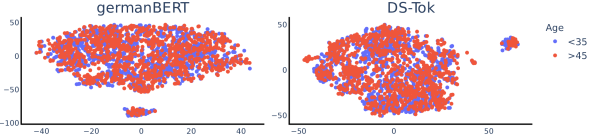
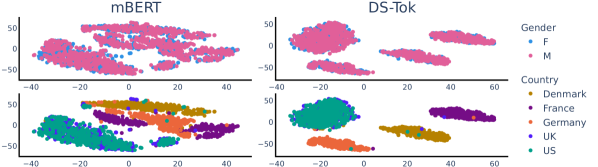
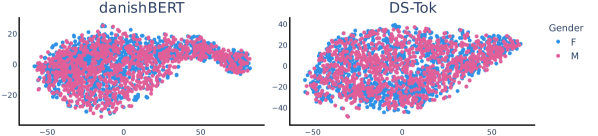
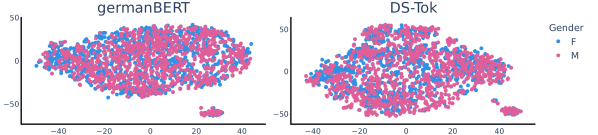
Qualitative Analysis. Finally, we analyze the topology of the PLMs representation space before and after demographic specialization. We encode the reviews from both demographic dimensions – (i) with the vanilla PLM (mBERT or monolingual BERT) and its DS-Tok specialized counterpart – and then compress those representations into two dimensions with t-distributed stochastic neighbor embedding (tSNE; van der Maaten and Hinton, 2008). Figure 2 depicts these representation spaces after gender-specialization (the age-specialization effects lead to similar conclusions; for brevity, we leave them for the Appendix). The tSNE plots do not show any salient gender specialization effect. In the case of mBERT, gender-specialization (corresponding DS-Tok plot) leads to the separation of representation areas according to review language and not gender of its author.666Note that the green and blue regions, indicating US and UK overlap due to shared language. In the monolingual cases (illustrated for Danish and German BERT), the space of the gender-specialized encoder visually largely resembles that of the vanilla one, indicating that the demographic specialization procedure (DS-Tok) does not impart dimensions that allow for easy separation of representation space along the specialization dimension (here: gender).
5 Related Work
Intermediate Training (Adaptation).
Intermediate language modeling on texts from the same or similar distribution as the downstream data has been shown to lead to improvements on various NLP tasks (e.g., Gururangan et al., 2020). During this process, the goal is to inject additional information into the PLM and thus specialize the model for a particular domain (e.g., Aharoni and Goldberg, 2020; Hung et al., 2022a; Bombieri et al., 2023) or language (e.g., Glavaš et al., 2020) or to encode other types of knowledge such as common sense knowledge (e.g., Lauscher et al., 2020a), argumentation knowledge (e.g., Holtermann et al., 2022), or geographic knowledge (e.g., Hofmann et al., 2022).
For instance, Hung et al. (2022a) propose a computationally efficient approach by employing domain-specific adapter modules. They show that their domain adaptation approach leads to improvements in task-oriented dialog. Glavaš et al. (2020) and Hung et al. (2022b) perform language adaptation through intermediate MLM in the target languages with filtered text corpora, demonstrating substantial gains in downstream zero-shot cross-lingual transfer for abusive language detection and dialog tasks, respectively. These specialization approaches mainly rely on a single objective (e.g., masked language modeling on “plain” text data). Instead, Hofmann et al. (2022) conduct geoadaptation by coupling MLM with a token-level geolocation prediction in a dynamic multi-task learning setup. In this work, we adopt a similar approach and perform continued language modeling on the text corpora of a specific demographic dimension.
Demographic Specialization.
Language preferences vary with user demographics (Loveys et al., 2018). Accordingly, several studies have leveraged demographic information (e.g., gender, age, education) to investigate the effect of encoded sociodemographic knowledge in the representations of PLMs (Lauscher et al., 2022a) or obtain better language representations for various NLP tasks (Volkova et al., 2013; Garimella et al., 2017). Recent research studies on demographic adaptation mainly focus on (1) learning demographic-aware word embeddings and do not work with large PLMs (Hovy, 2015) or (2) leveraging demographic information with special PLM architectures specifically designed for certain downstream tasks (e.g., empathy prediction (Guda et al., 2021)). The latter, however, do not consider a task-agnostic approach to injecting demographic knowledge into language models, and also focus on a monolingual setup only. Further, what roles the different factors (i.e., domain, language, demographic aspect) in the specialization really play remains unexplored.
6 Conclusion
In this work, we thoroughly examined the effects of demographic specialization of Transformers via straightforward injection methods that have been proven effective for other types of knowledge. Initial results on intrinsic and extrinsic evaluation tasks using a multilingual PLM indicated the usefulness of our approach. However, running a series of additional experiments in which we controlled for potentially confounding factors (language and domain) and a meta-analysis indicated that the demographic aspects only have a negligible impact on the downstream performance. This observation is supported by additional qualitative analysis. Overall, our findings point to the difficulty of injecting demographic knowledge into Transformers: we hope that our in-depth analysis and findings catalyze future research on the topic of truly human-centered NLP, especially in multilingual settings.
Acknowledgements
Chia-Chien Hung and Simone Paolo Ponzetto have been supported by the JOIN-T 2 project of the Deutsche Forschungsgemeinschaft (DFG). The work of Anne Lauscher and Dirk Hovy has been funded by the European Research Council (ERC) under the European Union’s Horizon 2020 research and innovation program (grant agreement No. 949944, INTEGRATOR). Anne Lauscher has been additionally supported by the Excellence Strategy of the German Federal Government and the Länder. Dirk Hovy is the Scientific director of the Data and Marketing Insights research unit at the Bocconi Institute for Data Science and Analysis. Goran Glavaš has been supported by the EUINACTION grant from NORFACE Governance (462-19-010, GL950/2-1). We thank the reviewers for their feedback.
Limitations
In this paper, we concentrated on the demographic adaptation of PLMs for a few key demographic aspects (i.e., gender and age). There are other known factors, like ethnicity and education, that we cannot explore here. However, there are likely further effects, as well as intersectional effects. We conducted our experiments using only five Western countries and four Indo-European languages (Hovy et al., 2015), ignoring other world regions and language families. However, due to the scarcity of data, we can only hypothesize that the limited effects of demographic specialization also apply to resource-lean languages (i.e., the language specialization effects are likely to outweigh the ones of the demographic specialization). Another limitation is the use of pretrained language models, which are all pre-trained on general-purpose data and are freely available. We acknowledge that results may differ for models with greater capacity that have been pretrained on data from other, more specific domains. We primarily concentrate on BERT-like models, which are only a subset of language models, and we leave language model variants for future research.
Ethics Statement
Our work deals with demographic adaptation from reviews that should be considered sensitive information. We acknowledge that the limitations in data resources and annotations (Schler et al., 2006; Hovy et al., 2015; Voigt et al., 2018) give rise to potential risks of overgeneralizing our findings and applying our methods. These risks are due to: (1) partial language coverage, where languages are from Indo-European subfamilies that do not represent typologically diverse languages; (2) limited cultural coverage (Joshi et al., 2020), where the countries, although speaking different languages, still belong a culturally relatively homogeneous part of the world, i.e., the West; (3) simplified gender identities (Dev et al., 2021), where gender is modeled as a binary variable, which does not reflect the wide variety of possible identities along the gender spectrum and beyond (Lauscher et al., 2022b); (4) unfair stereotypical biases (Blodgett et al., 2020), namely potential harms that might arise from unfair stereotypical biases in the data (despite our efforts to balance the sample across demographic groups) or pre-encoded in the model (Lauscher et al., 2021). Further, the sensitive user profile data might bias the model towards additional demographic characteristics and lead to potentially harmful predictions and applications.
In this work, however, we are interested in advancing NLP research to understand better this fine-grained aspect of the intertwined relationship between demographic adaptation and large pretrained language models in both monolingual and multilingual scenarios. While limited data resources may hinder our ability to fully consider language coverage, cultural coverage, gender identities, and stereotypical biases, it is our obligation to be transparent about these limitations and ethical concerns and to continually work towards improving data collection and methodologies to better serve the needs and perspectives of all users. We believe these insights will lead us toward fairer and more inclusive language technologies. We hope that future research builds on top of our findings and explores other demographic factors, other groups within these factors, and also other languages and countries.
References
- Aharoni and Goldberg (2020) Roee Aharoni and Yoav Goldberg. 2020. Unsupervised domain clusters in pretrained language models. In Proceedings of the 58th Annual Meeting of the Association for Computational Linguistics, pages 7747–7763, Online. Association for Computational Linguistics.
- Bamman et al. (2014) David Bamman, Chris Dyer, and Noah A. Smith. 2014. Distributed representations of geographically situated language. In Proceedings of the 52nd Annual Meeting of the Association for Computational Linguistics (Volume 2: Short Papers), pages 828–834, Baltimore, Maryland. Association for Computational Linguistics.
- Blodgett et al. (2020) Su Lin Blodgett, Solon Barocas, Hal Daumé III, and Hanna Wallach. 2020. Language (technology) is power: A critical survey of “bias” in NLP. In Proceedings of the 58th Annual Meeting of the Association for Computational Linguistics, pages 5454–5476, Online. Association for Computational Linguistics.
- Bombieri et al. (2023) Marco Bombieri, Marco Rospocher, Simone Paolo Ponzetto, and Paolo Fiorini. 2023. Machine understanding surgical actions from intervention procedure textbooks. Comput. Biol. Medicine, 152:106415.
- Buechel et al. (2018) Sven Buechel, Anneke Buffone, Barry Slaff, Lyle Ungar, and João Sedoc. 2018. Modeling empathy and distress in reaction to news stories. In Proceedings of the 2018 Conference on Empirical Methods in Natural Language Processing, pages 4758–4765, Brussels, Belgium. Association for Computational Linguistics.
- Conneau et al. (2020) Alexis Conneau, Kartikay Khandelwal, Naman Goyal, Vishrav Chaudhary, Guillaume Wenzek, Francisco Guzmán, Edouard Grave, Myle Ott, Luke Zettlemoyer, and Veselin Stoyanov. 2020. Unsupervised cross-lingual representation learning at scale. In Proceedings of the 58th Annual Meeting of the Association for Computational Linguistics, pages 8440–8451, Online. Association for Computational Linguistics.
- Dev et al. (2021) Sunipa Dev, Masoud Monajatipoor, Anaelia Ovalle, Arjun Subramonian, Jeff Phillips, and Kai-Wei Chang. 2021. Harms of gender exclusivity and challenges in non-binary representation in language technologies. In Proceedings of the 2021 Conference on Empirical Methods in Natural Language Processing, pages 1968–1994, Online and Punta Cana, Dominican Republic. Association for Computational Linguistics.
- Devlin et al. (2019) Jacob Devlin, Ming-Wei Chang, Kenton Lee, and Kristina Toutanova. 2019. BERT: Pre-training of deep bidirectional transformers for language understanding. In Proceedings of the 2019 Conference of the North American Chapter of the Association for Computational Linguistics: Human Language Technologies, Volume 1 (Long and Short Papers), pages 4171–4186, Minneapolis, Minnesota. Association for Computational Linguistics.
- Diao et al. (2021) Shizhe Diao, Ruijia Xu, Hongjin Su, Yilei Jiang, Yan Song, and Tong Zhang. 2021. Taming pre-trained language models with n-gram representations for low-resource domain adaptation. In Proceedings of the 59th Annual Meeting of the Association for Computational Linguistics and the 11th International Joint Conference on Natural Language Processing (Volume 1: Long Papers), pages 3336–3349, Online. Association for Computational Linguistics.
- Eckert and McConnell-Ginet (2013) Penelope Eckert and Sally McConnell-Ginet. 2013. Language and gender. Cambridge University Press.
- Garimella et al. (2017) Aparna Garimella, Carmen Banea, and Rada Mihalcea. 2017. Demographic-aware word associations. In Proceedings of the 2017 Conference on Empirical Methods in Natural Language Processing, pages 2285–2295, Copenhagen, Denmark. Association for Computational Linguistics.
- Glavaš et al. (2020) Goran Glavaš, Mladen Karan, and Ivan Vulić. 2020. XHate-999: Analyzing and detecting abusive language across domains and languages. In Proceedings of the 28th International Conference on Computational Linguistics, pages 6350–6365, Barcelona, Spain (Online). International Committee on Computational Linguistics.
- Guda et al. (2021) Bhanu Prakash Reddy Guda, Aparna Garimella, and Niyati Chhaya. 2021. EmpathBERT: A BERT-based framework for demographic-aware empathy prediction. In Proceedings of the 16th Conference of the European Chapter of the Association for Computational Linguistics: Main Volume, pages 3072–3079, Online. Association for Computational Linguistics.
- Gururangan et al. (2020) Suchin Gururangan, Ana Marasović, Swabha Swayamdipta, Kyle Lo, Iz Beltagy, Doug Downey, and Noah A. Smith. 2020. Don’t stop pretraining: Adapt language models to domains and tasks. In Proceedings of the 58th Annual Meeting of the Association for Computational Linguistics, pages 8342–8360, Online. Association for Computational Linguistics.
- Hofmann et al. (2022) Valentin Hofmann, Goran Glavaš, Nikola Ljubešić, Janet B Pierrehumbert, and Hinrich Schütze. 2022. Geographic adaptation of pretrained language models. arXiv preprint arXiv:2203.08565.
- Holtermann et al. (2022) Carolin Holtermann, Anne Lauscher, and Simone Ponzetto. 2022. Fair and argumentative language modeling for computational argumentation. In Proceedings of the 60th Annual Meeting of the Association for Computational Linguistics (Volume 1: Long Papers), pages 7841–7861, Dublin, Ireland. Association for Computational Linguistics.
- Hovy (2015) Dirk Hovy. 2015. Demographic factors improve classification performance. In Proceedings of the 53rd Annual Meeting of the Association for Computational Linguistics and the 7th International Joint Conference on Natural Language Processing (Volume 1: Long Papers), pages 752–762, Beijing, China. Association for Computational Linguistics.
- Hovy et al. (2015) Dirk Hovy, Anders Johannsen, and Anders Søgaard. 2015. User review sites as a resource for large-scale sociolinguistic studies. In Proceedings of the 24th international conference on World Wide Web, pages 452–461.
- Hung et al. (2022a) Chia-Chien Hung, Anne Lauscher, Simone Paolo Ponzetto, and Goran Glavaš. 2022a. DS-TOD: Efficient domain specialization for task-oriented dialog. In Findings of the Association for Computational Linguistics: ACL 2022, pages 891–904, Dublin, Ireland. Association for Computational Linguistics.
- Hung et al. (2022b) Chia-Chien Hung, Anne Lauscher, Ivan Vulić, Simone Ponzetto, and Goran Glavaš. 2022b. Multi2WOZ: A robust multilingual dataset and conversational pretraining for task-oriented dialog. In Proceedings of the 2022 Conference of the North American Chapter of the Association for Computational Linguistics: Human Language Technologies, pages 3687–3703, Seattle, United States. Association for Computational Linguistics.
- Joshi et al. (2020) Pratik Joshi, Sebastin Santy, Amar Budhiraja, Kalika Bali, and Monojit Choudhury. 2020. The state and fate of linguistic diversity and inclusion in the NLP world. In Proceedings of the 58th Annual Meeting of the Association for Computational Linguistics, pages 6282–6293, Online. Association for Computational Linguistics.
- Kendall et al. (2018) Alex Kendall, Yarin Gal, and Roberto Cipolla. 2018. Multi-task learning using uncertainty to weigh losses for scene geometry and semantics. In Proceedings of the IEEE conference on computer vision and pattern recognition, pages 7482–7491.
- Lauscher et al. (2022a) Anne Lauscher, Federico Bianchi, Samuel R. Bowman, and Dirk Hovy. 2022a. SocioProbe: What, when, and where language models learn about sociodemographics. In Proceedings of the 2022 Conference on Empirical Methods in Natural Language Processing, pages 7901–7918, Abu Dhabi, United Arab Emirates. Association for Computational Linguistics.
- Lauscher et al. (2022b) Anne Lauscher, Archie Crowley, and Dirk Hovy. 2022b. Welcome to the modern world of pronouns: Identity-inclusive natural language processing beyond gender. In Proceedings of the 29th International Conference on Computational Linguistics, pages 1221–1232, Gyeongju, Republic of Korea. International Committee on Computational Linguistics.
- Lauscher et al. (2018) Anne Lauscher, Goran Glavaš, Simone Paolo Ponzetto, and Kai Eckert. 2018. Investigating the role of argumentation in the rhetorical analysis of scientific publications with neural multi-task learning models. In Proceedings of the 2018 Conference on Empirical Methods in Natural Language Processing, pages 3326–3338, Brussels, Belgium. Association for Computational Linguistics.
- Lauscher et al. (2021) Anne Lauscher, Tobias Lueken, and Goran Glavaš. 2021. Sustainable modular debiasing of language models. In Findings of the Association for Computational Linguistics: EMNLP 2021, pages 4782–4797, Punta Cana, Dominican Republic. Association for Computational Linguistics.
- Lauscher et al. (2020a) Anne Lauscher, Olga Majewska, Leonardo F. R. Ribeiro, Iryna Gurevych, Nikolai Rozanov, and Goran Glavaš. 2020a. Common sense or world knowledge? investigating adapter-based knowledge injection into pretrained transformers. In Proceedings of Deep Learning Inside Out (DeeLIO): The First Workshop on Knowledge Extraction and Integration for Deep Learning Architectures, pages 43–49, Online. Association for Computational Linguistics.
- Lauscher et al. (2020b) Anne Lauscher, Vinit Ravishankar, Ivan Vulić, and Goran Glavaš. 2020b. From zero to hero: On the limitations of zero-shot language transfer with multilingual Transformers. In Proceedings of the 2020 Conference on Empirical Methods in Natural Language Processing (EMNLP), pages 4483–4499, Online. Association for Computational Linguistics.
- Liu et al. (2019) Yinhan Liu, Myle Ott, Naman Goyal, Jingfei Du, Mandar Joshi, Danqi Chen, Omer Levy, Mike Lewis, Luke Zettlemoyer, and Veselin Stoyanov. 2019. Roberta: A robustly optimized bert pretraining approach. arXiv preprint arXiv:1907.11692.
- Loshchilov and Hutter (2019) Ilya Loshchilov and Frank Hutter. 2019. Decoupled weight decay regularization. In International Conference on Learning Representations.
- Loveys et al. (2018) Kate Loveys, Jonathan Torrez, Alex Fine, Glen Moriarty, and Glen Coppersmith. 2018. Cross-cultural differences in language markers of depression online. In Proceedings of the Fifth Workshop on Computational Linguistics and Clinical Psychology: From Keyboard to Clinic, pages 78–87, New Orleans, LA. Association for Computational Linguistics.
- Pfeiffer et al. (2020) Jonas Pfeiffer, Ivan Vulić, Iryna Gurevych, and Sebastian Ruder. 2020. MAD-X: An Adapter-Based Framework for Multi-Task Cross-Lingual Transfer. In Proceedings of the 2020 Conference on Empirical Methods in Natural Language Processing (EMNLP), pages 7654–7673, Online. Association for Computational Linguistics.
- Schler et al. (2006) Jonathan Schler, Moshe Koppel, Shlomo Argamon, and James W Pennebaker. 2006. Effects of age and gender on blogging. In AAAI Spring Symposium: Computational Approaches to Analyzing Weblogs.
- Trudgill (2000) Peter Trudgill. 2000. Sociolinguistics: An introduction to language and society. Penguin UK.
- van der Maaten and Hinton (2008) Laurens van der Maaten and Geoffrey Hinton. 2008. Visualizing data using t-sne. Journal of Machine Learning Research, 9(86):2579–2605.
- Vaswani et al. (2017) Ashish Vaswani, Noam Shazeer, Niki Parmar, Jakob Uszkoreit, Llion Jones, Aidan N. Gomez, Lukasz Kaiser, and Illia Polosukhin. 2017. Attention is all you need. In Advances in Neural Information Processing Systems 30: Annual Conference on Neural Information Processing Systems 2017, December 4-9, 2017, Long Beach, CA, USA, pages 5998–6008.
- Voigt et al. (2018) Rob Voigt, David Jurgens, Vinodkumar Prabhakaran, Dan Jurafsky, and Yulia Tsvetkov. 2018. RtGender: A corpus for studying differential responses to gender. In Proceedings of the Eleventh International Conference on Language Resources and Evaluation (LREC 2018), Miyazaki, Japan. European Language Resources Association (ELRA).
- Volkova et al. (2013) Svitlana Volkova, Theresa Wilson, and David Yarowsky. 2013. Exploring demographic language variations to improve multilingual sentiment analysis in social media. In Proceedings of the 2013 Conference on Empirical Methods in Natural Language Processing, pages 1815–1827, Seattle, Washington, USA. Association for Computational Linguistics.
- Wang et al. (2018) Alex Wang, Amanpreet Singh, Julian Michael, Felix Hill, Omer Levy, and Samuel Bowman. 2018. GLUE: A multi-task benchmark and analysis platform for natural language understanding. In Proceedings of the 2018 EMNLP Workshop BlackboxNLP: Analyzing and Interpreting Neural Networks for NLP, pages 353–355, Brussels, Belgium. Association for Computational Linguistics.
- Welch et al. (2020) Charles Welch, Jonathan K. Kummerfeld, Verónica Pérez-Rosas, and Rada Mihalcea. 2020. Compositional demographic word embeddings. In Proceedings of the 2020 Conference on Empirical Methods in Natural Language Processing (EMNLP), pages 4076–4089, Online. Association for Computational Linguistics.
Appendix A Additional Experiments
| Gender class. | SA | TD | |||||||||||||||
| AC-SA | AC-TD | F | M | X | F | M | X | F | M | X | F | M | X | ||||
| Country | Model | Mono | Multi | Mono | Multi | Mono | Multi | Mono | Multi | ||||||||
| Denmark | BERT | 66.1 | 64.0 | 63.8 | 61.8 | 72.3 | 67.9 | 70.4 | 69.2 | 64.8 | 67.2 | 60.7 | 59.8 | 59.9 | 59.3 | 58.3 | 59.0 |
| MLM | 66.0 | 65.2 | 64.2 | 63.4 | 72.5 | 68.3 | 70.3 | 69.5 | 65.8 | 67.8 | 60.6 | 60.6 | 60.6 | 59.7 | 58.8 | 59.4 | |
| DS-Seq | 66.2 | 64.9 | 64.1 | 63.5 | 72.6 | 68.6 | 70.6 | 69.9 | 65.7 | 67.7 | 61.3 | 60.5 | 60.0 | 59.7 | 57.8 | 59.1 | |
| DS-Tok | 66.0 | 65.0 | 64.1 | 63.5 | 72.4 | 68.4 | 70.6 | 69.1 | 65.6 | 68.0 | 61.1 | 60.2 | 60.8 | 59.9 | 58.9 | 59.0 | |
| Germany | BERT | 59.8 | 59.5 | 58.9 | 57.9 | 66.5 | 63.7 | 64.3 | 66.1 | 63.2 | 64.5 | 67.9 | 66.1 | 67.8 | 67.8 | 65.6 | 65.8 |
| MLM | 62.0 | 61.2 | 59.7 | 60.1 | 68.1 | 65.8 | 65.4 | 67.7 | 65.3 | 66.1 | 68.5 | 66.7 | 67.7 | 68.6 | 67.0 | 67.1 | |
| DS-Seq | 61.1 | 60.1 | 59.0 | 60.3 | 68.8 | 64.4 | 66.2 | 66.7 | 64.0 | 65.7 | 68.9 | 66.4 | 67.8 | 67.6 | 65.7 | 66.4 | |
| DS-Tok | 60.9 | 62.9 | 60.3 | 58.3 | 67.9 | 65.6 | 66.0 | 66.8 | 64.3 | 66.8 | 68.6 | 66.8 | 67.9 | 68.3 | 67.0 | 66.7 | |
| US | BERT | 64.3 | 62.6 | 58.7 | 58.1 | 68.6 | 67.0 | 67.1 | 66.3 | 64.4 | 66.0 | 72.5 | 69.7 | 71.0 | 71.2 | 68.4 | 70.2 |
| MLM | 64.6 | 63.3 | 58.7 | 59.6 | 68.4 | 67.6 | 67.8 | 67.3 | 66.2 | 66.9 | 73.1 | 70.1 | 71.3 | 72.1 | 69.4 | 70.3 | |
| DS-Seq | 64.3 | 63.8 | 58.8 | 59.2 | 68.6 | 68.0 | 68.0 | 67.2 | 66.3 | 67.0 | 73.1 | 70.3 | 71.6 | 72.3 | 69.2 | 70.4 | |
| DS-Tok | 64.7 | 62.2 | 59.4 | 58.8 | 68.9 | 67.5 | 67.9 | 68.0 | 66.4 | 67.3 | 73.3 | 69.9 | 71.6 | 72.8 | 69.5 | 70.5 | |
| UK | BERT | 63.2 | 61.9 | 65.0 | 63.1 | 73.4 | 71.0 | 72.3 | 71.0 | 69.0 | 69.7 | 71.2 | 69.1 | 70.1 | 70.4 | 67.9 | 68.9 |
| MLM | 63.7 | 63.0 | 64.8 | 65.3 | 73.9 | 71.0 | 72.6 | 72.0 | 70.4 | 71.0 | 71.2 | 69.4 | 70.0 | 70.6 | 67.9 | 69.8 | |
| DS-Seq | 63.2 | 63.4 | 65.2 | 64.9 | 73.6 | 72.2 | 72.4 | 72.9 | 70.9 | 71.7 | 71.5 | 69.3 | 70.2 | 70.6 | 68.2 | 69.8 | |
| DS-Tok | 63.3 | 63.5 | 64.8 | 65.6 | 73.7 | 72.0 | 72.2 | 73.0 | 71.0 | 71.9 | 71.4 | 69.1 | 70.3 | 70.8 | 68.2 | 69.9 | |
| France | BERT | 64.1 | 63.9 | 63.1 | 61.2 | 70.5 | 67.3 | 68.6 | 69.3 | 67.0 | 67.8 | 46.0 | 44.5 | 45.1 | 44.6 | 42.4 | 43.1 |
| MLM | 64.9 | 64.6 | 63.2 | 62.1 | 71.0 | 67.7 | 67.6 | 69.9 | 67.1 | 68.4 | 46.2 | 44.3 | 45.5 | 45.8 | 43.3 | 44.3 | |
| DS-Seq | 64.2 | 64.1 | 63.1 | 63.1 | 70.5 | 67.5 | 69.3 | 70.6 | 67.3 | 68.4 | 47.1 | 44.2 | 45.3 | 46.0 | 43.4 | 44.2 | |
| DS-Tok | 64.4 | 65.0 | 62.9 | 62.9 | 71.7 | 68.3 | 69.5 | 70.1 | 67.5 | 68.8 | 46.9 | 44.3 | 45.6 | 45.5 | 43.9 | 44.4 | |
| Average | BERT | 63.5 | 62.4 | 61.9 | 60.4 | 70.3 | 67.4 | 68.5 | 68.4 | 65.7 | 67.0 | 63.7 | 61.8 | 62.8 | 62.7 | 60.5 | 61.4 |
| MLM | 64.2 | 63.5 | 62.1 | 62.1 | 70.8 | 68.1 | 68.7 | 69.3 | 67.0 | 68.0 | 63.9 | 62.2 | 63.0 | 63.4 | 61.3 | 62.2 | |
| DS-Seq | 63.8 | 63.3 | 62.0 | 62.2 | 70.8 | 68.1 | 69.3 | 69.5 | 66.8 | 68.1 | 64.4 | 62.1 | 63.0 | 63.2 | 60.9 | 62.0 | |
| DS-Tok | 63.9 | 63.7 | 62.3 | 61.8 | 70.9 | 68.4 | 69.2 | 69.4 | 67.0 | 68.6 | 64.3 | 62.1 | 63.2 | 63.5 | 61.5 | 62.1 | |
| Age class. | SA | TD | |||||||||||||||
| AC-SA | AC-TD | <35 | >45 | X | <35 | >45 | X | <35 | >45 | X | <35 | >45 | X | ||||
| Country | Model | Mono | Multi | Mono | Multi | Mono | Multi | Mono | Multi | ||||||||
| Denmark | BERT | 67.7 | 57.2 | 65.3 | 64.5 | 67.3 | 66.2 | 66.0 | 62.7 | 62.7 | 62.9 | 58.4 | 54.4 | 56.3 | 56.1 | 52.2 | 53.4 |
| MLM | 67.4 | 65.5 | 67.4 | 65.1 | 67.7 | 67.3 | 67.6 | 63.3 | 62.1 | 63.0 | 59.3 | 55.3 | 57.6 | 57.1 | 52.6 | 54.1 | |
| DS-Seq | 67.4 | 65.2 | 66.8 | 65.2 | 67.4 | 66.2 | 67.1 | 63.1 | 62.9 | 63.0 | 58.7 | 55.0 | 56.5 | 56.9 | 53.3 | 54.5 | |
| DS-Tok | 67.8 | 65.3 | 66.6 | 64.6 | 67.6 | 66.1 | 67.2 | 64.2 | 63.3 | 63.2 | 59.0 | 55.4 | 56.7 | 56.2 | 53.2 | 54.3 | |
| Germany | BERT | 57.9 | 58.0 | 59.6 | 56.9 | 53.6 | 57.9 | 57.1 | 52.6 | 55.0 | 55.0 | 61.6 | 57.4 | 58.3 | 60.1 | 55.3 | 57.1 |
| MLM | 58.1 | 61.1 | 62.0 | 58.9 | 58.1 | 58.2 | 58.1 | 53.6 | 55.5 | 56.7 | 62.2 | 57.6 | 59.9 | 61.5 | 56.5 | 58.7 | |
| DS-Seq | 58.2 | 56.4 | 61.3 | 58.2 | 56.3 | 57.3 | 55.8 | 53.8 | 55.3 | 55.5 | 63.5 | 57.9 | 59.1 | 60.8 | 57.6 | 59.3 | |
| DS-Tok | 57.2 | 56.6 | 60.6 | 57.4 | 57.9 | 58.1 | 54.0 | 53.0 | 56.5 | 56.7 | 63.5 | 58.2 | 59.2 | 59.3 | 56.5 | 59.3 | |
| US | BERT | 65.2 | 62.9 | 63.0 | 60.7 | 60.5 | 58.7 | 57.2 | 57.7 | 57.9 | 57.8 | 68.8 | 64.9 | 67.2 | 68.0 | 64.3 | 64.3 |
| MLM | 65.3 | 63.6 | 62.9 | 61.9 | 59.8 | 59.5 | 60.4 | 59.4 | 57.8 | 58.2 | 71.2 | 65.7 | 66.7 | 69.0 | 64.2 | 65.2 | |
| DS-Seq | 66.2 | 60.7 | 64.1 | 61.5 | 61.6 | 58.3 | 59.4 | 59.3 | 57.9 | 58.0 | 72.5 | 65.5 | 67.1 | 69.8 | 64.4 | 65.8 | |
| DS-Tok | 65.7 | 59.7 | 62.9 | 61.2 | 61.1 | 58.7 | 59.4 | 59.9 | 58.6 | 57.8 | 69.4 | 65.7 | 66.7 | 69.2 | 65.4 | 64.9 | |
| UK | BERT | 65.7 | 65.1 | 65.8 | 65.2 | 65.2 | 66.3 | 65.5 | 63.8 | 63.9 | 63.7 | 68.1 | 68.1 | 68.0 | 64.7 | 67.1 | 66.3 |
| MLM | 66.9 | 65.4 | 66.1 | 65.6 | 68.2 | 67.2 | 66.9 | 62.8 | 62.0 | 63.0 | 68.8 | 70.1 | 70.0 | 65.1 | 67.3 | 67.3 | |
| DS-Seq | 67.0 | 65.3 | 64.7 | 62.8 | 67.8 | 66.4 | 67.6 | 63.8 | 64.9 | 64.9 | 67.8 | 68.9 | 69.4 | 66.0 | 68.1 | 66.5 | |
| DS-Tok | 66.8 | 64.0 | 65.2 | 62.8 | 67.6 | 66.5 | 67.1 | 64.6 | 65.2 | 65.1 | 68.2 | 69.6 | 69.2 | 66.4 | 67.3 | 67.6 | |
| France | BERT | 56.0 | 55.7 | 57.0 | 56.6 | 59.7 | 57.5 | 60.3 | 59.6 | 57.4 | 61.5 | 51.9 | 49.1 | 49.6 | 52.0 | 47.1 | 49.0 |
| MLM | 55.9 | 56.8 | 56.9 | 57.2 | 60.7 | 59.4 | 61.6 | 59.9 | 59.5 | 61.6 | 53.8 | 48.5 | 50.2 | 52.5 | 47.2 | 50.3 | |
| DS-Seq | 55.5 | 55.1 | 56.7 | 55.5 | 61.3 | 58.7 | 62.0 | 60.4 | 60.3 | 62.8 | 53.8 | 49.0 | 50.2 | 51.1 | 47.3 | 50.3 | |
| DS-Tok | 55.8 | 54.4 | 56.7 | 55.9 | 60.2 | 60.7 | 61.5 | 60.9 | 59.8 | 59.7 | 54.6 | 51.4 | 50.3 | 50.2 | 48.0 | 50.8 | |
| Average | BERT | 62.5 | 59.8 | 62.1 | 60.8 | 61.3 | 61.3 | 61.2 | 59.3 | 59.4 | 60.2 | 61.8 | 58.8 | 59.9 | 60.2 | 57.2 | 58.0 |
| MLM | 62.7 | 62.5 | 63.1 | 61.7 | 62.9 | 62.3 | 62.9 | 59.8 | 59.4 | 60.5 | 63.1 | 59.4 | 60.9 | 61.0 | 57.6 | 59.1 | |
| DS-Seq | 62.9 | 60.5 | 62.7 | 60.6 | 62.9 | 61.4 | 62.4 | 60.1 | 60.3 | 60.8 | 63.3 | 59.3 | 60.5 | 60.9 | 58.1 | 59.3 | |
| DS-Tok | 62.7 | 60.0 | 62.4 | 60.4 | 62.9 | 62.0 | 61.8 | 60.5 | 60.7 | 60.5 | 62.9 | 60.1 | 60.4 | 60.3 | 58.1 | 59.4 | |
| SA | TD | ||||||||||||
| gender | F | M | X | F | M | X | F | M | X | F | M | X | |
| Country | Model | RtGender | Trustpilot | RtGender | Trustpilot | ||||||||
| US | MLM | 68.3 | 67.3 | 66.9 | 68.4 | 67.6 | 67.8 | 72.7 | 69.9 | 71.1 | 73.1 | 70.1 | 71.3 |
| DS-Seq | 68.1 | 67.4 | 66.9 | 68.6 | 68.0 | 68.0 | 72.7 | 69.3 | 71.2 | 73.1 | 70.3 | 71.6 | |
| DS-Tok | 68.6 | 67.2 | 66.4 | 68.9 | 67.5 | 67.9 | 72.4 | 69.6 | 71.2 | 73.3 | 69.9 | 71.6 | |
| UK | MLM | 73.3 | 71.0 | 71.7 | 73.9 | 71.0 | 72.6 | 71.1 | 69.3 | 69.8 | 71.2 | 69.4 | 70.0 |
| DS-Seq | 73.3 | 71.1 | 71.9 | 73.6 | 72.2 | 72.4 | 71.2 | 69.0 | 69.5 | 71.5 | 69.3 | 70.2 | |
| DS-Tok | 73.4 | 71.1 | 71.6 | 73.7 | 72.0 | 72.2 | 71.3 | 69.2 | 69.6 | 71.4 | 69.1 | 70.3 | |
| Average | MLM | 70.8 | 69.2 | 69.3 | 71.2 | 69.3 | 70.2 | 71.9 | 69.6 | 70.5 | 72.2 | 69.8 | 70.7 |
| DS-Seq | 70.7 | 69.3 | 69.4 | 71.1 | 70.1 | 70.2 | 72.0 | 69.2 | 70.4 | 72.3 | 69.8 | 70.9 | |
| DS-Tok | 71.0 | 69.2 | 69.0 | 71.3 | 69.8 | 70.1 | 71.9 | 69.4 | 70.4 | 72.4 | 69.5 | 71.0 | |
| SA | TD | ||||||||||||
| age | <35 | >45 | X | <35 | >45 | X | <35 | >45 | X | <35 | >45 | X | |
| Country | Model | BAC | Trustpilot | BAC | Trustpilot | ||||||||
| US | MLM | 59.4 | 58.4 | 58.9 | 59.8 | 59.5 | 60.4 | 68.4 | 64.6 | 66.9 | 71.2 | 65.7 | 66.7 |
| DS-Seq | 58.4 | 57.3 | 58.0 | 61.6 | 58.3 | 59.4 | 68.6 | 64.5 | 67.3 | 72.5 | 65.5 | 67.1 | |
| DS-Tok | 58.6 | 58.5 | 58.9 | 61.1 | 58.7 | 59.4 | 69.3 | 65.0 | 67.1 | 69.4 | 65.7 | 66.7 | |
| UK | MLM | 66.2 | 66.7 | 66.4 | 68.2 | 67.2 | 66.9 | 67.8 | 68.7 | 68.9 | 68.8 | 70.1 | 70.0 |
| DS-Seq | 66.1 | 66.6 | 66.8 | 67.8 | 66.4 | 67.6 | 67.8 | 68.7 | 68.6 | 67.8 | 68.9 | 69.4 | |
| DS-Tok | 66.6 | 66.0 | 66.3 | 67.6 | 66.5 | 67.1 | 68.0 | 68.8 | 69.2 | 68.2 | 69.6 | 69.2 | |
| Average | MLM | 62.8 | 62.6 | 62.7 | 64.0 | 63.4 | 63.7 | 68.1 | 66.7 | 67.9 | 70.0 | 67.9 | 68.4 |
| DS-Seq | 62.3 | 62.0 | 62.4 | 64.7 | 62.4 | 63.5 | 68.2 | 66.6 | 68.0 | 70.2 | 67.2 | 68.3 | |
| DS-Tok | 62.6 | 62.3 | 62.6 | 64.4 | 62.6 | 63.3 | 68.7 | 66.9 | 68.2 | 68.8 | 67.7 | 68.0 | |