K-clique percolation in human structural connectome
Abstract
In this study, we discuss communities of densely connected structures and -clique percolation phenomenon as related to the human structural connectome. We observe the existence of -clique communities of high orders. The comparison of connectomes shows that individual connections form a bulk of large -clique communities and are critical for -clique percolation phenomena. We have also shown the existence of a subnetwork of more frequent connections, considered as a core, which plays a key role in the formation of large-order cliques, connectivity within communities of such structures and their sustainability. The Erdős–Rényi model, for which the -clique percolation phenomenon is well described, was shown to be inconsistent with modeling the formation of -clique communities in the human structural connectome.
1 Introduction
Network science approach based on graph theory is increasingly used in brain research [1, 2, 3]. The anatomical and functional connection networks of the human brain may be studied using network theory techniques and terminology. The structural connectome in this representation refers to the brain’s anatomical connection network, where small regions of gray matter are referred to as nodes. Two nodes are connected by an edge, if a diffusion-MRI based workflow identifies axon fibers connecting those small gray matter regions in the brain’s white matter [4, 5]. Complex networks tend to exhibit meso-scale or global structural features. Certain networks exhibit community structure, in which densely connected communities of nodes exhibit sparse or weak inter-community connections [6, 7]. In structural connectome, one node can belong to several communities, thus, standard community detection methods are not applicable. We investigated the community organization of human connectomes, focusing on data described in [8].
2 Data description
Following the release of data from the Human Connectome Project [9], imaging data from people aged to years old were collected and converted into high resolution structural connectomes [8].
Brain regions differ in their anatomical and functional properties. The division of subcortical structures in anatomical atlases is mostly congruent with the brain’s anatomical structure. However, depending on the approach, the parcellation of the neocortex into ROIs can vary [5, 4]. At the same time, some subcortical structures have connections to many different areas of the brain. As a result, in network representation, the corresponding vertices are often hubs. We investigated network structure in the context of hub selection and its relationship to anatomical regions. We identified a densely connected subnet with all of its vertices representing hubs and belonging to subcortical structures. This densely connected subnetwork was excluded from further analyses for the entire ensemble of networks.
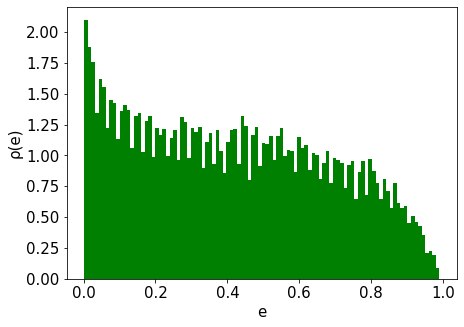
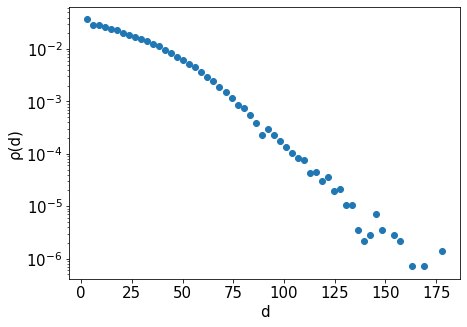
We used a methodology similar to that suggested in [2, 10] to determine the edge confidence. Regardless of a network, the weight of an edge was calculated as the probability of occurrence of this edge in the entire set of networks. Edge weights are determined in this way to reflect the gradation from the most common connections in the brain network to the most individual ones. For networks in the set the edge distribution with respect to the confidence value is broad and uniform, with a characteristic peak for the weakest connections, and decline for the most common connections in the population (Fig. 1a). The degree distribution of networks follows a power law with a slight flattening for small values (Fig. 1b), commonly referred to as the scale-free architecture [11] which is common to natural networks [12].
3 K-clique percolation
We begin with a few definitions laying down the fundamentals of k-clique percolation [13, 14]. K-clique is a complete (fully connected) subgraph on k vertices. Two k-cliques are said to be adjacent if they have exactly common vertices, i.e., if they differ only in a single vertex. A subgraph, which is the union of a sequence of pairwise adjacent k-cliques, is called k-clique chain and two k-cliques are k-clique-connected, if there exists at least one k-clique chain containing these two k-cliques. Finally, k-clique percolation cluster is defined as a maximal k-clique-connected subgraph, i.e. it is the union of all k-cliques that are k-clique-connected to a particular one k-clique.
Erdosh–Renyi random graphs show a series of interesting transitions when the probability of two nodes being connected is increased. For the transition is well known and manifested by the appearance of a giant component in a network at critical probability , where is the number of nodes. For each one can find a certain threshold probability above which the k-cliques organize into a giant community [14]:
4 Results
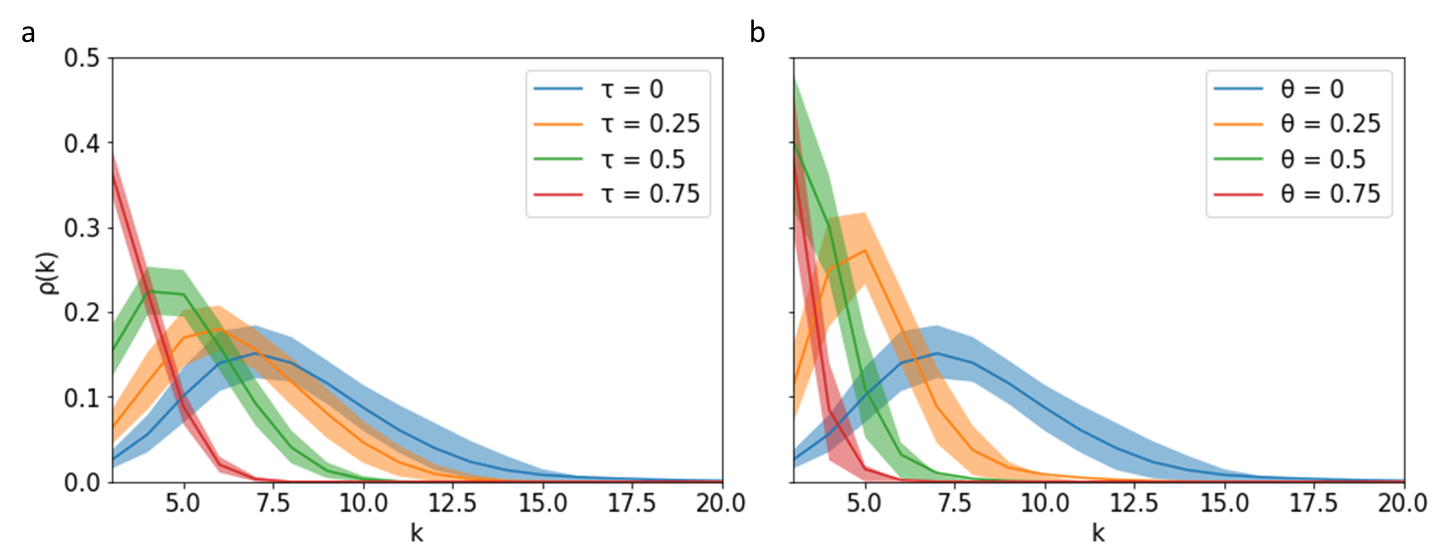
We started with the analysis of clique size distribution in structural connectomes. To reveal the dependence of characteristic clique order on the edge confidence, we considered the process of network decomposition, i.e. we took a threshold for edge confidence and deleted all links of weights less than the threshold. We also considered the inverse decomposition, in which we established a threshold theta for edge confidence and deleted all connections of weights more or equal than the value , i.e. we analyzed a subgraph of weak (individual) links. Fig. 3 shows clique size distributions in networks for different values of the tau and theta thresholds.
For networks in the initial state, the characteristic clique size varies within and reaches in the heavy right tail of the distribution (Fig. 2a). In the process of decomposition, the distribution shifts to a much smaller clique size () with the simultaneous disappearance of heavy tails. The distribution dynamics suggests that predominantly light connections are involved in the formation of high-order cliques, which is also consistent with the distribution dynamics in the process of inverse decomposition (Fig. 2b). With an increase in the theta threshold value, the distribution shifts from the characteristic clique size of about towards the distribution in the initial state of the network, which is almost the opposite to the dynamics in the decomposition process.
Despite the conclusion that light connections are critical for the formation of high-order cliques, which can be concluded from the analysis of the clique size distribution dynamic, it does not imply their behavior in the formation of connections between densely connected structures and clique communities.
We analyzed -clique community clusters depending on the edge confidence. Fig. 3a shows the fraction of nodes included in the -clique community cluster of depending on the threshold tau in the process of decomposition of connectome networks. We observe that -clique community clusters of higher order ( and ) exist only for initial network state and almost disappear at a small threshold. Percolation clusters for and include most of the network up to sufficiently high threshold tau, indicating the stability of network community organization (Fig. 3a,c). Moreover, for and , the percolation cluster in the initial state of the network includes vertices from both hemispheres, which implies hemispheric connections by cliques of order up to . For a percolation cluster at , the hemisphere binding structure decomposes at , while high-order percolation clusters initially appear only within the hemisphere (Fig. 2a).
To reveal the role of the edge confidence in the stability of a percolation cluster, we conducted a similar experiment on the same percolation clusters extracted from the sample of networks, but with randomly mixed values of the edge confidence (Fig. 3a,c). We repeated the procedure on percolation subnetworks with shuffled weights, that corresponds to the random removal of edges in the same proportion as for the original networks on each step of the simulation. We observed that the percolation structure decomposes much faster and loses stability even for small clique orders. The observed differences in the decomposition dynamics confirm the predominant importance of light connections in the formation of the percolation clique cluster and maintaining its stability.
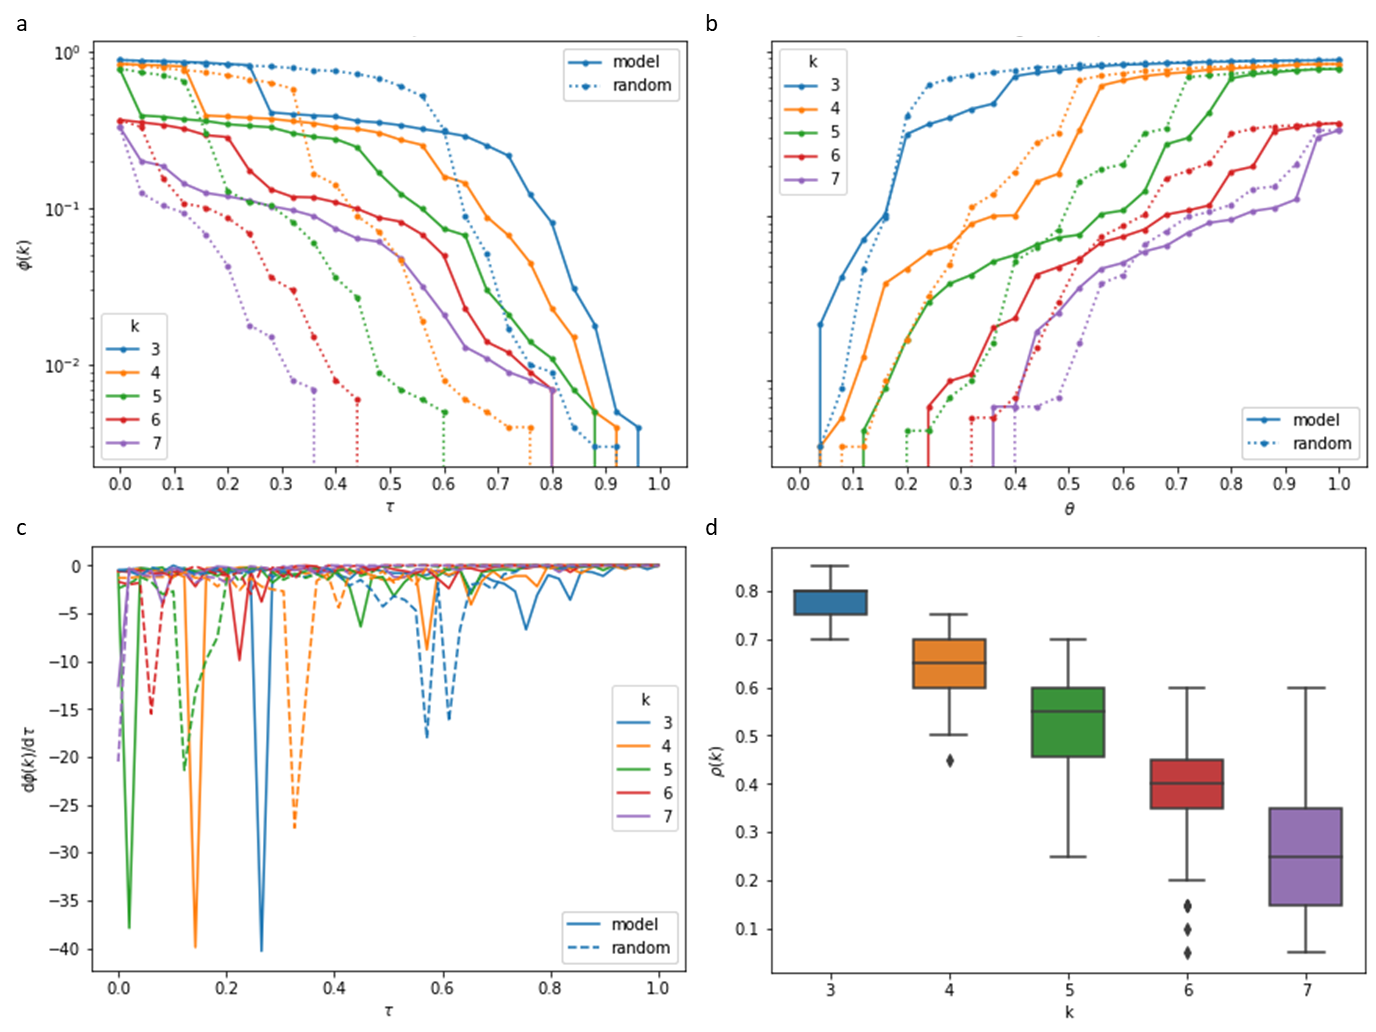
In the inverse decomposition process, that is the restoration of the cluster by adding connections that satisfy the threshold condition, for small orders () most of the -clique percolation cluster appears already at low values of the -threshold, after which the cluster gradually grows to its initial size (Fig. 3b). However, for higher orders () the size of the clique percolation cluster begins to grow noticeably only at large values of the theta, that is, when sufficiently heavy connections start to appear. Interestingly, the addition of random edges is more effective in increasing the size of the clique percolation cluster in the inverse decomposition process, as can be seen from a comparison of the growth dynamics (Fig. 3b).
From the observed difference in the dynamics of the original networks and networks with mixed weights in the processes of both direct and inverse decomposition, we can conclude the existence of a subnetwork that consists of heavier connections, which can be considered as a core, and plays a non-trivial role in the connectivity within the community of densely connected structures. During the clique percolation cluster decomposition, core may not manifest itself up to high values of the -threshold, maintaining the stability of internal connectivity up to the point of abrupt volume decay, whereas the majority of the -clique percolation cluster volume is initially formed by weak connections. At the same time, the inverse decomposition demonstrates the particular significance of this subnet in the formation of connectivity within clique communities of large orders (starting from ). These findings are consistent with the observed changes in the clique size distributions when the threshold is varied (Fig. 2). A significant number of small order cliques, provided by light connections, start to form cliques of a higher order and create communities only with the appearance of connections related to core.
For -clique percolation clusters of small orders, a narrow scatter of destruction threshold values is observed over the entire sample of networks (Fig. 3d). Taking into account that the value of the destruction threshold for small varies around , which corresponds to the preservation of a small part of the initial subnet, we can say that the destruction threshold is typical for the entire network set and may be associated with manifestations of the core connections destruction. As the order increases, the spread of the destruction threshold widens (Fig. 3d), which indicates the heterogeneity of the structural connectome networks properties, which ensure the stability of high-order communities on densely connected structures.
We also discovered that the hemispheric network density, i.e. the observed probability of connection, satisfies . That is, if the connections within the network of hemispheres were formed randomly according to an architecture rule similar to the Erdős–Rényi model, then most of the vertices would be included in the percolation cluster at and high-order clique percolation clusters would not be formed, while we observe the formation of percolation clique clusters of significantly higher orders.
5 Discussion
We used network science approach to analyze the organization of densely connected communities in networks of human structural connectomes. Associating the weight of an edge with the probability of such connection occurring in a connectome set results in gradation from the most common connections of the brain network to the most individual ones. We found a non-trivial dependence of the edge confidence and its role in the formation of densely connected structures of different orders, connectivity within communities of such structures and its resistance to decomposition. The obtained results indicate the existence of a subnetwork, defined as core, which connections are necessary for both the formation of large-order cliques and the connectivity between them. At the same time the bulk of large connected clique communities volume consisting of small cliques is formed by light connections, that is, the most individual for brain networks.
In each individual structural brain network, we observed the formation of percolation clique clusters of different order. High-order clusters are predominantly formed within the hemisphere, while low-order clusters can cover most of the brain network in both hemispheres simultaneously. The formation of high-order percolation clusters confirms the complexity of the brain network structure and the densely connected communities within. This also points to the inconsistency of existing models in describing the formation of densely connected communities and their organization within structural connectomes. Such structures can participate in the functional organization of the network, influencing the phenomena of synchronization and diffusion processes within the network. One of the open research areas is the development of models that share the characteristics of natural networks and, at the same time, have similar properties of functional organization. For the corresponding model, a more detailed study of the core network properties is required. The role of the core in structural organization and community formation also requires further clarification, as does the effect on functional phenomena such as synchronization or informational diffusion.
References
- 1. Marco Guerra et al. “Homological scaffold via minimal homology bases” In Scientific reports 11.1 Nature Publishing Group, 2021, pp. 1–17
- 2. Balázs Szalkai, Csaba Kerepesi, Bálint Varga and Vince Grolmusz “The Budapest reference connectome server v2. 0” In Neuroscience Letters 595 Elsevier, 2015, pp. 60–62
- 3. E. Zeeman “Topology of the brain” In Math. and Computer Science in Biology and Medicine, 1965
- 4. Nathalie Tzourio-Mazoyer et al. “Automated anatomical labeling of activations in SPM using a macroscopic anatomical parcellation of the MNI MRI single-subject brain” In Neuroimage 15.1 Elsevier, 2002, pp. 273–289
- 5. Lingzhong Fan et al. “The human brainnetome atlas: a new brain atlas based on connectional architecture” In Cerebral cortex 26.8 Oxford University Press, 2016, pp. 3508–3526
- 6. M. Girvan and M… Newman “Community structure in social and biological networks” In Proceedings of the National Academy of Sciences 99.12, 2002, pp. 7821–7826 DOI: 10.1073/pnas.122653799
- 7. Santo Fortunato “Community detection in graphs” In Physics Reports 486.3, 2010, pp. 75–174 DOI: https://doi.org/10.1016/j.physrep.2009.11.002
- 8. Csaba Kerepesi, Balazs Szalkai, Balint Varga and Vince Grolmusz “The braingraph. org database of high resolution structural connectomes and the brain graph tools” In Cognitive Neurodynamics 11.5 Springer, 2017, pp. 483–486
- 9. Jennifer A McNab et al. “The Human Connectome Project and beyond: initial applications of 300 mT/m gradients” In Neuroimage 80 Elsevier, 2013, pp. 234–245
- 10. Balázs Szalkai, Csaba Kerepesi, Bálint Varga and Vince Grolmusz “Parameterizable consensus connectomes from the human connectome project: the budapest reference connectome server v3. 0” In Cognitive neurodynamics 11.1 Springer, 2017, pp. 113–116
- 11. Réka Albert, Hawoong Jeong and Albert-László Barabási “Diameter of the world-wide web” In nature 401.6749 Nature Publishing Group, 1999, pp. 130–131
- 12. AD Broido and A Clauset “Scale-free networks are rare. Nat. Commun. 10, 1017 (2019)” In arXiv preprint arXiv:1801.03400
- 13. Imre Derényi, Gergely Palla and Tamás Vicsek “Clique percolation in random networks” In Physical review letters 94.16 APS, 2005, pp. 160202
- 14. Gergely Palla, Imre Derényi and Tamás Vicsek “The critical point of k-Clique percolation in the Erdős–Rényi graph” In Journal of Statistical Physics 128.1 Springer, 2007, pp. 219–227