Interpretation of multi-TeV photons from GRB221009A
Abstract
The nearby GRB221009A at redshift has been observed up to a maximum energy of 18 TeV with the LHAASO air shower array. The expected optical depth for a photon with energy TeV varies between 9.4 and 27.1 according to existing models of the extra-galactic background light (EBL) in the relevant mid infra-red range. The resulting suppression of the flux in several EBL models makes it unlikely that this photon could have been observed at the claimed energy. If the photon event and its energy are confirmed and possibly even more photons above 10 TeV have been observed, the photon-pair production process would have to be suppressed by mechanisms predicted in extensions of the Standard Model of particle physics. We consider the possibilities of photon mixing with a light pseudo-scalar (e.g., axion-like particles; ALPs) in the magnetic field of the host galaxy and the Milky Way and Lorentz invariance violation (LIV). In the case of photon-ALP mixing, the boost factor would reach values for photon couplings not ruled out by the CAST experiment, but limited by other astrophysical constraints. Viable scenarios would require either very efficient mixing in or near to the GRB or that the largest part of the total luminosity is radiated at TeV energies, different from previous GRB afterglows. In the case of LIV, required boost factors are achievable for a LIV breaking energy scale eV ( eV) for the linear (quadratic) modification of the dispersion relation. A more simple explanation would be a misidentification of a charged cosmic-ray air shower.
1 Introduction
The exceptionally bright GRB221009A was registered with the BAT instrument onboard the Swift satellite on 2022-10-09 at 14:10:17 UT. The object was subsequently detected with the XRT and the UVOT (reported in the Gamma-ray Coordinates Network Notice GCN 32632333See https://gcn.gsfc.nasa.gov/). Given the exceptional brightness of the object and its proximity to the Galactic plane (, ), the object was initially considered to be a Galactic X-ray transient (Swift J1913.1+1946). The earlier trigger at 13:16:59.00 UT (in the following ) of the Gamma-ray burst monitor (GBM, GCN 32636) and the subsequent detection with the large-area telescope (LAT, GCN 32637) at 14:17:05.99 UT on board the Fermi satellite made clear that the object is the brightest gamma-ray burst event detected so far. The emission was sufficiently bright that photons were detected with the LAT ksec after the burst occurred. The most energetic photon with GeV (detected at ) is the photon with the highest energy detected from any GRB with Fermi LAT444the previous record holder was observed with GeV from GRB130427A at . (GCN 32658). The energy spectrum above 100 MeV is characterised with a power law with photon index with an integrated flux between 100 MeV and 1 GeV of . The quoted flux is averaged in the time interval from s to s. The temporal structure of the GBM light curve indicates that the first maximum was followed by a brighter emission period with multiple maxima with a duration (GCN 32642). The fluence of the second maximum at is affected by saturation. The peak photon flux at is .
Given the exceptional brightness at X-rays and high energy gamma rays, it is expected that the object is rather nearby. The first red-shift estimate obtained at from a spectrum taken with the X-shooter at VLT (GCN 32648) is based upon the detection of absorption lines (CaII, CaI) at (). This measurement is confirmed with the GTC (GCN 32686: ) and provides an estimate of the isotropic energy release using the GBM fluence of . According to the preliminary classification of the object (GCN 32686), GRB221009A is a type II (collapsar) burst [1, 2] or a binary-driven hypernova (GCN 32780) [3].
2 Origin of the 18 TeV photon
The observational data obtained with various space-based X-ray and gamma-ray instruments will provide important information on the origin of the emission and the nature of the object. However, in the following, we will focus our analysis on the very high energy emission that was observed with the LHAASO experiment.555In this context, two other independent studies related to the optical depth [4] and violation of Lorentz invariance violation [5] have appeared as pre-prints The LHAASO collaboration reported in GCN 32677 the detection of the GRB both with the water Cherenkov Detector Array (WCDA) (significance of ) and the larger air shower detector KM2A (significance of ) within and . The total number of photons above 500 GeV reported is reaching up to a maximum photon energy of TeV. In the following, we assume the detection of the most energetic photon with KM2A which features a relative energy resolution of [6]. The object was observed at a zenith angle distance from to . In Fig. 1, the spectral energy distribution (SED) of GRB221009A as measured with Fermi-LAT is extra-polated to higher energies, where the observed flux is affected by photon-photon pair production on the extra-galactic background light. As a comparison, we have included in Fig. 1 the SED of the Crab Nebula in the same energy range [7]. The peak in the SED of GRB221009A is located beyond the energy range covered with Fermi-LAT. For a peak energy of GeV, the extra-polated and time-average power received from GRB221009A from is approximately a factor larger than the power received from the Crab Nebula.
2.1 Absorption in the extra-galactic background light
The process of photon-photon pair-production () has been known for a long time [8] to suppress the apparent brightness of gamma-rays with energies GeV.
The resulting optical depth of a photon of observed energy relates closely to the number of photons per volume and energy interval present in the inter-galactic medium at wavelength with . Since the EBL is difficult to detect against dominating foreground emission of the interplanetary and interstellar medium, the optical depth is calculated under the assumption of an underlying model for the EBL. Even though the various models and both direct and indirect estimates of the EBL have been converging in the past decades for the wavelength range close to the optical and near-infrared, the uncertainties at larger wavelengths remain substantial.
In Tab. 1, we list the optical depth values for a photon of nominal energy TeV and TeV detected from a red shift using a selection of models for the EBL.666We use the public repository of collected tables at https://github.com/me-manu/ebltable. For a given optical depth , the observed flux is attenuated by a factor which in this case ranges from for the upper bound model of Ref. [9] at TeV to for the lower bound model of Ref. [9] at TeV. The photon density of the EBL in the mid infra-red at wave-lengths from m to m is most relevant for the estimated optical depth at gamma-ray energies above 10 TeV. The accuracy of the models suffer however from uncertainties on the amount of stellar light re-processed by polycyclic aromatic hydrocarbon (PAH) molecules present in the galaxies.
| EBL Model | ||||||
|---|---|---|---|---|---|---|
| K&D2010 | 9.4 | 4.5 | 6700 | - | - ( -) | |
| Fi2010 | 10.0 | 6.0 | 4162 | - | - (-) | |
| Gi2012 | 13.3 | 5.4 | 4500 | 0.58 | 10.4 ( ) | |
| Do2011- | 13.5 | 4.4 | 5800 | 0.58 | 11.3 ( ) | |
| Gi2012f | 13.9 | 5.6 | 5603 | 0.58 | 10.1 ( ) | |
| Fr2008 | 18.3 | 6.8 | 5000 | 0.59 | 8.4 ( ) | |
| SL2021 | 19.1 | 6.9 | 5200 | 0.59 | 8.4 ( ) | |
| Do2011 | 19.2 | 6.1 | 4600 | 0.59 | 9.1 ( ) | |
| Do2011+ | 27.1 | 7.8 | 4000 | 0.59 | 7.5 ( ) |
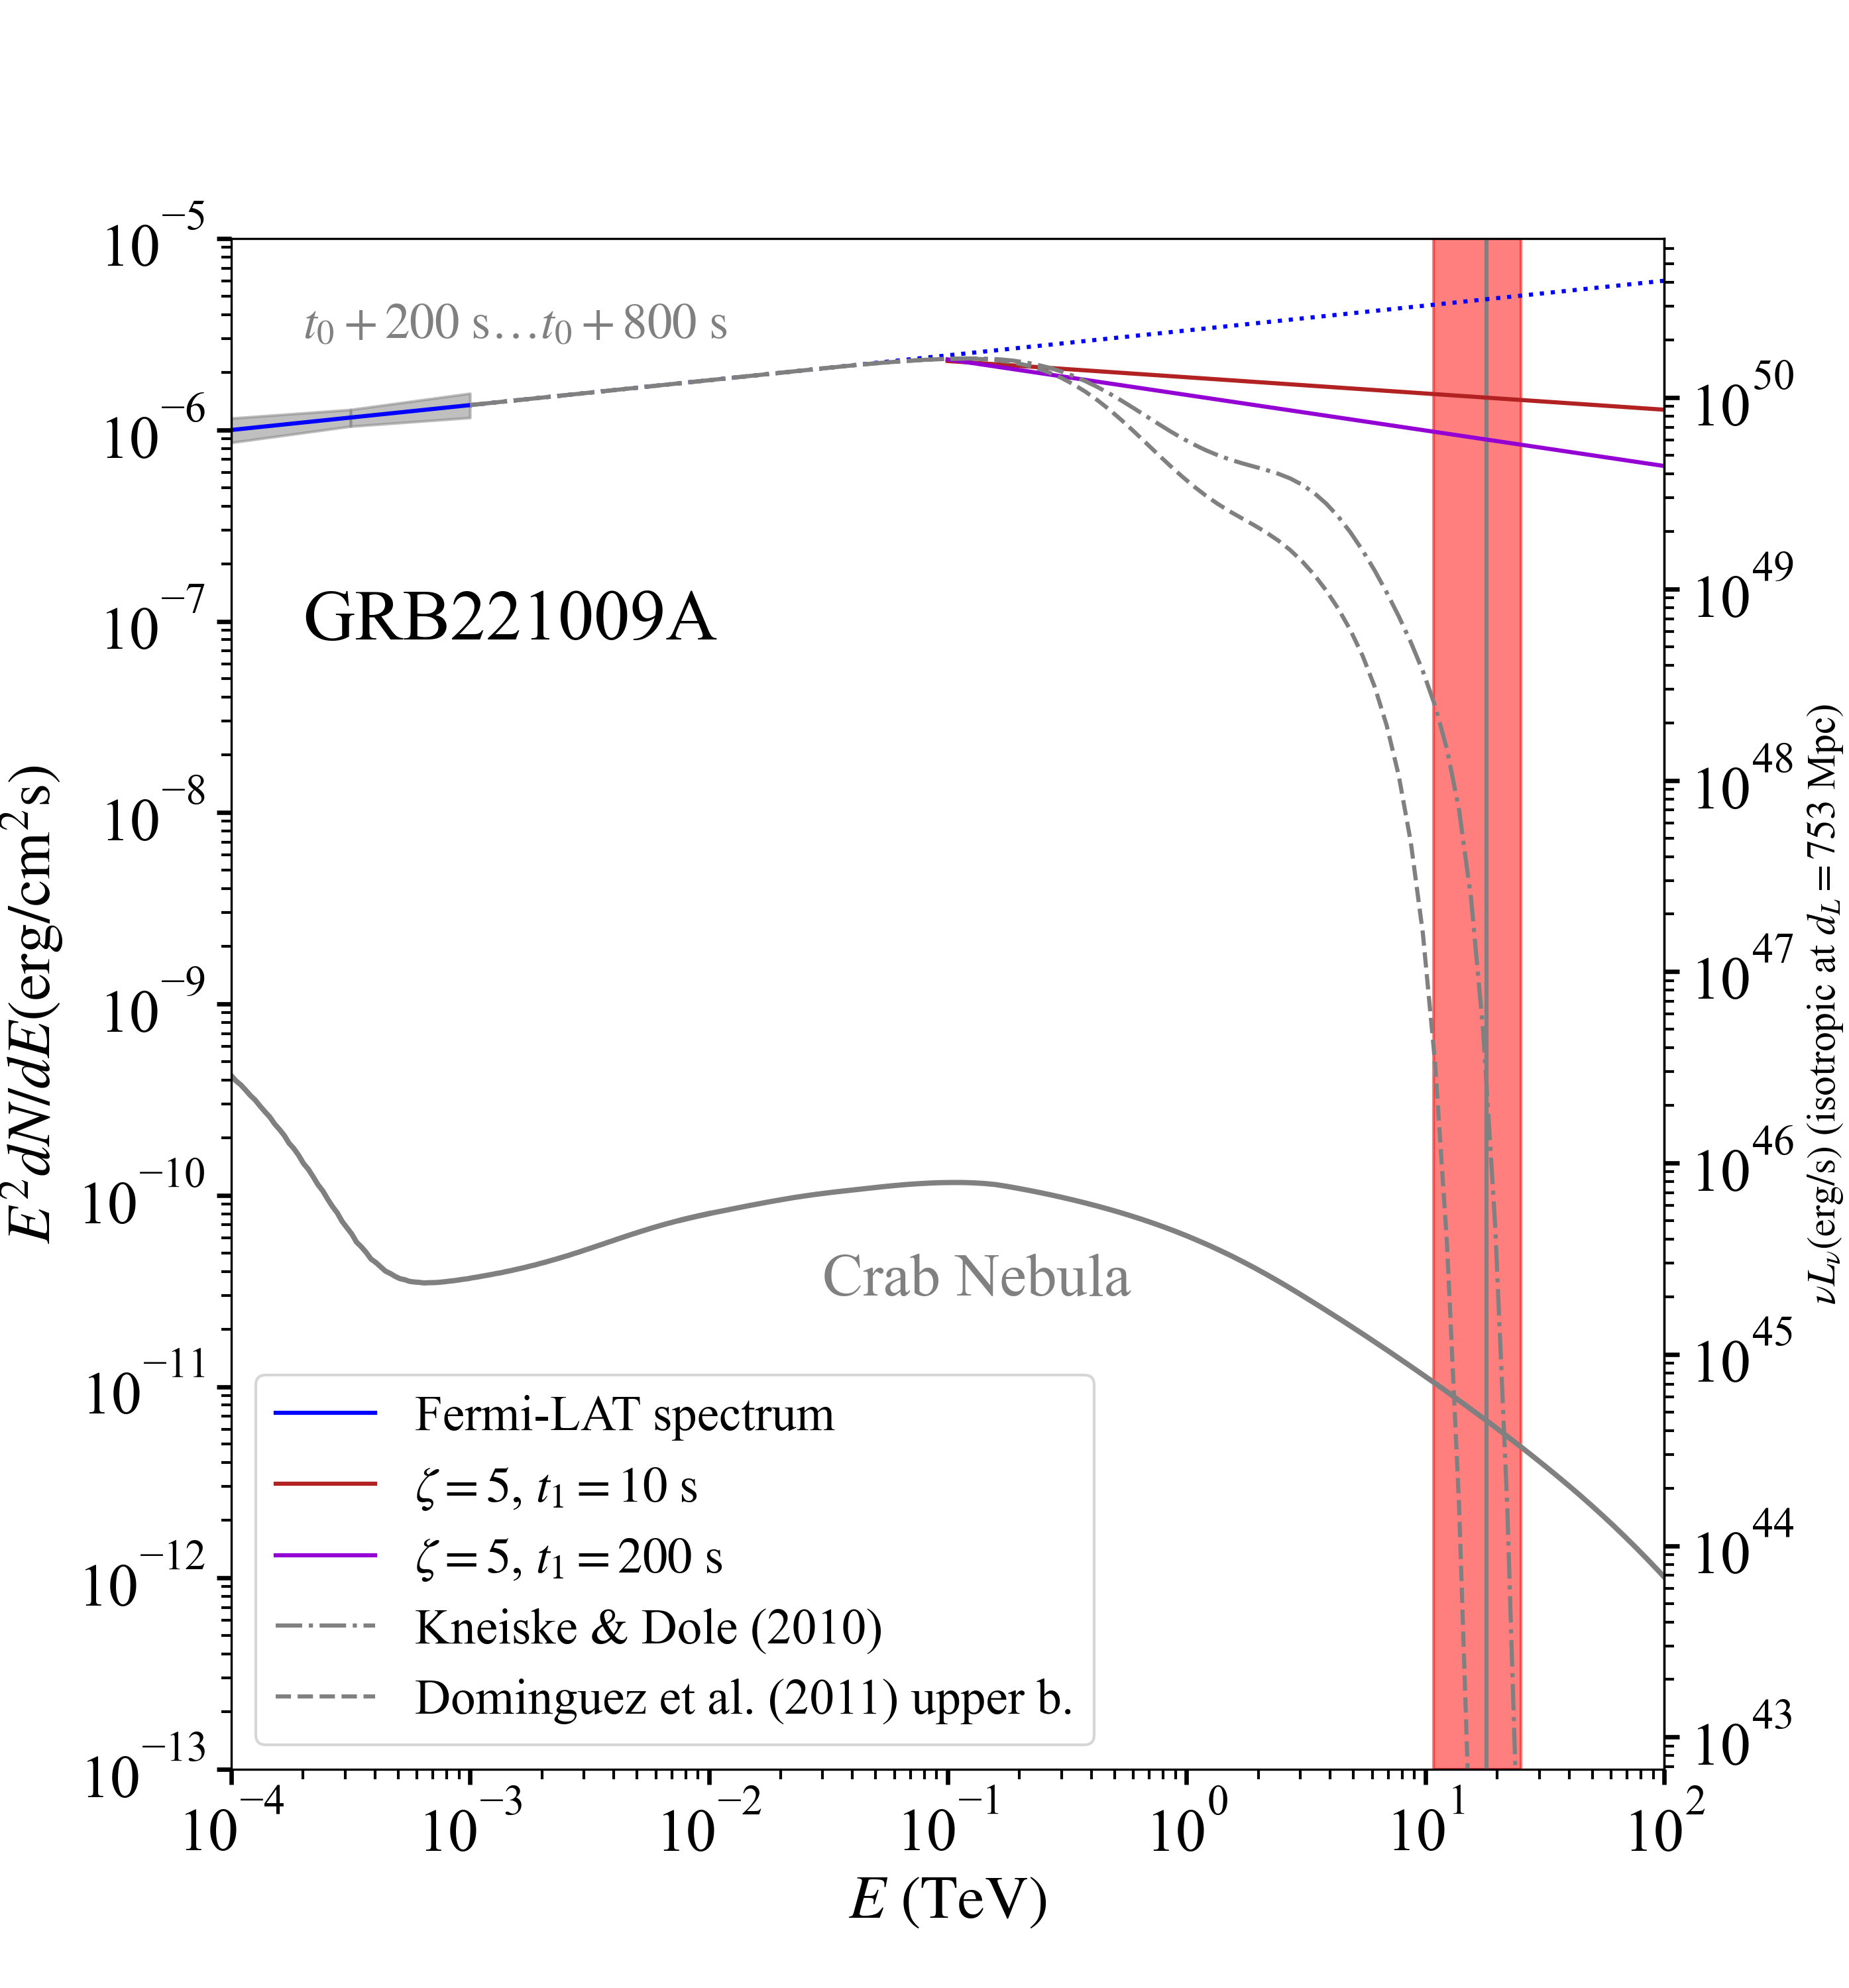
The effect of absorption leads to a strong suppression of the observable flux at TeV energies. In Fig. 1, we show for orientation the flux measurement of GRB221009A during the time-interval from to s obtained with Fermi LAT (GCN 32658). The uncertainty on the flux and the photon index constrain a bow-tie shaped region in the spectral energy distribution (SED) shown in Fig. 1. The effect of photon-photon pair-production leads to a noticeable suppression of the apparent brightness at energies exceeding . The observable flux at is substantially attenuated (in the deep exponential suppression). For the models for the EBL with smaller optical depth [10, 11], the extrapolated and attenuated flux at 18 TeV reaches times the flux of the Crab Nebula. For the model of Ref. [9], the flux at the same energy would be less than of the Crab Nebula flux.
2.2 Expected photon and background counts
In the following, we estimate the number of photons () expected to be detected with LHAASO KM2A within 2000 s after the trigger time. Instead of extrapolating the Fermi-LAT flux, we assume that similar to previous GRBs with VHE afterglows, the VHE flux in the afterglow phase is proportional to the soft X-ray flux. This way, we are only left with two unknown parameters, the time of the onset of the afterglow emission (in the following: ) and the relative normalisation between the X-ray and VHE band ().
Since the afterglows of GRB221009A and GRB190114C share similarities (e.g. the afterglow emission starts a few minutes after the trigger and the observed X-ray light curve follows a power law), we use the time-dependent VHE afterglow spectrum measured with the MAGIC Cherenkov telescopes as a template for GRB221009A [15, 16]. We therefore consider the following assumptions based on observations to estimate the flux and spectral shape for the VHE afterglow of GRB221009A:
-
1.
The VHE-afterglow emission starts at a time after the trigger time with .
-
2.
The ratio of the VHE energy flux and the soft X-ray energy flux measured remains constant during the afterglow phase.
-
3.
The VHE energy spectrum softens during the afterglow.
The second assumption follows from the observation that previous X-ray and VHE-afterglow light curves share a similar power-law behaviour (for GRB180720B see [17] and for GRB190114C see [16]). Observations of GRB221009A with the Swift-XRT started about an hour after the trigger and continued up to about a week later. The X-ray afterglow emission follows a power law in time such that with (GCN32802), similar to the value found for GRB190114C.
The VHE energy spectrum of GRB190114C was softening during the first 2000 s such that the photon index after correcting for absorption on the EBL was changing from an initial value of to [16]. The differential flux for the afterglow starting at is therefore
| (2.1) |
where is an arbitrary time that determines the normalisation.
We choose such that the energy flux integrated in the VHE band from to
| (2.2) |
follows a power law in time
| (2.3) |
with , similar to the XRT light curve and chosen such that for all times
| (2.4) |
where is the energy flux in the XRT band. The relative normalisation has been found to be close to unity in previous observations. The value of is linked to the Comptonization parameter often used in the context of Synchrotron Self-Compton models (see e.g. [18]), where naturally values close to unity are expected. We explore the range from to (see also Fig. 1 where the VHE flux for is shown).
The photon index and its dependence on time is parameterised with
| (2.5) |
where and for are chosen to match the measured VHE spectrum of the afterglow from GRB190114C [15]. The gradual softening of the spectrum from to after about one hour of afterglow evolution corresponds to a shift of the peak in the spectral energy distribution from beyond to less than during the observation time. The softening of the VHE spectrum has not been observed for GRB180720B [17] and GRB190829A [19] which were however observed at a later phase of the afterglow.
Any observation of the energy spectrum from a GRB will necessarily be an average of over time777Since we require the time-average spectrum to be a power law, we actually average . Therefore, we consider the time-average differential spectrum:
| (2.6) |
and
| (2.7) |
The time average of between and is given by
| (2.8) |
With we can re-write
| (2.9) |
where the integration is carried out in the interval from to .
For , we find from the fit to the Swift-XRT light curve (GCN32802).
The time-averaged energy spectrum (assuming no emission for ) in the LHAASO energy range is shown in Fig. 1 for and for two different values of . With a given collection area , observation time , and the time-averaged photon flux , we calculate the expected number of photons in the energy interval from [, ]:
| (2.10) |
Even though we are primarily interested to obtain an estimate of the photon number expected above 18 TeV with the KM2A, we nevertheless calculate for consistency the number of photons detectable at lower energy with the WCDA of LHAASO.
The collection area for the WCDA has been released by the LHAASO collaboration as supplementary information.888http://english.ihep.cas.cn/lhaaso/pdl/202110/t20211026_286779.html The collection area for the KM2A has been taken from Fig. 2 from [6]. Even though these estimates may not be directly applicable to the particular configuration, event selection cuts, and analysis methods underlying the preliminary LHAASO results, it should be sufficient to get a useful estimate for the KM2A detector999We note that the WCDA area given in Ref.[6] is roughly 50 times larger at TeV than the one presented as supplementary information and used here, while the KM2A areas compare in a consistent way between the two references. The resulting values for and are listed in Table 1 and confirm that the assumptions are reasonable as the event numbers for the WCDA are roughly reproduced. While the values of do not vary between the different EBL models, the differences between the values found for are considerable between .
The expected number of background events of misidentified charged cosmic-ray air showers depends upon the choice of event selection cuts. The background rate at 18 TeV for the full KM2A array can be read off Fig. 2 from [20] to be events/hour. Consequently, the expected number of misidentified events for the exposure during the activity of GRB221009A results in .
2.3 Reducing the gamma-ray opacity with Physics beyond the Standard Model
The high optical depth values for some of the considered EBL models reported in Tab. 1 suggest that the observation of gamma rays above energies of tens of TeV for the reported GRB redshift is in these cases very unlikely. If the LHAASO event turns out to originate from GRB221009A at an energy of , the effective opacity could be lowered by either the oscillation between photons and hypothetical light pseudo-scalar bosons or by Lorentz Invariance Violation (LIV). We discuss these two scenarios in the following.
2.3.1 Photon mixing with light pseudo-scalar (axion-like) particle
Light pseudo-scalar bosons, often referred to as axions or axion-like particles (ALPs), are predicted in numerous extensions of the Standard Model [see, e.g., 21, for a review] and are plausible candidates for cold dark matter [22, 23, 24, 25]. Photons and ALPs could convert into each other in the presence of external magnetic fields. The oscillation would lead to a reduction of the opacity as these particles do not undergo pair-production with background photons.
This process has been studied extensively in connection with gamma-ray observations of blazars and considering different magnetic fields along the line of sight [see, e.g., 26, for a recent review]. As pointed out recently [4], photon-ALP conversions could also be responsible for the observation of the 18 TeV gamma ray reported by LHAASO. Here, we investigate if photon-ALP oscillations could yield the required boost in photon flux to explain the LHAASO observations considering a range of ALP masses and photon-ALP couplings . The boost is defined as the ratio , where is the photon survival probability, i.e., the probability to observe an emitted gamma ray when ALPs are considered. The standard EBL attenuation is given by .
For the astrophysical magnetic fields, we consider a minimal scenario: we include the magnetic field of the host galaxy as well as the magnetic field of the Milky Way. For the host, we conservatively assume mixing in the regular component of a plausible galactic magnetic field. We take the component transversal to the propagation direction to be 0.5 G coherent over 10 kpc [e.g., 27]. The magnetic field of the Milky Way is described by the regular component of the model in Ref. [28]. We do not consider mixing in the GRB emission region itself as these parameters are at this stage highly uncertain. Including the mixing in the emission region with the parameters used in Ref. [29] does not change our results.
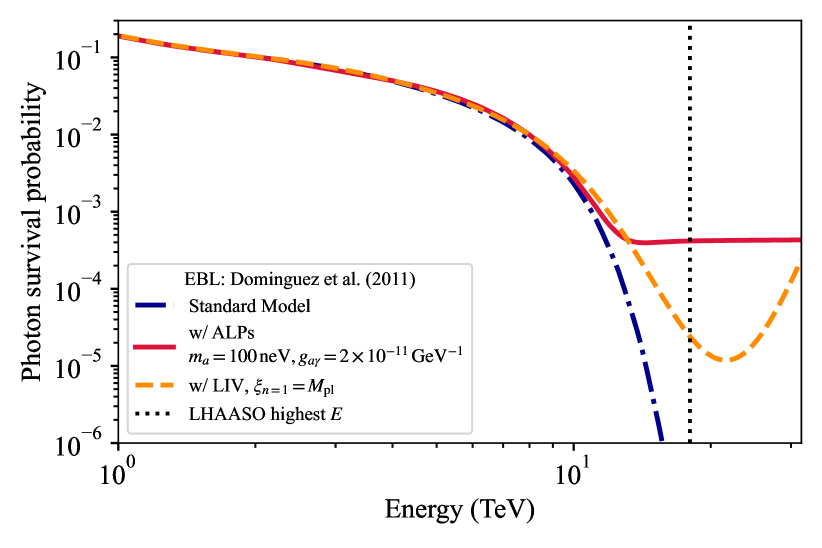
With these model assumptions, we numerically solve the photon-ALP equations of motion using the transfer-matrix approach implemented in the open-source software package gammaALPs [30].101010https://gammaalps.readthedocs.io/ An example is shown in Fig. 2 for , , and the Do2011 model. Clearly, above TeV, the photon flux is greatly enhanced by photon-ALP conversions.
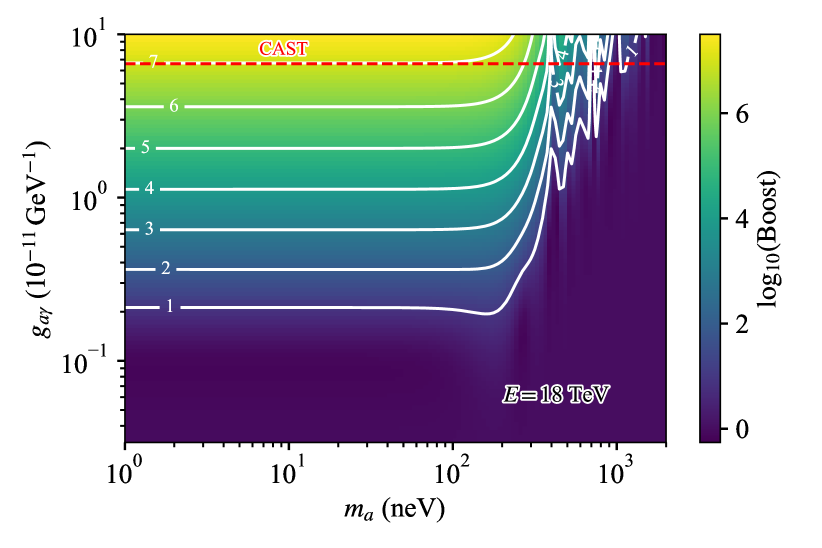
We now perform the calculation of the boost over a grid of and at an energy of TeV to identify the ALP parameter space (given our model assumptions) which could lead to the required boost to explain the LHAASO observation. The result is shown in Fig. 3. Even for comparatively low coupling values above the boost factor is already a factor of 10 for .
The values for listed in Tab. 1 are estimated by carrying out the integration in Eqn. 2.10 for and after replacing the optical depth with an effective optical depth such that . For a fixed value of , the equation is then solved for .
For most considered EBL models, the resulting value for is not constrained by the latest bound from the CAST experiment [31] but is in tension with constraints derived from optical polarisation measurements from magnetic white Dwarfs [32] ( at 90 % c.l.) and from gamma-ray spectra of flat-spectrum radio quasars [7] with (95 % c.l.).
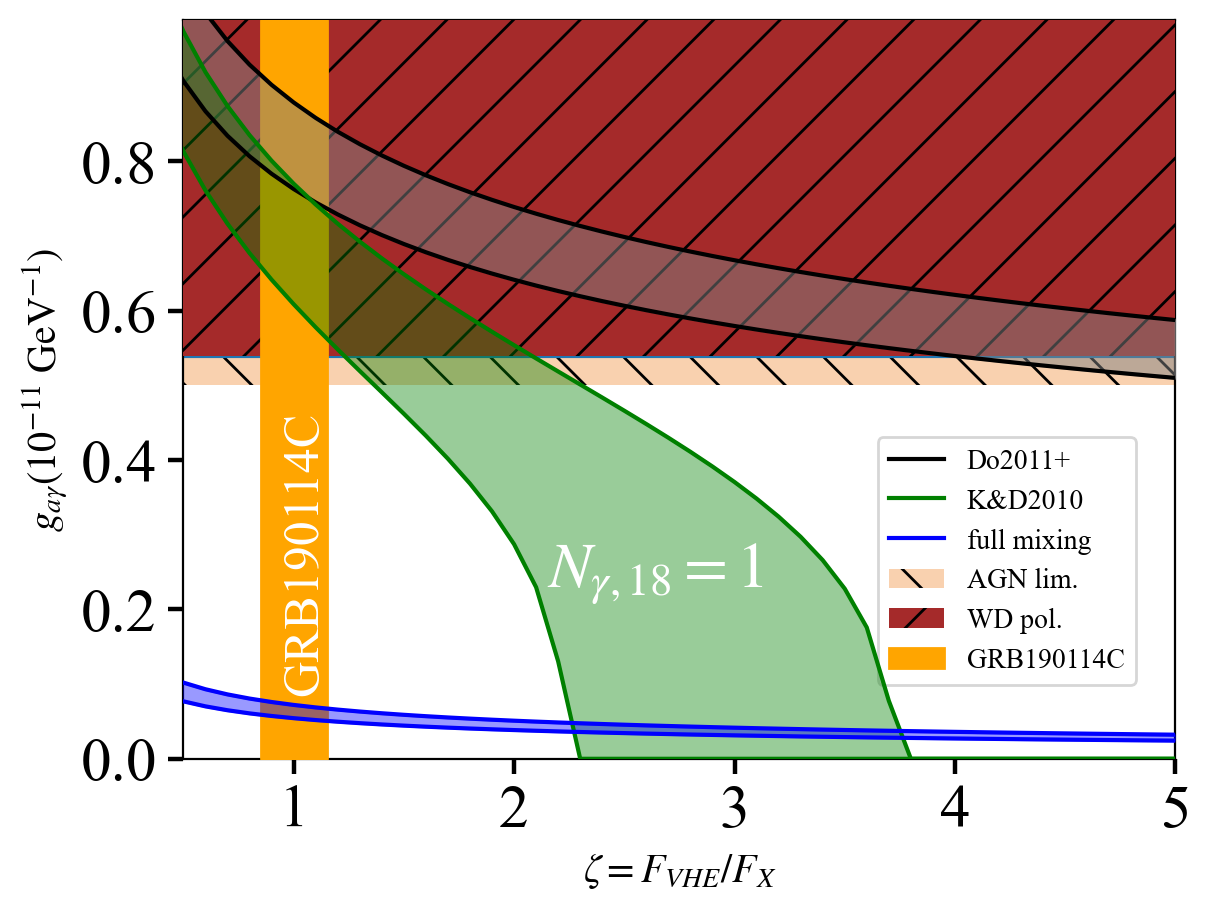
In Fig. 4, we compare the favoured range of values of coupling for two representative EBL models with the existing bounds mentioned above. For the EBL model with a comparably low optical depth , there is no need to invoke any photon-ALPs mixing for values of . For models with larger optical depth , the required value for exceed the bounds mentioned above unless . If GRB221009A behaves similarly to previous GRBs with VHE-afterglow emission, the typical value of would require coupling values for all considered EBL models that are in tension with existing bounds.
A consistent scenario with and couplings smaller than the upper bounds for is achievable only for efficient photon-ALPs mixing in the source. At this point, we can not exclude such a scenario. In order to explore the resulting parameters, we assume for simplicity full mixing in the source with subsequent absorption by the EBL such that a pure ALPs beam is re-converted into photons in the magnetic field of the Milky Way. The resulting range of couplings required is indicated as a blue band in Fig. 4. It is comforting to see that both requirements on and can be fulfilled simultaneously.
2.3.2 Photon opacity in LIV scenarios
Theories of quantum gravity commonly predict LIV [see, e.g., 33] which would have numerous implications for astrophysical observations [e.g., 34, for a review]. Here, we largely follow the reviews in Refs. [34, 26]. Most importantly in the present context, certain effective field theories predict a modified dispersion relation for photons (and electrons) to leading order . In the sub-luminal case, the photon velocity (which now depends on the photon energy) is smaller than the speed of light, . In this case, the modified dispersion relation leads to a modification of the pair production threshold. For gamma rays of energy and background photons of energy it now reads,
| (2.11) |
where is the mass of the electron and is the angle between the photon momenta.
The primed quantities indicate the comoving frame. The second term in this equation stems from the modified dispersion relation, where if only photons are affected by LIV and if both electrons and photons are affected. The energy scale where LIV becomes important is denoted by and is often given in units of the Planck mass, eV. As a consequence of the modified threshold, pair production will be suppressed above some gamma-ray energy. This is illustrated in Fig. 2 for for and for LIV only affecting photons (which we will assume throughout). Clearly, the opacity in the presence of LIV, which we denote with , is reduced above TeV and the photon survival probability increases towards one above TeV.
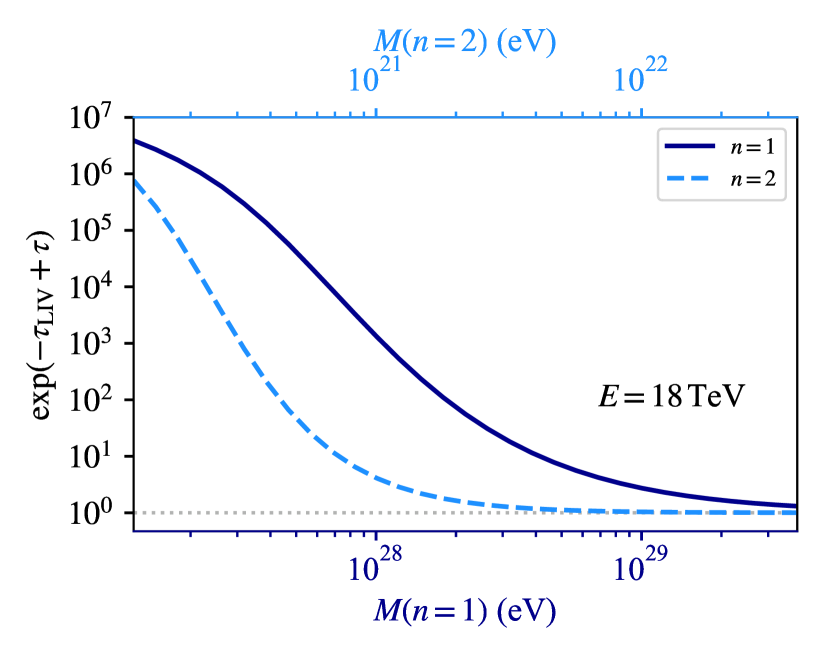
We now test for which values of the LIV energy scale we achieve a sufficient boost factor that would explain the observation of an 18 TeV gamma ray. For both the linear and quadratic case , we step through values of and respectively. For each value, we calculate .111111For this, We use the open-source package ebltable, https://github.com/me-manu/ebltable. The results are shown in Fig. 5. Similar to the case of photon-ALPs mixing, we solve the equation for and separately resulting in the values listed in Tab. 1. These values can be considered upper limits for given that we consider the number of events with energies 121212A more detailed consideration of the number of photons reconstructed at requires detailed knowledge of the energy resolution that is not available to us..
The favoured parameter space for eV is in mild tension with searches for a reduced opacity using observations of blazars with ground based gamma-ray telescopes. In particular, the stacking of observations of multiple sources constrain eV [35].
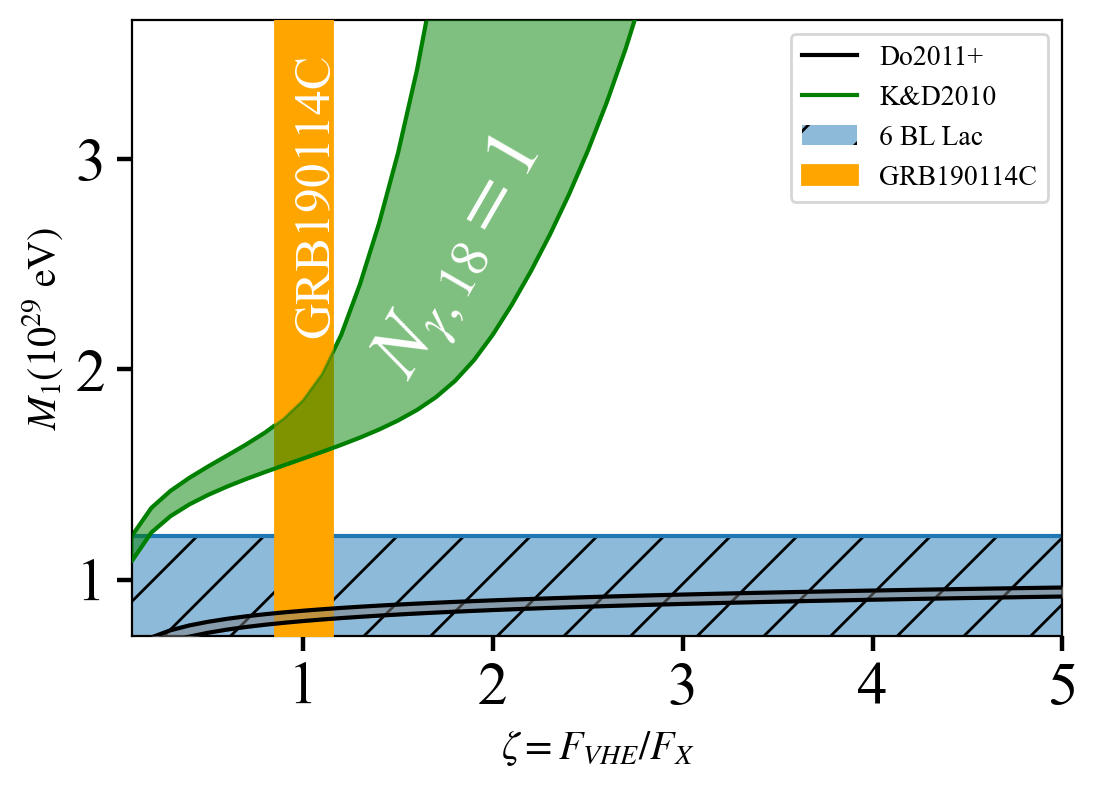
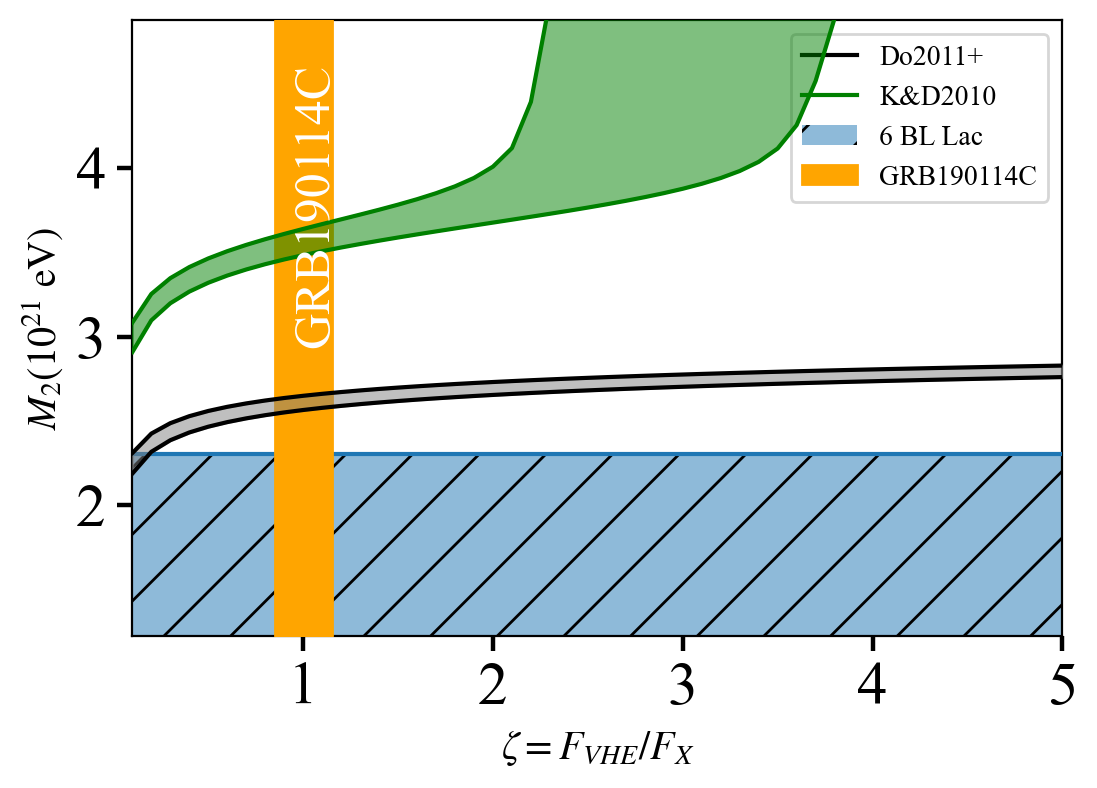
The situation is more relaxed for EBL models which predict less absorption as can be seen in Fig. 6 (left panel). The green band indicates the region with for the EBL model K&D2010 (similar results are obtained for Fi2010). Here, the required values for even for are above other constraints. In the case of a predominantly quadratic LIV-breaking scenario (), the optical depth is sufficiently reduced for values of which is not excluded by other constraints (see Fig. 6 right panel).
3 Conclusions
The ground-based detection of VHE gamma rays from GRB221009A provides an exceptional opportunity to study the acceleration and emission processes. The approximately 5000 photons that are collected above 500 GeV with LHAASO-WCDA from the start of the afterglow up to 2000 s after the trigger are exceptional in comparison to previous VHE afterglow observations: MAGIC detected 877 photons from to from GRB190114C [15], H.E.S.S. detected 119 photons from GRB180720B during a two-hour observation in the late phase of the afterglow (10.1 hours after the trigger time). The afterglow emission from GRB190829A was followed even longer: H.E.S.S. carried out follow-up observations between 4 and 56 hours after the trigger time [19]. In all three cases, the VHE afterglows showed a similar temporal behaviour where the VHE flux with .
In the approach suggested here, we consider the temporal behaviour of the VHE-afterglow emission of GRB221009A to follow the same pattern and choose the Swift-XRT light curve of the X-ray afterglow as a proxy to the VHE-afterglow with left to vary between and . In the resulting calculation of event numbers, we can reproduce the number of photons detected above 500 GeV with the WCDA detector of LHAASO under the assumption that .
The hints for photons detected beyond 10 TeV for GRB221009A () extend the energy range of photons observed during previous VHE afterglow observations. The origin of the claimed highest energy photon detected with LHAASO (most likely with the KM2A) at TeV is at first glance difficult to reconcile with the large optical depth at that energy due to pair-production with the extra-galactic background light (EBL).
Among the collection of models for the EBL investigated here (see also Tab. 1), the optical depth is expected to be between . The probability to detect at least one photon for the extrapolated spectrum calculated with could be therefore as small as but reaches values close to unity for other models.
Possible approaches to suppress pair production include photons mixing with light ( eV) pseudo-scalar particles (such as ALPs) thus avoiding pair production for a small fraction of the photons that re-convert closer to the observer. The resulting values for the mixing depend on the presence of magnetic fields close to the source. Assuming the EBL model of Ref. [9] and photon-ALP conversions in the hosting galaxies, we find values for to achieve a sufficiently large boost factor in most of the considered scenarios. The resulting values do not depend very much on the choice of the EBL model as long as the . The required value for is in tension with bounds from other astrophysical observations which constrain . For values of , the required photon-ALPs mixing is inconsistent with other bounds. However, a modified scenario with maximum mixing of photon and ALPs near or inside the source would reduce the required .
Alternatively, breaking of Lorentz invariance could decrease the gamma-ray opacity. For the quadratic LIV-breaking scenario and , the required values of are larger than bounds from other observations, independent of the choice of the EBL. In the linear LIV-breaking scenario, only the scenarios with a comparably small optical depth from a lower level of the EBL would not require values of that are inconsistent with other bounds. It will be interesting to study the arrival time of the TeV photons from GRB221009A to constrain LIV breaking effects independently of the optical depth.
Even if it is exciting to invoke new physics to explain the origin of the photon at 18 TeV, it should be mentioned that the background expectation to detect a mis-identified charged cosmic-ray induced air shower at 18 TeV is consistent with the actual observation.
In conclusion, we have demonstrated that the transparency of the universe could be substantially larger than anticipated for photon-photon pair production if photon-ALP mixing is effective or Lorentz invariance violation occurs at sufficiently low energy scales. Consequently, the observation of bright transients at large optical depth could in principle lead to the discovery of anomalous transparency and provide important clues on the nature of the mechanism for the suppression of pair production.
Acknowledgments
We acknowledge the support from the Deutsche Forschungsgemeinschaft (DFG, German Research Foundation) under Germany’s Excellence Strategy – EXC 2121 “Quantum Universe” – 390833306. M. M. acknowledges support from the European Research Council (ERC) under the European Union’s Horizon 2020 research and innovation program Grant agreement No. 948689 (AxionDM).
References
- [1] L. Amati, F. Frontera, M. Tavani, J.J.M. in’t Zand, A. Antonelli, E. Costa et al., Intrinsic spectra and energetics of BeppoSAX Gamma-Ray Bursts with known redshifts, A&A 390 (2002) 81 [astro-ph/0205230].
- [2] B. Zhang, Gamma-ray burst afterglows, Advances in Space Research 40 (2007) 1186 [astro-ph/0611774].
- [3] J.A. Rueda and R. Ruffini, On the Induced Gravitational Collapse of a Neutron Star to a Black Hole by a Type Ib/c Supernova, ApJ. L. 758 (2012) L7 [1206.1684].
- [4] G. Galanti, M. Roncadelli and F. Tavecchio, Axion-like particles explain the very-high energy emission from GRB221009A, arXiv e-prints (2022) arXiv:2210.05659 [2210.05659].
- [5] H. Li and B.-Q. Ma, Lorentz invariance violation induced threshold anomaly versus very-high energy cosmic photon emission from GRB20221009A, arXiv e-prints (2022) arXiv:2210.06338 [2210.06338].
- [6] X.-H. Ma et al., Chapter 1 LHAASO Instruments and Detector technology *, Chin. Phys. C 46 (2022) 030001.
- [7] L. Dirson and D. Horns, Phenomenological modelling of the Crab Nebula’s broad-band energy spectrum and its apparent extension, arXiv e-prints (2022) arXiv:2203.11502 [2203.11502].
- [8] R.J. Gould and G.P. Schréder, Opacity of the Universe to High-Energy Photons, Physical Review 155 (1967) 1408.
- [9] A. Domínguez, J.R. Primack, D.J. Rosario, F. Prada, R.C. Gilmore, S.M. Faber et al., Extragalactic background light inferred from AEGIS galaxy-SED-type fractions, MNRAS 410 (2011) 2556 [1007.1459].
- [10] T.M. Kneiske and H. Dole, A lower-limit flux for the extragalactic background light, A&A 515 (2010) A19 [1001.2132].
- [11] J.D. Finke, S. Razzaque and C.D. Dermer, Modeling the Extragalactic Background Light from Stars and Dust, ApJ 712 (2010) 238 [0905.1115].
- [12] R.C. Gilmore, R.S. Somerville, J.R. Primack and A. Domínguez, Semi-analytic modelling of the extragalactic background light and consequences for extragalactic gamma-ray spectra, MNRAS 422 (2012) 3189 [1104.0671].
- [13] A. Franceschini, G. Rodighiero and M. Vaccari, Extragalactic optical-infrared background radiation, its time evolution and the cosmic photon-photon opacity, A&A 487 (2008) 837 [0805.1841].
- [14] A. Saldana-Lopez, A. Domínguez, P.G. Pérez-González, J. Finke, M. Ajello, J.R. Primack et al., An observational determination of the evolving extragalactic background light from the multiwavelength HST/CANDELS survey in the Fermi and CTA era, MNRAS 507 (2021) 5144 [2012.03035].
- [15] MAGIC Collaboration, V.A. Acciari, S. Ansoldi, L.A. Antonelli, A. Arbet Engels, D. Baack et al., Teraelectronvolt emission from the -ray burst GRB 190114C, Nature 575 (2019) 455 [2006.07249].
- [16] MAGIC Collaboration, V.A. Acciari, S. Ansoldi, L.A. Antonelli, A.A. Engels, D. Baack et al., Observation of inverse Compton emission from a long -ray burst, Nature 575 (2019) 459 [2006.07251].
- [17] H. Abdalla, R. Adam, F. Aharonian, F. Ait Benkhali, E.O. Angüner, M. Arakawa et al., A very-high-energy component deep in the -ray burst afterglow, Nature 575 (2019) 464 [1911.08961].
- [18] S. Yamasaki and T. Piran, Analytic modelling of synchrotron self-Compton spectra: Application to GRB 190114C, MNRAS 512 (2022) 2142 [2112.06945].
- [19] H. E. S. S. Collaboration, H. Abdalla, F. Aharonian, F. Ait Benkhali, E.O. Angüner, C. Arcaro et al., Revealing x-ray and gamma ray temporal and spectral similarities in the GRB 190829A afterglow, Science 372 (2021) 1081 [2106.02510].
- [20] Lhaaso Collaboration, Z. Cao, F. Aharonian, Q. An, Axikegu, L.X. Bai et al., Peta-electron volt gamma-ray emission from the Crab Nebula, Science 373 (2021) 425 [2111.06545].
- [21] I.G. Irastorza and J. Redondo, New experimental approaches in the search for axion-like particles, Progress in Particle and Nuclear Physics 102 (2018) 89 [1801.08127].
- [22] J. Preskill, M.B. Wise and F. Wilczek, Cosmology of the invisible axion, Physics Letters B 120 (1983) 127.
- [23] L.F. Abbott and P. Sikivie, A cosmological bound on the invisible axion, Physics Letters B 120 (1983) 133.
- [24] M. Dine and W. Fischler, The not-so-harmless axion, Physics Letters B 120 (1983) 137.
- [25] P. Arias, D. Cadamuro, M. Goodsell, J. Jaeckel, J. Redondo and A. Ringwald, WISPy cold dark matter, Journal of Cosmology and Astroparticle Physics 2012 (2012) 013.
- [26] J. Biteau and M. Meyer, Gamma-Ray Cosmology and Tests of Fundamental Physics, Galaxies 10 (2022) 39 [2202.00523].
- [27] A. Fletcher, Magnetic Fields in Nearby Galaxies, in The Dynamic Interstellar Medium: A Celebration of the Canadian Galactic Plane Survey, R. Kothes, T.L. Landecker and A.G. Willis, eds., vol. 438 of Astronomical Society of the Pacific Conference Series, p. 197, Dec., 2010 [1104.2427].
- [28] R. Jansson and G.R. Farrar, A New Model of the Galactic Magnetic Field, ApJ 757 (2012) 14 [1204.3662].
- [29] O. Mena, S. Razzaque and F. Villaescusa-Navarro, Signatures of photon and axion-like particle mixing in the gamma-ray burst jet, JCAP 2011 (2011) 030 [1101.1903].
- [30] M. Meyer, J. Davies and J. Kuhlmann, gammaALPs: An open-source python package for computing photon-axion-like-particle oscillations in astrophysical environments, in 37th International Cosmic Ray Conference, p. 557, Mar., 2022, DOI [2108.02061].
- [31] CAST collaboration, New CAST Limit on the Axion-Photon Interaction, Nature Phys. 13 (2017) 584 [1705.02290].
- [32] C. Dessert, D. Dunsky and B.R. Safdi, Upper limit on the axion-photon coupling from magnetic white dwarf polarization, PRD 105 (2022) 103034 [2203.04319].
- [33] A. Addazi, J. Alvarez-Muniz, R. Alves Batista, G. Amelino-Camelia, V. Antonelli, M. Arzano et al., Quantum gravity phenomenology at the dawn of the multi-messenger era-A review, Progress in Particle and Nuclear Physics 125 (2022) 103948 [2111.05659].
- [34] H. Martínez-Huerta, R.G. Lang and V. de Souza, Lorentz Invariance Violation Tests in Astroparticle Physics, Symmetry 12 (2020) 1232.
- [35] R.G. Lang, H. Martínez-Huerta and V. de Souza, Improved limits on Lorentz invariance violation from astrophysical gamma-ray sources, PRD 99 (2019) 043015 [1810.13215].