OpenCQA: Open-ended Question Answering with Charts
Abstract
Charts are very popular to analyze data and convey important insights. People often analyze visualizations to answer open-ended questions that require explanatory answers. Answering such questions are often difficult and time-consuming as it requires a lot of cognitive and perceptual efforts. To address this challenge, we introduce a new task called OpenCQA, where the goal is to answer an open-ended question about a chart with descriptive texts. We present the annotation process and an in-depth analysis of our dataset. We implement and evaluate a set of baselines under three practical settings. In the first setting, a chart and the accompanying article is provided as input to the model. The second setting provides only the relevant paragraph(s) to the chart instead of the entire article, whereas the third setting requires the model to generate an answer solely based on the chart. Our analysis of the results show that the top performing models generally produce fluent and coherent text while they struggle to perform complex logical and arithmetic reasoning.
1 Introduction
Using data visualizations such as bar charts and line charts to discover critical insights, and explain them to others is at the heart of many decision making tasks Munzner (2014). Often, people explore such visualizations to answer high-level questions that involve reasoning and explanations. For example, Figure 1 shows an open-ended question which cannot be answered by a single word or phrase, rather it requires an explanatory answer. Answering such questions can be time consuming and mentally taxing as they require significant amounts of perceptual and cognitive efforts. For the particular question in Figure 1, the user needs to find relevant marks (bars) in the given charts, compare their values and perform reasoning over them to generate an explanatory answer. Thus, the research question we address in this paper is: can we build systems to automatically answer such open-ended questions about charts with descriptive texts?
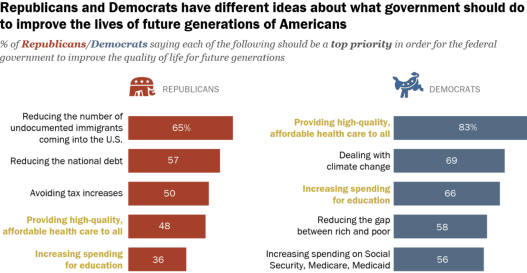
| Question: Compare the Democrats and Republicans views about providing health care to the population? |
| Answer : While 83% of Democrats say providing high-quality, affordable health care for all should be a top priority, a much smaller share of Republicans (48%) agree. |
Chart Question Answering (CQA) is a task where the goal is to take a chart and a natural language question as input and generate the desired answer as output Hoque et al. (2022). While CQA has received growing attentions in the last few years, existing datasets only focus on close-ended (factoid) questions where the answer is a word or phrase Kahou et al. (2017); Kafle et al. (2018); Chaudhry et al. (2020); Singh and Shekhar (2020). These datasets typically use predefined templates to generate synthetic questions and answers to these questions come from a closed vocabulary (e.g., ‘yes’, ‘no’, ‘x-axis-label’). PlotQA Methani et al. (2020) introduces some open-vocabulary questions that require aggregation operations on the underlying chart data; the answer is still however a number or a word/phrase obtained from the chart. Kim et al. (2020) attempt to automatically explain how the model computes the answer but only for close-ended ones. To our knowledge, there are no datasets on CQA with open-ended questions.
In this work, we introduce a novel task named, OpenCQA in which the system takes a chart and a question as input and is expected to produce a descriptive answer as output like the one in Figure 1. This task is multidisciplinary and challenging in nature as it involves natural language generation (NLG), information visualization and computer vision. It differs from the data-to-text and reading comprehension, because unlike text or tables, charts serve a different communicative goal by creating visual representation of data. Readers can quickly notice important patterns, trends, and outliers from such visual representation which cannot be easily observed from a table of raw data Munzner (2014). By looking at a line chart, one can quickly discern an important trend whereas scatterplots may visually depict correlations and outliers. Existing NLG approaches for tables do not consider such chart features in the generation.
We have developed a benchmark dataset for OpenCQA consisting of 7,724 human-written open-ended questions about a variety of real-world charts and the associated descriptive answers. We formulate three practical task settings. In the first setting, a chart and the article containing the chart is provided as input, and the model generates an answer to an open-ended question. This setting poses extra challenge as articles often contain paragraphs that are irrelevant to the questions. To make the task more focused, the second setting provides only the relevant paragraph(s) to the chart. Hence we can measure the models’ ability to answer a question without the effect of extra noise from irrelevant text. The third setting is more challenging as the related text is not provided and the model needs to generate an answer solely based on the chart. This is more relevant to real world scenarios where charts are not associated with any explanatory text.
Since the proposed task is completely new, we adapt a variety of state-of-the-art models that utilize multimodal, data2text and extractive summarization methods to serve as strong baselines. We conducted automatic and qualitative evaluations and observe that the top performing models are quite fluent and coherent in generating summaries but lack in complex logical reasoning and inference. Our codebase is publicly available at https://github.com/vis-nlp/OpenCQA.
2 Related Work
Our work is related to three lines of prior work.
(i) Chart Summarization
Mittal et al. (1998) and Ferres et al. (2013) adopt a planning-based architecture and used templates to describe charts with texts. These methods can only describe how to read a chart without summarizing any insights from the chart. Demir et al. (2012) compute statistics to generate bar chart summaries and simultaneously construct sentence- and discourse-level structures. Chen et al. (2019) use a ResNet He et al. (2016) to encode a chart and a LSTM decoder to generate a caption. All these studies generate summaries using predefined templates, which may lack naturalness and variations in terms of grammatical structure and lexical choices. Obeid and Hoque (2020) and Kantharaj et al. (2022a) use transformer-based models while Spreafico and Carenini (2020) use an LSTM based encoder-decoder model to generate chart summaries in a data-driven fashion. But their models only focus on generating a summary to describe the chart rather than focusing on a specific relevant portion of a chart to answer a question which is the main focus of our work.
(ii) Visual Question Answering (VQA)
VQA involves answering a question regarding an input image Antol et al. (2015). To relate the question and the image effectively, researchers focus on fusing textual and visual information together (Lu et al., 2019; Talmor et al., 2021). Cho et al. (2021) introduce VL-T5 and VL-BART as pretrained vision-language models which achieved competitive results on VQA tasks. Unlike images with real-world objects and scenes, charts encode data using marks (bars, lines) and have inherent structure which makes the chart QA task quite different from VQA Masry et al. (2022).
(iii) Data2text Generation
Data2text models generate a descriptive summary from a data table. Previous work has focused on specific domains such as sports Barzilay and Lapata (2005); Wiseman et al. (2017), weather-forecast Reiter et al. (2005), recipe Yang et al. (2017) and biography Lebret et al. (2016). Others Parikh et al. (2020); Chen et al. (2020a) have focused on open-domain tasks. Many of these methods use an LSTM-based encoder-decoder architecture Mei et al. (2016); Lebret et al. (2016); Wiseman et al. (2017), while Gong et al. (2019) find that transformers yield more fluent and coherent outputs. Few approaches focus on generating textual facts with logical inference rather than stating simple facts that can be easily retrieved from the data table Chen et al. (2020a, b). Unlike the task with data tables, our task involves understanding visual features of the charts and the natural language questions to perform reasoning in order to generate (or extract) texts as answers.
3 Dataset Construction
3.1 Data Collection & Annotation
Building a dataset with open-ended questions and human-written descriptive answer is challenging because there are not many publicly available real-world sources with charts and related textual descriptions. After exhaustive search, we decided to use charts from Pew Research (pewresearch.org). Pew serves as a suitable source because the articles are written by professional writers covering opinions, market surveys, demographic trends and social issues. The articles are often accompanied by a variety of real-world charts and their summaries.
We collected 9,285 chart-summary-article triples scraped from nearly 4,000 articles. However, not all of the charts are suitable for creating open-ended questions. For example, some charts maybe too unconventional or too complex while a few others have poor resolution. Similarly, the text accompanying the chart may not discuss data values in the chart and instead refer to other external background facts. Hence, we manually went over all the charts to retain 7,724 samples that we deemed suitable for our study. In particular, we filtered out 1,019 samples as too complex and 542 as samples we cannot make an open-ended question.
We perform an annotation study on the collected chart data to create question-answer pairs following the four steps below (see Table 8 for an illustrative example). More details of the data collection and annotation process are provided in Section A.1.
(1) Question-answer Creation
We asked each crowdworker from Amazon Mechanical Turk to answer three existing questions (created by another crowdworker) for three separate charts respectively, and create three new question-answer pairs for three new charts. They were provided with the chart and the summary, and were asked to select portions of the text as an answer to the question. The selected segments can be noncontiguous. In this way, we collected two answers from different workers for each question, to verify answers and to remove any potential bias in answer selection.
(2) Question Validation and Editing
After collecting the question-answer (QA) pairs, this and the next two steps are performed by five internal annotators who are native speakers of English and have research background in summarization. Each QA pair is first examined by an annotator who first checks if the question is open-ended in nature, and edits the questions when the question is vague or incomplete, or not answerable from the charts. Then, the remaining annotators analyze the questions in terms of grammatical correctness and edit them as needed. Overall, the question was edited in 53% question-answer pairs. In this 22.7% cases were minor changes (less than 30% tokens changed), 15.5% cases were moderate changes (between 30% and 60% tokens changed) and 14.8% were major changes (over 60% tokens changed).
(3) Disagreement Resolution
As mentioned, we obtain two answers from the crowdworkers for each chart-question pair. To resolve any potential bias from one and/or disagreement between the two answers, we build an annotation interface where an annotator can either choose one of the two answers, or select a new answer from the given summary. The annotator checks whether the answer contains irrelevant information to the question or any text that are not derivable from the chart (e.g., background information). For 18.4% cases, the two answers matched exactly. For 68.2% samples, the two answers still had high overlaps (over 90% token matches); for another 10.1% the overlaps between the answers were moderate (between 30% and 90% token matches) and for the remaining 3.3%, the token matches between answers were less than 30%. While resolving the disagreements between crowdworkers, in 96% cases the annotators chose one of the two answers while for other 4% they selected a new answer from the summary.
(4) Decontextualization
In some cases, crowdworkers may have left out important information from the summary that is relevant to the question while in other cases, they may have included information that is not derivable from the chart. Thus, after selecting the most appropriate answer, annotators edit it further by adding tokens from the summary or removing tokens as necessary, which is taken as the extractive answer for the dataset. Also, if needed, they replace the occurrence of a pronoun with its antecedent (a proper noun) in cases where the entity is unknown, to put the answer in context, which is the abstractive answer.
3.2 Dataset Analysis
Figure 2(a) represents some basic statistics about the dataset. The questions and titles are generally short with both under 21 tokens on average. The percentage of tokens overlapping between the extractive answer and the article is 7% on average. Other characteristics of our dataset are as follows.
| Statistics (on average) | ||
| Tokens in article | 1268.91 | |
| Tokens in summary | 123.35 | |
| Tokens in title | 17.94 | |
| Tokens in question | 11.88 | |
| Tokens in abstractive answer | 56.41 | |
| Tokens in extractive answer | 56.21 | |
| Percentage of tokens extracted from the summary | 52% | |
| Percentage of tokens extracted from the article | 7% | |
| Type | Simple | Complex |
| Bar | 712 | 4,823 |
| Line | 234 | 1,667 |
| Area | 7 | 4 |
| Scatter | 0 | 42 |
| Pie | 235 | 0 |
| Total | 1,188 | 6,536 |
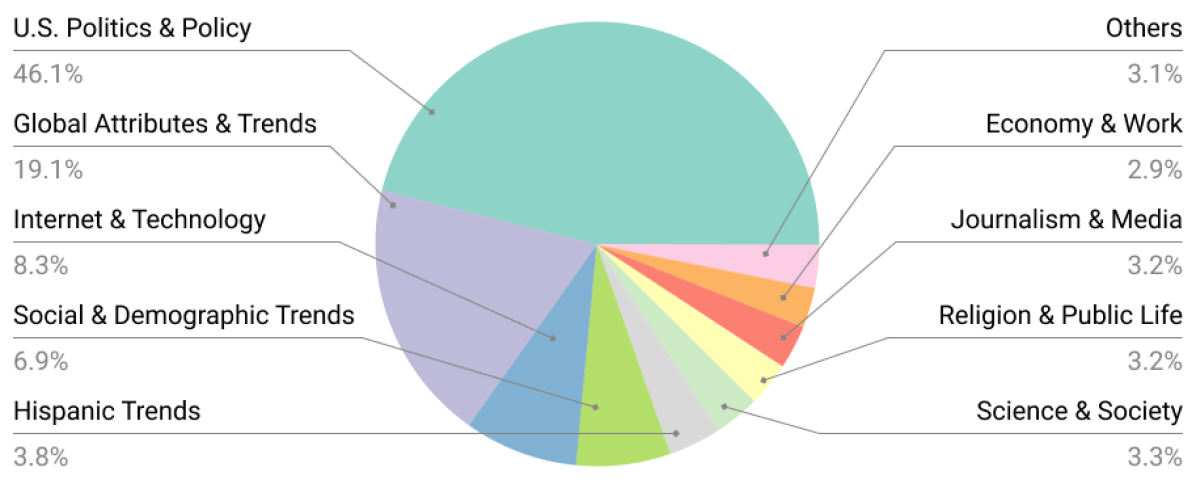
Chart Types and Topics
Our dataset contains a variety of chart types (Figure 2(a)). The most common is bar charts (71.7%), for both simple as well as stacked and group bar charts. The next most common type is line charts (24.6%). Other types include area charts, scatter plots and pie charts. The dataset also covers a diverse range of topics including politics, technology, society and media (Figure 2(b)); about half of the charts cover U.S. Politics & Policy due to the nature of the dataset.
| Type | Example | % |
|---|---|---|
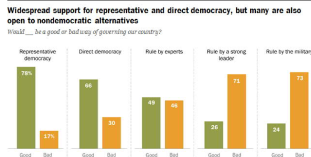
| Identify | What are the current thoughts on direct democracy? | 37% |
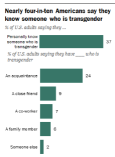
| Summarize | Explain the distribution of people who know a transgender person? | 37% |
| Compare | Compare Americans and Germans views about the world economic leader? | 20% |
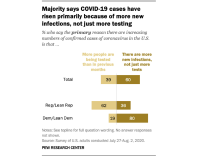
| Discover | How do Americans’ see the coronavirus statistics? | 6% |
Question Types
We further analyze the question types using 100 randomly sampled question-answer pairs from our dataset. Table 1 shows the distribution of questions across four main types. Our categorization of questions are based on the specific analytical tasks with visualizations one would have to perform to answer the question Munzner (2014). The four categories are: (i) Identify: questions that require identifying a specific target (e.g., a data item or a data attribute) from the chart and describing the characteristics of that target; (ii) Compare: questions that require comparisons between specified targets from the chart; (iii) Summarize: questions that require summarizing the chart based on specified statistical analysis tasks (e.g., describing data distribution, outliers(s), and trend(s)); and (iv) Discover: questions that require analyzing the whole chart to derive key insights through inference and reasoning. Unlike the summarize task there is no explicit analytical task that is specified in a discover type question.
From Table 1, we notice that people often ask to locate one or more portions of a chart (identify and compare) and then characterize them to answer the question. They may also ask for a descriptive answer of some trends or data distributions. In contrast, questions that require the user to focus on the whole chart (e.g., discovery) are fewer. This suggests that unlike the chart summarization problem which focuses on the whole chart, OpenCQA problem requires the model to identify relevant portions of the chart to answer the question.
4 OpenCQA Models
Problem Definition
For our OpenCQA problem, we consider three task settings. In the first setup, the model takes a chart and the article containing the chart as input and extracts an answer to an open-ended question. The data for this task can be represented as a tuple of 6 elements , where and represent the chart image, title, metadata, question, document (article) text and answer text, respectively. The metadata consists of the chart labels that are text segments extracted from the chart through OCR (e.g., axis labels, data labels) and their respective bounding boxes. In the second setup, the chart summary is provided as input instead of the whole article. The dataset in this setup can be represented as , where represents the chart summary. In the third setup, the chart summary is not accessible, and the model must rely only on the chart. This is a more difficult and interesting problem setting since real world charts often do not come with explanatory summaries. In this setting, for an input , the model has to learn to generate an explanatory answer .
For training the models, we use state-of-the-art extractive and generative QA models. The supervision of extractive models are extractive answers whereas for the generative models abstractive or edited (as described in Section 3.1) answers are used. Note that the third task setting applies to only generative models, whereas the first and second settings apply to both extractive and generative models. We describe the models below (implementation details are in Section A.2).
4.1 Extractive Models
We adopt two extractive models for the two problem setups where the models extract the answer to the question from the input summary or article.
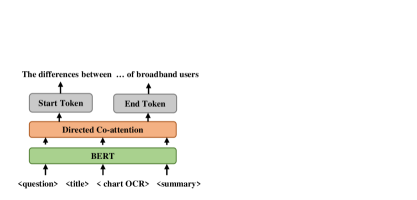
BERTQA Chadha and Sood (2019) is an extractive QA model that uses directed coattention layers Xiong et al. (2016) to improve the performance of the original BERT model Devlin et al. (2019). In this approach, we first pass the question and the text (article or summary) through a BERT model to get the (self-attention based) representations. It then calculates the cross attention from the question to text and text to question and concatenates the resulting vectors to predict the start and end points of the answer span.
ELECTRA Clark et al. (2020) proposes a self-supervised representation learning method that emphasizes computational efficiency. In contrast to Masked Language Modeling (MLM), it uses Replaced Token Detection or RTD as the pretraining task. The training process is inspired by the training of Generative Adversarial Networks or GANs Goodfellow et al. (2020). The training examples are first passed to a generator (typically a small MLM-based model) to replace some of the tokens in the input with other probable but incorrect tokens. ELECTRA (the discriminator) is then trained to distinguish between the “original” vs. “replaced” tokens in the input. This binary classification task is applied to every token, hence it requires fewer training examples compared to MLM training. ELECTRA achieves state-of-the-art results on SQuAD 2.0 Rajpurkar et al. (2018). We use the same experimental setup as with the BERTQA model.
4.2 Generative Models
| Models | Type | ROUGE_-F (1/2/L) | CS | BLEURT | CIDEr | BERTScore | BLEU |
| Setup 1: With Article Provided | |||||||
| BERTQA | Extractive | 22.81/8.53/16.63 | 28.17% | -0.692 | 0.983 | 85.00 | 9.58 |
| ELECTRA | Extractive | 57.67/50.09/53.89 | 54.73 % | 0.066 | 5.100 | 91.01 | 38.79 |
| BART | Generative | 50.68/38.95/45.55 | 54.29% | -0.017 | 4.121 | 91.08 | 23.91 |
| T5 | Generative | 66.57/60.40/63.46 | 68.24% | 0.103 | 5.437 | 93.53 | 41.28 |
| VLT5 | Generative | 58.90/49.97/54.82 | 66.06% | 0.076 | 5.227 | 92.34 | 40.06 |
| GPT2 | Generative | 16.71/66.57/13.75 | 14.71% | -0.745 | 0.814 | 82.05 | 0.99 |
| CODR | Generative | 14.58/1.31/11.37 | 3.4% | -1.155 | 0.051 | 81.90 | 0.43 |
| Setup 2: With Summary Provided | |||||||
| BERTQA | Extractive | 70.97/67.77/69.34 | 85.28% | 0.297 | 7.177 | 94.65 | 66.33 |
| ELECTRA | Extractive | 76.24/74.33/75.48 | 92.57% | 0.378 | 7.823 | 96.06 | 65.40 |
| BART | Generative | 66.41/61.86/64.41 | 68.71% | 0.257 | 6.613 | 93.85 | 38.42 |
| T5 | Generative | 75.77/73.51/74.51 | 81.73% | 0.369 | 7.728 | 95.22 | 57.93 |
| VLT5 | Generative | 75.07/72.35/73.86 | 85.36% | 0.376 | 7.597 | 95.20 | 59.80 |
| GPT2 | Generative | 14.29/11.13/13.42 | 22.00% | -0.782 | 1.725 | 49.18 | 12.68 |
| CODR | Generative | 13.81/0.76/10.25 | 2.480% | -1.039 | 0.038 | 81.87 | 0.31 |
| Setup 3: Without Summary Provided | |||||||
| BART | Generative | 40.29/21.40/32.48 | 49.07% | -0.166 | 2.260 | 89.69 | 7.41 |
| T5 | Generative | 41.12/22.09/32.97 | 52.30% | -0.173 | 2.357 | 89.59 | 9.28 |
| VLT5 | Generative | 42.87/22.60/33.29 | 54.47% | -0.134 | 2.447 | 89.53 | 14.73 |
| GPT2 | Generative | 28.55/11.26/22.46 | 32.00% | -0.493 | 1.314 | 85.05 | 4.89 |
| CODR | Generative | 14.67/1.05/10.90 | 4.14% | -1.170 | 0.053 | 81.86 | 0.32 |
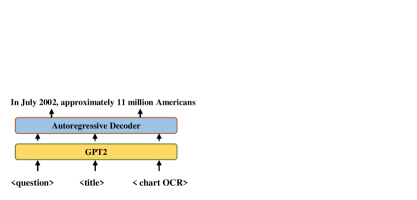
GPT-2 Radford et al. (2019) trains a transformer decoder on the unlabelled BooksCorpus dataset Zhu et al. (2015) using a conditional language modelling objective. Their pretrained model can be fine-tuned on downstream tasks such as textual entailment, similarity and question answering. We fine-tune GPT-2 under the three tasks where all the input elements in each task setting are concatenated as conditioning input to predict the answer.
BART Lewis et al. (2020) uses a standard encoder-decoder transformer architecture. Its pretraining task involves denoising, where text spans in the input text are replaced with a single mask token, and the decoder is tasked to predict the original input sequence. BART has been shown to achieve state-of-the-art performance on text generation tasks such as summarization. In each of our three task settings, we concatenate the corresponding inputs and feed into the model for fine-tuning.
T5 Raffel et al. (2020) is a unified encoder-decoder transformer model that converts language processing tasks into a text2text generation format. It is first pretrained with a ‘fill-in-the-blank’ denoising objective, where 15% of the input tokens are randomly dropped out. The spans of consecutive dropped-out tokens and dropped-out tokens that stand alone are then replaced by special sentinel tokens. Each sentinel token is assigned a token ID that is unique in the input sequence. The decoder then learns to predict those dropped-out tokens, delimited by the same input sentinel token plus a final sentinel token. We fine-tuned T5 on our tasks using the same input format as with BART.
VLT5 Cho et al. (2021) is a T5-based framework that unifies the Vision-Language (VL) tasks as text generation conditioned on multimodal inputs. The input consists of both textual tokens and visual features of objects from the image extracted by Faster R-CNN Ren et al. (2015). The model is pre-trained on multiple multimodal tasks: language modeling, visual QA, visual grounding, image-text matching and grounded captioning. We fine-tuned VL-T5 on our OpenCQA generative task in the following manner. For the textual input, we use the same input format as T5. For the visual input, we extract the visual features of different marks in the chart image (e.g., bars, lines) using Mask R-CNN He et al. (2017) with Resnet-101 as its backbone.
CODR Prabhumoye et al. (2021) proposes a document grounded generation task, where the model uses the information provided in a document to enhance text generation. In their setup, the context and source documents are concatenated and passed to a BART encoder to get a contextualized representation of the document. Then the same encoder is applied to the context alone and both representations are finally concatenated and passed to the BART decoder to generate the text. We fine-tune the pretrained BART encoder and decoder following the approach of CODR for OpenCQA by taking the question as the context and concatenating the rest of input elements as the grounded document.
5 Evaluation
5.1 Automatic Evaluation
Measures
We utilized six measures for automatic evaluation. BLEU Post (2018) measures -gram overlaps between the model generated text and the reference. It is a precision oriented measure and is calculated by taking the geometric mean of BLEU1-4 and multiplying by the exponential of brevity penalty. ROUGE Lin (2004), on the other hand, is recall based and it measures -gram overlaps between the model generated text and the reference as a percentage of -grams in reference summaries. We report ROUGE-F score.
CIDEr Vedantam et al. (2015) measures TF-IDF weighted -gram overlaps between the model generated text and the reference. BLEURT Sellam et al. (2020) is a model-based metric that measures the fluency of the generated sentence and the extent to which it conveys the meaning of the reference. We use BLEURT-base-128. Content Selection or CS score Wiseman et al. (2017) measures how well the generated text matches the gold answer in terms of selecting which records to generate. Since both the BLEURT and CS are calculated at the sentence-level, we average these scores over the whole test set. Finally, we use BERTScore Zhang et al. (2019) which correlates better with human judgments and has been widely adopted recently for text generation evaluation. BERTScore computes token similarity between the candidate and reference using contextualized embeddings rather than relying on exact matches.
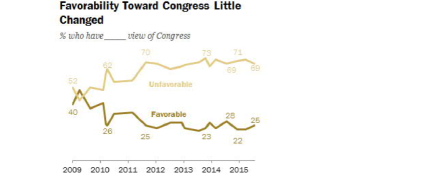
Q1: Describe the change in favorability towards Congress.
|
Q2:
Describe the proportions of U.S. adults and AAAS scientists that think population growth won’t be a problem.

|
Q3:
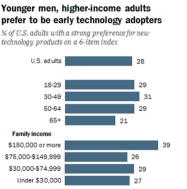
How is the relation between family income and early technology adoption?
|
|---|---|---|
| Gold: Views of Congress continue to hover near record lows: Just 25% of Americans view Congress favorably. | Gold: Just 17% of AAAS scientists and 38% of Americans said population growth won’t be a problem because we will find a way to stretch natural resources. | Gold: Adults with family incomes of at least $150,000 annually tend to express a stronger preference for early technology adoption on this summary index (39% do so) compared with those at middle and lower income levels |
| VLT5: 25% express a favorable opinion of Congress, while 69% view it unfavorably. But since April 2014, the share of Americans with a positive view of Congress has fallen off to 25%. | VLT5: Fully 59% of AAAS scientists say population growth will n’t be a major problem because there will not be enough food and resources in the world, and 17% say we will find a way to stretch natural resources. | VLT5: Younger men (39%) are more likely than older adults (26%) to express a strong preference for being early technology adopters. |
| Bboxes-VLT5: A majority of the public (69%) has a favorable opinion of Congress, while 23% view it unfavorably. In July 2014, the balance of opinion was just the opposite: 47% expressed a favorable opinion of Congress, while 25% held an unfavorable view. | Bboxes-VLT5: Two-thirds of AAAS scientists say population growth will n’t be a major problem because of scarce resources and other resources. At the same time, about six-in-ten of both groups say that the U.S. will find a way to stretch natural resources and hope that we will find a way to stretch these resources | Bboxes-VLT5: Older people in the U.S. tend to have higher levels of education and skills, rather than being early adopters. Many of those with higher incomes prefer early technology adoption; in fact, lower-income adults lag behind younger men in this regard. |
Results
As expected, the models perform better when only the relevant chart summary is given compared to when the entire article is provided (the first 2 setups in Table 2). The generative models have reduced performance due to the added texts in the article in setup 1. The extractive models also have a loss in performance in this setup mainly because they assume the answer comes from a single contiguous text segment whereas a gold answer can be constructed from multiple segments (Section 3.1). Specifically, these methods apply a sliding window over the tokens in the input sequence to find the start and end tokens of the answer span. However, if there are irrelevant tokens in the span, a window may miss portions of the answer that fall outside the maximum sequence length. Also, during training, the model rejects those instances where the answer span is not contained wholly inside the input sequence. The problem is worse with BERTQA because it uses a sequence length of 512 which is much shorter than the article size (1268 tokens on average), whereas ELECTRA uses a sequence length of 2048 tokens, reducing this effect.
We notice that the models perform better when the summary is provided compared to when only the chart is provided (setup 2 vs. 3 in Table 2). This is expected because when the summary is not given, the model does not have any textual reference to generate the answer to a given question. The extractive models BERTQA and ELECTRA achieve high ROUGE-L since they directly extract the text from the given summary to answer the question. ELECTRA performs better than BERTQA on all metrics except BLEU showing the benefit of the generator-discriminator based cascaded training.
When the summary is not provided, VLT5 achieves the best results across most measures, likely because it uses both visual and textual features to generate answers. On the contrary, CODR performs poorly possibly because it was originally intended for discourse generation whereas chart QA is quite a different task. GPT-2 performs better than CODR but it has lower ROUGE-L and CS scores compared to BART and T5.
We conduct several additional experiments to understand: (i) how performance may vary with respect to different chart types; (ii) how including the bounding box information as input impacts the performance; (iii) how naive baselines that either randomly select the answer from the input text or only take the question/summary as input perform; and (iv) how much the OCR-extracted text contributes to the output. Details of these experiments can be found in Section A.3.
| Factual | Relevance | Fluency | Content Cov. | CS | |
|---|---|---|---|---|---|
| VLT5 | 44.89% | 86.67% | 92.45% | 41.11% | 53.19% |
| VLT5-S | 82.45% | 88.67% | 98.45% | 85.12% | 81.15% |
| Gold | 96.45% | 96.00% | 98.89% | 100.00% | 100.00% |
| Krippendorff’s | 0.75 | 0.76 | 0.83 | 0.79 |
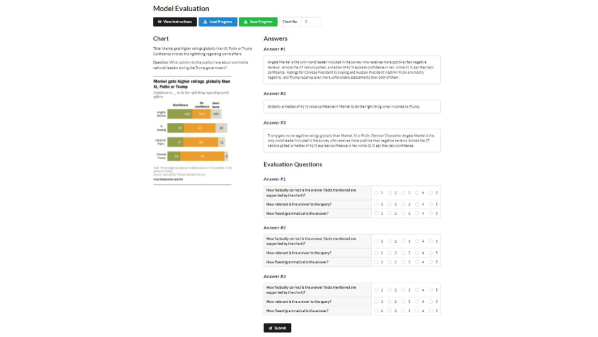
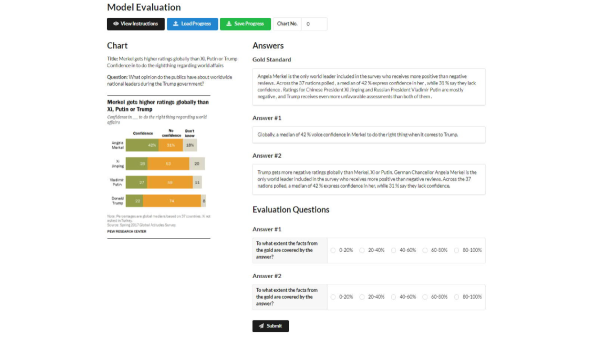
5.2 Human Evaluation
To further assess the quality of the answers generated by the models, we performed a human study on 150 randomly sampled charts from our OpenCQA dataset with three internal annotators who are native speakers of English. For comparison, we chose the outputs from the best performing generative model (VLT5) on the with and without summary settings, which we denote as VLT5-S and VLT5, respectively. We also provide the gold answer (as control) and randomise the order of all three answers to remove biases. The annotators assess each answer based on three criteria adapted from Yuan et al. (2021): (i) Factual correctness which measures the extent to which the generated text contains statements entailed by the source (i.e., generated facts are supported by the chart), (ii) Relevance which measures how consistent the generated text is with respect to the question, (iii) Fluency which measures the extent to which the generated text is deficient of formatting issues, capitalization errors or ungrammatical sentences (e.g., fragments, missing components) which would otherwise make the text difficult to read. For these three criteria, annotators provided a 5-point Likert scale rating from 1 (the worst) to 5 (the best).
We further propose a new recall-oriented criteria called Content Coverage which measures the extent to which the facts from the gold answer are covered by the generated text, ranging from 1 (0-20%) to 5 (80-100%). For this, the order of outputs of the two models were randomized to counterbalance any potential ordering effect. Each comparison was performed by three annotators. To measure inter-annotator reliability, we computed Krippendorff’s alpha Krippendorff (2011) and found a good overall agreement with an alpha coefficient of 0.806.
Table 3 shows the results of human evaluation, where for each model we show the percentage of answers that received the nearly perfect/perfect ratings (i.e., 4 and 5). The gold answers receive high ratings across the first three measures which attests the quality of our dataset. VLT5-S achieves higher ratings across all measures than VLT5 as it has access to the summary. The VLT5 model also received impressive ratings on Relevance and Fluency while it has more room for improvement on Factual Correctness and Content Coverage, especially when the summary is not given. Lastly, we see that the automatic and the human evaluation measures for content coverage, i.e., the CS score and Content Coverage, both of which are recall oriented, tend to be correlated.
5.3 Error Analysis and Challenges
We have manually analyzed the
outputs
from our best performing model to explain the key challenges that existing models face. Overall, the
outputs of VLT5 model are often fluent and grammatically correct as evident from Figure 3. Also, this model rarely hallucinates and is often true to the source context.
However, there are still several areas for improvement which we discuss below.
Factual Correctness and relevancy In Figure 3, both variants of VLT5 fail to associate some reported data values (highlighted in red) with their corresponding axis labels. In (Q3 in Figure 3), the VLT5 model outputs some facts about the relation between ‘age’ and ‘early technology adoption’ but the question asked about the relation with ‘family income’, not ‘age’. To address the factual errors and irrelevant facts, future models could create better input representations including semantic graph representations Teney et al. (2017) by extracting and exploiting relationships among the question, data values, chart elements (e.g., axis labels) and their visual features (e.g., colors).
Mathematical & Logical Reasoning Often gold answers include numerical reasoning to provide rich explanations. For example, in Figure 3(Q2), the gold answer provides a sense of limited proportion by mentioning “Just 17% of AAAS…”, which is not captured in the generated outputs. Future models may improve such numerical reasoning as an intermediate step before surface realization Chen et al. (2020c). In another case (Q3 in Figure 3), the gold answer considers that incomes below 150k are middle and lower income levels which is not captured by models. Future work could infer such rich semantics with the help of external knowledge sources and inference based modelling Bowman et al. (2015); Talmor et al. (2019).
Rare Topics We also observe that the VLT5 model tends to produce less fluent and factually correct answers when the sample comes from a rare topic (e.g., Bboxes-VLT5 in Q2 in Figure 3). Future work could focus on transfer learning and building more diverse datasets to handle such variations.
Automatic Evaluation It has been acknowledged that metrics like BLEU do not capture many data-to-text generation issues Parikh et al. (2020). This is especially the case for open-ended questions where correct answers can be expressed in multiple possible ways.
While we evaluated the models through several metrics, we urge for further research on building better automatic metrics that capture model performance in terms of factual correctness, relevancy and reasoning aspects while also correlating strongly with human judgements.
6 Conclusion
We propose a new benchmark, OpenCQA, for answering open-ended questions about charts using descriptive texts. We also introduce several state-of-the-art baselines and measures. Our evaluation suggests that current state of the art generative models can produce fluent text but still struggle to produce relevant and factually correct statements with numerical and logical reasoning. We hope that OpenCQA will serve as a useful research benchmark for model and metric development and motivate other researchers to explore this new task.
Ethical Considerations
During the dataset collection and annotation process, we had many ethical issues to take into consideration. To respect the intellectual property of the chart publishers, we only used publicly available charts from resources that provide publication rights of downloaded content for academic purposes. According to the terms and conditions for Pew,111https://www.pewresearch.org/about/terms-and-conditions/ users are allowed to use the content as long as they are attributed to the Center or are not attributed to a different party.
To fairly compensate the Mechanical Turk annotators, we compensated the annotators based on the minimum wage in the US (7.25 US$ per hour), which is 1 US$ for each task. Additionally, to protect the privacy of these annotators, all of their annotations were anonymized. To ensure the reproducibility of our experimental results, we have provided the hyperparameter settings in Section A.2.
We foresee one possible misuse of our models that is to spread misinformation. Currently, our model outputs tend to appear fluent but contain some factual errors, as detailed in Section 5.3. Hence, if such model outputs are published without being corrected, it may mislead and misinform the general public.
Limitations
A limitation of our dataset is that we were limited to Pew research (pewresearch.org) as a source due to the nature of our task and thus could not consider other sources. Future work could expand on our dataset when suitable sources become available. Further, we did not consider long-range sequence models such as linformer Wang et al. (2020) or recently proposed memorized transformer Wu et al. (2022) for modeling long sequences. Lastly, our task setup is limited since we only have access to the automatically extracted OCR data which is often noisy. Future methods can focus on improving OCR extraction for this task to improve the input of the model.
Acknowledgement
The authors would like to thank the anonymous reviewers for their helpful comments. This research was supported by the Natural Sciences & Engineering Research Council (NSERC) of Canada.
References
- Antol et al. (2015) Stanislaw Antol, Aishwarya Agrawal, Jiasen Lu, Margaret Mitchell, Dhruv Batra, C Lawrence Zitnick, and Devi Parikh. 2015. Vqa: Visual question answering. In Proceedings of the IEEE international conference on computer vision, pages 2425–2433.
- Barzilay and Lapata (2005) Regina Barzilay and Mirella Lapata. 2005. Collective content selection for concept-to-text generation. In Proceedings of Human Language Technology Conference and Conference on Empirical Methods in Natural Language Processing, pages 331–338, Vancouver, British Columbia, Canada. Association for Computational Linguistics.
- Baumel et al. (2018) Tal Baumel, Matan Eyal, and Michael Elhadad. 2018. Query focused abstractive summarization: Incorporating query relevance, multi-document coverage, and summary length constraints into seq2seq models. arXiv preprint arXiv:1801.07704.
- Bowman et al. (2015) Samuel R. Bowman, Gabor Angeli, Christopher Potts, and Christopher D. Manning. 2015. A large annotated corpus for learning natural language inference. In Proceedings of the 2015 Conference on Empirical Methods in Natural Language Processing, pages 632–642, Lisbon, Portugal. Association for Computational Linguistics.
- Chadha and Sood (2019) Ankit Chadha and Rewa Sood. 2019. Bertqa–attention on steroids. arXiv preprint arXiv:1912.10435.
- Chaudhry et al. (2020) R. Chaudhry, S. Shekhar, U. Gupta, P. Maneriker, P. Bansal, and A. Joshi. 2020. Leaf-qa: Locate, encode attend for figure question answering. In 2020 IEEE Winter Conference on Applications of Computer Vision (WACV), pages 3501–3510.
- Chen et al. (2019) Charles Chen, Ruiyi Zhang, Eunyee Koh, Sungchul Kim, Scott Cohen, Tong Yu, Ryan A. Rossi, and Razvan C. Bunescu. 2019. Figure captioning with reasoning and sequence-level training. CoRR, abs/1906.02850.
- Chen et al. (2020a) Wenhu Chen, Jianshu Chen, Yu Su, Zhiyu Chen, and William Yang Wang. 2020a. Logical natural language generation from open-domain tables. In Proceedings of the 58th Annual Meeting of the Association for Computational Linguistics, pages 7929–7942, Online. Association for Computational Linguistics.
- Chen et al. (2020b) Zhiyu Chen, Wenhu Chen, Hanwen Zha, Xiyou Zhou, Yunkai Zhang, Sairam Sundaresan, and William Yang Wang. 2020b. Logic2Text: High-fidelity natural language generation from logical forms. In Findings of the Association for Computational Linguistics: EMNLP 2020, pages 2096–2111, Online. Association for Computational Linguistics.
- Chen et al. (2020c) Zhiyu Chen, Wenhu Chen, Hanwen Zha, Xiyou Zhou, Yunkai Zhang, Sairam Sundaresan, and William Yang Wang. 2020c. Logic2text: High-fidelity natural language generation from logical forms. pages 2096–2111.
- Cho et al. (2021) Jaemin Cho, Jie Lei, Hao Tan, and Mohit Bansal. 2021. Unifying vision-and-language tasks via text generation. In International Conference on Machine Learning, pages 1931–1942. PMLR.
- Clark et al. (2020) Kevin Clark, Minh-Thang Luong, Quoc V. Le, and Christopher D. Manning. 2020. Pre-training transformers as energy-based cloze models.
- Dang (2005) Hoa Trang Dang. 2005. Overview of duc 2005. In Proceedings of the document understanding conference, volume 2005, pages 1–12.
- Demir et al. (2012) Seniz Demir, Sandra Carberry, and Kathleen F. McCoy. 2012. Summarizing information graphics textually. Computational Linguistics, 38(3):527–574.
- Devlin et al. (2019) Jacob Devlin, Ming-Wei Chang, Kenton Lee, and Kristina Toutanova. 2019. BERT: Pre-training of deep bidirectional transformers for language understanding. In Proceedings of the 2019 Conference of the North American Chapter of the Association for Computational Linguistics: Human Language Technologies, Volume 1 (Long and Short Papers), pages 4171–4186, Minneapolis, Minnesota. Association for Computational Linguistics.
- Ferres et al. (2013) Leo Ferres, Gitte Lindgaard, Livia Sumegi, and Bruce Tsuji. 2013. Evaluating a tool for improving accessibility to charts and graphs. ACM Trans. Comput.-Hum. Interact., 20(5).
- Gong et al. (2019) Li Gong, Josep Crego, and Jean Senellart. 2019. Enhanced transformer model for data-to-text generation. In Proceedings of the 3rd Workshop on Neural Generation and Translation, pages 148–156, Hong Kong. Association for Computational Linguistics.
- Goodfellow et al. (2020) Ian Goodfellow, Jean Pouget-Abadie, Mehdi Mirza, Bing Xu, David Warde-Farley, Sherjil Ozair, Aaron Courville, and Yoshua Bengio. 2020. Generative adversarial networks. Communications of the ACM, 63(11):139–144.
- He et al. (2017) Kaiming He, Georgia Gkioxari, Piotr Dollár, and Ross Girshick. 2017. Mask r-cnn. In 2017 IEEE International Conference on Computer Vision (ICCV), pages 2980–2988.
- He et al. (2016) Kaiming He, Xiangyu Zhang, Shaoqing Ren, and Jian Sun. 2016. Deep residual learning for image recognition. In Proceedings of the IEEE conference on computer vision and pattern recognition, pages 770–778.
- Hoque et al. (2022) Enamul Hoque, Kavehzadeh Parsa, and Ahmed Masry. 2022. Chart question answering: State of the art and future directions. Journal of Computer Graphics Forum (Proc. EuroVis), 41(3):1–18.
- Kafle et al. (2018) Kushal Kafle, Scott Cohen, Brian L. Price, and Christopher Kanan. 2018. DVQA: understanding data visualizations via question answering. CoRR, abs/1801.08163.
- Kahou et al. (2017) Samira Ebrahimi Kahou, Vincent Michalski, Adam Atkinson, Ákos Kádár, Adam Trischler, and Yoshua Bengio. 2017. Figureqa: An annotated figure dataset for visual reasoning. arXiv preprint arXiv:1710.07300.
- Kantharaj et al. (2022a) Shankar Kantharaj, Rixie Tiffany Leong, Xiang Lin, Ahmed Masry, Megh Thakkar, Enamul Hoque, and Shafiq Joty. 2022a. Chart-to-text: A large-scale benchmark for chart summarization. In Proceedings of the 60th Annual Meeting of the Association for Computational Linguistics (Volume 1: Long Papers), pages 4005–4023, Dublin, Ireland. Association for Computational Linguistics.
- Kantharaj et al. (2022b) Shankar Kantharaj, Rixie Tiffany Ko Leong, Xiang Lin, Ahmed Masry, Megh Thakkar, Enamul Hoque, and Shafiq Joty. 2022b. Chart-to-text: A large-scale benchmark for chart summarization. In In Proceedings of the Annual Meeting of the Association for Computational Linguistics (ACL).
- Kim et al. (2020) Dae Hyun Kim, Enamul Hoque, and Maneesh Agrawala. 2020. Answering questions about charts and generating visual explanations. In Proceedings of the 2020 CHI Conference on Human Factors in Computing Systems, pages 1–13.
- Krippendorff (2011) Klaus Krippendorff. 2011. Computing krippendorff’s alpha-reliability. Computing, 1.
- Laskar et al. (2020) Md Tahmid Rahman Laskar, Enamul Hoque, and Jimmy Xiangji Huang. 2020. WSL-DS: Weakly supervised learning with distant supervision for query focused multi-document abstractive summarization. In Proceedings of the 28th International Conference on Computational Linguistics, pages 5647–5654, Barcelona, Spain (Online). International Committee on Computational Linguistics.
- Lebret et al. (2016) Rémi Lebret, David Grangier, and Michael Auli. 2016. Neural text generation from structured data with application to the biography domain. In Proceedings of the 2016 Conference on Empirical Methods in Natural Language Processing, pages 1203–1213, Austin, Texas. Association for Computational Linguistics.
- Lewis et al. (2020) Mike Lewis, Yinhan Liu, Naman Goyal, Marjan Ghazvininejad, Abdelrahman Mohamed, Omer Levy, Veselin Stoyanov, and Luke Zettlemoyer. 2020. BART: Denoising sequence-to-sequence pre-training for natural language generation, translation, and comprehension. In Proceedings of the 58th Annual Meeting of the Association for Computational Linguistics, pages 7871–7880, Online. Association for Computational Linguistics.
- Lin (2004) Chin-Yew Lin. 2004. Rouge: A package for automatic evaluation of summaries. In Text summarization branches out, pages 74–81.
- Lu et al. (2019) Jiasen Lu, Dhruv Batra, Devi Parikh, and Stefan Lee. 2019. Vilbert: Pretraining task-agnostic visiolinguistic representations for vision-and-language tasks. Advances in neural information processing systems, 32.
- Masry et al. (2022) Ahmed Masry, Do Long, Jia Qing Tan, Shafiq Joty, and Enamul Hoque. 2022. ChartQA: A benchmark for question answering about charts with visual and logical reasoning. In Findings of the Association for Computational Linguistics: ACL 2022, pages 2263–2279, Dublin, Ireland. Association for Computational Linguistics.
- Mei et al. (2016) Hongyuan Mei, TTI UChicago, Mohit Bansal, and Matthew R Walter. 2016. What to talk about and how? selective generation using lstms with coarse-to-fine alignment. In Proceedings of NAACL-HLT, pages 720–730.
- Methani et al. (2020) Nitesh Methani, Pritha Ganguly, Mitesh M. Khapra, and Pratyush Kumar. 2020. Plotqa: Reasoning over scientific plots. In Proceedings of the IEEE/CVF Winter Conference on Applications of Computer Vision (WACV).
- Mittal et al. (1998) Vibhu O. Mittal, Johanna D. Moore, Giuseppe Carenini, and Steven Roth. 1998. Describing complex charts in natural language: A caption generation system. Computational Linguistics, 24(3):431–467.
- Munzner (2014) Tamara Munzner. 2014. Visualization analysis and design. CRC press.
- Nema et al. (2017) Preksha Nema, Mitesh M Khapra, Anirban Laha, and Balaraman Ravindran. 2017. Diversity driven attention model for query-based abstractive summarization. In Proceedings of the 55th Annual Meeting of the Association for Computational Linguistics (Volume 1: Long Papers), pages 1063–1072.
- Obeid and Hoque (2020) Jason Obeid and Enamul Hoque. 2020. Chart-to-text: Generating natural language descriptions for charts by adapting the transformer model. In Proceedings of the 13th International Conference on Natural Language Generation, pages 138–147. Association for Computational Linguistics.
- Parikh et al. (2020) Ankur Parikh, Xuezhi Wang, Sebastian Gehrmann, Manaal Faruqui, Bhuwan Dhingra, Diyi Yang, and Dipanjan Das. 2020. Totto: A controlled table-to-text generation dataset. In Proceedings of the 2020 Conference on Empirical Methods in Natural Language Processing (EMNLP), pages 1173–1186.
- Pasunuru et al. (2021) Ramakanth Pasunuru, Asli Celikyilmaz, Michel Galley, Chenyan Xiong, Yizhe Zhang, Mohit Bansal, and Jianfeng Gao. 2021. Data augmentation for abstractive query-focused multi-document summarization. In AAAI 2021.
- Post (2018) Matt Post. 2018. A call for clarity in reporting BLEU scores. In Proceedings of the Third Conference on Machine Translation: Research Papers, pages 186–191, Belgium, Brussels. Association for Computational Linguistics.
- Prabhumoye et al. (2021) Shrimai Prabhumoye, Kazuma Hashimoto, Yingbo Zhou, Alan W Black, and Ruslan Salakhutdinov. 2021. Focused attention improves document grounded generation. In Proceedings of the 2021 Conference of the North American Chapter of the Association for Computational Linguistics. Association for Computational Linguistics.
- Radford et al. (2019) Alec Radford, Jeff Wu, Rewon Child, David Luan, Dario Amodei, and Ilya Sutskever. 2019. Language models are unsupervised multitask learners.
- Raffel et al. (2020) Colin Raffel, Noam Shazeer, Adam Roberts, Katherine Lee, Sharan Narang, Michael Matena, Yanqi Zhou, Wei Li, and Peter J. Liu. 2020. Exploring the limits of transfer learning with a unified text-to-text transformer. Journal of Machine Learning Research, 21(140):1–67.
- Rajpurkar et al. (2018) Pranav Rajpurkar, Robin Jia, and Percy Liang. 2018. Know what you don’t know: Unanswerable questions for squad.
- Reiter et al. (2005) Ehud Reiter, Somayajulu Sripada, Jim Hunter, Jin Yu, and Ian Davy. 2005. Choosing words in computer-generated weather forecasts. Artificial Intelligence, 167(1-2):137–169.
- Ren et al. (2015) Shaoqing Ren, Kaiming He, Ross Girshick, and Jian Sun. 2015. Faster R-CNN: Towards real-time object detection with region proposal networks. In Advances in Neural Information Processing Systems (NIPS).
- Sellam et al. (2020) Thibault Sellam, Dipanjan Das, and Ankur Parikh. 2020. BLEURT: Learning robust metrics for text generation. In Proceedings of the 58th Annual Meeting of the Association for Computational Linguistics, pages 7881–7892, Online. Association for Computational Linguistics.
- Singh and Shekhar (2020) Hrituraj Singh and Sumit Shekhar. 2020. STL-CQA: Structure-based transformers with localization and encoding for chart question answering. In Proceedings of the 2020 Conference on Empirical Methods in Natural Language Processing (EMNLP), pages 3275–3284, Online. Association for Computational Linguistics.
- Spreafico and Carenini (2020) Andrea Spreafico and Giuseppe Carenini. 2020. Neural data-driven captioning of time-series line charts. In Proceedings of the International Conference on Advanced Visual Interfaces, AVI ’20, New York, NY, USA. Association for Computing Machinery.
- Talmor et al. (2019) Alon Talmor, Jonathan Herzig, Nicholas Lourie, and Jonathan Berant. 2019. CommonsenseQA: A question answering challenge targeting commonsense knowledge. In Proceedings of the 2019 Conference of the North American Chapter of the Association for Computational Linguistics: Human Language Technologies, Volume 1 (Long and Short Papers), pages 4149–4158, Minneapolis, Minnesota. Association for Computational Linguistics.
- Talmor et al. (2021) Alon Talmor, Ori Yoran, Amnon Catav, Dan Lahav, Yizhong Wang, Akari Asai, Gabriel Ilharco, Hannaneh Hajishirzi, and Jonathan Berant. 2021. Multimodalqa: Complex question answering over text, tables and images. arXiv preprint arXiv:2104.06039.
- Teney et al. (2017) Damien Teney, Lingqiao Liu, and Anton van den Hengel. 2017. Graph-structured representations for visual question answering. 2017 IEEE Conference on Computer Vision and Pattern Recognition (CVPR), pages 3233–3241.
- Vedantam et al. (2015) Ramakrishna Vedantam, C Lawrence Zitnick, and Devi Parikh. 2015. Cider: Consensus-based image description evaluation. In Proceedings of the IEEE conference on computer vision and pattern recognition, pages 4566–4575.
- Wang et al. (2020) Sinong Wang, Belinda Z Li, Madian Khabsa, Han Fang, and Hao Ma. 2020. Linformer: Self-attention with linear complexity. arXiv preprint arXiv:2006.04768.
- Wiseman et al. (2017) Sam Wiseman, Stuart Shieber, and Alexander Rush. 2017. Challenges in data-to-document generation. In Proceedings of the 2017 Conference on Empirical Methods in Natural Language Processing, pages 2253–2263, Copenhagen, Denmark. Association for Computational Linguistics.
- Wu et al. (2022) Yuhuai Wu, Markus N Rabe, DeLesley Hutchins, and Christian Szegedy. 2022. Memorizing transformers. arXiv preprint arXiv:2203.08913.
- Xiong et al. (2016) Caiming Xiong, Victor Zhong, and Richard Socher. 2016. Dynamic coattention networks for question answering. arXiv preprint arXiv:1611.01604.
- Yang et al. (2017) Zichao Yang, Phil Blunsom, Chris Dyer, and Wang Ling. 2017. Reference-aware language models. In Proceedings of the 2017 Conference on Empirical Methods in Natural Language Processing, pages 1850–1859.
- Yuan et al. (2021) Weizhe Yuan, Graham Neubig, and Pengfei Liu. 2021. Bartscore: Evaluating generated text as text generation. arXiv preprint arXiv:2106.11520.
- Zhang et al. (2019) Tianyi Zhang, Varsha Kishore, Felix Wu, Kilian Q Weinberger, and Yoav Artzi. 2019. Bertscore: Evaluating text generation with bert. arXiv preprint arXiv:1904.09675.
- Zhong et al. (2021) Ming Zhong, Da Yin, Tao Yu, Ahmad Zaidi, Mutethia Mutuma, Rahul Jha, Ahmed Hassan Awadallah, Asli Celikyilmaz, Yang Liu, Xipeng Qiu, and Dragomir Radev. 2021. Qmsum: A new benchmark for query-based multi-domain meeting summarization.
- Zhu et al. (2015) Yukun Zhu, Ryan Kiros, Rich Zemel, Ruslan Salakhutdinov, Raquel Urtasun, Antonio Torralba, and Sanja Fidler. 2015. Aligning books and movies: Towards story-like visual explanations by watching movies and reading books. In Proceedings of the IEEE international conference on computer vision, pages 19–27.
Appendix A Appendices

A.1 Data Collection & Annotation
A.1.1 Data Collection
We built our OpenCQA dataset based on the Chart-to-text benchmark constructed by Kantharaj et al. (2022b). We manually went over all the charts in this benchmark to retain 7,724 that we deemed suitable for our study. In particular, we filtered out samples that are too complex and samples which we could not make an open-ended question. Figure 5 shows examples of such samples.
In the Chart-to-text benchmark, each sample consists of a chart, the title, text extracted using an OCR method and associated summary text and the original article. OCR text segments were extracted top to bottom left to right along with their rectangular bounding boxes given as {x,y,len(x),len(y)}. The extracted title from the chart image was taken as the final chart title if there was no associated alt text with the chart image. If the alt text (which gives a short chart description) was available, the longer of the two was taken by comparing it with the extracted title. The summary for each chart was obtained by finding the most relevant texts to the chart following an annotation process which is described in detail in Kantharaj et al. (2022b).
A.1.2 Data Annotation
In each HIT (Human Intelligent Task), the worker answered three questions previously asked by another coworker for three separate charts respectively and also created three new question-answer pairs for three new charts (see figure 8). The first round of 30 samples were created by the authors but were not included in the final dataset to remove any potential bias. Each subsequent round of samples were created by crowdworkers who would answer existing question that were created in the previous round while also creating new question-answer pairs for the next round.
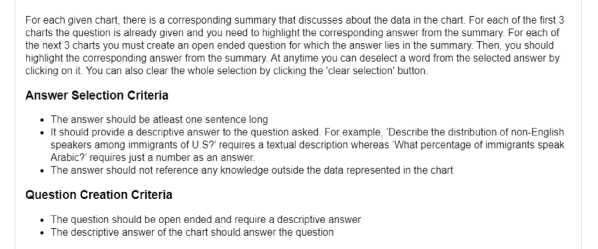
Each participant was first provided with a consent form where the complete procedure of the study and data collection was explained. Once the participant provided consent, detailed instructions were shown on how to complete the task(see Figure 9). In particular, participants were instructed to create open-ended questions that required a descriptive answer. An answer was considered to be descriptive if it was at least one sentence long and derivable from the chart(i.e., it did not refer to any knowledge outside the data represented in the chart). This method of selecting the answer for the question from the summary is very controlled since the summary was written by a professional writer and these summaries usually had good linguistic style and grammatical structure. Participants were additionally shown sample question-answer pairs to explain how ideal questions looked like (see Figure 10).
To ensure quality, only participants with a hit approval rate greater than 95% and over 5,000 approved hits were selected for pre-screening. In the pre-screening stage, participants completed a sample task that allowed us to assess their proficiency for this study. Those who successfully completed the task according to the given instructions were qualified for participating in the main study. The study protocol was approved by the ethics review board at York University with certificate ID e2021-317.
(1) Too Complex
|
(2) Cannot Create Open Ended Question

|
(3) Good
|
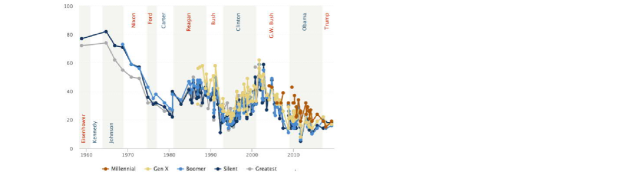
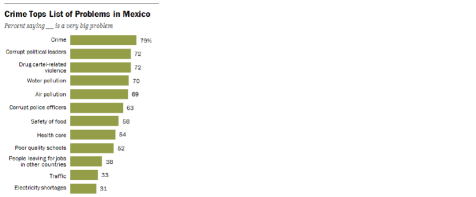
| Historically, there have been modest differences between generational groups in trust in government and that remains the case today. Currently, 19% of Millennials (now ages 23-38) report trusting the government, similar to the shares of older generations who say the same. Trust in government remains at or near historically low levels across generational lines. | Fact Tank’s look at standardized test results around the world seemed to bear out these sentiments: U.S. students are improving – slowly – in math and science, but still lagging their peers internationally. | About six-in-ten (58%) say food safety is a very big problem, and 54% say the same about health care. Roughly four-in-ten or fewer are troubled by people leaving for jobs in other countries (38%), traffic (33%) and electricity shortages (31%). |
(1) Identify
Question:
What are the current thoughts on direct democracy?
|
(2) Compare
Question:
Compare Americans and Germans views about the world economic leader?
|
(1) Summarise
Question:
Explain the distribution of people who know a transgender person?
|
(4) Discover
Question:
How do Americans’ see the coronavirus statistics?
|
| A global median of 66% say direct democracy–in which citizens vote on major issues–would be a good way to govern. | As far as what share of Americans say they know a transgender person, 37% say they personally do, including 13% who say they have a close friend or a family member who is transgender (9% say they have a close friend and 6% have a family member who is transgender). About a quarter of Americans (24%) say they have an acquaintance who is transgender, while 7% say they have a transgender co-worker. | Americans and Germans diverge on who is the world ’s leading economic power. Roughly half of Americans (49%) name the U.S. as the world ’s economic leader, while only 19% of Germans say the same . Over half of Germans (53%) say China is the leading economy. A further 21% of Germans say the countries of the European Union are the world’s top economic power, while only 7% of Americans say this. | The survey finds that a majority of Americans (60%) say the primary reason that the number of confirmed coronavirus cases is increasing is because there are more new infections, not just more testing for the disease . About four-in-ten (39%) say cases are rising primarily because more people are being tested than in previous months. |
Question:
How do married adults conceive their relationship satisfaction in comparison to adults living with a partner?
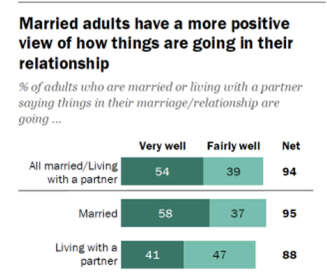 VLT5: Compared with adults who are married or living with a partner, many are more positive about how things are going in their relationship. Roughly nine-in-ten say that their marriage or relationship is going very or fairly well, compared with 37% of adults who are living with a partner.
Gold Answer: Married adults are more likely than those who are living with a partner to say things are going very well in their relationship (58% vs. 41%) They also express higher levels of satisfaction with specific aspects of their relationship, including the way household chores are divided between them and their spouse or partner how well their spouse or partner balances work and personal life, how well they and their spouse or partner communicate, and their spouse’s or partner’s approach to parenting.
VLT5: Compared with adults who are married or living with a partner, many are more positive about how things are going in their relationship. Roughly nine-in-ten say that their marriage or relationship is going very or fairly well, compared with 37% of adults who are living with a partner.
Gold Answer: Married adults are more likely than those who are living with a partner to say things are going very well in their relationship (58% vs. 41%) They also express higher levels of satisfaction with specific aspects of their relationship, including the way household chores are divided between them and their spouse or partner how well their spouse or partner balances work and personal life, how well they and their spouse or partner communicate, and their spouse’s or partner’s approach to parenting.
|
Question:
What are the partisans views on whether the marches will increase public support for science?
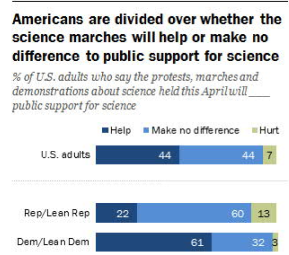 VLT5: Democrats and Democratic-leaning independents are divided: 60% say the marches will increase public support for science, while just 32% say the demonstrations will not hurt the public.
Gold Answer: Most Democrats and Democratic leaners (61%) believe the marches and demonstrations held in April will benefit public support for science. By contrast, just 22% of Republicans and independents who lean to the GOP say the marches will help drive public support for science, while six-in-ten (60%) of this group believes the marches will have no impact on public support and 13% say the marches will hurt public support.
VLT5: Democrats and Democratic-leaning independents are divided: 60% say the marches will increase public support for science, while just 32% say the demonstrations will not hurt the public.
Gold Answer: Most Democrats and Democratic leaners (61%) believe the marches and demonstrations held in April will benefit public support for science. By contrast, just 22% of Republicans and independents who lean to the GOP say the marches will help drive public support for science, while six-in-ten (60%) of this group believes the marches will have no impact on public support and 13% say the marches will hurt public support.
|
Question:
What are the public opinions about business corporations
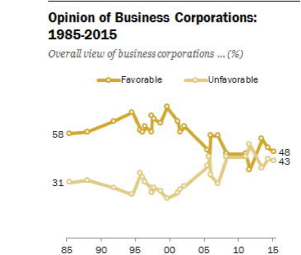 VLT5: Currently, 48% express a favorable view of business corporations, while 43% express an unfavorable view.
Gold Answer: 48% hold a favorable view of business corporations, compared with 43% who hold an unfavorable view.
VLT5: Currently, 48% express a favorable view of business corporations, while 43% express an unfavorable view.
Gold Answer: 48% hold a favorable view of business corporations, compared with 43% who hold an unfavorable view.
|
Question:
Describe the trend of Facebook users usage of the site on daily basis?
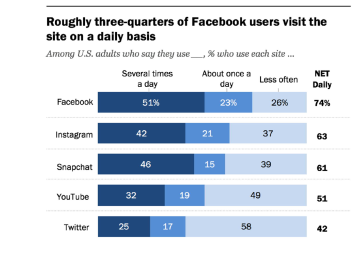 VLT5: About three-quarters of Facebook users (71%) say they visit the site several times a day, or several times a day. The roughly one-third (26%) say they visit the site at least once a day, or several times a day.
Gold Answer: Roughly three-quarters of Facebook users (74%) visit the site daily, including about half who do so several times a day.
VLT5: About three-quarters of Facebook users (71%) say they visit the site several times a day, or several times a day. The roughly one-third (26%) say they visit the site at least once a day, or several times a day.
Gold Answer: Roughly three-quarters of Facebook users (74%) visit the site daily, including about half who do so several times a day.
|
Question:
What are views on genetic engineering of mosquitos?
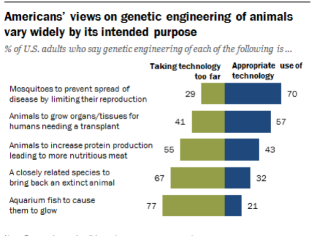 VLT5: Two-thirds or more of Americans (70%) say genetic engineering of mosquitos is appropriate to prevent the spread of disease by limiting their reproduction. But a majority of Americans (55%).
Gold Answer: Seven -in-ten Americans (70 %) believe that genetically engineering mosquitoes to prevent their reproduction and therefore the spread of some mosquito-borne diseases would be an appropriate use of technology, while about three-in-ten (29%) see the use of genetic engineering for this purpose as taking technology too far.
VLT5: Two-thirds or more of Americans (70%) say genetic engineering of mosquitos is appropriate to prevent the spread of disease by limiting their reproduction. But a majority of Americans (55%).
Gold Answer: Seven -in-ten Americans (70 %) believe that genetically engineering mosquitoes to prevent their reproduction and therefore the spread of some mosquito-borne diseases would be an appropriate use of technology, while about three-in-ten (29%) see the use of genetic engineering for this purpose as taking technology too far.
|
Question:
Compare the British approval and rejection levels about being a member of the EU.
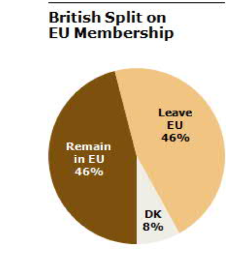 VLT5: As the 2014-10 EU elections, Britain’s approval rating is only slightly lower than the 49% who approved of becoming a member while only 8% said they would leave.
Gold Answer: The British, remain evenly divided on leaving the EU: 46% say stay and 46% say go.
VLT5: As the 2014-10 EU elections, Britain’s approval rating is only slightly lower than the 49% who approved of becoming a member while only 8% said they would leave.
Gold Answer: The British, remain evenly divided on leaving the EU: 46% say stay and 46% say go.
|

A.2 Baseline Models
The architectures of different example models along with sample inputs and outputs are shown in Figure 4. All models concatenate the question, title and OCR extracted data and additionally the summary/article based on the problem setting. We provide more details on the hyperparameter settings for different models below.
GPT2
We fine-tune GPT2 with a batch size of 6 for 5 epochs with a max input sequence length of 512 tokens and output sequence length of 128 tokens.
BERTQA
We fine-tune BERT-large ( 340M parameters, 24 layers) with a batch size of 4 for 2 epochs, with a max input sequence length of 512 tokens and output sequence length of 128 tokens.
CODR
We fine-tune BART-large for 10 epochs and a batch size of 6 with max input sequence length of 512 tokens, output sequence length of 128 tokens,gradient accumulation set to 1 and the other parameters at default settings.
BART
We fine-tune BART-Base222huggingface.co/transformers (140M, 6-layers) with max input sequence length of 512 tokens, for 50K iterations with a batch size of 4 and evaluate after every 1,000 iterations on the validation set. The initial learning rate is set to 0.00005. For inference, we use the model with the lowest validation loss and decode with a beam size of 4.
T5
Similar to BART, we fine-tune T5-Base2 (220M, 12-layer Transformer as the encoder and decoder) with max input sequence length of 512 tokens, for 100k iterations with a batch size of 4 and an initial learning rate of 0.00001, evaluate after every 1,000 iterations on validation set, and use the model with best validation loss for testing. Inference is done with beam search with a beam size 4.
VLT5
We fine-tune the pretrained VLT5 (T5-base as its backbone) for 100 epoches with a learning rate of 0.0001 and max input sequence length of 512 tokens. Inference is done with beam search with a beam size of 4. Note that the original VL-T5 represents an input image with 36 object regions. However, since the number of bounding-box objects in charts varies from one to another, we either pad the extracted visual features (with zeros) or truncate them to maintain the length at 36.
Electra
We fine-tune Electra-Base for 25,000 iterations with a batch size of 4 and initial learning of 0.0001. The max sequence size of input is set to 2048. For inference, the batch size is set to 4 with search beam size of 20.
| Models | Type | ROUGE_-F (1/2/L) | CS | BLEURT | CIDEr | BERTScore | BLEU |
|---|---|---|---|---|---|---|---|
| Setup 1:With Article Provided | |||||||
| Bboxes-BERTQA | Extractive | 23.95/9.17/16.69 | 32.71% | -0.736 | 1.080 | 85.10 | 9.35 |
| Bboxes-ELECTRA | Extractive | 52.12/43.07/47.49 | 49.74 % | -0.051 | 4.379 | 89.97 | 30.77 |
| Bboxes-BART | Generative | 45.07/31.93/39.55 | 48.48% | -0.108 | 3.411 | 90.20 | 16.78 |
| Bboxes-T5 | Generative | 66.21/60.15/63.40 | 67.49% | 0.076 | 5.414 | 93.55 | 41.58 |
| BBoxes-VLT5 | Generative | 55.91/46.53/51.76 | 62.05% | 0.048 | 4.932 | 91.83 | 37.94 |
| Bboxes-GPT2 | Generative | 16.78/6.89/14.08 | 15.45% | -0.757 | 0.85 | 81.12 | 1.36 |
| Bboxes-CODR | Generative | 13.67/0.97/10.88 | 1.73% | -1.026 | 0.035 | 82.40 | 0.00 |
| BERTQA | Extractive | 22.81/8.53/16.63 | 28.17% | -0.692 | 0.983 | 85.00 | 9.58 |
| ELECTRA | Extractive | 57.67/50.09/53.89 | 54.73 % | 0.066 | 5.100 | 91.01 | 38.79 |
| BART | Generative | 50.68/38.95/45.55 | 54.29% | -0.017 | 4.121 | 91.08 | 23.91 |
| T5 | Generative | 66.57/60.40/63.46 | 68.24% | 0.103 | 5.437 | 93.53 | 41.28 |
| VLT5 | Generative | 58.90/49.97/54.82 | 66.06% | 0.076 | 5.227 | 92.34 | 40.06 |
| GPT2 | Generative | 16.71/66.57/13.75 | 14.71% | -0.745 | 0.814 | 82.05 | 0.99 |
| CODR | Generative | 14.58/1.31/11.37 | 3.4% | -1.155 | 0.051 | 81.90 | 0.43 |
| Setup 2:With Summary Provided | |||||||
| Bboxes-BERTQA | Extractive | 71.76/68.56/70.13 | 85.25% | 0.309 | 7.216 | 94.73 | 67.24 |
| Bboxes-ELECTRA | Extractive | 75.87/73.78/75.09 | 91.93% | 0.367 | 7.766 | 95.98 | 65.17 |
| Bboxes-BART | Generative | 63.11/57.22/60.44 | 65.93% | 0.205 | 6.090 | 93.23 | 36.12 |
| Bboxes-T5 | Generative | 76.54/74.24/75.35 | 84.21% | 0.377 | 7.780 | 95.36 | 60.26 |
| BBoxes-VLT5 | Generative | 73.91/71.07/72.67 | 80.92% | 0.341 | 7.470 | 94.98 | 58.25 |
| Bboxes-GPT2 | Generative | 18.21/15.41/17.47 | 25.73% | -0.686 | 1.955 | 43.28 | 16.06 |
| Bboxes-CODR | Generative | 12.16/0.73/9.31 | 2.040% | -1.283 | 0.046 | 80.17 | 0.19 |
| BERTQA | Extractive | 70.97/67.77/69.34 | 85.28% | 0.297 | 7.177 | 94.65 | 66.33 |
| ELECTRA | Extractive | 76.24/74.33/75.48 | 92.57% | 0.378 | 7.823 | 96.06 | 65.40 |
| BART | Generative | 66.41/61.86/64.41 | 68.71% | 0.257 | 6.613 | 93.85 | 38.42 |
| T5 | Generative | 75.77/73.51/74.51 | 81.73% | 0.369 | 7.728 | 95.22 | 57.93 |
| VLT5 | Generative | 75.07/72.35/73.86 | 85.36% | 0.376 | 7.597 | 95.20 | 59.80 |
| GPT2 | Generative | 14.29/11.13/13.42 | 22.00% | -0.782 | 1.725 | 49.18 | 12.68 |
| CODR | Generative | 13.81/0.76/10.25 | 2.480% | -1.039 | 0.038 | 81.87 | 0.31 |
| Setup 3:Without Summary Provided | |||||||
| Bboxes-BART | Generative | 39.79/21.24/31.94 | 49.12% | -0.171 | 2.254 | 89.63 | 7.40 |
| BBoxes-T5 | Generative | 40.88/21.86/32.96 | 51.12% | -0.181 | 2.339 | 89.56 | 9.09 |
| BBoxes-VLT5 | Generative | 42.62/22.18/32.93 | 53.26% | -0.132 | 2.382 | 89.52 | 14.01 |
| Bboxes-GPT2 | Generative | 28.57/10.91/22.24 | 31.30% | -0.459 | 1.246 | 84.50 | 3.92 |
| Bboxes-CODR | Generative | 14.18/1.19/10.22 | 4.43% | -1.053 | 0.053 | 81.77 | 0.22 |
| BART | Generative | 40.29/21.40/32.48 | 49.07% | -0.166 | 2.260 | 89.69 | 7.41 |
| T5 | Generative | 41.12/22.09/32.97 | 52.30% | -0.173 | 2.357 | 89.59 | 9.28 |
| VLT5 | Generative | 42.87/22.60/33.29 | 54.47% | -0.134 | 2.447 | 89.53 | 14.73 |
| GPT2 | Generative | 28.55/11.26/22.46 | 32.00% | -0.493 | 1.314 | 85.05 | 4.89 |
| CODR | Generative | 14.67/1.05/10.90 | 4.14% | -1.170 | 0.053 | 81.86 | 0.32 |
A.3 Additional Results from Evaluation
A.3.1 Performance by Chart Types
We analyze the performance by chart types in Table 7. We observe that our best performing models perform better at summarizing simple (pie charts) and frequent chart types (bar charts), whereas the performance generally decreases for complex and less frequent charts (e.g., scatter plots).
A.3.2 Ablation Test
In table 4 we show the results of an ablation test, where each model is given the question and OCR-extracted chart data as input. Here, models with "Bboxes" prefix are given the bounding boxes of text segments in the chart, and the other models are repeated here from Table 2 for comparison. We observes that the inclusion of the bounding box information does not necessarily improves the performance. One possible reason could be that bounding box extraction of the OCR model is not always perfect as the model sometimes merges or splits the bounding boxes incorrectly. Note that for ROUGE-F evaluation we used the python package rouge-score, which is a Google re-implementation of the original Rouge-1.5.5 perl script.
| Models | CEF-Precision | CEF-Recall | CEF-Coverage |
|---|---|---|---|
| Test | 49.32 | 25.89% | 47.34 |
| Setup 1:With Article Provided | |||
| Bboxes-VLT5 | 38.05% | 21.16% | 42.18% |
| VLT5 | 42.32% | 22.57% | 43.11% |
| Bboxes-T5 | 42.82% | 22.63% | 43.60% |
| T5 | 42.50% | 24.31% | 45.30% |
| Setup 2:With Summary Provided | |||
| Bboxes-VLT5 | 42.94% | 25.18% | 46.71% |
| VLT5 | 43.48% | 25.15% | 46.96% |
| Bboxes-T5 | 42.53% | 25.78% | 47.74% |
| T5 | 42.04% | 26.96% | 49.06% |
| Setup 3:Without Summary Provided | |||
| Bboxes-VLT5 | 48.70% | 22.46% | 43.54% |
| VLT5 | 50.18% | 23.09% | 44.08% |
| Bboxes-T5 | 60.71% | 20.36% | 38.50% |
| T5 | 61.89% | 21.24% | 40.32% |
| Models | ROUGE_-F (1/2/L) | CS | BLEURT | CIDEr | BERTScore | BLEU |
|---|---|---|---|---|---|---|
| T5-Only Question | 31.57/13.19/25.05 | 31.66% | -0.396 | 1.401 | 87.94 | 5.34 |
| T5-Only Summary | 67.56/63.78/65.47 | 82.22% | 0.199 | 6.856 | 93.94 | 49.18 |
| VLT5-Only Question | 29.56/11.56/22.43 | 32.98% | -0.363 | 1.322 | 87.74 | 6.34 |
| VLT5-Only Summary | 67.31/63.54/65.79 | 77.47% | 0.238 | 6.803 | 94.07 | 52.71 |
| Random Summary Baseline | 54.48/46.22/49.07 | 62.28% | -0.015 | 4.997 | 90.89 | 45.69 |
| Random Article Baseline | 23.95/8.81/17.12 | 19.66% | -0.641 | 0.960 | 84.36 | 5.50 |
| VLT5 (Without Summary) | |||||
|---|---|---|---|---|---|
| Bar | Line | Pie | Area | Scatter | |
| ROUGE | 43.75/23.41/33.96 | 39.86/19.82/30.64 | 48.18/26.12/39.12 | 100.0/100.0/100.0 | 31.89/9.21/19.33 |
| BLEURT | -0.134 | -0.150 | -0.020 | 0.800 | -0.329 |
| CIDEr | 2.576 | 2.058 | 2.912 | 0.0 | 1.181 |
| BERTScore | 89.60 | 89.21 | 90.86 | 98.79 | 86.35 |
| VLT5 (With Summary) | |||||
| Bar | Line | Pie | Area | Scatter | |
| ROUGE | 75.61/72.9/74.38 | 73.19/70.46/71.93 | 80.1/77.57/79.48 | 100.0/100.0/100.0 | 67.46/66.83/67.46 |
| BLEURT | 0.381 | 0.353 | 0.457 | 0.800 | 0.302 |
| CIDEr | 7.657 | 7.414 | 7.920 | 0.0 | 7.378 |
| BERTScore | 95.28 | 94.87 | 96.24 | 98.79 | 93.47 |
| Question Validation & Editing | Disagreement Resolution | Decontextualization |
Describe the concerns on mobile phones addictions among the surveyed countries?
![[Uncaptioned image]](/html/2210.06628/assets/x29.png)
|
Ans 1: In addition to their concerns about the impact of mobile phones on children, majorities across the 11 countries surveyed also say people should also be very worried about issues such as identity theft (an 11-country median of 66% say people should be very concerned about this), exposure to false information (64%) addiction (62%) and harassment or bullying (59%) when using their mobile phones face-to-face due to mobile phone use (48%)
Ans 2: the impact of mobile phones on children, majorities across the 11 countries surveyed also say people should also be very worried about issues such as identity theft (an 11-country median of 66 % say people should be very concerned about this), mobile phone addiction (62%) and harassment or bullying (59%) when using their mobile phones |
In addition to their concerns about the impact of mobile phones on children, majorities across the 11 countries surveyed also say people should also be very worried about issues such as identity theft (an 11-country median of 66% say people should be very concerned about this), exposure to false information (64%), mobile phone addiction (62%) and harassment or bullying (59%) when using their mobile phones. Fewer are very concerned about the risk that people might lose the ability to communicate face-to-face due to mobile phone use (48%). |
| Model Input | Generated Answer | |
|---|---|---|
Question:
What are the partisans views on whether the marches will increase public support for science?
![[Uncaptioned image]](/html/2210.06628/assets/x30.png)
|
OCR extracted data: Americans are divided orever whether the | science marches will help or make no | difference topublic support for science | % of USS adults who say the protests, marches Aprilwill and | demonstrations public about science held this Aprilwill | public supportfor science | Help Make no d ifference Hurt | U.S ad ults | 44 | 44 | Rep/Lean Rep | 22 | 60 | 13 | Dem/Lean Dem | 61 | 32 | Note: Respondents who did notgive 2017 an answerare.not.shown. | "Americans Source Survey Divided conducted May3-7 notgive Recent 2017 | "Americans Survey Divided on Whether Recent Science Protests Will | Benefit Scientists’ Ca uses | PEW RESEARCH CENTER
Summary: Americans are closely divided on the issue of whether the marches will increase public support for science: 44% think they will help and 44% think they will make no difference. Another 7% believe they will hurt public support . Most Democrats and Democratic leaners (61% ) believe the marches and demonstrations held in April will benefit public support for science. By contrast, just 22% of Republicans and independents who lean to the GOP say the marches will help drive public support for science, while six-in-ten (60%) of this group believes the marches will have no impact on public support and 13% say the marches will hurt public support. |
Americans are closely divided on the issue of whether the marches will increase public support for science: 44% think they will help and 44% think they will make no difference. Another 7% believe they will hurt public support. Most Democrats and Democratic leaners (61%) believe the marches and demonstrations held in April will benefit public support for science. By contrast, just 22% of Republicans and independents who lean to the GOP say the marches will help drive public support for science , while six-in-ten (60%) of this group believes the marches will have no impact on public support and 13% say the marches will. |
A.3.3 Evaluation with Naive Baselines
In order to better understand the dataset and how challenging the task is, we analyze the results of fine-tuning and testing T5 and VLT5, our best performing models with only the question or the summary as input (see Table 6) In addition, we choose a naive baseline which randomly selects the answer from the given input text. This baseline spans 52% tokens of the input when only the summary is given whereas it spans 7% tokens of the input when the article is given (based on the statistics of tokens overlapping between the summary or article and the gold answer in our dataset(see Figure 2(a))). As expected, we can see that both models struggle to answer the question when only the question is given as input. However, they perform better with only summary as input as the model has access to the summary containing the answer. In contrast, the performance drops when we use the baseline that randomly selects the answer, especially when the entire article is given as input as it becomes more difficult to randomly guess the answer.
A.3.4 The Effect of the OCR-text
We further analyze how the model extracts the answer from different input sources (e.g., input summary vs. OCR-generated text). For this purpose, we consider three new metrics for Chart Extraction Factor (CEF) scores as follow:
CEF-Precision: Shows how much fraction of generated tokens in the answer (excluding stopwords) is coming from OCR-extracted text segments .
CEF-Coverage: Represents how much fraction of OCR-extracted text segments contribute to the generated answer . An OCR-extracted text segment contributes to the answer if any generated tokens in the answer appear in the segment.
CEF-Recall: Shows how much fraction of OCR tokens in is recalled in answer A.
The results on our top performing models are shown in Table 5. We observe that the CEF-Precision score decreases across all models when the summary or the article is given as input compared to the setup where only the OCR text is given. This suggests that the model utilizes less information from the extracted OCR text when it has access to summary or article. In contrast, CEF-Coverage scores tend to increase when the summary is provided in comparison to without summary as the answer tends to cover more OCR text segments if the summary is present. The CEF-recall scores increase when the summary is provided since many tokens in the summary overlap with the OCR extracted text. Table 9 illustrates an example of how OCR-extracted texts and the input summary contributed to the answer.
A.3.5 Human Evaluation
The user interface for the human evaluation annotation task of comparing among generated answers by different models are given in Figure 11.
A.3.6 Additional Sample Outputs
Additional sample outputs from the best performing model are shown in Figure 7.
A.3.7 Additional Related Work
Query Focused Summarization
In this task, the goal is to generate a summary of the text document(s) based on a given query. For abstractive summarization, a key challenge is that there are only a few small datasets on specific domains such as news Dang (2005) debate Nema et al. (2017) and meeting Zhong et al. (2021). Given the lack of large training data, some prior methods Baumel et al. (2018); Laskar et al. (2020); Pasunuru et al. (2021) focus on applying transfer learning techniques to first pretrain on a large generic summarization dataset and then finetune on a specific query focused summarization task. However, these models are not designed to incorporate visual features of charts and their target texts are quite different than ours, as we focus on generating data insights with logical reasoning aspects.