Distributed, combined CPU and GPU profiling within HPX using APEX
Juhan Frank4, Geoffrey C. Clayton
Abstract
Benchmarking and comparing performance of a scientific simulation across hardware platforms is a complex task. When the simulation in question is constructed with an asynchronous, many-task (AMT) runtime offloading work to GPUs, the task becomes even more complex. In this paper, we discuss the use of a uniquely suited performance measurement library, APEX, to capture the performance behavior of a simulation built on HPX, a highly scalable, distributed AMT runtime. We examine the performance of the astrophysics simulation carried-out by Octo-Tiger on two different supercomputing architectures. We analyze the results of scaling and measurement overheads. In addition, we look in-depth at two similarly configured executions on the two systems to study how architectural differences affect performance and identify opportunities for optimization. As one such opportunity, we optimize the communication for the hydro solver and investigated its performance impact.
Index Terms:
CUDA™, HPX, Performance MeasurementsI Introduction
Whether in CPU code, in GPU kernels, or in the inter-node communication – performance bottlenecks in High-Performance Computing (HPC) applications may be hidden in any part of the program. There have been many attempts to ease the development of HPC applications and to indicate and to avoid as many bottlenecks as possible. One example is the asynchronous many-task (AMT) system HPX [1], which aims to solve some of the more common problems. It makes it easier to overlap communication and computation, to employ both CPUs and GPUs, and to avoid overhead for fine-grained parallelism using lightweight threading.
Even with HPX, of course, it is still perfectly possible to introduce performance bottlenecks into one’s application. Being able to collect performance measurements to profile an HPX application remains important. For AMT systems such as HPX, it is beneficial to have a profiling tool that understands the task-based nature of the runtime system – for example, call stacks themselves are less useful: A system thread may jump back and forth between various HPX tasks as they are yielded and resumed, and the call stack itself may be dozens of levels of runtime functions that have no particular interest to the application developer.
Collecting these measurements in a profiling run is challenging, as one not only needs a profiling framework that supports both CPU and GPU code as well as the distributed collection of profiling data across many compute nodes. One also needs to keep any overheads introduced by the profiling itself to an absolute minimum. Otherwise, it would not only distort the collected measurements, but also make large, distributed runs infeasible, rendering us unable to detect potential performance bottlenecks that only appear at scale.
HPX is integrated with a performance measurement library, APEX (Automatic Performance for Exascale), which was designed specifically for the HPX runtime and the above requirements. In previous work, APEX was used together with the HPX performance counters to collect performance measurements for Octo-Tiger [2], an astrophysics application which is built upon HPX and contains optimized kernels for both CPUs and GPUs [3, 4]. Octo-Tiger is capable of running the same kernels on the CPUs and GPUs simultaneously (on different data) depending on the load. In that work, profiling data of Octo-Tiger was gathered with APEX in distributed CPU-only runs where the energy usage, the idle rate, and overhead of the HPX AGAS (Active Global Address Space) was analyzed [5]. Furthermore, combined CPU-GPU profiling runs have been performed on Summit, analyzing the performance behavior of Octo-Tiger’s new CUDA™ hydro module in different configurations for simple benchmark scenarios [6].
All these previous efforts inspire this new work, collecting performance measurements on both CPU and GPU during a full-scale production-scenario run on Piz Daint (Cray™ XC50 with one 12-core Intel® Xeon® E5-2690 + one NVIDIA® Tesla® P100 per node)[7] and Summit (IBM® AC922 with two 22-core Power9™ + six NVIDIA® Tesla® V100 per node)[8].
The purpose of this work is thus twofold: First, we collect data that we can actually use to improve Octo-Tiger by identifying potential bottlenecks. To do so, we collect measurements running the production scenario for 40 time-steps both on Summit and Piz Daint, using 48 compute nodes on Piz Daint and 8 compute nodes on Summit (resulting in 48 GPUs in either case). With those measurements, we can investigate the specific parts of Octo-Tiger on two distinct architectures in a distributed CPU/GPU run, providing insights into the different runtime behavior of Octo-Tiger regarding GPU-performance, CPU performance, and communication. For example, the communication seems to have a larger overhead on Piz Daint.
Second, we are showcasing the feasibility of APEX for large-scale runs, collecting combined CPU and GPU performance measurements, showing that the overhead introduced by the profiling itself is small enough to handle large production-scale scenarios. To this end, we are running the scenario both with and without APEX profiling enabled for a scaling run on each machine, to see both the overhead on a few compute nodes, and the runtime behavior when scaling to more nodes (with up to 2000 compute nodes on Piz Daint). Furthermore, we repeat these overhead measurements on Piz Daint for a CPU-only run to determine the performance impact of the NVIDIA® CUDA™ Profiling Tools Interface (CUPTI) which is used to collect the GPU performance data.
To highlight the need for low profiling overhead, we can look at the short runtimes for each time-step of Octo-Tiger: During the test runs on Summit, we gather GB of data during all eight runs. For each run time-steps were executed. Each time-step takes about on Summit nodes and consists of 6 iterations of the gravity solver, 3 iterations of the hydro solver, and all required communication. On Piz Daint we collected GB of data in total. Here, each time step on nodes took . As time steps are serial in nature, these iterations are our smallest parallel unit. As the time-steps only run for a few hundred milliseconds overall, overheads introduced by the profiling can be very noticeable even if they only take a few milliseconds in total as well.
The remainder of this work is structured as follows: In Section II, we take a brief look at profiling solutions in other AMT frameworks. We then introduce the scientific scenario which we are simulating with Octo-Tiger in Section III. This is the scenario we also used to collect the profiling data by running it for 40 timesteps with APEX enabled. Section IV in turn introduces Octo-Tiger itself, as well as the utilized software stack. In Section V, we show and discuss the collection of the performance measurements for Octo-Tiger. In Section VI, we test communication optimization and analyze the performance improvement. Finally, we conclude the paper in Section VII.
II Related work
For the related work, we focus on AMTs with distributed capabilities which are: Legion [9], Charm++ [10], Chapel [11], and UPC++ [12]. For a more detailed review, we refer to [13]. Legion [9] provides Legion Prof for combined CPU and GPU profiling which is compiled into all builds. Enabling the profiler produces log files which can be viewed using the profiler. Charm++ [10] provides Charm debug [14] and the Projections framework [15] for performance analysis and visualization. Chapel [11] provides ChplBlamer [16] for profiling. UPC++ seems not to have some dedicated tool for profiling, and any profiler supporting C++ is recommended in their documentation.
Like HPX, nearly all of these runtimes provide a specialized tool that has been designed to deal with the particular challenges of AMTs in general, and the needs of the runtime system in particular. APEX is a specialized tool in the case of HPX, and provides similar measurement and analysis abilities of the above tools, including flat profiling, tracing, sampling, taskgraphs/trees, and concurrency graphs. In addition, APEX provides support for several programming models/abstractions with or without HPX, including CUDA™, HIP, OpenMP, OpenACC, Kokkos, POSIX threads, and C++ threads. APEX does not provide analysis tools directly, but rather uses commonly accepted formats and targets both HPC performance analysis tools (ParaProf[17], Vampir[18], Perfetto[19]) and standard data analysis tools (Python, Graphviz[20]).
III Scientific application
Stellar mergers are mysterious phenomena that pack a broad range of physical processes into a small volume and a fleeting time duration. With the proliferation of deep wide-field, time-domain surveys, we have been catching on camera a vastly increased number of outbursts, many of which have been interpreted as stellar mergers. The best case, so far, of an observed merger is V1309 Sco, a contact binary identified using a recent survey database, the Optical Gravitational Lensing Experiment [21]. Fortunately, not only the merger itself was observed, but archival data from other observing programs enabled the reconstruction of the light curve years before the merger. During the merger itself, the system brightness increased by 4 magnitudes, with a peak luminosity in the red visible light [22]. This complete record of observations has led to term V1309 Sco the “Rosetta Stone” of mergers. Previous attempts to model this merger included semi-analytical calculations [23] and hydrodynamic simulations (e.g., [24]). However, the hydrodynamic simulations fail to adequately resolve the atmosphere, the rapid transition between the optically thick merger fluid and the optically thin, nearly empty space, surroundings of the simulated stellar material. To overcome this barrier, computational scientists intend to use the adaptive mesh-refinement hydrodynamics code Octo-Tiger. Using Octo-Tiger’s dynamic mesh refinement, the simulations are able to resolve the atmosphere at a higher resolution than ever before. Simulation of the V1309 merger in high resolution provide greater insight into the nature of the mass flow and the consequential angular momentum losses. In this paper, we analyze the performance of Octo-Tiger to identify potential bottlenecks in the combined CPU and GPU long-term production runs, where the atmosphere is maximally resolved. Analyzing the performance is essential at this stage since this model will serve as the necessary baseline for extending Octo-Tiger to include radiation transport to the V1309 model, as well as to other binary merger models.
IV Software framework
IV-A C++ standard library for parallelism and concurrency
HPX is the C++ standard library for parallelism and concurrency [1] and one of the distributed asynchronous many-task runtime systems) AMT. Other notable AMTs with distributed capabilities are: Uintah [25], Chapel [11], Charm++ [10], Legion [9], and PaRSEC [26]. However, according to [13] HPX is one with a higher technology readiness level. HPX’s API is fully conforming with the recent C++ standard [27, 28, 29] which is the major difference to the other mentioned AMTs. For more details about HPX, we refer to [30, 31, 32, 1]. In this work, HPX has two purposes: 1) the coordination of the synchronous execution of a multitude of heterogeneous tasks (both on CPUs and GPUs), thus managing local and distributed parallelism while observing all necessary data dependencies and 2) as the parallelization infrastructure for executing CUDA™-kernels on the GPUs via the asynchronous HPX backend.
IV-B APEX
APEX [33] is a performance measurement library for distributed, asynchronous multitasking systems. It provides lightweight measurements without perturbing high concurrency through synchronous and asynchronous interfaces. To support performance measurement in systems that employ user-level threading, APEX uses a dependency chain in addition to the call stack to produce traces and task dependency graphs. The synchronous APEX instrumentation application programming interface (API) can be used to add instrumentation to a runtime, library or application, and includes support for timers and counters. For measuring kernels on NVIDIA® accelerated platforms, APEX is integrated with the NVIDIA® CUDA™ Profiling Tools Interface [34] that provides CUDA™ host callback and device activity measurements. Similarly, on AMD accelerated platforms, APEX is integrated with the Roctracer library [35] providing HIP host callback and device activity measurements. In addition to timer measurements, the hardware and operating system are monitored through an asynchronous measurement that involves the periodic or on-demand interrogation of the operating system, hardware states, or runtime states (e.g., CPU use, resident set size, memory “high water mark”). The NVIDIA® Management Library interface [36] provides periodic CUDA™ device monitoring to APEX, and the ROCm SMI API provides periodic HIP device monitoring. APEX has been extended to capture additional timers and counters related to CUDA™ device-to-device memory transfers, as well as tracking memory consumption on both device and host when requested with the CUDAMalloc*/cudaFree* or hipMalloc*/hipFree* API calls [37].
APEX supports tracing in both the OTF2 and Google Trace Events formats, but for comparing results between platforms, profile data can be easier to work with. To complement the profile data which collapses the time axis, APEX also captures task and counter scatter plot data, indicating on the axis when the task started or the counter was captured, and the axis contains the duration of the task or the value of the counter. The tasks are sampled using a user-specified fraction (default 1%) whereas the counters are sampled at every value capture. This data collection allows the application developer to capture a time sequence of data without the file system overhead of a full event trace.
IV-C Octo-Tiger
Octo-Tiger is a 3D adaptive mesh refinement (AMR) hydrodynamics finite volume code with Newtonian gravity designed specifically for the study of interacting stellar binaries [38], [2]. The AMR grid rotates with the initial orbital frequency of the binary, which reduces inaccuracies due to numerical viscosity. The gravitational potential and force are computed using a modified version of the Fast Multipole Method that eliminates the gravitational field as a source of angular momentum conservation violation [39]. This enables Octo-Tiger to conserve energy and linear momentum to machine precision in the rotating frame. The astrophysical fluid is modeled using the inviscid Euler equations, which are solved with a finite volume central scheme [40]. The computational domain is based on a properly nested three-dimensional octree structure. Each node in the structure is an Cartesian sub-grid (usually, ), and may be further refined into eight child nodes, each containing its own sub-grid with twice the resolution of the parent.
In [2], an improved hydro solver for Octo-Tiger that includes a full three-dimensional reconstruction technique has been introduced. The performance of this improved hydro solver (after porting it to GPUs) on Summit’s ORNL has been tested as well as its accuracy [6], showing a good GPU speedup (the exact amount depending on the chosen sub-grid size), and a greater accuracy in maintaining a rotating star in equilibrium than the old hydro solver. It has been fully benchmarked demonstrating superior angular momentum conservation and extreme scalability properties allowing it to compute larger problems in a shorter wall-clock time [2]. A convergence study in a real production run of a white dwarf merger has been also performed [5].
Octo-Tiger’s CUDA™ implementation is worth elaborating on in a bit more detail here to understand the later performance results in Section V, in particular the short runtimes of the GPU kernels. Usually, each of the compute kernels in the solver (both hydro solver and gravity solver) operates on a single sub-grid at a time with one CPU core. Multi-core usage is achieved by launching many of those methods on different sub-grids concurrently as HPX tasks.
In a GPU run, an issue arises where a single sub-grid does not provide enough work to utilize the entire GPU. However, the scheduler can simply launch multiple kernels on different sub-grids concurrently. They are launched in different CUDA™ streams, which are drawn from a pre-allocated pool to avoid the overhead of stream creation. Usually, we use streams per GPU. As managing multiple CUDA™ streams in each of the CPU threads might become unwieldy, the code uses an HPX-CUDA™ integration. With it, HPX futures can be obtained from CUDA™ kernel launches, allowing HPX to treat them as any other HPX task. Using this strategy, HPX can simply launch a CUDA™ kernel, define subsequent post-processing tasks to be run once it is done, and then suspend the current HPX task that starts the kernel. The current CPU thread can then work on another task, potentially launching another GPU kernel in a different stream.
This implementation scheme has the implication that HPX runs many GPU kernels and CPU tasks concurrently, allowing the application to interleave GPU kernels, CPU tasks, CPU-GPU memory transfers, and inter-node communication seamlessly. Each of the tasks, both on CPU and GPU, has a rather short runtime as a result of only dealing with a single sub-grid at a time. For example, the individual GPU kernel execution time ranges from microseconds (less for smaller auxiliary kernels) to about milliseconds.
V Performance measurements
Octo-Tiger’s dependencies are listed in Table LABEL:tab:octo:dependencies in the Artifact Description of the appendix. On both systems, we used Octo-Tiger’s git hash (4c38f3bf) as the baseline. However, we had to do some minor changes with regard to compilation, which do not affect the astrophysics kernels. Therefore, we used a slightly diverged git hash (b091fd26) on Piz Daint and git hash (fd7faf5e) on Summit. To quantify the overhead introduced by APEX in percent, we define the metric
| (1) |
where is the number of nodes, without APEX, and the computation time with APEX. Note that we only measure the time for the actual computation and not the IO.
V-A Distributed scaling
The largest V1309 scenario ( million cells) fitting on four CSCS’s Piz Daint nodes was chosen for this scaling test. Note that the largest scenario for a single node was too small to scale out up to nodes with NVIDIA® P GPUs and CPU cores. However, due to the large amount of memory per node, the same scenario fits on one of ORNL’s Summit node. On both machines, we executed the same runs with the APEX + CUDA™ profiling on and off to investigate the overhead introduced by the profiling. Figure 1a shows the cells processed per second for increasing amount of nodes. On Piz Daint the scaling was done using Octo-Tiger’s new hydro solver [6] using a three-dimensional reconstruction scheme and scaling results using the old solver for a different scenario are shown here [41]. The blue lines show the scaling on Piz Daint. For both configurations, the scenario scales up to nodes. However, for Piz Daint nodes the problem size gets too small, and the scaling starts to flatten out. The overhead in Equation 1 for Piz Daint is shown in Figure 2a. The overhead is the largest on nodes and seems to decline with increasing node counts.
The violet lines show the scaling on Summit. Here, again, the code scales well up to nodes (using NVIDIA® V GPUs overall) and the work is not sufficient for more nodes. The overhead in Equation (1) on Summit is shown in Figure 2b. The overhead is less prominent on Summit.
We have seen an introduced overhead by the combined profiler on both systems. In a previous study using a different problem and the old version of the hydro module, the overhead introduced by pure APEX CPU profiling within HPX was around [5]. To verify if this still holds with the new hydro module and the V1309 scenario, we ran the V1309 scenario on Piz Daint with pure APEX CPU profiling. First, we observed scaling for the CPU kernels up to 2000 Piz Daint nodes. Second, we observed see that the difference is again around as in the previous study. It seems that the overhead is mostly introduced by enabling CUPTI measurement in APEX for both systems. However, it seems that the overhead for smaller node counts on Piz Daint is larger, which needs to be investigated. Regardless, CUPTI provides varying levels of detail/support, and APEX should be refactored to enable the minimum amount of useful support by default, and allow the user to request additional details as needed.
V-B Profiling of Octo-Tiger
V-B1 Setup
Because APEX is directly integrated into the HPX runtime, annotating HPX actions (tasks) is simply a matter of providing an annotation for the task when it is instantiated in the code. Not all actions are annotated (anonymous lambdas launched through hpx::async() calls, for example), but major operations in the Octo-Tiger code and in the HPX runtime are annotated. When HPX is configured and built with APEX support, all annotations are provided to APEX, and APEX times the life cycle of each task. HPX is designed to yield and resume tasks when resources are unavailable (futures, system calls, other dependencies), so APEX also provides the ability to yield (and resume) timing a task when it is not executing. For GPU kernels, the kernel name is obtained using the instruction pointer address and debug information in the executable provided by the compiler.
For the following Octo-Tiger profiling results, we use HPX localities (processes). As we use one HPX locality per GPU, this results in using compute nodes on Piz Daint and 8 compute nodes on Summit (as each node contains GPUs here). This ensures that we use the same number of GPUs on both systems. We are still using the same V1309 scenario as before.
Below is a short description of the tasks and kernels of interest in Octo-Tiger. The main CPU tasks include node_server::non-refined_step::compute_fluxes: directs the computation of a single Runge-Kutta substep in the hydro and gravity solvers for a given sub-grid. It directs the GPU to compute hydrodynamic fluxes, corrects these fluxes on coarse-fine boundaries, works with other invocations of the same action to compute the global time-step size, computes hydrodynamic sources, then lastly updates the hydrodynamic variables and directs the GPU to update the gravitational variables; local_step::execute_step: directs the execution of an entire time-step for a given sub-grid. This involves multiple calls to node_server::nonrefined_step::compute_fluxes; diagnostics_actions_type: performs some measurements on the grid, for example, computing total mass on the grid, total angular momentum, and center of masses of each star (for binaries); solve_gravity_action_type: solves for gravity. This is called when an additional gravity solve is needed (other than what node_server::nonrefined_step::compute_fluxes calls), such as after grid refinement; check_for_refinement_action_type flags each sub-grid in need of refinement; regrid_gather_action_type gathers information about the sub-grid structure and determines boundaries for the global decomposition; regrid_scatter_action_type uses the information computed by regrid_gather_action_type to redistribute the sub-grids.
The GPU kernels include cuda multipole interactions kernel: Computes the cell to cell interactions for the gravity solver in refined sub-grids (non-rho is without the angular momentum correction); cuda p2p interactions kernels: Computes the cell to cell interactions for the gravity solver in non-refined sub-grids; Special case: cuda p2m interactions kernel: Computes the cell to cell interactions for the gravity solver in non-refined sub-grids with refined neighbor sub-grids (non-rho is without the angular momentum correction); Special case: multipole root: computes the remaining cell to cell interactions in the root sub-grid; reconstruct cuda kernel reconstructs the evolution variables using the PPM method, see [6]; flux cuda kernel the flux method computes the fluxes and the Newtonian quadrature to get the final flux.
V-B2 Results / Analysis
In this section, we analyze the collected profiling results and draw conclusions regarding Octo-Tiger’s performance on two different architectures. These insights are important for further optimization on the code. Some of them are straightforward and others are quite puzzling. Let us start with the insights on Summit:
-
1.
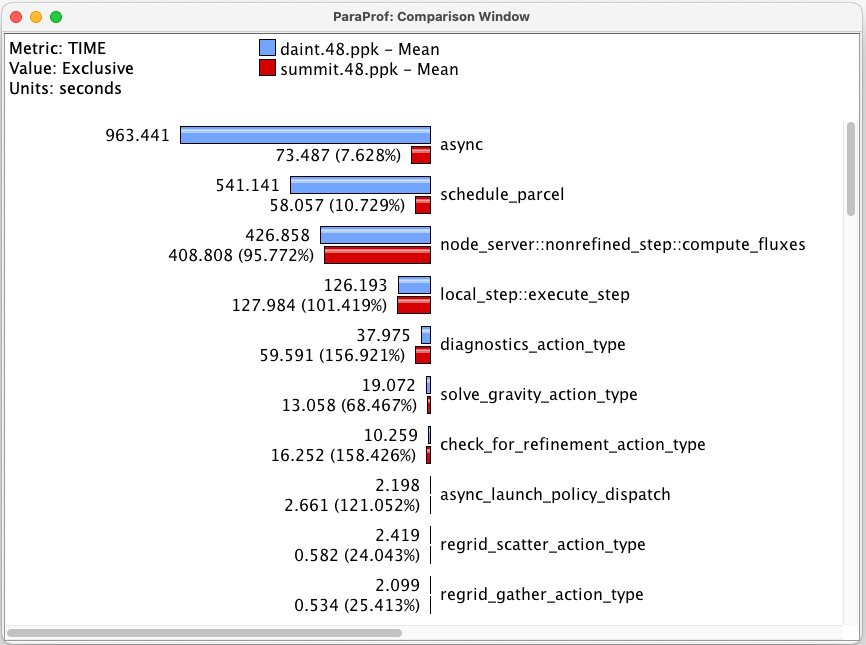
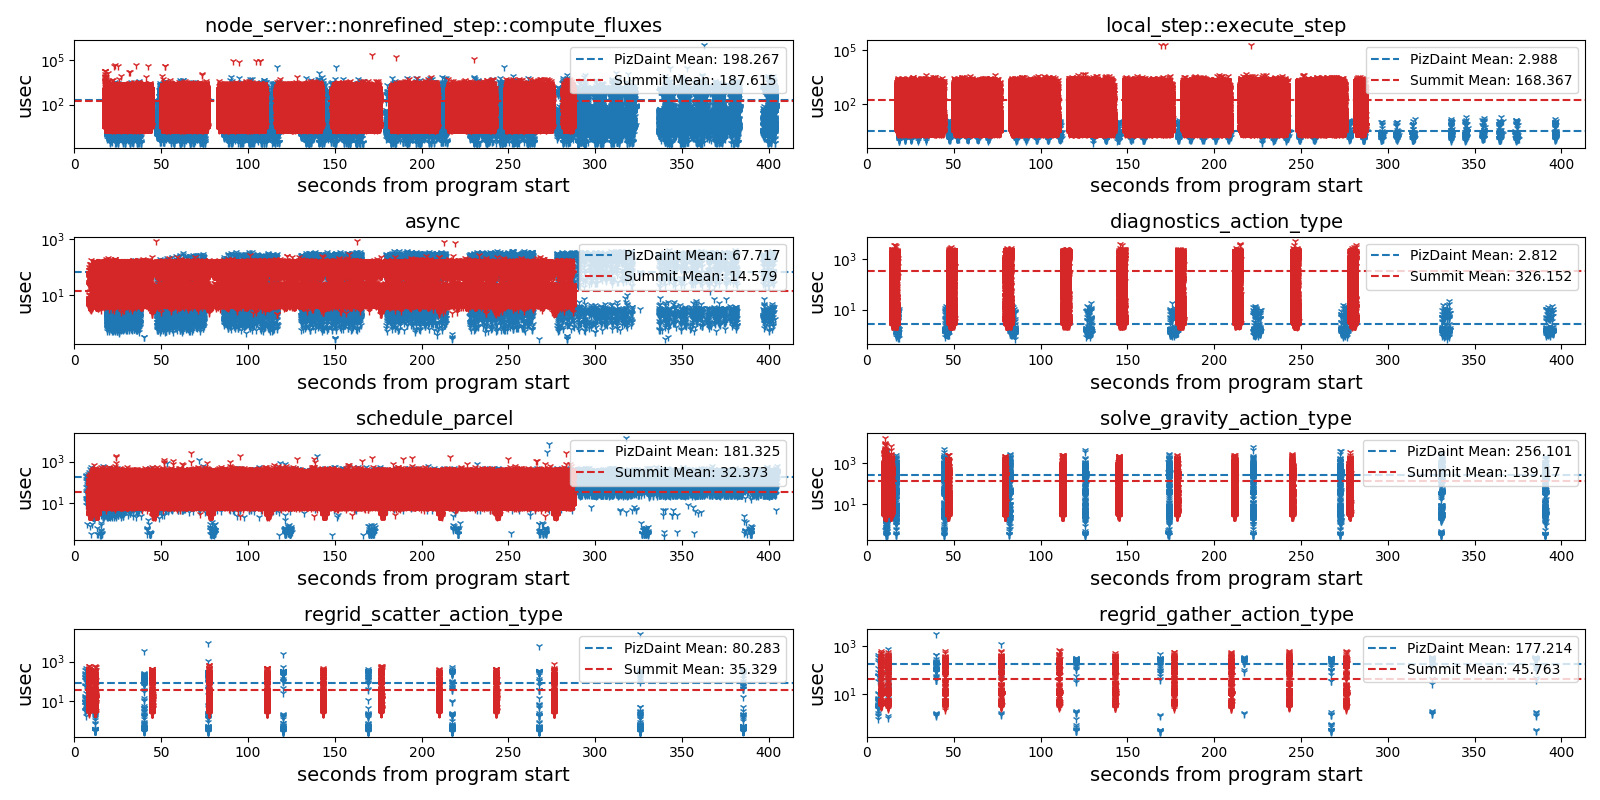
Figure 3 shows that on Summit, the CPU tasks are not always faster with respect to Piz Daint. However, the overall computational time is lower due to the benefit of the newer GPUs. Looking at the scatterplot data for sampled timers in Figure 5, we see that while the average time per task on Summit is slower for some tasks (compute_fluxes, execute_step), the aggregated mean profile is approximately the same.
-
2.
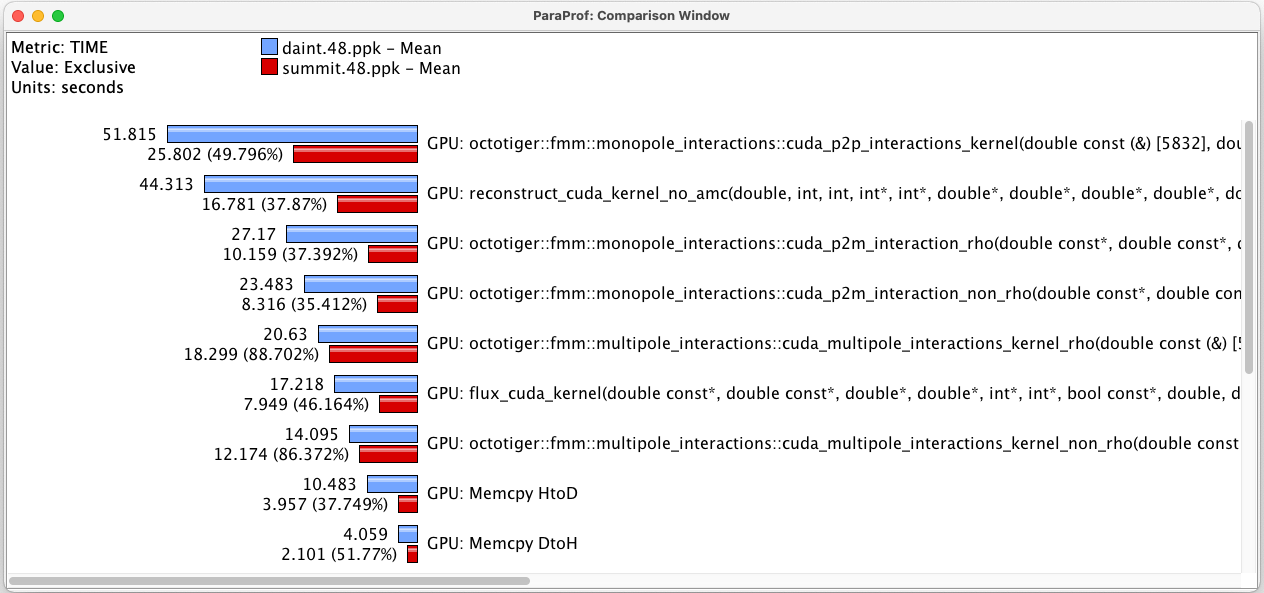
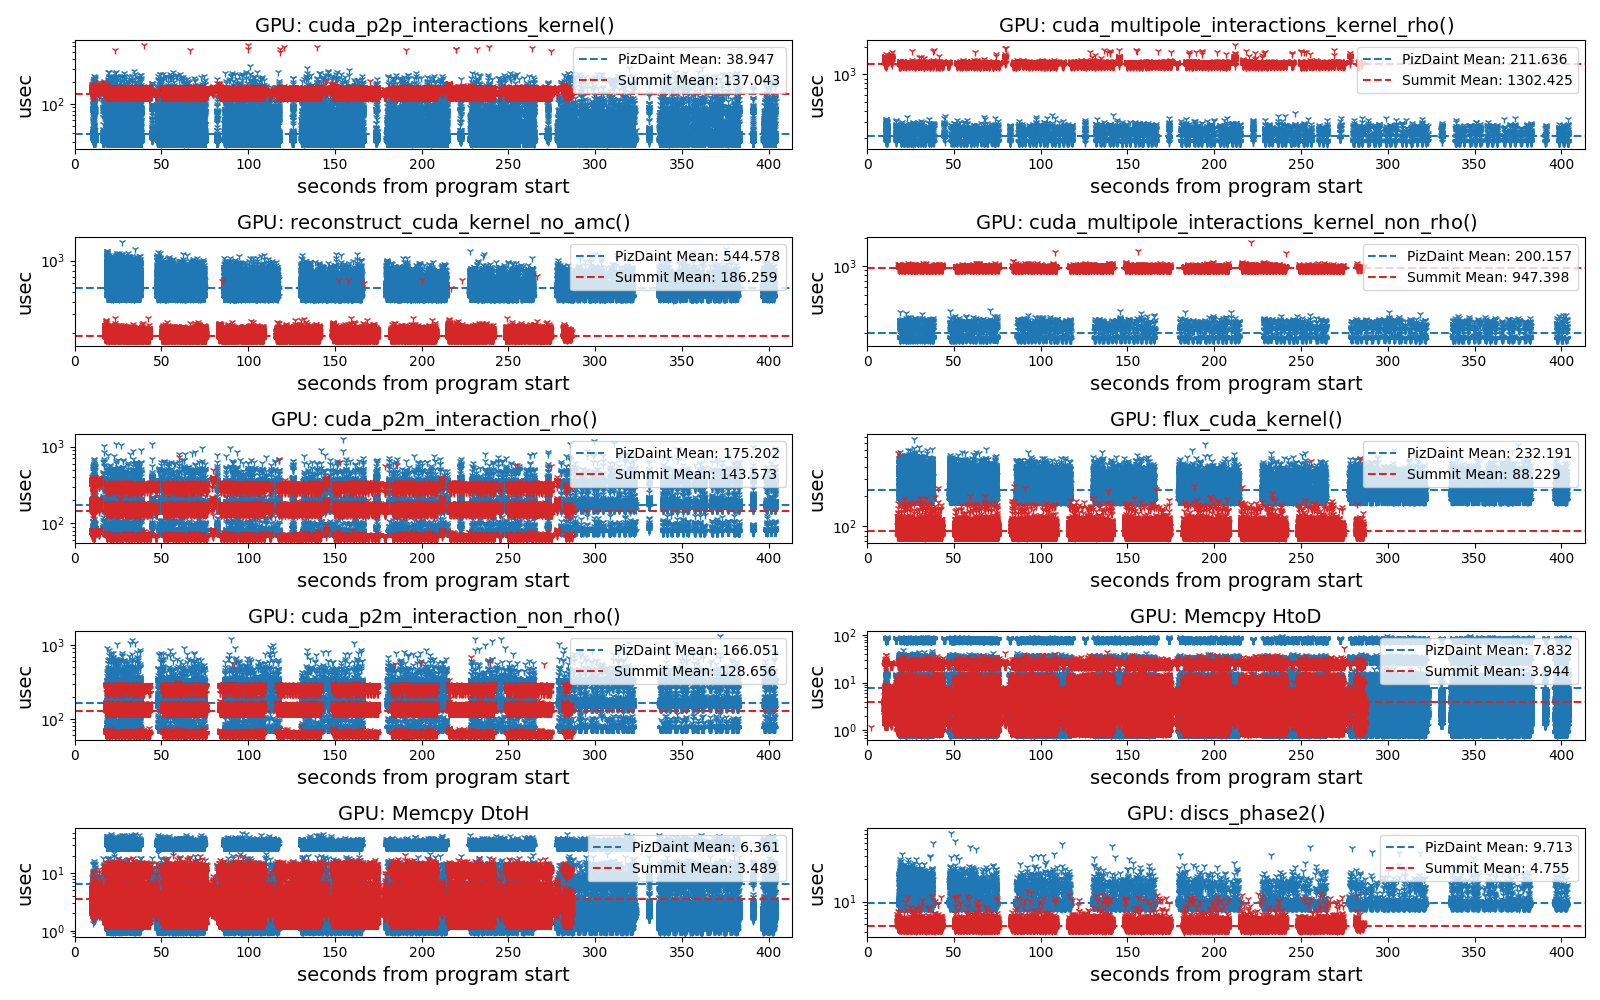
Figure 4 shows that on Summit, the GPU tasks are nearly always faster on NVIDIA® V100 GPUs. This is not surprising, since the GPU kernels are working better on the newer NVIDIA® V100 than on the older NVIDIA® P100. We found two exception, both the cuda_multipole_interactions_kernel_no_rho() and cuda_interactions_kernel__rho() were faster on the NVIDIA® P100. These tasks computes the monopole-multipole gravity interactions in the case that the leave nodes have different refinements. More investigation is needed to determine if it is possible to improve this compute kernel for the NVIDIA® V100.
On Piz Daint we gather the following insights:
Unrelated to the application itself, we found some differences within the HPX run time system. HPX provides the function hpx::async to asynchronously launch functions and lambda functions. Figures 3 and 5 show that this operation’s mean was more expensive on Piz Daint as on Summit. Here, the HPX main developers need to investigate this behavior. Figure 3 also shows that an another more expensive HPX operation on Piz Daint was schedule_parcel which mean was nearly higher as on Summit. A delay in the schedule_parcel potentially happens when some hpx::future is not ready, which schedule_parcel depends on. Our primary focus here is distributed combined CPU and GPU profiling. We anticipate future research concentrating on the interpretation of these findings and major optimization. However, we will show one minor optimization.
VI Performance improvements
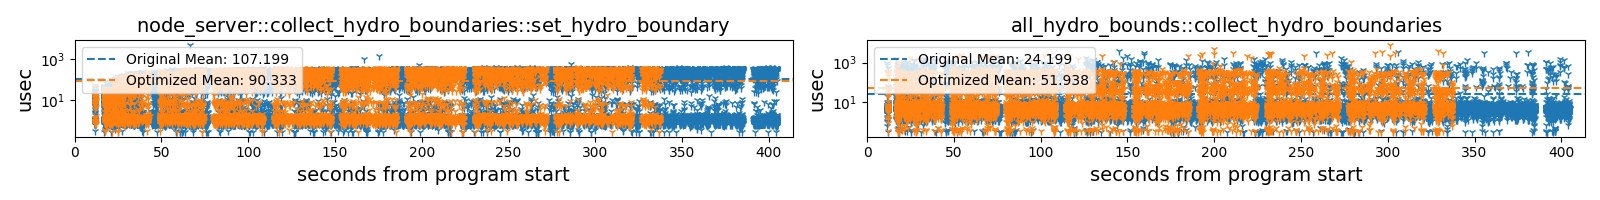
On Piz Daint the CPU tasks async and schedule_parcle, see Figure 5, took longer as on Summit. We further noticed that this seems to be worse when running scenarios that included the Octo-Tiger hydro solver on Piz Daint when doing more tests. Consequently, we took a look at the boundary communication within the Hydro module, and a way to reduce the overall number of messages. For sub-grids located on the same HPX locality, we now access the memory of these directly (foregoing HPX actions and temporary communication buffers) to fill the ghost-cells. This requires some more overhead within the node_server::collect_hydro_boundaries::set_hydro_boundary method (and other associated methods) itself as we need to make sure that the results of those direct neighbors is up-to-date, which is done with local HPX promises/future pairs. This increases the mean time of said communication methods as they need to handle the promises, but reduces the overall HPX action calls and thus reduces the calls to schedule parcel. We gained a noticeable speedup on Daint (reduced total runtime from to seconds) and will be become helpful for other machines in the future as well. This becomes evident in, Figure 7 compares the run on 48 Piz Daint nodes with the optimization enabled (orange) and the previous run (blue). This does not address the root issue, which seem to be the longer runtimes for async and schedule_parcle on Daint, but it reduces the symptoms considerably and is furthermore a useful optimization for other machines as well.
Unfortunately, the test-bed allocation on Summit ended before we could finish implementing the optimization. Therefore, we could not show results here.
VII Conclusion
In this work, we have analyzed the overhead of performing combined CPU and GPU performance measurements with APEX in a large-scale HPX application distributed across up to compute nodes.
We have demonstrated that Octo-Tiger easily scales to that many nodes on Piz Daint with the APEX profiling enabled. Profiling is thus feasible for real-world production-size runs on high-performance systems equipped with GPUs. However, we encountered a noticeable profiling overhead at scale (% on 2000 Piz Daint nodes). This seems to be due to the GPU measurements with CUPTI, as a subsequent CPU-only run exhibited a smaller profiling overhead. Note that the overhead on Piz Daint with very few nodes is about two times higher and requires further investigation. On Summit, there is a noticeable overhead at scale from profiling, too, but significantly less (% on Summit nodes). Overall, regarding the APEX profiling overhead, the distributed profiling with both CPU and GPU measurements works, scales up, and is ready to use; yet more investigation is needed to work on minimizing the overhead of the GPU measurements, if possible.
While we focused on evaluating how suitable APEX is for these large-scale, distributed analyses, there are some interesting results regarding Octo-Tiger itself as well. It is notable that the speedup of the average GPU kernel runtime from a P100 to a newer V100 varies a lot between the kernels. There are many factors that may influence the average kernel runtime difference between the devices: For instance, going to the V100, there is an increase in the number of Streaming Multiprocessors (SM), an increase in L1 cache available per SM, an increase in global memory bandwidth and a slight increase in clock speed. This does not even take into account the fact that we compile for different architectures.
Considering that we use concurrent kernel execution via CUDA™ streams per GPU to achieve device utilization (as outlined in Section IV-C), it is unlikely that the increased numbers of SMs in the V100 has a major impact on the average kernel execution time (as those would rather facilitate more concurrent kernel execution). Thus, it seems more likely that the speedup is due to a combination of the other factors, the exact speedup depending on what is currently limiting the kernel. The larger speedups indicate that the kernels benefit from the larger L1 cache available, however, determining the exact cause is subject of future work, especially as the kernels are currently still undergoing changes. However, the results here give us an idea which kernels need more attention during this process, particularly when targeting older architectures, thus helping us to steer our development focus.
Beyond the GPU results, the profiling uncovered that there are some crucial methods that run significantly slower on Piz Daint than on Summit, e.g. schedule_parcel. We consequently optimized the communication of the hydro solver to alleviate this issue. Using the APEX measurements we could identify the parts of the code which benefited from the optimizations. This shows the need for distributed performance measurements on a production system. Of course, while we focused on the usability of APEX for these kinds of analyses in this work and fixed some of the issues, the uncovered issues still need to be further investigated and addressed. Consequently, we will examine these remaining issue in future work, hopefully further improving the runtime of future simulations with Octo-Tiger.
A radiation module for Octo-Tiger is currently being implemented by its developers, and it is in the testing phase. Our performance analysis of the current modules will be crucial to estimate the performance impact of the new module prior to its inclusion. Including radiation in the simulations of V1309 together with resolving the star atmosphere at a higher resolution than ever before will enable one to self-consistently compute the light curve and directly compare it with the observed one of V1309. If one is able to accurately reproduce the light curve of the ”Rosetta Stone of mergers”, it will be possible to reliably simulate the outburst light curves of other mergers.
Acknowledgment
This work was supported by a grant from the Swiss National Supercomputing Centre (CSCS) under project ID s1078. This research used resources of the Oak Ridge Leadership Computing Facility, which is a DOE Office of Science User Facility supported under Contract DE-AC05-00OR22725. The APEX work was supported by the Scientific Discovery through Advanced Computing (SciDAC) program funded by U.S. Department of Energy, Office of Science, Advanced Scientific Computing Research (ASCR) under contract DE-SC0021299.
VIII Supplementary materials
The build scripts are available on GitHub111https://github.com/STEllAR-GROUP/OctoTigerBuildChain and the input files are available on Zenodo [42].
References
- [1] H. Kaiser et al., “HPX - The C++ Standard Library for Parallelism and Concurrency,” Journal of Open Source Software, vol. 5, no. 53, p. 2352, 2020.
- [2] D. C. Marcello et al., “Octo-Tiger: a new, 3D hydrodynamic code for stellar mergers that uses HPX parallelization,” Monthly Notices of the Royal Astronomical Society, vol. 504, no. 4, pp. 5345–5382, 2021.
- [3] D. Pfander et al., “Accelerating Octo-Tiger: Stellar Mergers on Intel Knights Landing with HPX,” in Proceedings of the International Workshop on OpenCL, ser. IWOCL ’18. New York, NY, USA: Association for Computing Machinery, 2018. [Online]. Available: https://doi.org/10.1145/3204919.3204938
- [4] G. Daiß et al., “Beyond fork-join: Integration of performance portable Kokkos kernels with HPX,” in 2021 IEEE International Parallel and Distributed Processing Symposium Workshops (IPDPSW). IEEE, 2021, pp. 377–386.
- [5] P. Diehl et al., “Performance measurements within asynchronous task-based runtime systems: A double white dwarf merger as an application,” Computing in Science & Engineering, vol. 23, no. 3, pp. 73–81, 2021.
- [6] ——, “Octo-Tiger’s new hydro module and performance using HPX+CUDA on ORNL’s Summit,” 2021.
- [7] CSCS, “Piz Daint — CSCS,” 2021, https://www.cscs.ch/computers/piz-daint/.
- [8] Oak Ridge National Laboratory, “Summit - Oak Ridge Leadership Computing Facility,” 2021, https://www.olcf.ornl.gov/olcf-resources/compute-systems/summit/.
- [9] M. Bauer et al., “Legion: Expressing locality and independence with logical regions,” in SC’12: Proceedings of the International Conference on High Performance Computing, Networking, Storage and Analysis. IEEE, 2012, pp. 1–11.
- [10] L. V. Kale et al., “Charm++ a portable concurrent object oriented system based on c++,” in Proceedings of the eighth annual conference on Object-oriented programming systems, languages, and applications, 1993, pp. 91–108.
- [11] B. L. Chamberlain et al., “Parallel programmability and the chapel language,” The International Journal of High Performance Computing Applications, vol. 21, no. 3, pp. 291–312, 2007.
- [12] J. Bachan et al., “The UPC++ PGAS library for exascale computing,” in Proceedings of the Second Annual PGAS Applications Workshop, 2017, pp. 1–4.
- [13] P. Thoman et al., “A taxonomy of task-based parallel programming technologies for high-performance computing,” The Journal of Supercomputing, vol. 74, no. 4, pp. 1422–1434, 2018.
- [14] R. Jyothi et al., “Debugging support for Charm++,” in PADTAD Workshop for IPDPS 2004. IEEE Press, 2004, p. 294.
- [15] S. Biersdorff et al., “Integrated Performance Views in Charm++: Projections Meets TAU,” in Proceedings of The 38th International Conference on Parallel Processing (ICPP), Vienna, Austria, September 2009, pp. 140–147.
- [16] H. Zhang et al., “Chplblamer: A data-centric and code-centric combined profiler for multi-locale chapel programs,” in Proceedings of the 2018 International Conference on Supercomputing, 2018, pp. 252–262.
- [17] R. Bell et al., “Paraprof: A portable, extensible, and scalable tool for parallel performance profile analysis,” in European Conference on Parallel Processing. Springer, 2003, pp. 17–26.
- [18] A. Knüpfer et al., “The vampir performance analysis tool-set,” in Tools for high performance computing. Springer, 2008, pp. 139–155.
- [19] Google, “Perfetto – system profiling, app tracing and trace analysis,” 2021, https://perfetto.dev.
- [20] The Graphviz Authors, “Graphviz,” 2021, https://graphviz.org.
- [21] A. Udalski et al., “The Optical Gravitational Lensing Experiment,” Acta Astron., vol. 42, pp. 253–284, 1992.
- [22] R. Tylenda et al., “V1309 Scorpii: merger of a contact binary,” A&A, vol. 528, p. A114, 2011.
- [23] O. Pejcha, “Burying a Binary: Dynamical Mass Loss and a Continuous Optically thick Outflow Explain the Candidate Stellar Merger V1309 Scorpii,” ApJ, vol. 788, no. 1, p. 22, Jun. 2014.
- [24] J. L. A. Nandez et al., “V1309 Sco—Understanding a Merger,” ApJ, vol. 786, no. 1, p. 39, May 2014.
- [25] J. D. de St Germain et al., “Uintah: A massively parallel problem solving environment,” in Proceedings the Ninth International Symposium on High-Performance Distributed Computing. IEEE, 2000, pp. 33–41.
- [26] G. Bosilca et al., “Parsec: Exploiting heterogeneity to enhance scalability,” Computing in Science & Engineering, vol. 15, no. 6, pp. 36–45, 2013.
- [27] The C++ Standards Committee, “ISO International Standard ISO/IEC 14882:2014, Programming Language C++,” Geneva, Switzerland: International Organization for Standardization (ISO)., Tech. Rep., 2014, http://www.open-std.org/jtc1/sc22/wg21.
- [28] ——, “ISO International Standard ISO/IEC 14882:2017, Programming Language C++,” Geneva, Switzerland: International Organization for Standardization (ISO)., Tech. Rep., 2017, http://www.open-std.org/jtc1/sc22/wg21.
- [29] ——, “ISO International Standard ISO/IEC 14882:2020, Programming Language C++,” Geneva, Switzerland: International Organization for Standardization (ISO)., Tech. Rep., 2020.
- [30] H. Kaiser et al., “HPX: A Task Based Programming Model in a Global Address Space,” in Proceedings of the 8th International Conference on Partitioned Global Address Space Programming Models, ser. PGAS ’14. ACM, 2014, pp. 6:1–6:11.
- [31] ——, “Higher-level parallelization for local and distributed asynchronous task-based programming,” in Proceedings of the First International Workshop on Extreme Scale Programming Models and Middleware, ser. ESPM ’15. New York, NY, USA: ACM, 2015, pp. 29–37.
- [32] T. Heller et al., “Closing the Performance Gap with Modern C++,” in High Performance Computing, ser. Lecture Notes in Computer Science, M. Taufer et al., Eds., vol. 9945. Springer International Publishing, 2016, pp. 18–31.
- [33] K. A. Huck et al., “An autonomic performance environment for exascale,” Supercomputing frontiers and innovations, vol. 2, no. 3, pp. 49–66, 2015.
- [34] NVIDIA, “CUDA Profiling Tools Interface,” 2021, https://docs.nvidia.com/cuda/cupti/index.html.
- [35] AMD, “AMD ROCTracer API,” 2021, https://rocmdocs.amd.com/en/latest/ROCm_Tools/ROCTracer-API.html.
- [36] NVIDIA, “NVIDIA Management Library (NVML),” 2020, https://developer.nvidia.com/nvidia-management-library-nvml.
- [37] W. Wei et al., “Memory Reduction using a Ring Abstraction over GPU RDMA for Distributed Quantum Monte Carlo Solver,” 2021.
- [38] D. C. Marcello et al., “Introducing Octo-tiger/HPX: Simulating Interacting Binaries with Adaptive Mesh Refinement and the Fast Multipole Method,” in Proceedings of the International Conference on Accretion Processes in Cosmic Sources, 2016.
- [39] D. C. Marcello, “A Very Fast and Angular Momentum Conserving Tree Code,” Astronomical Journal, vol. 154, p. 92, 2017.
- [40] A. Kurganov et al., “New High-Resolution Central Schemes for Nonlinear Conservation Laws and Convection-Diffusion Equations,” Journal of Computational Physics, vol. 160, no. 1, pp. 241–282, 2000.
- [41] G. Daiß et al., “From Piz Daint to the stars: Simulation of stellar mergers using high-level abstractions,” in Proceedings of the international conference for high performance computing, networking, storage and analysis, 2019, pp. 1–37.
- [42] Marcello et al., “Restart data for the v1309 scenario,” Aug. 2021. [Online]. Available: https://doi.org/10.5281/zenodo.5213015