Crystallographic ordering of Al and Sn in \textalpha-Ti
Abstract
Increasing attention is being paid to Ti3(Al,Sn) precipitation from the phase of titanium alloys owing to its effect on slip band formation, localisation and the implications for fatigue performance in jet engine titanium. However, the early stages of precipitation have historically been difficult to observe in TEM, neutron diffraction or atom probe analysis. Here, small angle X-ray scattering is used to reexamine the phase boundary in binary Ti-Al and Ti-Sn alloys with around 500 ppmw O. It is found that the phase boundaries in the literature are approximately correct, at 6.2 wt.% Al and 16.9 wt.% Sn, and that this favours the use of Al as a solid solution strengthener over Sn for ambient temperature applications. However, once O content and phase partitioning in \textalpha+\textbeta alloys are taken into account, this implies that Aleq limits for future alloy design of critical rotating parts should be lowered substantially.
keywords:
Titanium alloys , Phase transformationsMany \textalpha+\textbeta titanium alloys use Al and Sn to stabilise and strengthen the hcp \textalpha phase, producing materials that have excellent property combinations for aerospace and industrial applications. Sn in particular is included for retention of strength at elevated temperatures. However, these solutes are known to undergo crystallographic ordering after exposure to temperatures experienced during processing, forming the \textalpha2 Ti3(Al,Sn) phase [1]. For instance, Ti–834 (Ti–5.8Al–4Sn–3.5Zr–0.7Nb–0.5Mo–0.35Si–0.06C) produces a fine dispersion of \textalpha2 precipitates after at [2]. This ordered phase promotes slip localisation that increases the risk of dwell fatigue crack nucleation in critical rotating parts of jet engines. Under stress corrosion cracking conditions, crystallographic ordering may arise around the crack front as a result of corrosion reactions [3]. Improved understanding of propensity to ordering for these solutes could aid alloy and processing design to mitigate potential failure mechanisms.
Here, binary Ti–Al and Ti–Sn alloys were investigated to compare their tendency for crystallographic ordering during ageing at . The \textalpha and \textalpha2 microstructures were characterised with SEM, TEM and small angle X-ray scattering (SAXS) alongside tensile testing to reconsider the property trade-offs in each system.
Binary compositions were chosen at and either side of the \textalpha/\textalpha+\textalpha2 boundary, based on the chosen ageing temperature and currently accepted phase diagrams [1, 4]. Ingots were arc melted under argon from pure elements, then processed to achieve equiaxed \textalpha microstructures using conditions appropriate for each composition, Table 1. Bars were ice water quenched from the recrystallisation temperature, and half of each bar was then aged at under argon for . Compositions were measured using ICP-OES and LECO at TIMET UK, Witton, UK.
| Alloy (nominal | Measured composition / wt.% | at.% Al or Sn | / | / | / h | Grain size / | |||
| wt.%) | Al | Sn | O | N | |||||
| Ti–3.5Al | 3.55 | 0.01 | 0.04 | 0.01 | 6.12 | 980 | 900 | 1 | 50 |
| Ti–5.3Al | 5.28 | 0.01 | 0.03 | 0.01 | 8.99 | 980 | 900 | 2 | 49 |
| Ti–7Al | 7.00 | 0.01 | 0.08 | 0.01 | 11.76 | 980 | 900 | 3 | 57 |
| Ti–7Sn | 0.01 | 7.10 | 0.07 | 0.01 | 2.98 | 800 | 780 | 15 | 19 |
| Ti–12Sn | 0.01 | 12.02 | 0.06 | 0.01 | 5.21 | 800 | 780 | 12 | 20 |
| Ti–17Sn | 0.01 | 17.00 | 0.04 | 0.01 | 7.62 | 800 | 780 | 4 | 13 |
Microstructures were characterised using backscatter SEM (Zeiss Sigma 300, 8–) and conventional TEM electron diffraction and dark field imaging (JEOL 2100F, accelerating voltage, with double-tilt specimen holder). Specimens were electropolished with a solution of 3% perchloric acid, 40% butan-1-ol and 57% methanol, using an applied voltage of 20.0– at to . Tensile tests were performed with an Instron 5967 load frame and extensometer at a nominal strain rate of s-1, using a flat dogbone geometry ( gauge).
SAXS measurements were taken on the USAXS beamline [6] at the Advanced Photon Source at Argonne National Laboratory, using a beam and a 800 beam area. Samples were prepared by grinding to thickness with SiC paper from 500 to 4000 grits, followed by neutralised colloidal silica solution. After cleaning with detergent and isopropanol, samples were held in amorphous tape during measurement. Data were reduced and analysed using the Nika and Irena packages [7, 8], informed by our previous analysis of \textalpha2 composition [9].
Equiaxed, single-phase \textalpha microstructures were produced for each composition, Fig. 1, with grain sizes of and in the Ti–Al and Ti–Sn alloys respectively, Table 1.
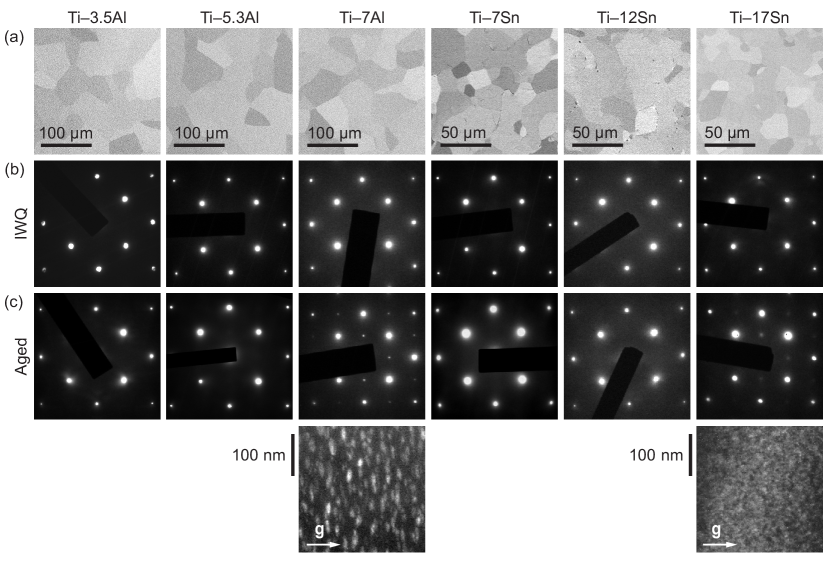
The IWQ and aged conditions were compared using selected area diffraction and dark field imaging in TEM for a qualitative indication of whether \textalpha2 formation had occurred. No superlattice reflections were observed for any of the alloys in the IWQ state, suggesting suppresion of long-range ordering during the quench from (Ti–Al) or (Ti–Sn).
In the Ti–Al series, only Ti–7Al developed superlattice reflections, and dark field images showed well formed precipitates. No contrast could be observed in attempts to take dark field images for aged Ti–3.5Al or Ti–5.3Al. In the Ti–Sn series, ageing produced faint superlattice reflections for the highest solute content only, Ti–17Sn, which contained a much finer precipitate dispersion than Ti–7Al.
Precipitate aspect ratios were obtained for use in SAXS data fitting. For Ti–7Al, multiple separate particles were measured to give an average aspect ratio of 2.4, while a value of 1.0 was assigned to the Ti–17Sn alloy’s precipitates based on their equiaxed appearance.
Further characterisation of precipitate populations was conducted using SAXS, Fig. 2. Data were fitted assuming a microstructure of \textalpha grain boundaries (modelled as thin discs) and \textalpha2 precipitates (modelled as spheroids with aspect ratios informed by TEM). Electron density contrast between \textalpha and \textalpha2 was calculated based on a stoichiometric Ti3(Al,Sn) phase, giving contrast values of for the Ti–Al alloys and for the Ti–Sn alloys.
In Ti–3.5Al and Ti–5.3Al, both the IWQ and aged conditions gave no indication of \textalpha2 Ti3Al formation, with a model describing the grain boundaries sufficient for fitting in each case. In the Ti–7Al material, the small peak at approximately was modelled as a population of equiaxed \textalpha2 Ti3Al nuclei, of mean diameter and with 0.4% volume fraction. This may indicate that the quenching in this alloy was insufficient to suppress this early stage of the phase separation process. Upon ageing, the peak shifted to lower and a volume fraction of 8.0% of particles with mean diameter was obtained through fitting spheroids of aspect ratio 2.4.
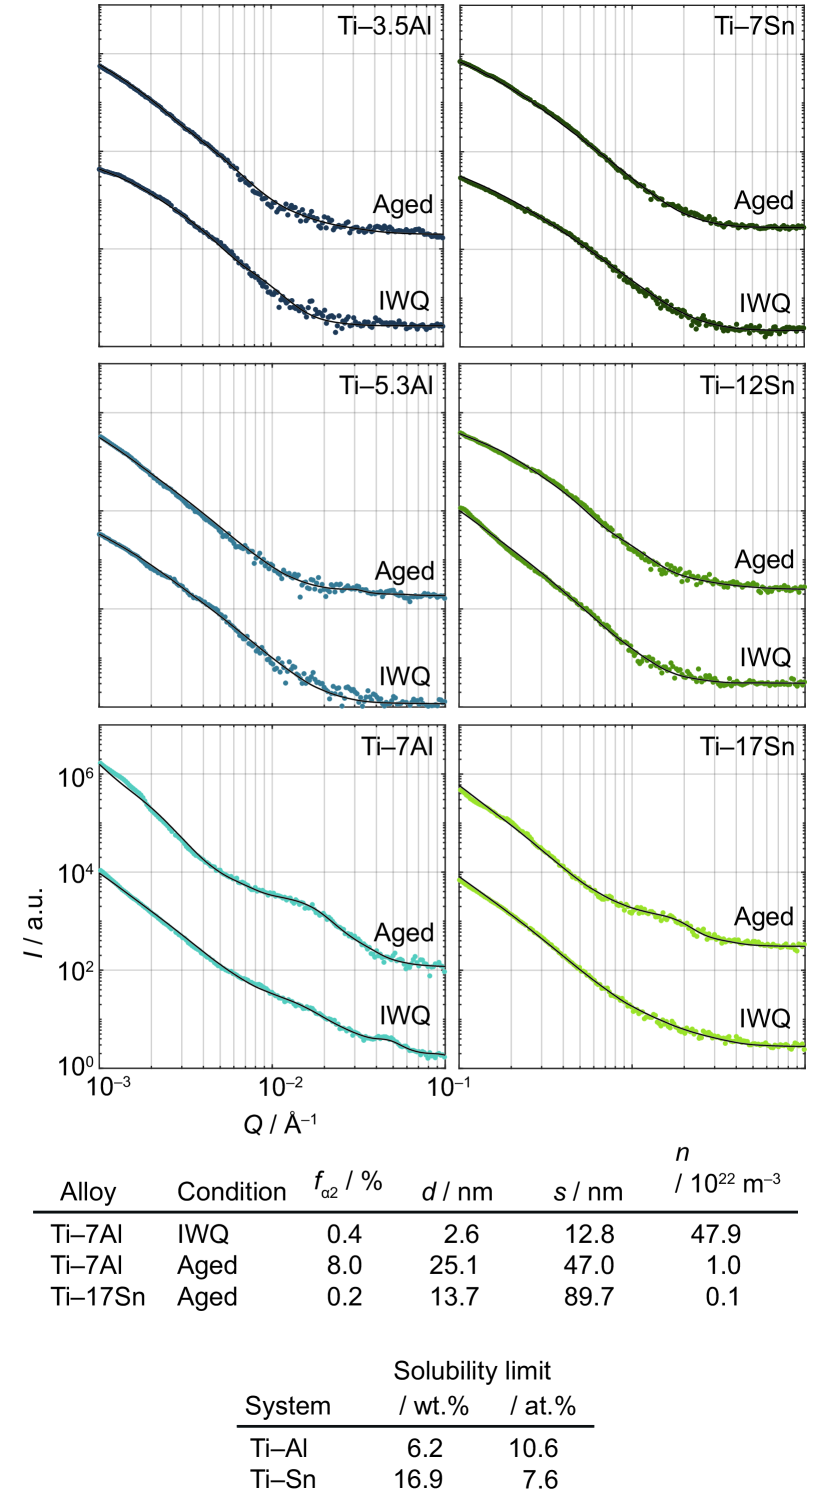
Similarly, in Ti–7Sn and Ti–12Sn, both IWQ and aged conditions showed no indication of precipitation. Ti–17Sn was also found to have no second phase in the IWQ condition, but a clear peak had developed for the aged specimen, assumed to be the \textalpha2 Ti3Sn phase identified in TEM. This was fitted to give a volume fraction of 0.2%, and a particle diameter of .
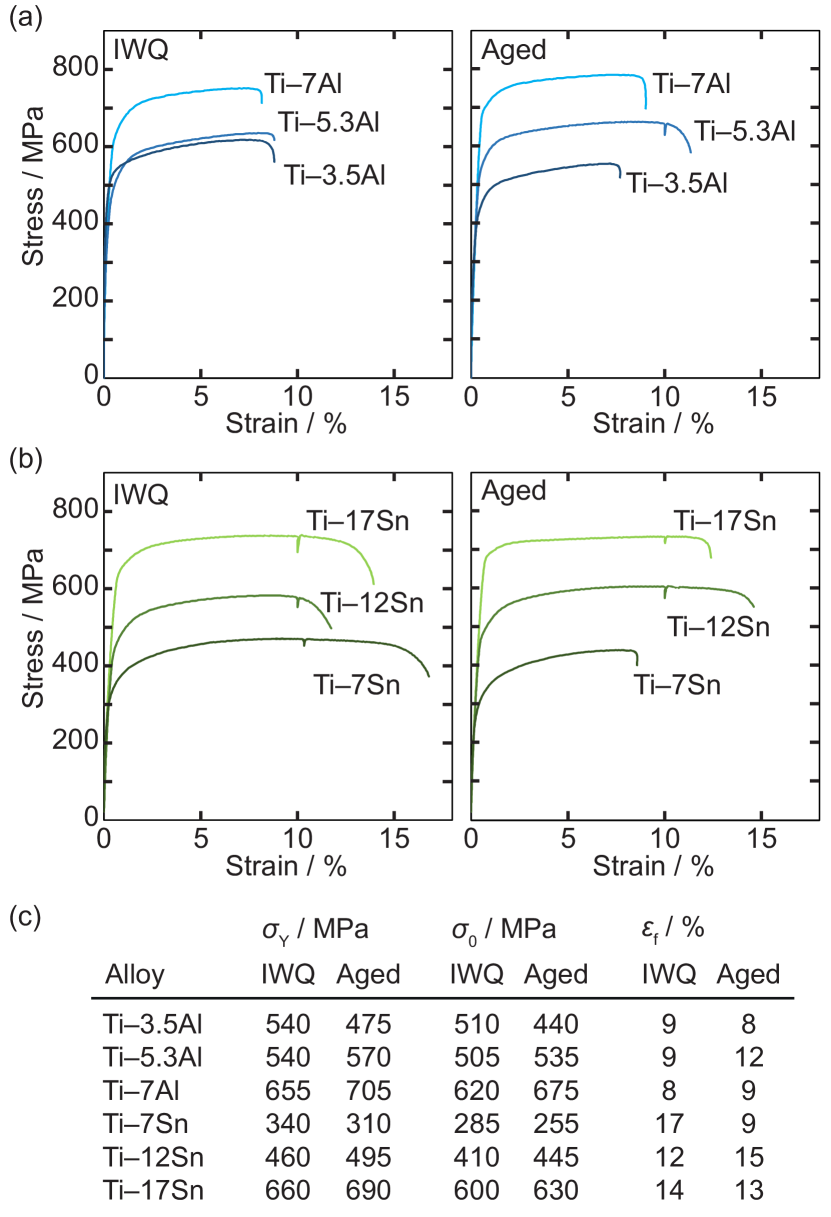
The yield stresses, , and strains at failure, , were obtained from tensile tests of each material, Fig. 3(a–b). The Hall–Petch relation was used to distinguish the contributions of solute content, ageing state and grain size:
where is a material constant, is the material’s Hall–Petch coefficient (an empirically derived constant), and is the average grain diameter. Here, , where is the strength of pure Ti, is the concentration of solute and is the strengthening contribution per wt.% solute . This applies for the IWQ condition; there is an additional contribution from precipitation strengthening where \textalpha2 is present. We took = -1/2 for all materials, the reported value for both CP Ti [2] and for equiaxed Ti–64 [10].
First considering ageing effects, was calculated for each material and compared in order to disregard grain size effects, Fig. 3(c). The Ti–Al alloys then showed the expected trends with solute content and ageing. In the IWQ state, Ti–3.5Al and Ti–5.3Al had similar , while Ti–7Al showed a notably higher . This is attributed to solid solution strengthening as well as the trace \textalpha2 detected in SAXS for quenched Ti–7Al. After ageing, Ti–5.3Al and Ti–7Al saw an increase in of and respectively. This is attributed to \textalpha2 growth in Ti–7Al and to possible short-range order in Ti–5.3Al. For Ti–3.5Al, slight softening was observed, which we attribute to annealing of dislocation density remaining after processing and the absence of ordered domains.
For the Ti–Sn alloys, there was a clear trend of increasing yield stress with increasing alloying content, in both the IWQ and aged conditions. The Ti–12Sn and Ti–17Sn alloys both gained around in yield stress upon ageing. The Ti–7Sn alloy showed slight softening upon ageing; as for the Ti–3.5Al alloy, we attribute this to a lack of \textalpha2 precipitation and annealing out of defect density. For Ti–17Sn, loss of work hardening ability is seen upon ageing (evident as flattening of its stress–strain curve compared to the IWQ condition), consistent with the slip band formation mechanism that is associated with \textalpha2 [11]. For Ti–7Al, the effect is subtler and is mostly seen as a shortening of the yield region of the stress–strain curve.
Based on the above, values were calculated and compared for and using the IWQ data, taking = [12]. For Ti–Al, = / Al, equivalent to / Al. For Ti–Sn, = / Sn, or / Sn.
For the compositions that underwent \textalpha2 formation, age hardening effects may also be compared. A increase of for Ti–7Al was found, in which an 8% volume fraction of \textalpha2 was produced. In the Ti–17Sn material, ageing produced a low volume fraction (0.2%) of \textalpha2, with a resulting small increase of by .
Orowan strengthening is approximately given by /r, where is the shear modulus, the Burgers vector and the precipitate radius [13]. From the SAXS analysis, the ratio of expected precipitate hardening contributions given by was 3.5, whereas the tensile test measurements showed that the Ti–7Al alloy had a 1.8 greater increase in yield strength on ageing than Ti–12Sn. Given the uncertainties in the analyses, and the removal of solute from the matrix (non-diluteness), this order-of-magnitude agreement is felt to provide confidence to the SAXS analysis.
For assessment of the Ti–Al and Ti–Sn binary equilibrium phase diagrams, the lever rule was used to calculate the position of the \textalpha/\textalpha+\textalpha2 boundary at in each system. For a two-phase system, , where is the alloy composition, and are the compositions of phases 1 and 2, and and are the volume fractions of each phase. The composition at the \textalpha single-phase boundary is then . For Ti–7Al and Ti–17Sn, Ti3X stoichiometry was assumed for \textalpha2. The solubility limit at was found to be or Al in the Ti–Al system, and or Sn in the Ti–Sn system, in close agreement with previous studies [1, 14].
This measurement of solubility limits may be used to reassess the widely used metric of aluminium equivalent, which describes an alloy’s overall likelihood of straying into the two-phase \textalpha+\textalpha2 field. The principle, initially put forward by Rosenberg et al. [15], calculates a value , where are wt.% compositions of each alloying element, and are empirically derived constants, calculated as the ratio of the solubility limit of element to that of Al. Current literature gives this as = [Al] + 0.33[Sn] + 0.17[Zr] + 10[O]. Based on the present results, however, the prefactor for Sn might be modified from 0.33 to , i.e. a 10% increase in its value.
Multiple properties must be considered together to evaluate alloy suitability for a given application, such as strength, density, fatigue resistance, corrosion and oxidation resistance, and the retention of properties at elevated temperature. Binary alloys at the solubility limit in each system, Ti–6.2Al and Ti–16.9Sn (wt.%) were considered for comparison. Their densities were estimated as and respectively, assuming the same lattice parameters as for pure Ti. Interpolated values were found to be and respectively. For a grain size, this predicts specific strengths of for Ti–6.2Al and for Ti–16.9Sn, a 13% benefit for Al over Sn.
For rotating parts of jet engines, fatigue and high-temperature properties are also important. Crystallographic ordering is linked to increased dwell sensitivity, due to micromechanical stress localisation resulting from slip band formation [11, 16]. Meanwhile, higher \textalpha-stabiliser content (particularly Sn) is partly motivated by \textbeta fraction reduction for high-temperature alloys, since the higher diffusion rates in \textbeta make it more suscseptible to degradation of mechanical properties and environmental resistance with temperature than \textalpha [2, 17].
Alloys known to experience a dwell fatigue life debit include Ti–64, Ti–6246 and Ti–834 [18]. The Aleq values for these alloys are 7.5, 8.9 and 9.3 wt.%, respectively. Additionally, ageing treatments in the \textalpha+\textalpha2 field are often used to strengthen the \textalpha phase, despite the potential impact on dwell fatigue resistance.
A commonly referenced guideline in titanium alloy design and industry has been that an alloy will be stable and “unlikely” to form \textalpha2 if Al [15, 19]. However, this study demonstrates that this is comfortably within the \textalpha2-forming regime for the binary Ti–Al and Ti–Sn systems. The mixed ordered phase Ti3(Al,Sn) can also form in alloys containing both solutes [20]. It is further noted that, in an \textalpha+\textbeta alloy, the \textalpha phase will be Al– or Sn–enriched relative to the alloy composition.
Typical rotor alloys contain up to 0.2 wt% O, an Aleq increment of 2. Here, the solubility limit of 6.2 wt.% in an alloy containing 0.08 wt% O implies an Aleq limit of 7.0 wt%. This implies that a Ti–Al–4V alloy containing 0.2 wt% O should contain no more than 5 wt.% Al. If, in an \textalpha+\textbeta alloy such as Ti–6Al–4V, a 10% volume fraction of Al-depleted phase is assumed, then this implies a lower Aleq limit of 6.5 wt%, or an Al limit of 4.5 wt.% once O is accounted for. Thus, even alloys such as Ti–5Al–7.5V (Ti–575) may not be entirely safe from precipitation.
From an alloy design perspective, we therefore suggest that current structural \textalpha+\textbeta alloys for aerospace applications (especially critical rotating parts subject to dwell fatigue loading) contain too high an aluminium equivalent to avoid deleterious crystallographic ordering.
In summary, SAXS was used to examine the solubility limits for Al and Sn in -Ti against Ti3(Al,Sn) precipitation. The \textalpha/\textalpha+\textalpha2 boundary was found to lie at () for the Ti–Al system and () for the Ti–Sn system, for alloys containing around 500 ppmw O, in agreement with literature [1, 14]. Tensile testing combined with a Hall-Petch analysis showed that, due to the density penalty associated with Sn additions, Al is a slightly more efficient solution strengthener than Sn, even at the solubility limit. Counter to the compositional design of several widely-used \textalpha+\textbeta and near-\textalpha alloys in use today, it is suggested that a ‘safer’ Aleq limit may be as low as , or an alloy Al limit of 4.5 wt.%, compared to the limit of Al wt.% used traditionally.
Acknowledgements
FFW was funded by Rolls-Royce plc and by the EPSRC Centre for Doctoral Training in the Advanced Characterisation of Materials (EP/L015277/1). DD was funded by a Royal Society Indstrial Fellowship and EPSRC (EP/K034332/1). We thank Dr T.W.J. Kwok and Dr I. Bantounas at Imperial College London for assistance with alloy processing, and TIMET for support with composition measurements. This research used resources of the Advanced Photon Source, a U.S. Department of Energy (DOE) Office of Science User Facility operated for the DOE Office of Science by Argonne National Laboratory under Contract No. DE-AC02-06CH11357.
References
- Murray [1990] J. Murray, Binary Alloy Phase Diagrams, II Ed., 1990.
- Lütjering and Williams [2007] G. Lütjering, J. Williams, Titanium, Springer Berlin Heidelberg, 2nd edition, 2007.
- Shi et al. [2021] Y. Shi, S. Joseph, E. A. Saunders, R. S. Sandala, A. Walker, T. C. Lindley, D. Dye, AgCl-induced hot salt stress corrosion cracking in a titanium alloy, Corrosion Science 187 (2021) 109497.
- Schuster and Palm [2006] J. Schuster, M. Palm, Reassessment of the binary aluminum-titanium phase diagram, J. Phase Equilib. Diff. 27 (2006) 255–277.
- ASTM E112 [2021] ASTM E112, Standard Test Methods for Determining Average Grain Size, Technical Report, ASTM International, West Conshohocken, PA, USA, 2021.
- Ilavsky et al. [2018] J. Ilavsky, F. Zhang, R. Andrews, I. Kuzmenko, P. Jemian, L. Levine, A. Allen, Development of combined microstructure and structure characterization facility for in situ and operando studies at the Advanced Photon Source, J. Appl. Crystallogr. 51 (2018) 867–882.
- Ilavsky [2012] J. Ilavsky, Nika: software for two-dimensional data reduction, J. Appl. Crystallogr. 45 (2012) 324–328.
- Ilavsky and Jemian [2009] J. Ilavsky, P. Jemian, Irena: tool suite for modeling and analysis of small-angle scattering, J. Appl. Crystallogr. 42 (2009) 347–353.
- Dear et al. [2021] F. F. Dear, P. Kontis, B. Gault, J. Ilavsky, D. Rugg, D. Dye, Mechanisms of Ti3Al precipitation in hcp \textalpha-Ti, Acta Mater. 212 (2021) 116811.
- Chong et al. [2019] Y. Chong, G. Deng, S. Gao, J. Yi, A. Shibata, N. Tsuji, Yielding nature and Hall-Petch relationships in Ti-6Al-4V alloy with fully equiaxed and bimodal microstructures, Scripta Mater. 172 (2019) 77–82.
- Brandes et al. [2010] M. Brandes, M. Mills, J. Williams, The influence of slip character on the creep and fatigue fracture of an Ti-Al alloy, Mat. Sci. Eng. A–Struct. 41 (2010) 3463–3472.
- ASM [2022] ASM Handbook, ASM International, 2022.
- Martin [1998] J. W. Martin (Ed.), Precipitation Hardening, Butterworth-Heinemann, 1998.
- Namboodhiri [1983] T. Namboodhiri, On the Ti–Al phase diagram, Mater. Sci. Eng. 57 (1983) 21–22.
- Jaffee and Promisel [1970] R. Jaffee, N. Promisel (Eds.), The Science, Technology and Application of Titanium, Pergamon, 1970.
- Neeraj and Mills [2001] T. Neeraj, M. Mills, Short-range order (SRO) and its effect on the primary creep behavior of a Ti–6wt.% al alloy, Mat. Sci. Eng. A–Struct. 319 (2001) 415–419.
- Rosa [1970] C. J. Rosa, Oxygen diffusion in alpha and beta titanium in the temperature range of 932 to 1142 °C, Metallurgical Transactions 1 (1970) 2517––2522.
- Zheng et al. [2018] Z. Zheng, A. Stapleton, K. Fox, F. P. Dunne, Understanding thermal alleviation in cold dwell fatigue in titanium alloys, International Journal of Plasticity 111 (2018) 234–252.
- Kosaka and Fox [2007] Y. Kosaka, S. P. Fox, Creep Properties of Near Alpha Titanium Alloys at Elevated Temperatures Higher Than 600 C, Ti-2007 Science and Technology, Japan Institute of Metals (2007) 255–258.
- Radecka et al. [2016] A. Radecka, V. Vorontsov, J. Coakley, K. Rahman, P. Bagot, T. Martin, M. Moody, I. Jones, T. Lindley, D. Rugg, D. Dye, Ordering in alpha-titanium alloys, in: Proc. 13th World Conference on Titanium, pp. 971–978.