Towards Mining Creative Thinking Patterns from Educational Data
abstract
Creativity, i.e., the process of generating and developing fresh and original ideas or products that are useful or effective, is a valuable skill in a variety of domains. Creativity is called an essential 21st-century skill that should be taught in schools. The use of educational technology to promote creativity is an active study field, as evidenced by several studies linking creativity in the classroom to beneficial learning outcomes. Despite the burgeoning body of research on adaptive technology for education, mining creative thinking patterns from educational data remains a challenging task. In this paper, to address this challenge, we put the first step towards formalizing educational knowledge by constructing a domain-specific Knowledge Base to identify essential concepts, facts, and assumptions in identifying creative patterns. We then introduce a pipeline to contextualize the raw educational data, such as assessments and class activities. Finally, we present a rule-based approach to learning from the Knowledge Base, and facilitate mining creative thinking patterns from contextualized data and knowledge. We evaluate our approach with real-world datasets and highlight how the proposed pipeline can help instructors understand creative thinking patterns from students’ activities and assessment tasks.
keywords
Educational Data Mining, Creativity Patterns, Data Curation
1 introduction
In this section, we first begin with an overview of the work and explain the problem statement which is understanding and identifying creative thinking patterns from raw educational data. Next, we provide our contributions and explain how the proposed method greatly facilitates the process of discovering creativity patterns. Finally, we outline the organization of this paper.
1.1 Overview and Problem Statement
Around the world today, original and creative ideas are the best and most important products of any powerful country. This clearly shows the importance of recognizing and nurturing creativity in children from a young age. Creativity is a set of skills that all humans have the capacity to possess, but it must be nurtured and expanded under the right circumstances. Unlike earlier theories that assumed creativity as an inherited and intrinsic process, recent research on creativity via education reveals that creative thinking, i.e., the ability to consider something in a new way, is considered a skill and can be learned by individuals. Therefore, in countries with a dynamic education system, fostering creativity has been considered one of the most important goals of education 158.
Creativity is defined in many different ways, but almost all researchers and psychologists consent to a definition that describes it as a process of generating ideas or products that are both unique and useful 10. It may involve a set of challenges, such as generating various solutions in response to a problem, spotting problems in the existing state of knowledge, dealing with ambiguous circumstances, and bringing ideas into action. Hence, in the process of creative pursuits, students need ongoing guidance, and training. But before providing personalized training, it is needed to first detect creativity patterns in students 125.
There are numerous existing tools and techniques for measuring and detecting creativity such as divergent thinking tests 174, self-report measures of creativity 121, or judgment of products 10 which have been traditionally used to identify creative students. These approaches mostly involve evaluating the quality of ideas and products. Practically, using human evaluators to asses students’ responses to creative tasks, such as rating the uniqueness of ideas from the alternate uses test, is a common element of doing creativity research. Although scoring systems have proven effective, they are susceptible to two fundamental limitations: labor cost and subjectivity, which pose specific psychometric risks to reliability and validity 26.
Recent development in learning management systems has proved to assist different educational assessments and minimize the aforementioned limitations. These technologies have the capacity to gather and visualize large amount of educational data, e.g., assessments and class activities. In this context, helping instructors to understand the educational data remains a challenging task 71. There is a large amount of work aiming to discover insight from educational data, with the goal to support traditional learning and educational assessments 15, 147, 149, 57. However, the current state of the art lacks a significant data-driven strategy to link students’ behaviour to creativity patterns.
In this paper, to address these challenges, we construct a domain-specific Knowledge Base (KB) to identify essential concepts, facts, and assumptions in identifying creative patterns. We then introduce a pipeline to contextualize the raw educational data, such as assessments and class activities. Finally, we present a rule-based approach to learning from the Knowledge Base, and facilitate mining creative thinking patterns from contextualized data and knowledge. We evaluate our approach with real-world datasets and highlight how the proposed framework can help instructors understand creative thinking patterns from students’ activities and assessment tasks.
1.2 Contributions
In this study, we propose a rule-based insight discovery method to discover patterns of creativity in educational data. Our work relies on the knowledge of experts in education for buildings a domain specific Knowledge Base to be linked to the extracted features from educational data. To achieve this goal, we first imitate the knowledge of domain experts into an Educational Knowledge Base, i.e., a set of concepts organized into a taxonomy, instances for each concept, and relationships among them. Secondly, to drive insight from raw data we propose a method to link the concept nodes in the taxonomy to the entities extracted from educational data.
Our approach is based on a motivating scenario in educational assessment, where a knowledge worker (e.g., a teacher) may need to analyze the activities of students in a classroom and augment that information with the knowledge in the educational Knowledge Base. Making benefit from a user-guided rule-based technique the person can link the information extracted from raw educational data to creativity patterns, identified in the educational Knowledge Base.
The unique contributions of this paper are:
-
•
We put the first step towards formalizing the educational knowledge by constructing a domain-specific Knowledge Base to identify essential concepts, facts, and assumptions in identifying creative patterns.
-
•
We introduce a pipeline to contextualize the raw educational data, such as assessments and class activities. We customize existing data curation techniques to turn the raw educational data into contextualized data and knowledge.
-
•
we present a rule-based approach to learn from the Knowledge Base, and facilitate mining creative thinking patterns from contextualized data and knowledge.
-
•
We evaluate our approach with real-world datasets and highlight how the proposed framework can help instructors understand creative thinking patterns from students’ activities and assessment tasks.
1.3 Summary and Outline
In this section, we gave a broad picture of the problem and covered the motivation, problem statement, and contributions of this paper. The remaining of this paper is structured in the following manner:
-
•
In Section 2 we will present the background and analyze the related work in the education domain. We will review the current state-of-the-art approaches, including educational knowledge, educational modelling, Open Learner Models, and Educational Data Mining techniques. We will provide a summary to compare the reviewed methods and techniques in the four areas.
-
•
In Section 3 we will explain our methodology towards mining creative thinking patterns from educational data. This section will provide detailed information about the proposed method which includes building an Educational Knowledge Base, data curation, feature selection, building a Knowledge Graph, and finally linking the graph to the proposed knowledge base using a novel rule-based technique.
-
•
In Section 4 we will present the experiment, results, and evaluation. We will discuss a motivating scenario to clarify our approach to the reader and then explain the experiment’s dataset and setup. We will conclude this section with a discussion over the evaluation results.
-
•
Finally, in section 5, we will conclude the study by providing a summary of the proposed method. We will also discuss the future directions that we build on our study.
2 Background and State-of-the-Art
In this section, we study and analyze the recent work in modelling and mining educational data. We introduce the key terms and background in the field, and then discuss the related works in Educational Data, Educational Data Modeling, Open Learner Models, Educational Data Mining, and Learning Analytics. We conclude the section by summarizing the challenges in educational data mining and analytics, and highlight the added value of our proposed approach.
2.1 Data in Education
2.1.1 Data, Metadata, and Big Data
Data in computing refers to the information that is converted to a digital format that could be stored and processed. Individuals, machines, and sensors, as sources of information, are generating a massive amount of data each second. For example, individuals generate data when they take a photo using their digital devices, browse the internet, or publish content on their social media. Smart devices such as cars, watches, TVs, and phones also sense and create data even when they are not in use 30, 154.
Data can be stored in three formats: structured, unstructured, and semi-structured. Structured data consists of data types that are well defined and have patterns that make them easy to search including student name, ID number, and age. Unstructured data consists of data types that are often difficult to search, including text, pdf, image, and video. And, semi-structured data consists of a loosely organized meta-level structure that can contain unstructured data, e.g., Email, HTML, XML, and JSON documents. From the processing point of view, data processing consists of organizing, curating, analyzing, and presenting operations 29.
Metadata refers to as the information that describes other data. It is also defined as a prefix that provides an ’underlying definition or description’ in most information technology applications 181. Metadata describes fundamental data information, making it simpler to discover, utilize, and reuse specific data instances. For example, a document file’s metadata includes the creator’s information, the date that has been created or updated, and the file format. In addition, metadata can be used for relational databases, images, videos, audio files, and web pages. By using the tracking method, smart devices such as phones or watches track our location, speed, the Apps and gadgets we are using, and the music we often listen to. Or, smart TVs can track the channels we watch, time and duration, and the Apps we use during a specific time of day 41. Metadata offers a primary description of an information item, and it should be appropriately specified in terms of granularity, structure, quality, and provenance 5, 39, 37.
Big Data refers to a set of large datasets that are so vast, fast, or complicated. Processing such data using standard methods could be difficult or impossible. The term also refers to the technology that is used to manage the generated data and metadata. The everyday exchanged data on the Internet, social media contents and feeds, and mobile phone location data are examples of big data. Construction, healthcare, insurance, telecommunications, and ecommerce are among the areas where big data is becoming increasingly important.
Wide data dispersion, a variety of formats, non-standard data models, and heterogeneous semantics are all characteristics of big data. It should be notes that several challenges are involved while using big data such as the way it should be organized, curated, analyzed, and visualized 30.
Big data is characterized by the following attributes (also known as four Vs 196): Volume (size of data), Velocity (speed of data streaming), Variety (data types), and Veracity (uncertainty of data).
-
•
Volume: The volume of data is the defining attribute of big data. Individuals, machines, and organizations create data from numerous sources, from which reliable information is collected and integrated at the organization center. For example, consider the wide range of data collected from students using their smart phones, evaluations, homework, feedback forms, surveys, etc. This mass of data creates a huge amount of data that must be appropriately analyzed.
-
•
Velocity: This attribute of big data gives an indication of data speed, or the rate at which data is emerging from diverse sources. This high speed data is enormous and arrives in a constant stream, necessitating fast processing.
-
•
Variety: The data that is received for processing might take many different file forms from structured to unstructured data. Formats such as ‘.XLS’ or ‘.XLSX’ (Excel file), ‘.CSV’ (comma-separated values file), ‘.TXT’ (plain text file), ‘.PDF’ (PDF file), or ‘.RTF’ (rich text file). Data can arrive in a variety of formats, including audio, image, video, SMS, maps, geographical data or something we hadn’t considered. It is critical for organizations to effectively handle such a diverse set of data, as there is currently a broad selection of data formats from which to extract information.
-
•
Veracity: There are several data stream sources accessible, each of which creates a significant amount of data. Due to the large number of sources accessible, this data is susceptible to outliers or noise. As a result, the data’s nature or behavior may change. Veracity deals with the uncertainty of data, which has a significant influence on the organization’s decision-making process.
2.1.2 Educational Data
A wide range of educational data is accessible from a number of different sources. By using the educational data teachers may now monitor their students’ academic achievements, learning behaviors, and offer immediate feedback based on the needs and requirements of students. Learning management systems collect a huge quantity of data from students that may be used to improve the learning environment, assist teacher in teaching and students in learning, and enhance the learning experience in general. Different learning resources are available which a number of them can be listed as follows 21:
-
•
Interaction between students, instructors, and also students and instructors (e.g., chat boxes, discussion forums, navigation behavior).
-
•
Administrative data (e.g., institution, courses, instructors),
-
•
Demographic data (e.g., age, nationality, gender),
-
•
Students’ activities (e.g., assessments, questions, feedbacks),
-
•
Students’ dispositions and affectivity (e.g., attitude and motivation).
Since traditional learning analytics are not equipped to handle this volume of data, big data technologies and tools have found their way into education to process this massive amount of data. To deal with different kinds of educational challenges administrative data could be very useful. As a result, experts should acknowledge the influence of big data in education in order to alleviate educational difficulties.
In the big educational data, several research and review studies have been conducted. Highly cited studies investigated themes 14 such as: (i) Behaviour and performance of learners: Dedicated to learner perspectives, fulfillment, methods, and behaviour, as well as big data structures, adaptive learning, teaching, data mining, and learning analytics 59, 61; (ii) Educational data modeling and warehouse: Introducing big data modeling, educational data warehouses, and cloud environment research, as well as cluster analysis for educational purposes 137, 194; (iii) Improving educational system: Introducing statistical tools, metrics, obstacles, and the usefulness of ICT. It places a strong emphasis on training and its numerous ramifications. It also establishes a rating system that monitors how websites are used in order to enhance the educational system 130, 117; and (iv) Merging pedagogy with big data: Incorporating big data concepts into various courses and emphasizing their educational implications 73, 52.
2.1.3 Educational Environments
The environment in which a student gets educational services is referred to as the educational environment. There are three types of educational environments available for different users such as face-to-face learning, E-learning, and blended learning 182.
-
•
Face-to-face learning refers to educational methods in which instructors and students meet in a certain location at a specific time for one-by-one or group class sessions, similar to what occurs in schools.
-
•
E-learning involves any and all information delivery using digital technology for teaching and learning in education. E-learning became the foundation of modern education due to the progress of technology in information and communication. Individuals can benefit from the environment without the time and space constraints of face-to-face learning using the learning network model. Online learning, web-based learning, and virtual learning are three other terms that have also been used in literature to characterize this kind of teaching and learning environment 86.
-
•
Blended learning practically refers to a hybrid of face-to-face and online learning that aids classroom learning. 182. Blended learning is viewed as a pedagogical method that integrates the effectiveness and socialization. possibilities of the classrooms with technological enhancements of E-learning.
Collecting and combining all of this raw data is a time-consuming and tough process in and of itself, therefore a preparation phase is required before modeling or applying machine learning techniques.
2.1.4 Data Curation
The practise of organising and integrating data from multiple sources in order to make it more useful for data analysis and discovery is known as data curation. In other words, it is the process of transforming raw data to contextualized data and knowledge. Data curation has been also defined as “the active and ongoing management of data through its lifecycle of interest and usefulness” 80. It encompasses all of the procedures required for regulated data generation, preservation, and administration, as well as the ability to add value to data 122. Hence, data curation should involve 30:
-
•
Identifying relevant data sources: As new data resources getting released on a daily basis, selecting the right data sources for a given analytical purpose has never been more crucial.
-
•
Ingesting data and knowledge: The procedure for gathering information from multiple sources and transferring it to be stored in another location (e.g., database, data warehouse, or data mart) for further analysis is defined as data ingestion. There are generally two types of data ingestion: Batch data ingestion (data transfering in batches), and streaming data ingestion (collecting in real-time and transferring immediately).
-
•
Cleaning: The process of correcting or deleting data in a database that is inaccurate, incomplete, poorly structured, or duplicated is known as data cleaning or cleansing.
-
•
Integration: The process of combining data from many sources is called as data integration. Schema integration, identifying and addressing data value conflicts, and removing data duplication are all issues that arise during data integration.
-
•
Transformation: Data transformation means transforming the data in such a way that is suitable for data analysis. Normalization, summarization or aggregation, smoothing, and generalization are examples of data transformation techniques 34. For instance, normalization scales the attributes within a specified range, commonly between -1.0 and 1.0, or 0.0 and 1.0. This technique is useful when the large range of attributes outweighing smaller ranges.
-
•
Adding Value: An extremely essential step in the process of data curation that include: extraction, enrichment, annotation, linking, and summarization operations.
As data curation is one of the most significant challenges in data analytics, many organizations and researchers, first investigate converting their raw data into useful information and knowledge. Data in a variety of sources with different formats (structured to unstructured) are first stored in a storage repository called Data Lake which allows the data analysts to decide afterward on the data curation 31.
Many studies are now focused on curating the stored data in the Data Lakes and making this transformation intelligent, e.g, AsterixDB111http://asterixdb.apache.org/, Orchestrate222http://orchestrate.io/, and CoreKG333http://github.com/unsw-cse-soc/CoreKG 29. For example, recently Beheshti et al. 29, 28, 190 presented the Knowledge Lake or Contextualized Data Lake, which automates the curation and preparation of raw data in the Data Lake for analysis, laying the framework for big data analytics. They created CoreKG, an open source Knowledge Lake service that allows researchers and developers to manage, curate, filter, and query the data and metadata in the Lake and across time via a single REST API. The architecture and main components of the CoreKG are depicted in Figure 1.
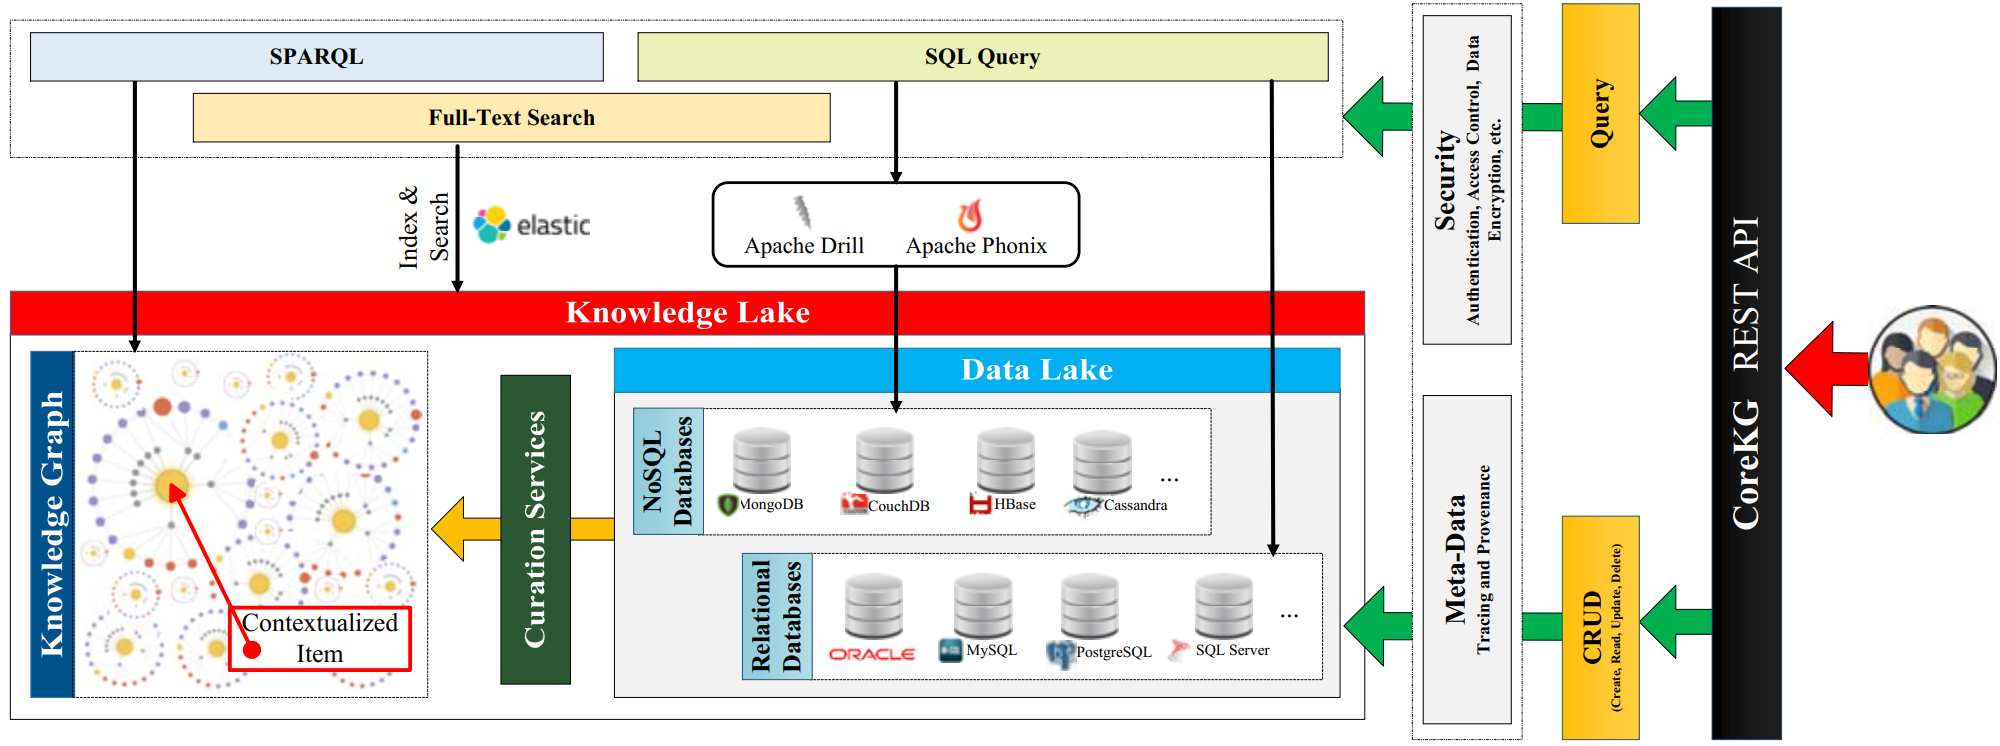
CoreKG is a data-driven Web application development platform that powers numerous relational and NoSQL databases as a service. It enables creating islands of data (relational or/and non-relational) in the Data Lake, applying CRUD (Create, Read, Update, and Delete) on entities in those datasets, and use integrated search on top of multiple data islands. CoreKG also has a built-in architecture that protects against the most common database security vulnerabilities (e.g., Data Encryption, Access Control, and Authentication), as well as Provinence support and Tracing. In this research, they designed automated services that perform data curation and preparation in the Data Lake. Extraction, summarization, enrichment, linkage, and categorization are some of the services available.
2.2 Educational Knowledge
Skills and information acquired via education, practice, or experience are referred to as knowledge 50. It is also defined as recognizing a concept in a theoretical or practical manner 155.
The educational difficulties of the 19th century highlighted the necessity for a learning knowledge foundation to make changes in the educational systems. It should not include a philosophical viewpoint, such as behaviorism or pragmatism. Instead, it should represent theories that explain the impacts on educational learning, research findings condensed into empirical results, and professional opinions about impacts on educational learning.
A variety of factors would need to be assessed such as student skills, inclinations, and past accomplishments; teacher personality and attitude in classroom; methods of teaching and resources; the time spent for teaching and learning; classroom environment; structure of the curriculum; home, school and social environment; demographic details of students; and educational policy in states and districts 178, 33.
The education hierarchy refers to the hierarchical framework that most of the country’s education system follows, in which students are educated with a comparable set of information based on their age group and maturity. It is involved with formalized learning and teaching in an educational system. For instance, the Australian Standard Classification of Education (ASCED) is an educational hierarchy that consists of two components, fields of education and level of education 1. It offers a foundation for similar administration and analytical data on educational programs and achievements grouped by level and field.
The level category consists of pre-primary education, primary education, secondary education, certificate level, diploma and advanced diploma level, bachelor degree level, graduate diploma/certificate level, and postgraduate degree level. The field category includes fields such as natural and physical science, information technology, engineering, agriculture and environmental science, health, education, etc.
There is also another concept which is highlighted in literature, taxonomy of learning outcome. It is the process of categorizing educational activities based on the kind of related learning outcomes. A taxonomy is a categorization system that is organized in a hierarchical order which is useful to categorize phenomenons from a specific classification standpoint. Educators and educational designers utilize taxonomies to categorize the instructional objectives as well as important evaluation factors to see if the objectives are being reached or not 100.
A wide variety of learning taxonomies have been designed to categorize educational statements 46, 45, 119, 82. Bloom’s and Bloom’s revised taxonomies are two well-known taxonomies in education which assist educators evaluate students’ abilities.
Bloom’s Taxonomy. The Bloom’s taxonomy is a familiar taxonomy designed to encourage thinking, analyzing, and assessing concepts in education instead of just remembering them. It is commonly utilized in the development of teaching and learning procedures in three domains: cognitive, affective, and psychomotor 46. Each domain are categorized into several categories which are arranged in a progressive hierarchy from basic to complicated, with the premise that knowledge of one category leads to mastery of the next one (See Table 1).
| Cognitive | Affective | Psychomotor |
|---|---|---|
![[Uncaptioned image]](/html/2210.06118/assets/bloom1.png) |
![[Uncaptioned image]](/html/2210.06118/assets/bloom2.png) |
![[Uncaptioned image]](/html/2210.06118/assets/bloom3.png) |
-
•
Cognitive: Related to mental skills and knowledge. This domain is consists of six major categories from basic to the most complicated mental skills including: Knowledge, Comprehension, Application, Analysis, Synpaper, and Evaluation.
-
•
Affective: Related to behaviors or feeling developments. This domain is consists of five major categories from basic to the most complicated behaviors including: Receiving, Responding, Valuing, Organization, and Characterization.
-
•
Psychomotor: Related to physical skills. This domain is consists of seven major categories from basic to the most complicated physical skills including: Perception, Set, Guided Response, Mechanism, Complex Overt Response, Adaptation, and Organization.
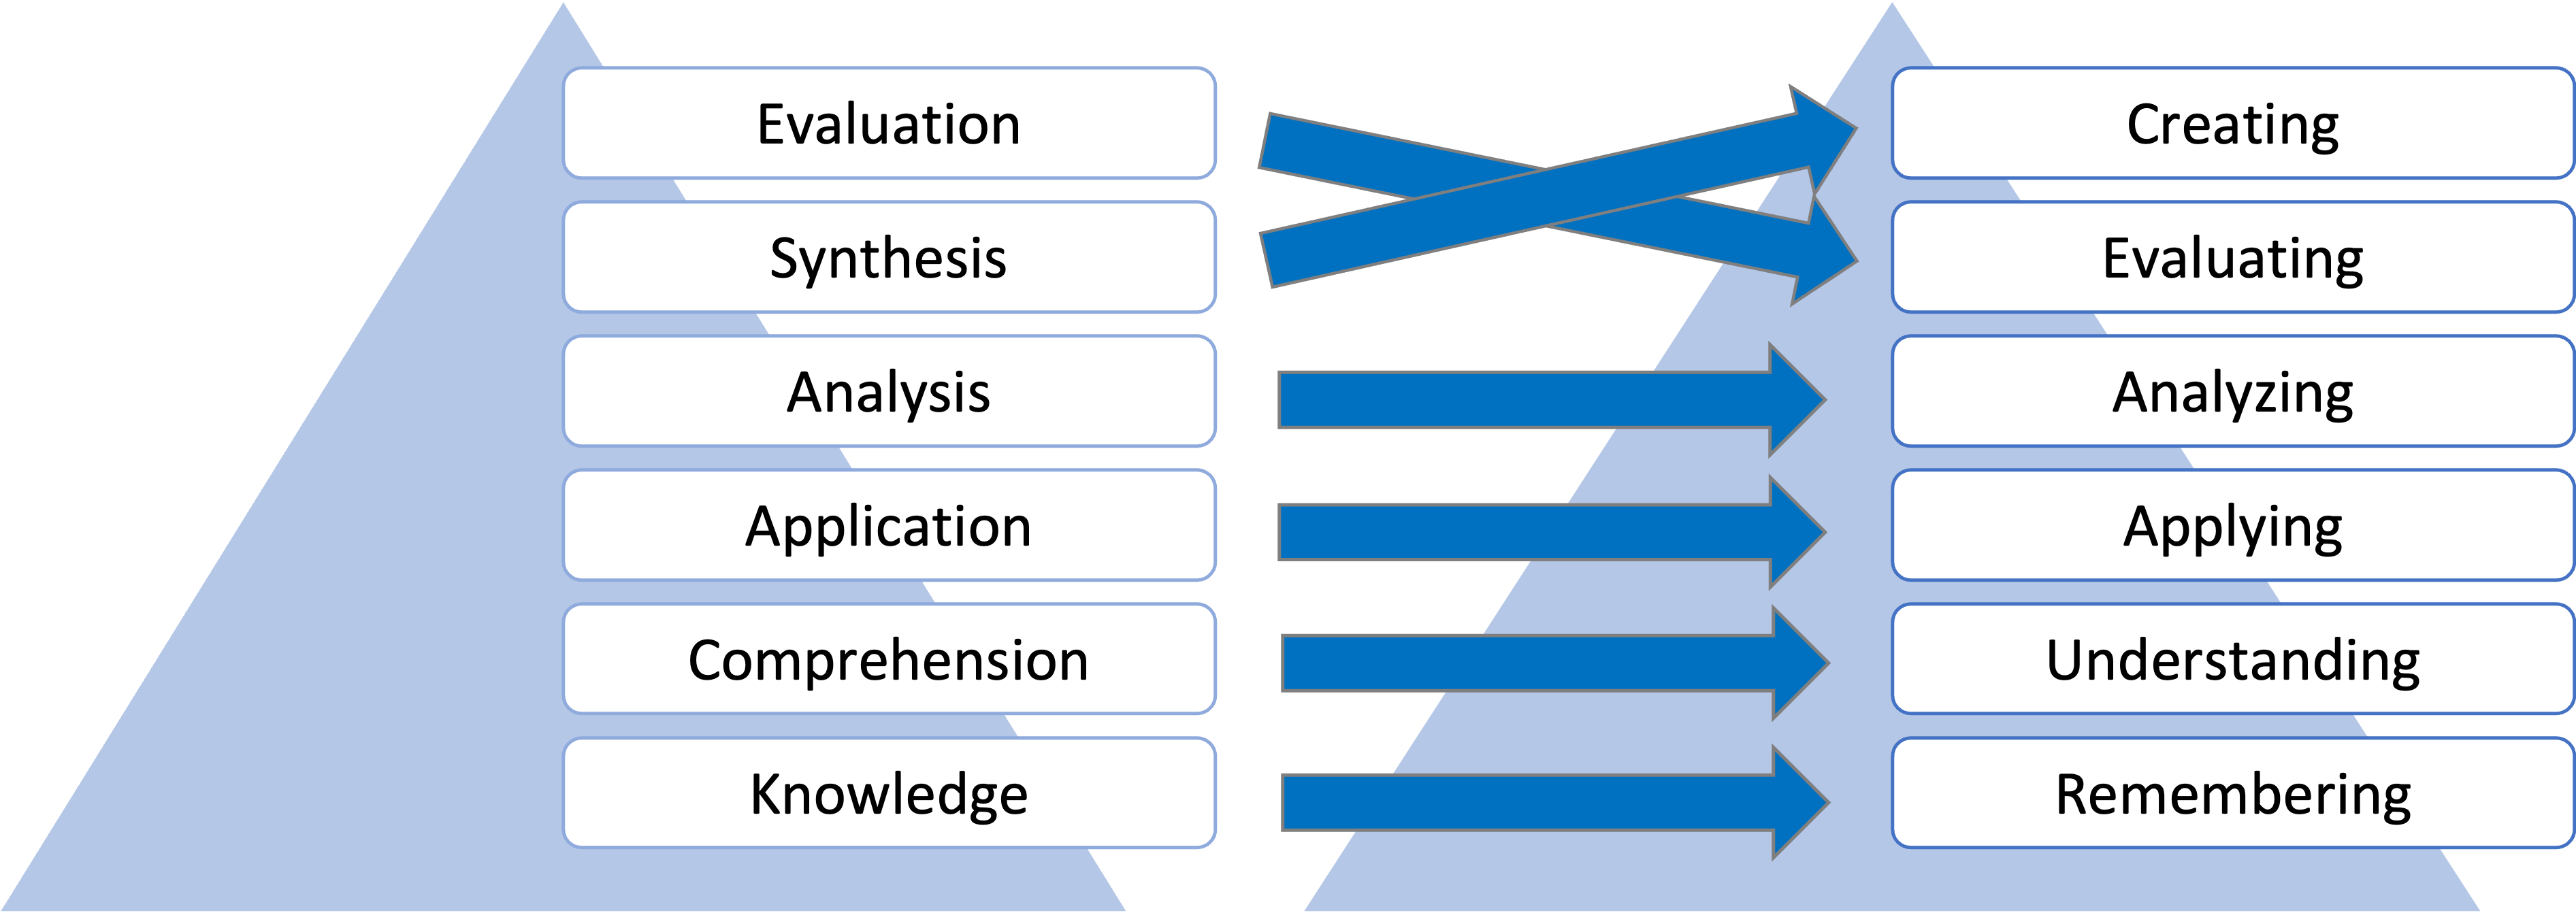
Bloom’s Revised Taxonomy. The Bloom’s revised taxonomy is developed by Anderson and Krathwohl in mid-90s to promote the cognitive domain of the Bloom’s taxonomy. They changed the names of the categories and rearranged their orders. Figure 2 compares the cognitive domain in both taxonomies.
2.2.1 A Taxonomy for Student Assessment
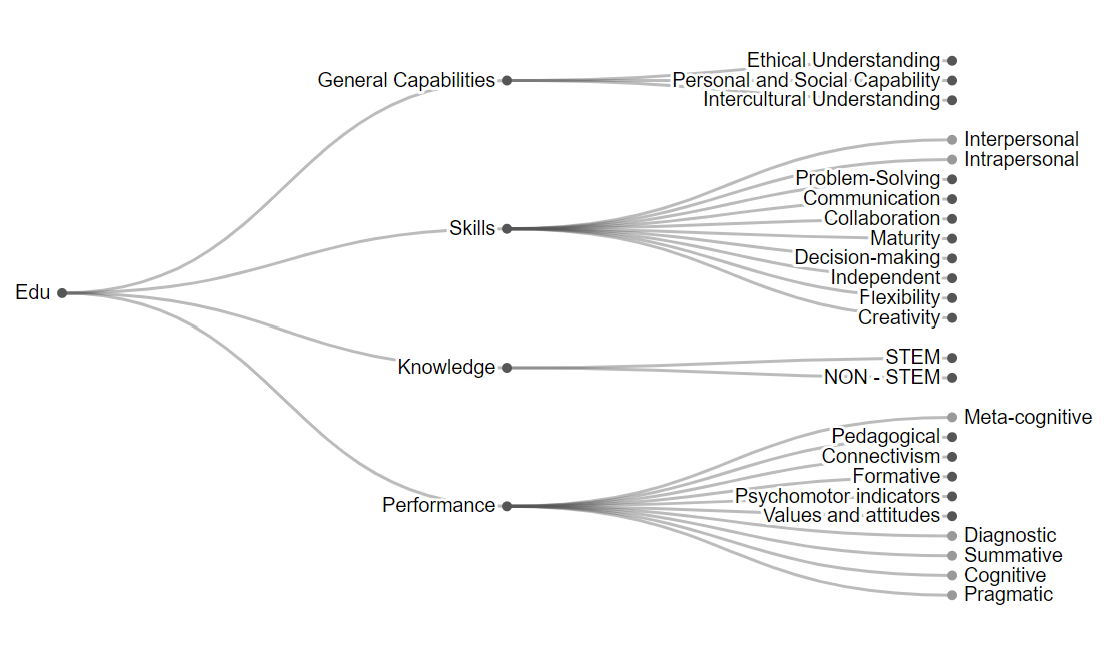
Student assessment is the process of assessing students’ skills, abilities, and accomplishments. It is a constant, everyday part of the teaching and learning process in each and every classroom that is essential for teachers to evaluate their teaching techniques and students to understand the course material. Four main concepts that have been investigated in literature for students assessments are knowledge 156, 113, skills 179, 155, performance 184, 19, 99, and general capabilities 2. The concepts and sub-concepts are all depicted in Figure 3.
-
•
Knowledge: Knowledge assessments are defined as measuring a student’s academic strengths and weaknesses for understanding of academic subjects. Knowledge assessment is a kind of quantitative assessment, which is at the heart of education assessment. Teachers and parents use test scores to measure academic knowledge of students. The academic knowledge can be categorized to two main part of STEM and Non-STEM assessment 156, 113.
-
•
Skills: Skill assessments measure the ability of students for doing an activity or task. Measuring students’ skills can be helpful for understanding and increasing their styles of thinking and intellectual capability. Skills assessment will also evaluate the expertise of students in doing different tasks and how much they practiced them. Student skills can be categorized to interpersonal, intrapersonal, problem-solving, communication, collaboration, maturity, decision making, independent, flexibility, and creativity skills 179, 155.
-
•
Performance: Performance assessment identifies the overall process of executing a task for students. It is a sequence of responses aimed at improving the environment in specified way. The sequence of responses consists of the behavior of a student, what a student says and dose and creates. Performance assessment defined as a response demand that focuses the students’ achievement. Therefore, performance describes how a student behave or act by assessing pedagogical, connectivism, formative, psychomotor indicators, values and attitudes, diagnostic, summative, cognitive, meta-cognitive, and pragmatic behaviors 184, 19.
-
•
General Capabilities: Capability in the Australian Curriculum encompasses knowledge, skills, behaviours, and attitudes. When studying in the classroom, it is crucial that students have the capacity to utilise their knowledge and talents in other, more difficult and ever-changing contexts. It is consists of ethical understanding, personal and social capability, and intercultural understanding 2.
2.2.2 Creativity in Education
Although creativity has always played a big role in human history, the present era due to the rapid change and its link with the concepts of innovation has become doubly important. So that creativity and invention have become the key measures of a country’s success. With the increasing advancement of knowledge and technology and the widespread flow of information, societies today need training for creative thinking skills with which they can move forward with the developments. Hence, the goal should be to foster creativity in people from a young age through education.
Despite the recent research in creativity, it has been challenging for academics and researchers to consent on a definition to define it clearly. Generally, most of the definitions shares the two common attributes such as "novelty" and "effectiveness" (or usefulness). It is stated that an idea or product is creative if it is both novel (original) and useful for others. In other words, it should add something new and useful to the world that didn’t exist before 8. Third attribute is also considered in different researches such as "task appropriateness" 167, "style of the product" 43, and "wholeness" 93 which means the aesthetic dimensions within specific context.
Hence, due to the most recent and clear definition of creativity, it is consist of three attributes including "novelty", "effectiveness", and "whole" or for short NEW. The NEW framework is then introduced to offer a systematic way to evaluate creative products in education. In fact, there are numerous instruments to evaluate creativity in education in literature such as divergent thinking tests, self-reported creative activities, judgments of products, and rating by others, etc. 93, 6, 7.
The Torrance Tests of Creativity (TTCT) is one of the oldest and still popular method to evaluate creativity as a divergent thinking test method. The test contains two modes, figural and verbal, to be answered in a limited amount of time (30-40 min) then the scores from each subtests are combined into an overall score that covers four dimensions: Fluency, Elaboration, Originality, and Flexibility. Fluency refers to the amount of produced ideas; Originality refers to the amount of original and unique ideas; Elaboration is the capacity to elaborate on an idea and add details to it; and Flexibility is the capacity to generate a wide range of ideas.
Another recent research on creativity measurement is published by Baer J. et. al 13 based on the rating method. The research is focused on the Consensual Assessment Technique which Teresa Amabile proposed it originally, and she and other scholars improved it afterwards. The writers believe that this method is a well-validated tool that has been called the gold standard of creativity assessment. It may be used to assess the originality of students’ research ideas or scientific hypotheses, as well as their creative works and musical compositions, and their poems, essays, and stories. First, individuals will be asked to make anything (e.g., a short essay, poem, or experimental design) utilizing some basic instructions and materials. Then a group of domain experts will assess the creativity of the items they have created.
The Components of Creativity. Based on Amabile’s works on creativity, there are three components of creativity that determine a person’s creativity including creative thinking skills, domain-relevant skills, and motivation 8, 9, 11, 92, 10.
The first component, creative thinking skill, depends on a person’s cognitive style as well as personal characteristics. In general, people are more likely to be creative if they are identified by following cognitive styles: problem finding, idea generation, understanding complexity, using wide categories, remembering accurately, divergent thinking, suspend judgement, information organization, communication, spatial ability, and generate alternatives. This component also depends on people’s personality like: self-discipline, tolerance for ambiguity, ability to delay gratification, high degree of autonomy, nonconformity, tolerance for risk taking, high level of self-initiated, tendency to overcome obstacles, curiosity, reflection, action, and social independence 8, 98, 87, 22, 166, 189.
The second component, domain-relevant skills, depends on people’s education level, talent, and experience in a given domain. Expertise in a variety of interconnected disciplines might be helpful to become more creative. The third component, motivation, is called as the most important element of creativity since it determines what people will do with their expertise and creative thinking skills. There are two kinds of motivation, intrinsic and extrinsic. Intrinsic motivation like participating in an activity due to own interest, involvement, or personal challenge. And extrinsic motivation is related to environmental motivations like evaluative pressures, contracted for reward, surveillance, competition, and restricted choice.
2.3 Educational Data Modeling
2.3.1 Data Modeling
Data modeling is the process of building a data model to be used in an information system. An information system consists of a database which contains stored data and programs for collecting, manipulating, and recovering the data. Similarly, a data model describes the type of data to be stored and organized in the database in different formats 162.
There are many reasons to devote more time and resources to data modeling such as leverage, conciseness, and data quality. They all make a compelling case for considering the data model to be the most essential part of an information system 107.
-
•
Leverage: Programming may be made easier and less expensive with the use of a well-designed data model. Even a minor adjustment to the model can save a lot of money in terms of overall programming costs.
-
•
Conciseness: The time it takes to evaluate a data model is far shorter than the time it takes to read hundreds of pages of functional specifications.
-
•
Data quality: A database’s data is generally a significant corporate asset that has been accumulated over time. Incorrect data lowers the asset’s value and might be costly or difficult to fix.
2.3.2 Data Modeling Terms
Three basic terms and definitions for data modeling are an entity, attribute, and relationship 161.
-
•
Entity: An entity refers to a real-world object such as individuals, products, or organizations.
-
•
Attribute: An attribute is a property of an entity such as age, color, or address.
-
•
Relationship: A relationship is a connection between two entities.
2.3.3 Types of Data Models
Designing databases and information systems like any other system design start with a high degree of abstraction and gradually gets more concrete and particular. Based on the amount of granularity that they provide, data models can be divided into three categories. The procedure will begin with a conceptual model, then proceed to a logical model, and finally to a physical model 20.
Conceptual data models or domain models provide a broad overview of the system’s contents, organization, and business concepts and rules. It is usually designed by data modelers and business specialists to obtain the initial requirements of the project design.
Logical data models provide more information and details on the concepts and their relations in the area being studied. The model determines how the system should run regardless of the database. It is commonly created by data modelers using DBMS and platform specifications to provide a technical map of data rules and structures.
Physical data models define a format or schema in which data will be stored in a database. This model is the most detailed of all that offers a finalized product to be implemented. It is mostly designed by database designers using performance requirements, DBMS and platform specifications, and the logical data model.
2.3.4 Data Modeling Methods
There are several data modeling methods to organize the data which are suitable for a specific data structure. The most well-known data models are 123, 195, 124:
-
•
Hierarchical Data Model: This approach is well suited to situations when the information collection is based on an actual hierarchy. The model is a tree shape or parent-child hierarchical structure. The schema contains a parent root record and several child. records or subdirectory branches. The root record links to the child records and each child record can be linked to several additional subdirectories. The hierarchical model have been used widely in education, e.g., to measure educational service quality 172, and to evaluate extrinsic and intrinsic motivation in students 176.
-
•
Network Data Model: This approach enhances the hierarchical data model through enabling the existence of numerous parent records which means allowing each child record to be linked to several parent records. In education, the network model have been used to, e.g., emphasize on the importance of education in environmental protection 192, develop a learning network model for higher education consortia formation and management 151. 168 also presented a new framework called Hierarchical Network Models (HNM) for educational research and developed single-network statistical network models to multiple networks.
-
•
Object-oriented Data Model(OODM): This approach is based on object-oriented programming and assists designers to represent the information with an expressive tool and facilitating the access of users to the information. It is typically employed in applications that seek for high performance, computations, and quick outcomes.
-
•
Relational Data Model: A relational data model consists of a set of tables, recognized as relations, are consists of rows and columns. Every row, or tuple, represents a single instance of the entity. Every column corresponds to an entity’s attribute. A domain is the name given to all of the attributes of a relation. There are also different types of connections between the tables such as one to one, one to many, and many to many that the model takes into consideration. The Structured Query Language (SQL) as a standard language is commonly used to create a relational database to access, use, and modify databases. This method is the most used data model in education, e.g., 47 has introduced a tool that simplified and partially automated the process of designing relational educational data for students, and 185 examined employing relational model as a data analysis and management tool to study educational environments.
-
•
NoSQL Data Model: Other non-relational or non-SQL models have been developed such as document model, multivalue model, and graph data model 38. These three are prominent examples of NoSQL or not only SQL data model.
- –
-
–
The Multivalue Model allows the attributes to take a list of data instead of a single point which makes it different from the relational data model. In other words, in a multivalue model an attribute (cell) may contain an array of values. In education, this model proved to be usefull to make the process of data analysis faster by using multidimensional arrays of student values 116.
-
–
The Graph Data Model allows any node connection with different structures coming from various sources of information 81. In the next subsection, we will explain the terms and concepts related to this model .
2.3.5 Graph Data Modeling
Graph data. Graphs have recently become a popular data structure for data analysis because of their capability to depict any type of real-life problem.
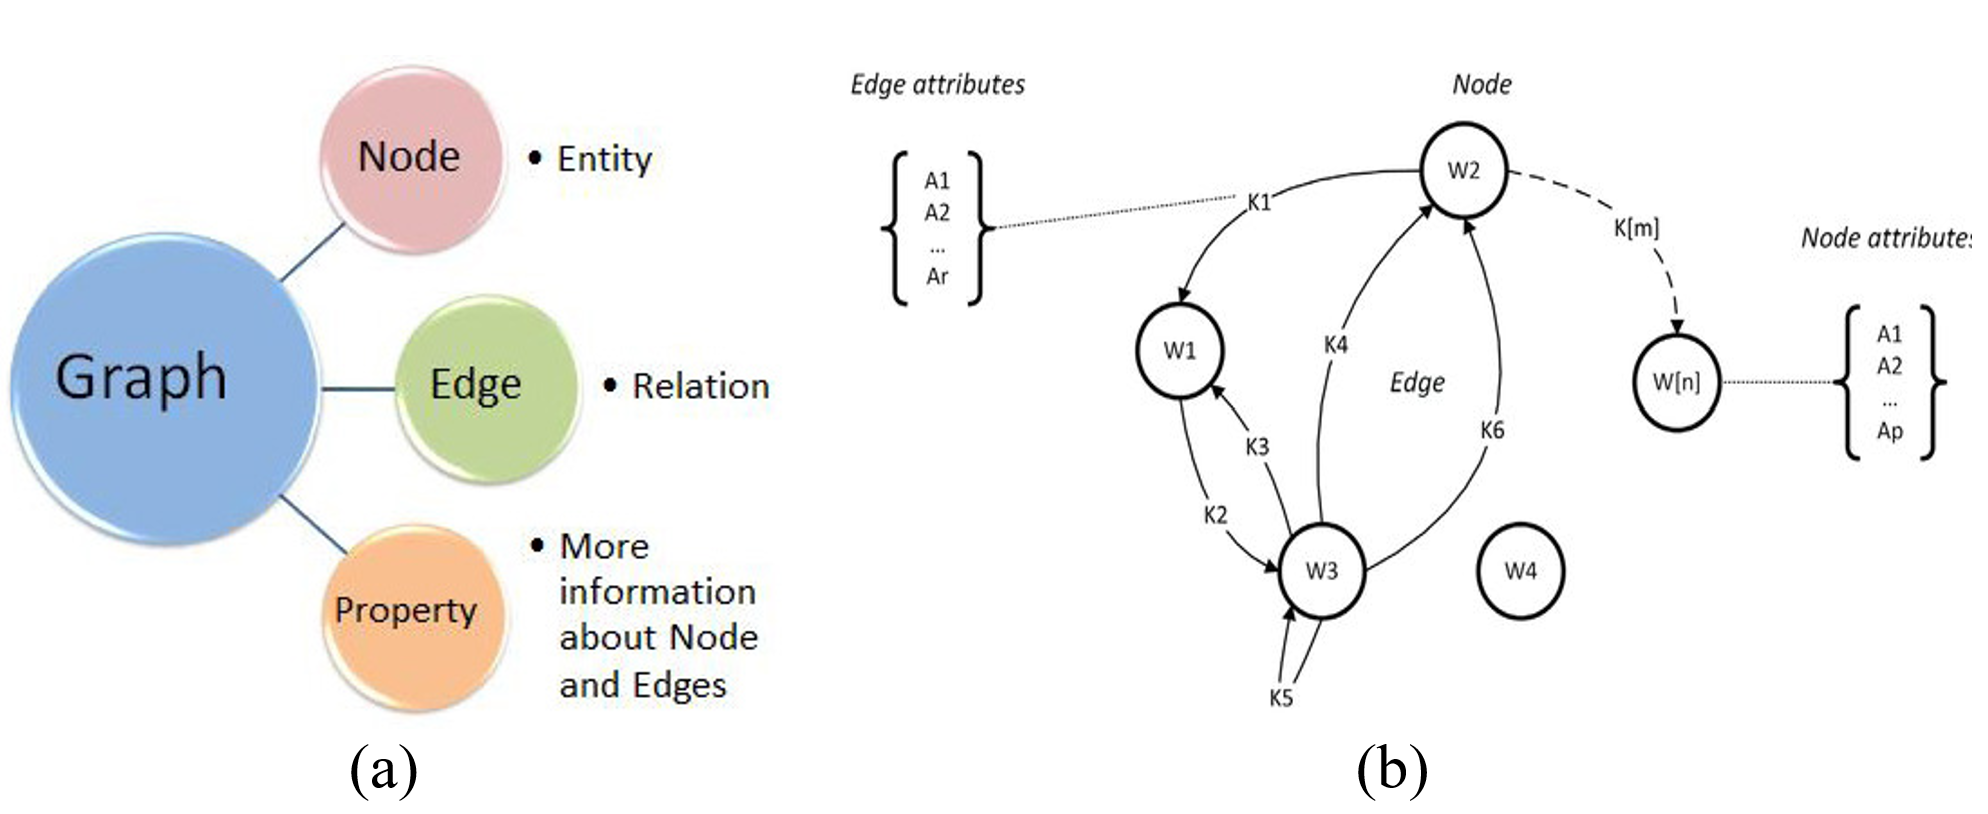
As you can see in Figure 4.a the structure is composed of the following: node or vertice, edge or link, and property. Node as the basic component of a graph structure represents entity. The connection between nodes is called as an edge which represents relation. And property as attribute provides more information about the nodes and edges (Figure 4.b) 48, 135.
Knowledge Graph. Graph-based visualizations are able to address a wide range of topics from several fields, including natural language processing (NLP), knowledge discovery, large network systems, social networks, etc 177. Knowledge Graph (KG) is distinguished from other knowledge-based information systems by their unique integration of knowledge visualization system, algorithmic searches, and information management procedures 85.
Although there are several different definition of KG in the literature, an integrated formulated definition is provided by 146 as follows:
“A Knowledge Graph is a knowledge base that (1) replicates the model of information flow in an organization, (2) stores complex structured and unstructured knowledge, (3) is presented in the form of entities and relations between them, (4) covers a multitude of topical domains, (5) acquires and integrates knowledge, and (6) enables interrelation of arbitrary entities.”
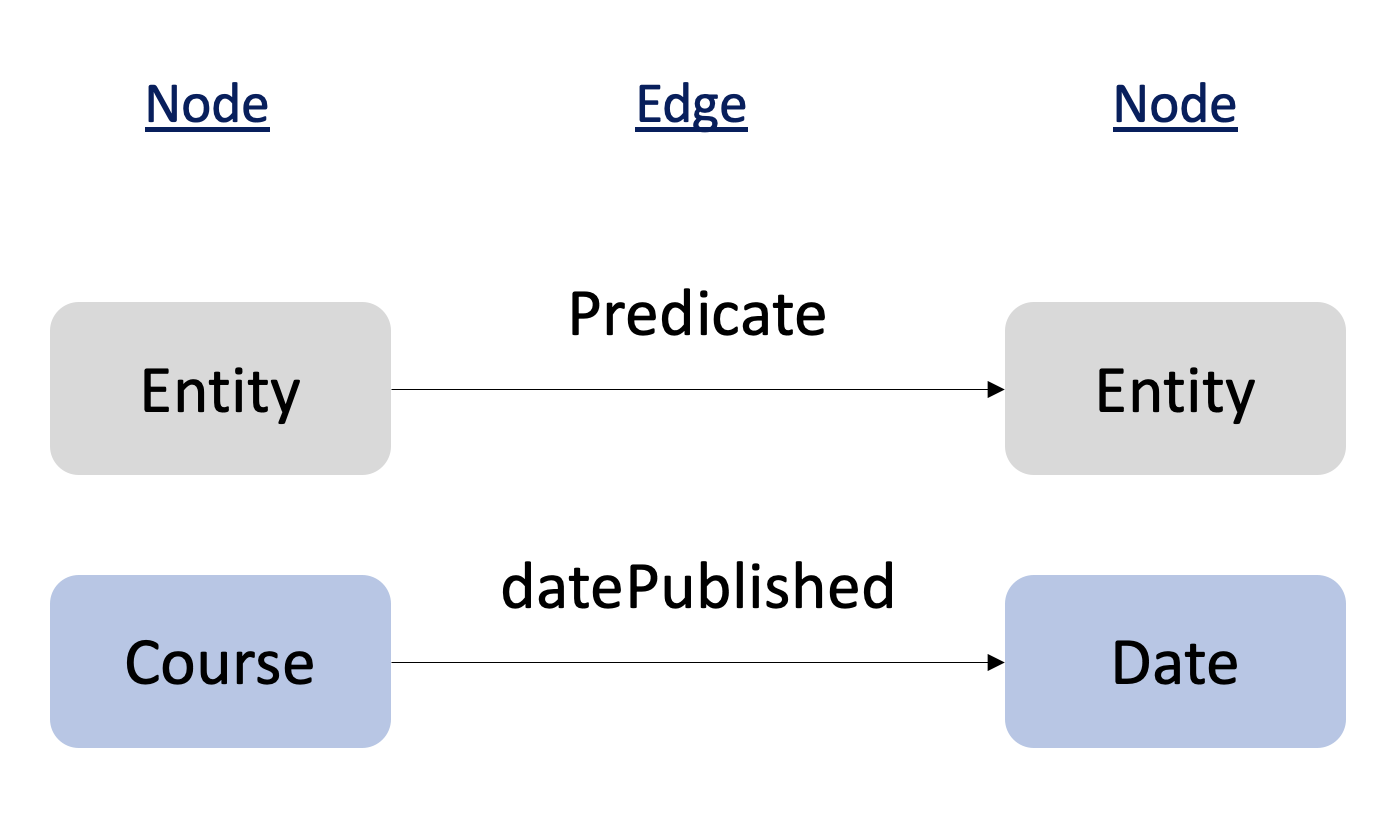
KG model is a database that stores information according to a Knowledge Schema (KS). KS supplies the KG’s basic structure and build its metalayer, as well as defining containers as classes for entities of comparable types. Posting and interconnecting data on the Web utilizing the Resource Description Framework (RDF) is one of the approaches of keeping information in a Schema that has lately gained popularity. According to the RDF standard developed by the Word Wide Web Consortuim (W3C) in 2019 knowledge can be depicted using Triples. The Triples include two entities as head and tail and a predicate which connects them 188. Figure 5 depict a Triple with two entities as "Course" and "Date" and a predicate as "datePublished".
KG has been investigated in depth and used in a variety of fields of science with controversial ideas. Based on various research questions stated in different resources 164, 188, 173, it can be concluded that Knowledge Graph Embedding is the key concept of KG. It is the procedure of converting graph components (e.g., entities and relations) into higher-dimensional vectors in order to make data operation easier.
In this regard, different embedding methods have been introduced, e.g., the RESCAL paradigm which uses multirelational data to accomplish collective learning 126, the Skip-gram model as an unsupervised model which predicts a contextual word using a target word making the process of text data easier 120, the TRESCAL model as an improvement to RESCAL model performs relation extraction 60, 40, and TransE which transforms entities and relations of a graph to vectors in the same semantic dimension space 49.
2.4 Open Learner Models
A learner model represents the knowledge, misunderstandings, and challenges of learners 57. Learner models are often concealed from the learner they are representing, as they are created from the data acquired from advanced educational environments to adjust to a user’s learning requirements. Currently, systems are more inclined to interact with their learners and allow them to see and assess their model using an Open Learner Model (OLM). OLMs propose a new paradigm for revealing the model to students, making it more helpful to them. Such learner models encourage metacognitive skills such as self-awareness and self-regulation by allowing students to analyze their reflections.
According to Zimmerman 197, the ability of students to recognize and manage their educational environment, including internal and external dynamics, is referred to as self-regulated learning. A self-regulated learner is also defined as the way they are actively engaged in their education in a cognitive, metacognitive, and motivational manner. Furthermore, research reveals that technological approaches which augment the thinking skills and self-regulation of students will improve their performance and learning outcomes in all areas 95, 35.
Regarding this, OLM can be a tool to support self-regulated learning as it helps the learners to view their information. Thus, learners will be in a position to observe, evaluate, and manage their learning which will enhance their educational outcomes by changing their learning strategy as necessary 55. In other words, the model is beneficial for both teacher and learner as it provides personalized learning based on the learner’s progress and behavior.
Other than supporting metacognitive skills, many other goals are identified by (Bull, 2007) for developing OLMs and then designed a framework for OLM refferred to as SMILI:) to answer three questions including, "what is available?", "How is the model presented", and "Who controls access?" 53. The purposes of the model are defined to improve the accuracy of learner model, encourage learners to reflect, assisting learners by keeping track of their progress, promote competition and cooperation among learners, permit the learner to have access to their data, assist with navigation, assist with learner control, improve student confidence in the system by displaying learner model content, and assess by using the learner model.
2.4.1 Representation of OLM
There are two kind of representation approaches for visualizing models, simple and complex, which basically depends on the purpose of developing and the users of the OLM. Simple models that just represent the knowledge level of a learner in a variety of domains can only provide the learner with this basic information. They basically employ a number of graphical forms to convey a series of concepts such as using graphs, charts, boxes, tables, or skill meters to depict the knowledge and progress level of a learner.
Simple graphs may represent learners in a simple numerical model or use more complex formats such as a combination of skill meters and a structural view. There are also other popular formats to display the same skill meters like using pictures of tree growth 109, the liquid level in a container 134, smiley faces 103, and arrows in a target 51. Figure 6 depicts some of these skill meters which are more appropriate to be used for children that may encourage them to expand their knowledge.

Complex or structured models provide learners with more comprehensive information and more complicated knowledge structured views. But it does not imply that the learner has access to all the information available in the model, accessing to the information will be defined for each user and learner by an administrator 95. Like simple models, they also employ a variety of visualization techniques such as tree maps, three dimensional structure, hierarchical tree structures, textual description, and concept maps. While the most common visualization method in simple view is skill meter, the most common structure in complex view is concept map.
2.4.2 Types of OLM
Providing learners some control over their education can motivate them to become more self-reliant and self-regulated. OLMs offer various learner control such as Editable, Co-operative, Inspectable, and Negotiated types 90.
Editable OLM allows learners to modify the data that the system provides. This interaction is allowed due to reasons such as expanding knowledge, and recalling information or resources. Hence, learners are fully responsible for their learner models since they have the ability to modify the information as their knowledge evolves. For example, this method is used by the Flexi-OLM system 115, the C-POLMILE system 56, and Scrutable Adaptive Hypertext system 65.
Co-operative OLM provides some means of integrating the views of the tutor and the learner to construct a more comprehensive model rather than completely relying on the system to create the model. Since both sources of input should be combined in a process, building this model is more complicated. Mr. Collins 58 is an example of a cooperative OLM under the control of both tutors and learners. In this model, the learner can challenge the system’s assessment and if the tutor disagrees with the claim, the system would challenge the learner with a question concerning the disputed topic.
Inspectable OLM offers read-only data to the learners and is solely under control of the system. The model is completely reliant upon system deduction which is derived from engagements between the system and learner. The learner may view the model but not alter its content unless they use the standard methods like asking the learner to answer more questions 55.
Negotiated OLM is the product of a process of negotiation between learners and the system to come up with a model that both the learner and the system agree on. The procedure often include seeking and offering information, validating, challenging, arguing, and accepting. Mr. Collins 58 is one of the first negotiated OLMs which is based on involvements among learner and the system model. In this model, the contrasts in beliefs are clearly reflected. In comparison, STyLE-OLM 72 only represent one belief which both the system and learner consent. In the end, any disputes that emerge will be addressed through debate or eliminated, and the agreement achieved will be included to the model. Many methods have been used to perform the negotiations including dialogue game (used in STyLE-OLM) 72, menu selection (used in Mr. Collins) 58, and chatbots (used in CALMsystem) 104.
2.4.3 OLM Supporting Creativity in Learners
There are also a number of research specifically addressing creativity and its related skills in OLMs 62, 63, 133, 54. For example, Clayphan et. all 62 created the first OLM that supports group and individual brainstorming reflections and claim that the model is effective and can enhance creativity in learners. They have designed a model asking learners three main questions, perform several brainstorming sessions, and analyze the answers to build the learner model. The questions are as follows: "How much did I contribute?", "At what time was the group or an individual stuck?", and "Where did group members seem to spark off each other?".
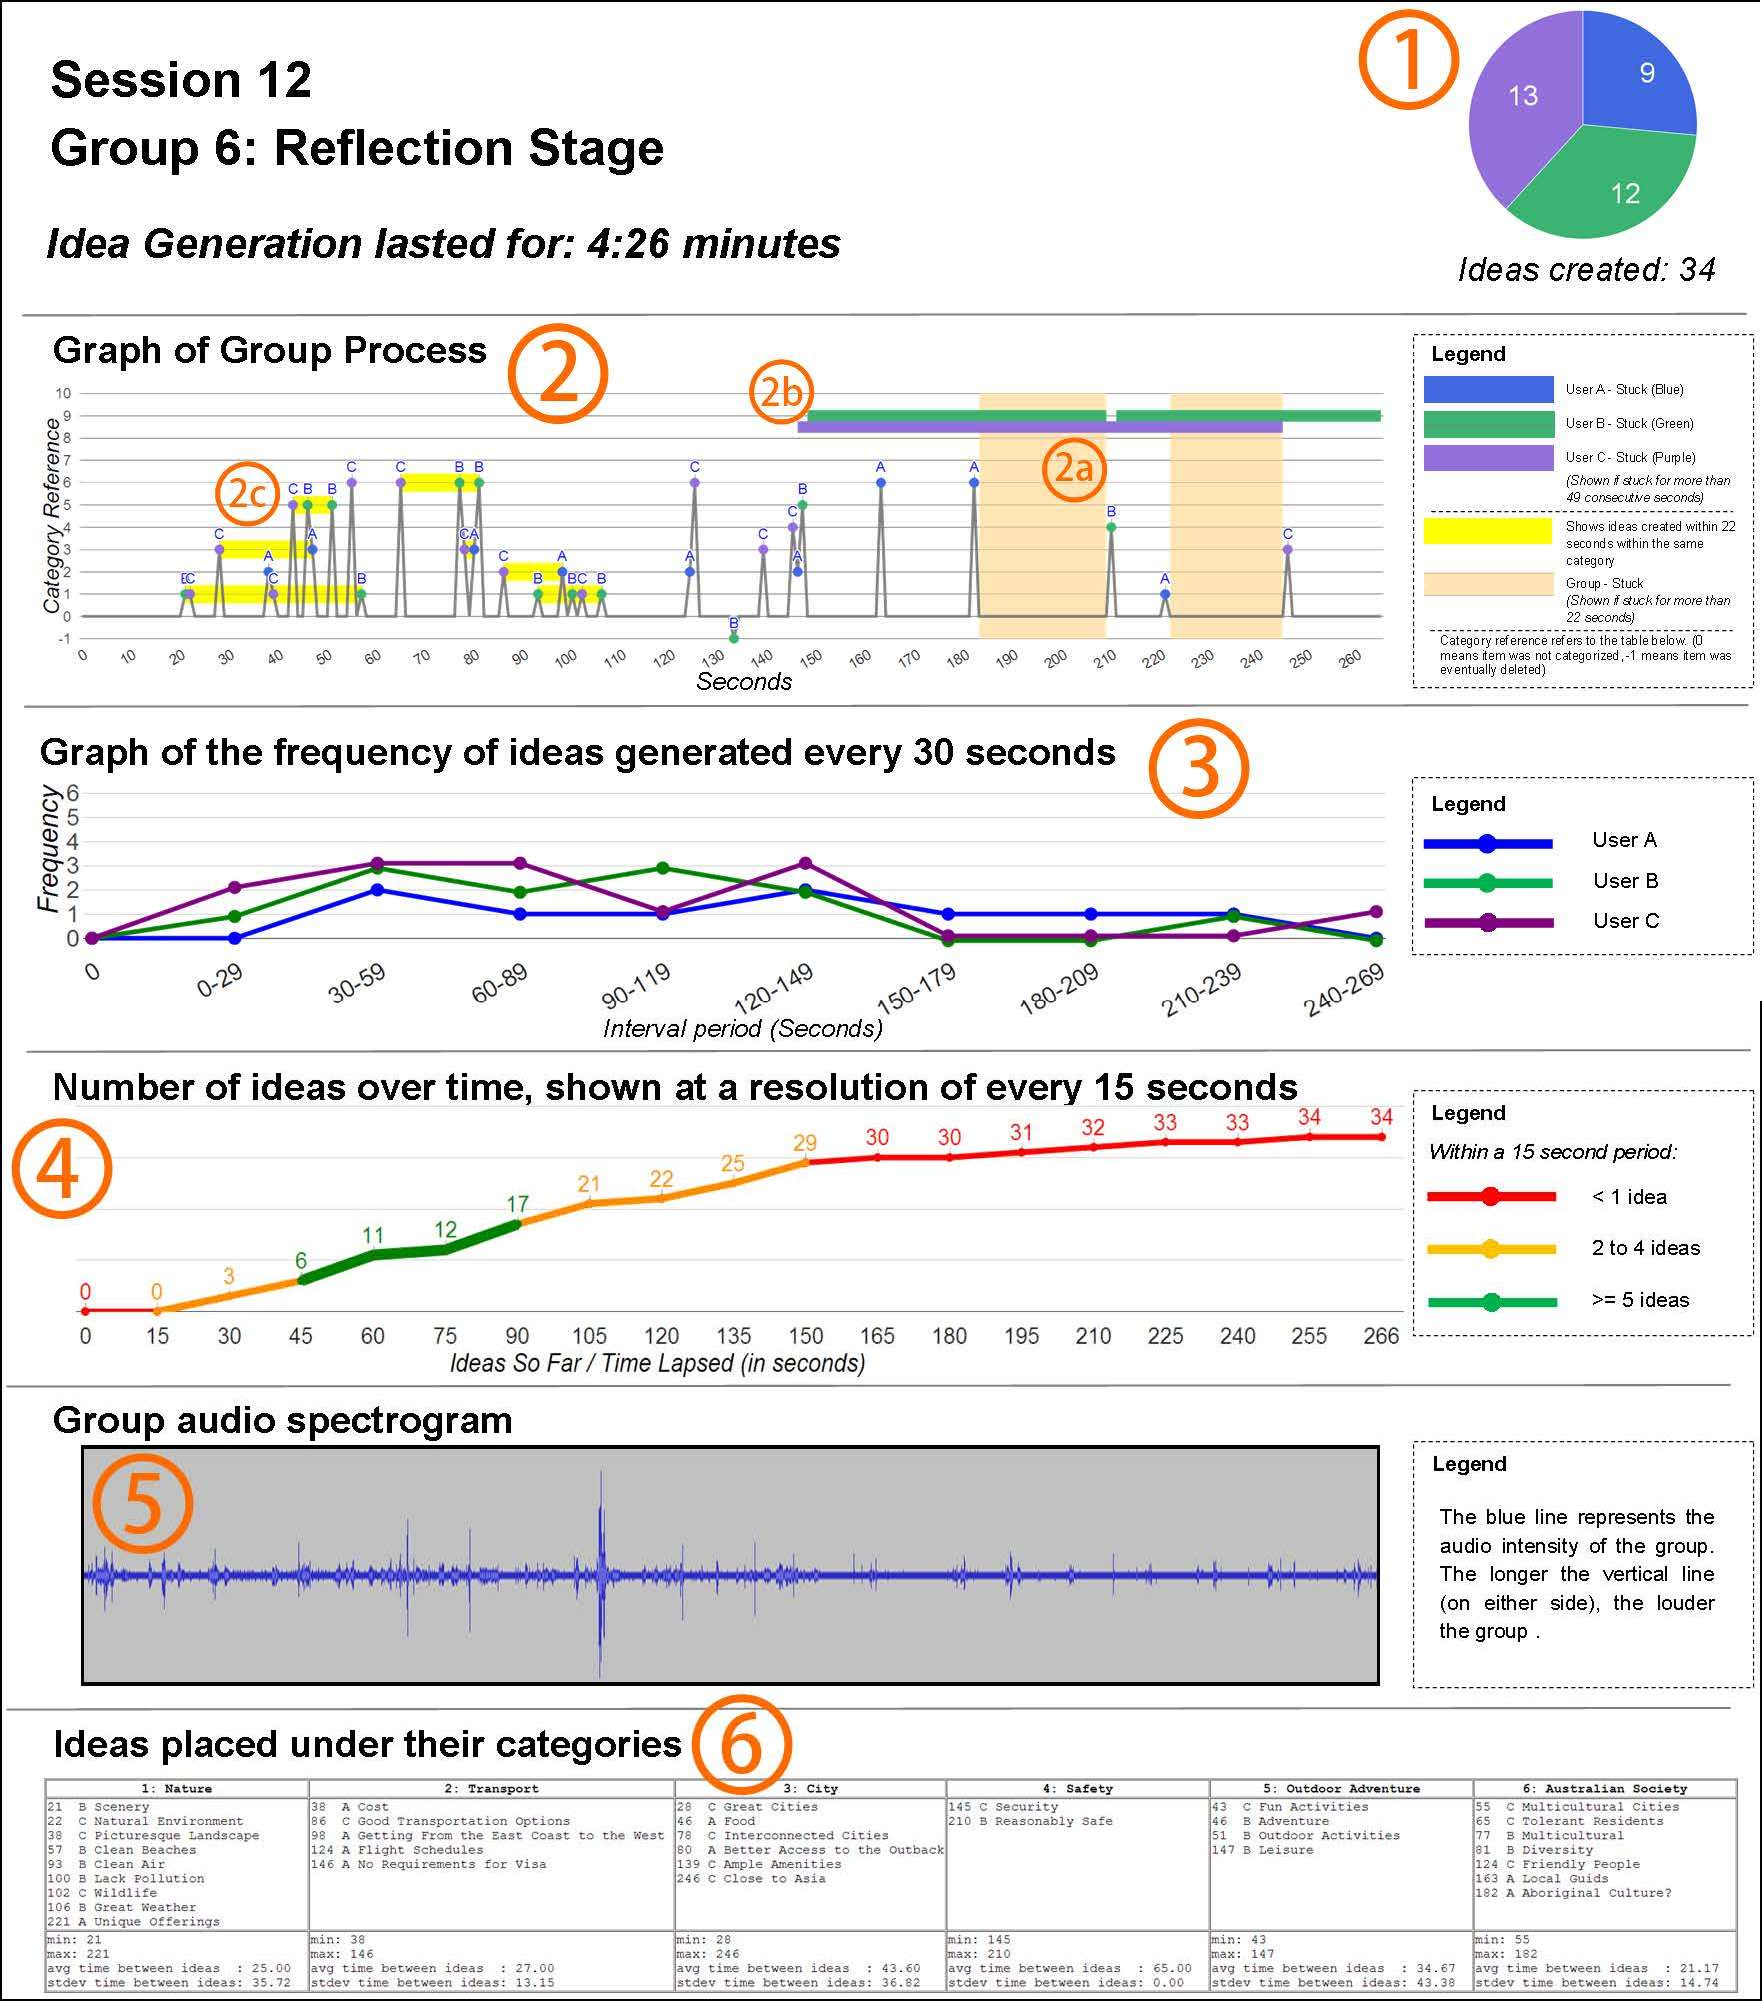
Figure 7 depicts one of the sessions of the learner mode that assists learners to answer the mentioned questions. The design has 6 parts that are all marked in the figure: (1) Each person’s total amount of ideas. (2) Graph of group process. In this part, the horizontal and vertical axes show time and category reference, respectively. Each dot is an idea and their color indicate the learner which is defines in the legend (e.g., here blue color indicate user A). The Orange rectangles indicate the amount of time groups was stuck for more than 22 seconds (2a). The Bars show the amount of time each user (A, B, or C) was stuck for more that 49 continuous seconds (2b). And, the yellow bars show ideas created within 22 seconds in the same categories (2c). (3) Graph of the frequency of ideas generated every 30 seconds by each person. (4) Number of ideas over time, shown at a resolution of every 15 seconds, cumulatively. (5) Group audio spectrogram which is useful when group is stuck and need discussions. (6) The list of all the ideas placed under their categories based on user and time of creation.
To evaluate the learner model they have invited 15 participates to perform a thinking aloud study and asked them to answer a sequence of questions in three anonymized brainstorming sessions. Results show that the model is successful to help participants evaluate their own performance by answering a series of questions using interactive tabletops. This gives them the opportunity to find out more about their contribution level, when they got stuck, and when they lit up each other with ideas in a group.
2.5 Educational Data Mining and Learning Analytics
2.5.1 Data Mining
The fast advancement of technology has resulted in a massive influx of data from a variety of sources. The rise in the volume of data, as well as the development of new technologies, has created a serious concern. Data gathering has also risen significantly, and traditional software’s ability to acquire, handle and analyze such massive amounts of data has become obsolete. Massive amounts of data are now available all over the world, requiring analysis to extract potentially valuable and previously uncovered information which the traditional data analysis techniques are unable to deliver 187.
To produce the desired demands, Data Mining (DM) originated as a response to the need to create new data analysis methodologies. DM has become a popular study topic as a result of the growing demand from social media and the practical side of things. This new branch of computer science examines historical data to extract previously undiscovered and beneficial knowledge for decision-making. It detects patterns that aren’t visible to the naked eye. If there is a big volume of data accessible for analysis, the quality of the derived knowledge will be higher. Artificial intelligence, data visualization, database technology and machine learning are all components of DM as a multidisciplinary field of science 106, 12.
DM, the practice of extracting patterns from data, is a process that should be automatic or semi-automatic and the discovered patterns should indicative in a sense that it provides some advantage 186. It isn’t restricted to a single form of data and it can be implemented on unstructured data (e.g., documents), semi-structured (e.g., XML-based), and structured (e.g., tables in Relational Databases) datasets 91.
DM Techniques. DM learning techniques are classified as supervised, unsupervised, and semi-supervised learning. In supervised learning, it is required all data to be labeled and during the training phase, the system is given a pair of inputs (X) and outputs (Y) to predict a specific quantity. Differently, no labeled data is required in unsupervised learning, and the system is merely provided input (X). The main goal in unsupervised learning is to understand the data and look for structure or unusual patterns in data analysis. Semi-supervised learning integrates techniques from both supervised and unsupervised learning since some of the data is labeled while the remaining is not 110.
Descriptive and predictive models are two different types of DM models. Descriptive models detect similar items or common groups in existing data, with the aim of identifying reasons for success or failure while predictive models categorize events in the future in a deeper way and try to satisfy the unknown results in advance 140.
A descriptive model presents the main features of the dataset. It simply provides a summary of the data points that allow users to look at specific elements of the dataset 84. A descriptive model is often discovered by unsupervised data mining to identify patterns in the datasets, but it is up to the data miner to analyze the discovered patterns 129. Examples of the descriptive model are Clustering (grouping similar records) 142, Association Rule (Identifying relationships between records) 165, Sequence Discovery (discovers statistically relevant patterns in sequential data) 112, and Summarization (finding a compact description of a dataset) 76.
Predicting the value of a new unknown variable, the target variable, is the goal of a predictive model. The data mining task is termed Classification if the goal value is one of a specified number of defined class labels 138. If the target variable is continuous, the task is Regression 88. Prediction 183, and Time Series Analysis 77 are two other prominent techniques that are using in DM. The input variables for each form of prediction might be categorical or continuous; based on the type of input data utilized, different prediction approaches are more likely to be efficient 16. Top three data mining techniques are explained below:
-
•
Classification as a supervised learning technique classifies data types or concepts to predefined classes. In data mining, classification is a well-known important study field, and enough research has been done in recent years to enhance key problem strategies. In classification, the core concepts is to make predictions depending on the user’s interests and desires. Data can be classified by various criteria such as the type of mined data (e.g., text, spatial, multimedia), the data model (e.g., relational database), type of discovered knowledge (e.g., discrimination, characterization), or the data analysis approach (e.g., Neural Networks, statistics, machine learning) 138, 102, 97, 127.
-
•
Clustering as an un-supervised learning technique clusters data based on shared characteristics. In other words, those objects that are similar to each other are grouped in one category and the rest are grouped in another category. Clustering methods include Hierarchical, Partitional, and Densitybased clustering 42. Hierarchical clustering creates a hierarchy of nested clusters by repeatedly executing some criteria. Partitional clustering classifies a given dataset into multiple groups using some criteria. And, density-based clustering groups the given data based on the density of points in data space. It works based on the notion that an adjacent region of high point density defines a cluster 153.
-
•
Regression is a supervised learning technique that has two types: Linear and multiple regression models.
-
1.
Linear Regression: The most common application of this type is to employ a linear equation to represent the relationship between two variables. It may also be utilized to determine the mathematical connection between the variables. It is the most basic type of regression and the model’s formula is as follows:
-
2.
Multiple Regression: This model as one of the most often used models in data mining for making predictions is most commonly used to describe the connection between several independent or predictive factors. Generally, the model predicts an outcome using two or more independent factors. The following is the formula for the multiple regression model:
In data mining, classification and regression are two of the most common prediction techniques. Since they are so similar, it might be challenging for a user to know whether to use one over the other.
-
1.
2.5.2 Educational Data Mining
Recently, Educational Data Mining (EDM) as an application of DM in education has emerged to improve teaching, learning, and research outcomes. At first, it was introduced by a few workshops and seminars in Artificial Intelligence in Education (AIED) conferences and now it has progressed to the point where it now has its community and societies.
On the subject, there is a substantial and varied body of literature. For example, Bienkowski et al. (2012) 44 offers a widely referenced study in which they introduce EDM, as well as its basis, difficulties, and implications. There are also several books and paper surveys that present applicability, approaches, and the state of the art in EDM 148, 150, 136, 147, 149.
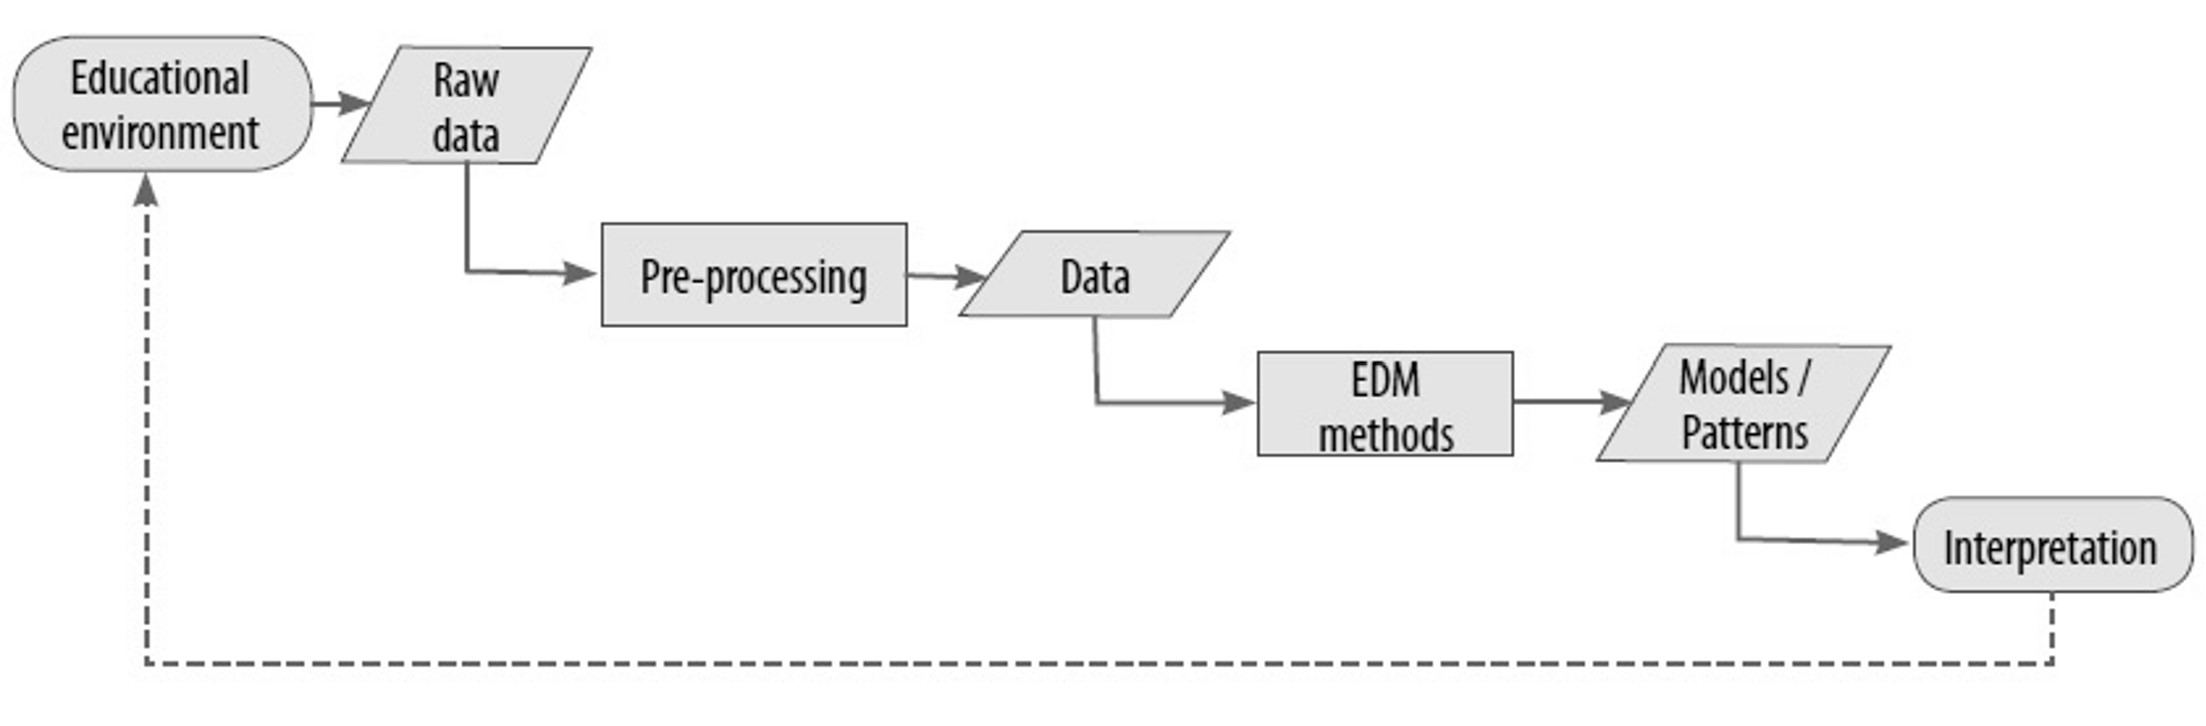
The application of EDM techniques includes a number of processes. As you can see in Figure 8 the depicted steps in this process are as follows 111: (1) Designing a plan and identifying the necessary data, (2) Extracting the data from available educational environments, (3) Curating the extracted data since it might originate from range of sources with different formats, (4) Applying EDM methods to create models/patterns, and (5) Interpreting the models/patterns. In case of inconclusive outcomes, after making changes to the teaching/learning method or the study design, the analysis will be repeated. This might happens because of not properly addressing the problem, inadequate or unsuitable input raw data, or choosing not powerful methods.
There are four areas of EDM applications that are increasingly popular within the field 15:
-
1.
Enhancing student models: The educational data about students’ charcterisitc or behavior, e.g. their cognitive, meta-cognition, motivation, and knowledge, will be used to personalized the learning process and modeling differences between students 180.
-
2.
Domain knowledge structure models: The EDM methods that are a combination of psychometric modeling framework and advanced space-searching algorithm are designed to discover accurate domain models directly from data.
-
3.
Research on pedagogical supports: Learning software provide various kind of pedagogical support for students. Identifying the most efficient educational support is another key application of EDM.
-
4.
Research on learners and learning: Research on questions in any of the above mentioned fields (e.g., student modeling, domain modeling, and pedagogical support) may have larger scientific implications for learning and specifically for the learners in the system.
2.5.3 Learning Analytics
There is another related community called Learning Analytics (LA) which shares a common interest with EDM in the way educational data has the potential to make a difference in terms of learning outcomes. It initially defined as the Learning analytics is the measurement, collection, analysis, and reporting of data about learners and their contexts, for the purposes of understanding and optimizing learning and the environments in which it occurs. in the first International Conference on LA, also held in Canada in 2011 159.
There is a substantial and diverse collection of literature on LA. For, example, Larusson (2014) 108 as a popular book in LA contains the most up-to-date concepts, research, methods, techniques, and case studies. It helps the readers find out how to: (a) improve the performance of students and educators; (b) increase student comprehension of course content; (c) Identify and respond to the needs of students who need help; (d) enhance grading accuracy; (e) enable institutions to make better use of their resources; and (f) allow educators to evaluate and improve their own abilities.
The application process of LA is similar to EDM and the steps for testing a hypopaper linked to the learning/teaching process are the same as for EDM. It consists of data extraction from relevant educational enviroments, preprocessing extracted data, applying numerical/computational methods to help educators or psychologist to interpret the outcomes and make decisions.
2.5.4 Common Methods in EDM and LA
The communities of EDM and LA are both interested in exploring new methods to enhance the research on big educational data. Also, there are differences in terms of the research questions, methods and techniques, and focuses, the two areas have a lot in common both in goals and the methodologies and strategies employed throughout the research 17. They can be seen as an intersection of three areas: Education, Statistics, and Computer Science.
The EDM/LA process is a cycle of data mining and knowledge discovery which is involved with students, instructors or academic authorities, and educational environments to produce educational data and ultimately new knowledge. This new knowledge is gained by EDM and LA methods and will be used again by students and instructors in the process 149. The majority of methods pertinent to educational data are used both in EDM and LA. The most popular methods are (1) clustering, (2) prediction, (3) Social network analysis, (4) outlier detection, (5) casual mining, (6) process mining, (7) relationship mining, and (8) text mining. There are also prominent researches around discovery with models and distillation of data for human judgment 18, 160, 159, 32.
-
•
Prediction refers to estimating unknown variables based on history data of a mixture of additional variables. In education the variables might represent performance of students, their characteristics, or learning outcomes 18. The majority of extant literature attempts to estimate academic achievements of students, although studies also explore students’ characteristics such as social interaction 143.
-
•
Clustering refers to dividing data point into categories based on similar observations. It is different from classification since the class labels are not defined. Hence, it is sometimes called unsupervised classification. For instance, clustering method has been used to group schools based on their common features in education 25.
-
•
Social network analysis or SNA refers to studying the social relationship between individuals in a network. To Investigate online social interactions, data mining methods (e.g., classification, prediction) can be used on the network data. SNA can also be used on education data to mine students’ group activities 145.
-
•
Outlier detection refers to detecting data points that are considerably different from the majority of data. In education, outlier detection has been used to identify students who have learning difficulties or who have unusual learning patterns 175. It has also been used to detect irregular behaviors and interaction between educators and students 131.
-
•
Causal mining refers to seeking for causal relationship in data. In education, it has been used to identify the characteristics of students’ behaviour that contribute to their learning outcomes, problems, grades, etc 68. Classification and Regression are two widely used prediction methods that have been used for estimating student’s performance and characteristics 3, 75.
-
•
Process mining refers to obtaining information from the process history logs. It can used to trace the evolution of student behavior through using educational environments. 101 has used process mining method to evaluate the behavior patterns of students while taking quizzes.
-
•
Relationship mining refers to discovering relationships between variables within a big database 141. It is involved with identifying the factors that are most closely linked to a certain variable of interest. Associate rule mining 169, 171, 170, frequent pattern mining, and sequential rule mining are three common types of relationship mining method. For instance, associate rule mining as the most common method is an if-then rule aiming to see if one action affects another by looking at the representation of actions in the dataset. As an example, eLORM is developed to mine the Learning Objective relationships centered on the student’s use information 132.
-
•
Text mining refers to mining knowledge from text. In education, text mining has been used to analyze the contents of the students’ discussion forums, chats, websites, emails, or any text document 144. This method has also been used for the purpose of educational document classification based on their similarities and also checking plagiarism 128.
-
•
Discovery with models is the process of including a prior verified model of a phenomena into a new analysis. In discovery, human reasoning, instead of automated approaches, is used to build models based on prediction, clustering, or knowledge engineering. Then, the created model is integrated into larger models, such as relationship mining. For example, 94 has used this method to investigate on the relationship between carelessness measures and students’ intended goals.
-
•
Distillation of data for human judgment refers to using distillation, interactive platforms, and visualization to display data in an understandable manner. In education, this method has been used for two main reasons: identification and/or classification. The goal of distillation for identification is providing data in a way that it can be identified using recognized patterns. Using data distillation to represent the states of students’ knowledge as they learn new skills is an application 64. Distillation of data for classification can also be used as pre-processing step before creating a prediction model, e.g. 67 has used this method for the purpose of knowledge tracing in students.
2.5.5 Creativity Assessment Using EDM/LA
Although much have been investigated regarding EDM and LA in education and student assessment, there is little study on creativity assessment using EDM or LA. However, there are some researches around cognitive processes such as creative thinking and problem-solving skills 70, 114, 163, 191, 23. For example, Yu 191 performed rule extraction using rough set as a data mining tool to find the rules between scientific creativity and creativity affective. Deng et. al 70 designed a framework for frequent pattern mining using cognitive-based big data analytics. They claim that the discovered patterns assist in the (i) production or extraction of useful knowledge, (ii) identification of behaviour and attitude of users, (iii) comprehension of inference, correlation, inference transmission, and interchange of ideas, and (iv) formulation of suitable decisions and responses.
Singelmann et. al 163 tried to learn more about the way students solve open-ended questions in an engineering course at the graduate level. They asked all students to submit their own products and accompanying project requirements into an online portal. In this way, they are able to check their progress and then by applying clustering algorithms four clusters appeared. The clusters include Surface Level, Surveyors, Learners, and Innovators. Three taxonomy of learning such as Web’s Depth of Knowledge, Bloom’s taxonomy, and Cynefin Framework have been used to define those clusters. By observing which students fell into which groups, how they moved among the clusters, and key phrases associated with each cluster, they were able to gain a better understanding of how students confront the creative process. This research gives a clearer picture of the way students develop and find solutions, paving the way for improvements in customized learning, group matching, and even evaluation.
Another study 114 also investigated cognitive processes of children by a creativity test using data mining techniques. In this study, they asked 95 fifth grade students to think and apply scientific facts. A sample board was provided to students to draw as many paths as feasible. The students were also instructed to utilise the fewest possible number of mirrors to hit the target. This variation on the conventional creativity tests allows students to demonstrate their fluency as well as creative thinking. In this experiment, students’ drawings were coded and analysed using the association rules mining approach to investigate links between different types of optical paths and to determine students’ cognitive abilities in comparison to traditional assessment instruments.
2.6 Summary
In this section, we provided background information and discussed the current state of the art in education for detecting and supporting creativity. We first explained educational data and discussed data curation tools and techniques to prepare the data for further analysis. Several known methods are then highlighted and explained such as Educational Knowledge, Educational Data Modeling, OLM, and EDM/LA techniques. In Educational Knowledge, we focused on the concepts of knowledge hierarchy and taxonomy and introduced the traditional methods for creativity assessment. Next, different data models are explored and discussed how these models, specifically graph data modeling, are used in the education domain. Moreover, OLM as one of the most often used tools for teaching and learning is introduced and investigated for supporting creativity in education. Finally, an overall explanation of data mining in education and LA are provided. The common EDM/LA techniques are disclosed and the important publications in detecting creative thinking patterns are explained to the reader. Table 2 shows the prominent publications in the literature.
In this study, we leverage to address the inherent flaws in the algorithmic approaches by using a rule-based pattern mining technique as a declarative alternative. The approach has relied on the knowledge of experts in education and focuses on facilitating mining creative thinking patterns from contextualized data and knowledge.
| Domain | Description | Prominent publications |
|---|---|---|
| Educational Knowledge | Using traditional tools and techniques for measuring and detecting creativity. | The Torrance Tests of Creativity (TTCT) 174, gold standard of creativity assessment 13, self-report measures of creativity 121, and judgment of products 10. |
| Educational Data Modeling | Organizing the educational data in a way that is suitable for a specific data structure. | Hierarchical Data Model 172, 176, Network Data Model 192, 168, Object-oriented Data Model 74, Relational Data Model 47, and NoSQL Data Model 118, 79, 116. |
| OLM | Representing the knowledge, misunderstandings, and challenges of learners. | Brainstorming reflection support 62, study of learning to brainstorm 63, constructing interpretative views of learners 133, and supporting metacognition 54. |
| EDM/LA | A cycle of data mining and knowledge discovery which is involved with students, instructors or academic authorities, and educational environments to produce educational data and ultimately new knowledge. | Frequent pattern mining using cognitive-based big data analytics 70, rule extraction using rough-set as a data mining tool 191, clustering students for problem-solving skill 163, and associate rule mining to investigate on cognitive processes 114. |
3 Methodology
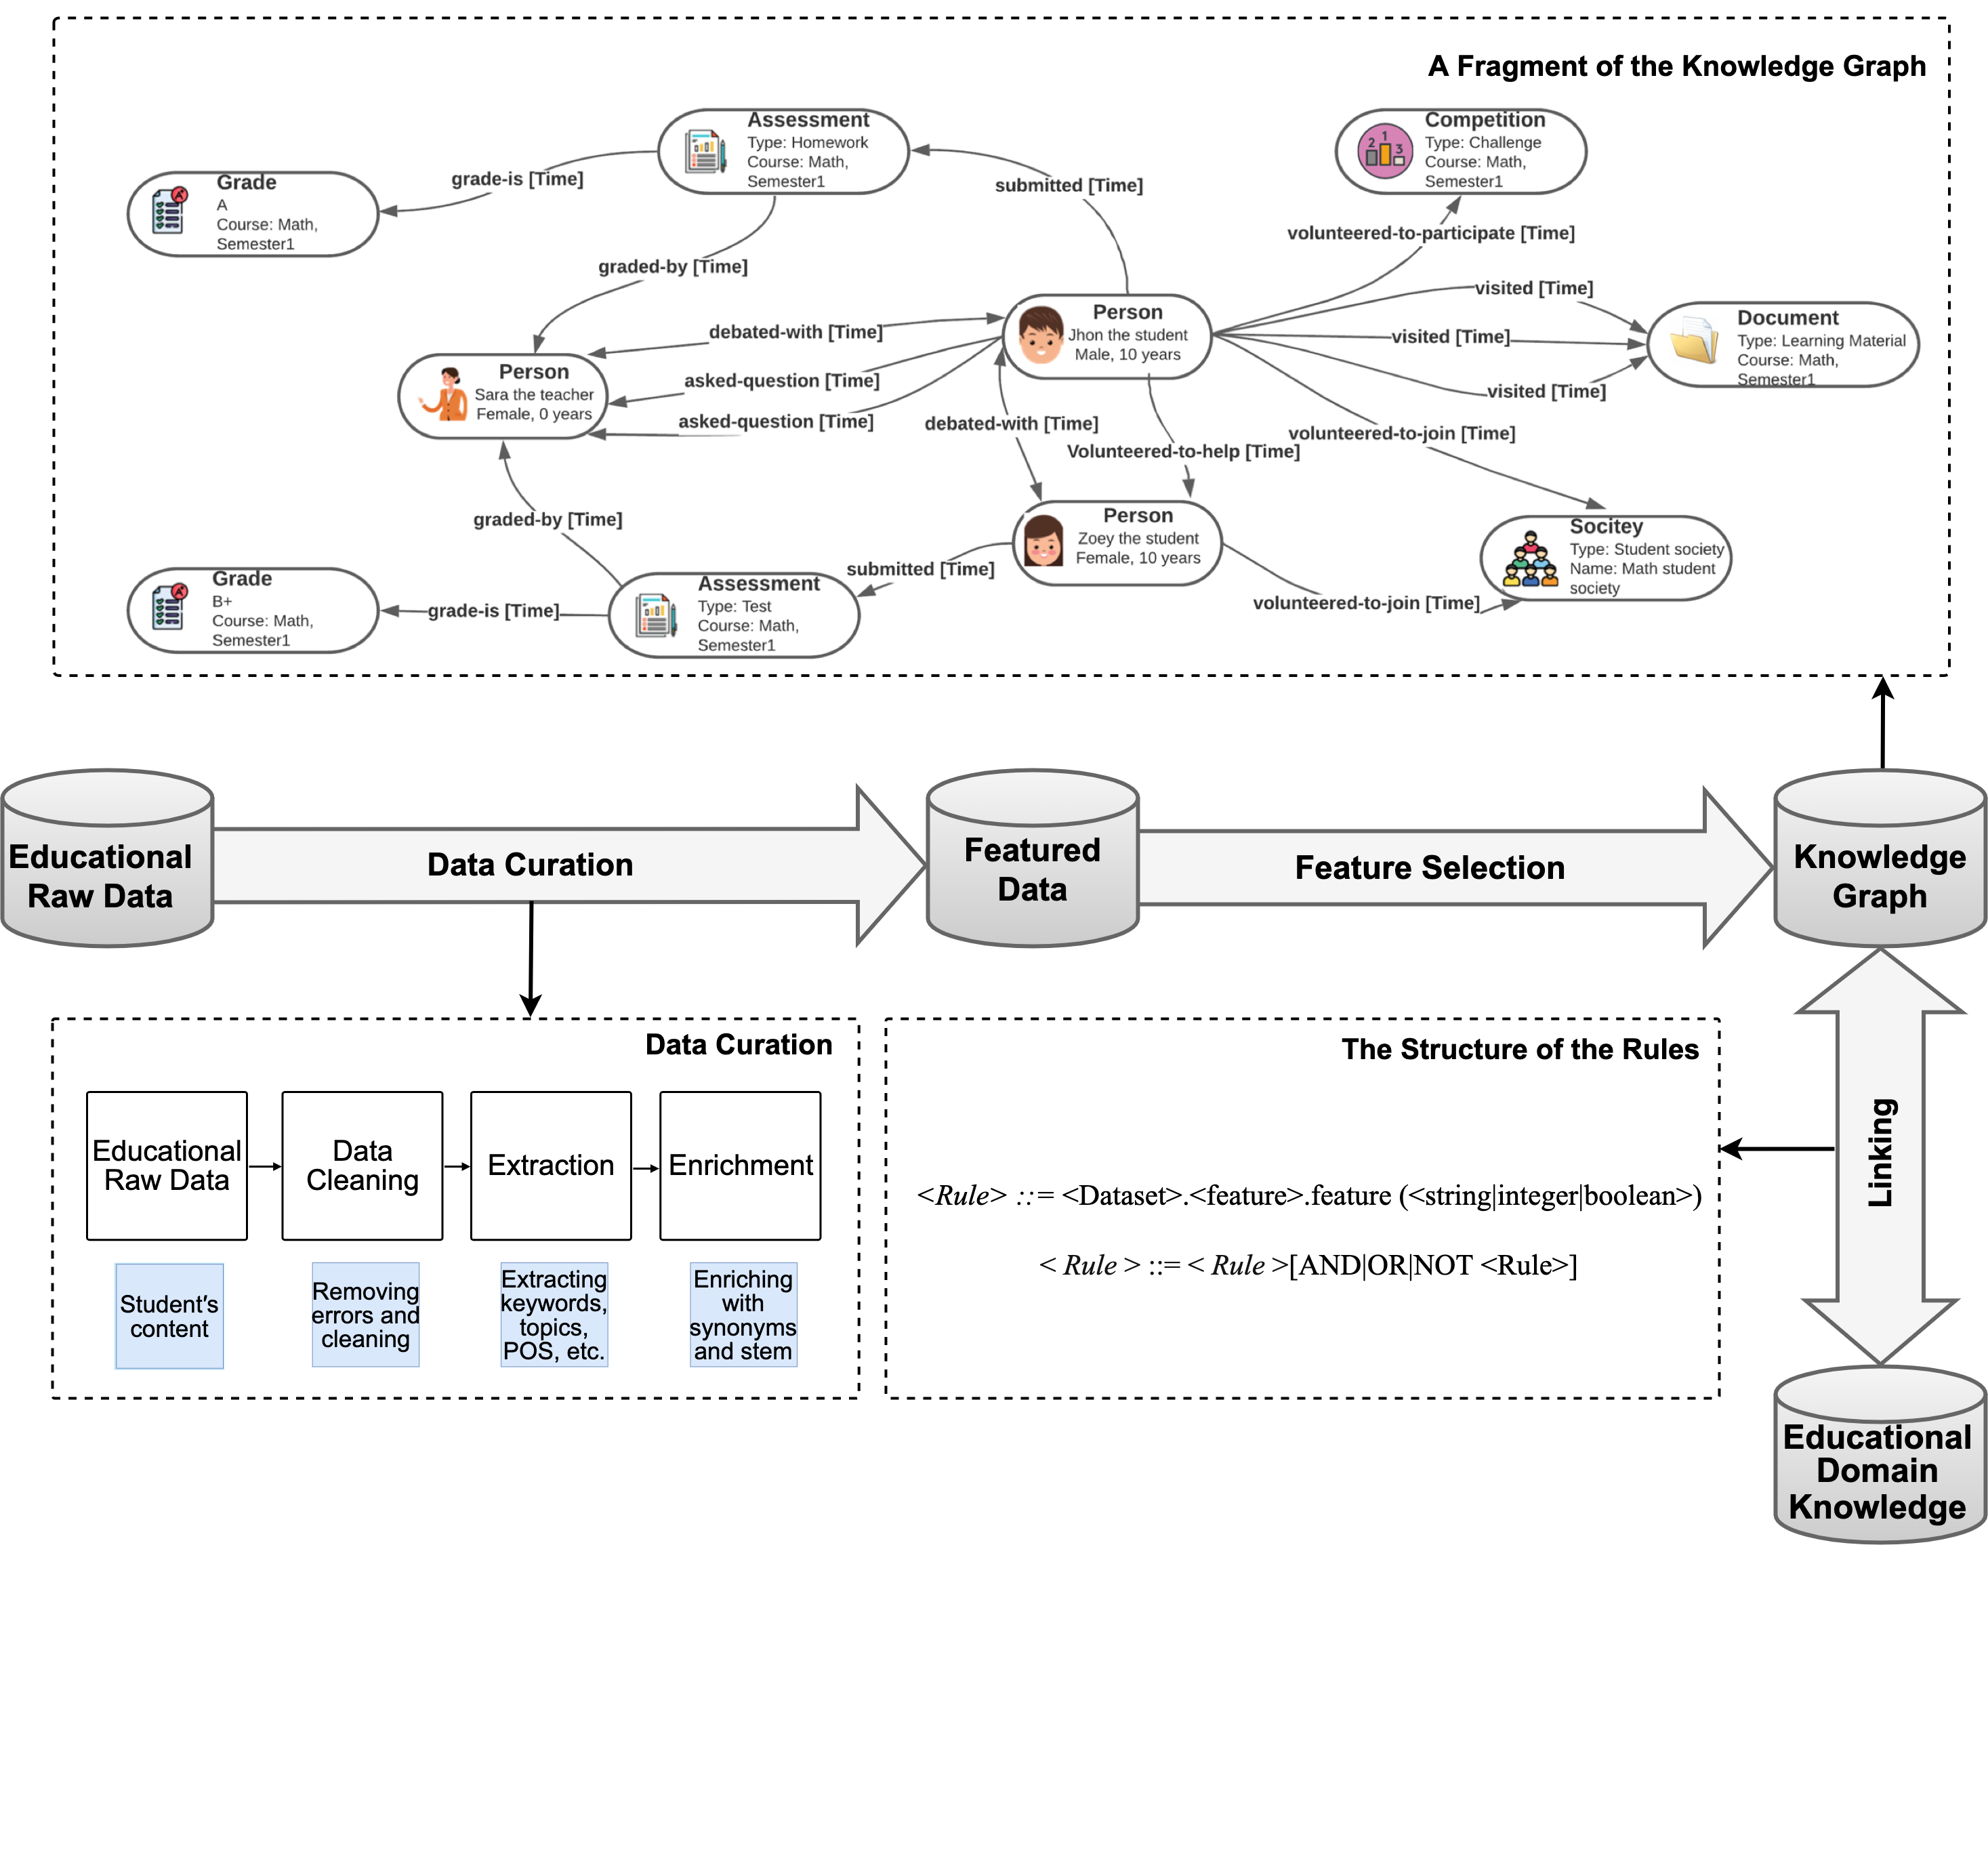
This section provides a detailed explanation of the proposed model. We put the first steps towards formalizing the educational knowledge by constructing a domain-specific Knowledge Base to identify essential concepts, facts, and assumptions in identifying creative patterns 27. We introduce a pipeline to contextualize the raw educational data, such as assessments and class activities. Finally, we present a rule-based approach to learn from the Knowledge Base, and facilitate mining creative thinking patterns from contextualized data and knowledge 157. Figure 9 illustrates the proposed model, including the data curation, feature selection, domain-specific knowledge base, and linking components.
3.1 Data Curation
In this step, we leverage the state of the art in data curation 29, 31, to turn the raw educational data into contextualized data and knowledge. As it is shown in Figure 9, the curation pipeline includes cleaning, extraction, and enriching phases. For example, considering a student’s assessment as a raw data, the curation pipeline will: (i) clean raw data, by identifying and correcting inaccurate or corrupt information, such as missing, erroneous, or irrelevant data, and then correcting them; (ii) extract features (such as keywords, entities, named entities, topics, POS) from the contents; and (iii) enrich the extracted features with synonyms, stems, and similar keywords and entities to make it ready for feature selection and further analysis.
3.2 Feature Selection
Reducing the dimensionality of data has multiple benefits, which make the dataset less complex and thus easier to work. Models are also less prone to overfit on a dataset with fewer dimensions 105. The simplest technique to minimize dimensionality is to choose only the key features from a huge dataset. The readability and performance of the model are heavily influenced by the variables chosen from the student dataset’s list of variables. This would be accomplished by using a feature selection approach on a dataset. Since it is critical to find which features significantly influence the pattern discovery process, the features will be selected from the enriched data. We aim to employ several types of features in education, including: (i) Demographic data, that contain information about the characteristics of students such as age, gender, attendance, economic status, enrollment, dropout rates, language proficiency, disabilities, student mobility, and behavior problems; (ii) Achievement data, that contain information about student achievement and learning outcomes such as test scores, homework, class-based scores, and rubric-based portfolios; and (iii) Program data, that contain information about a school’s programs such as its academic programs, teacher training and experience, professional development, and extracurricular programming.
3.3 Domain-specific Knowledge Base
The next important step here is to imitate the knowledge of experts in education into an Educational Knowledge Base, which provides a rich structure of relevant entitles, semantics, and relationships among them. A Domain Knowledge (DK) is a taxonomy of concepts, sub-concepts, and their relationships. In section 4, we focus on a motivating scenario in education domain and present the construction of such Domain Knowledge.
3.4 Educational Knowledge Graph
As introduced in Section 2.3.5, a Knowledge Graph is a set of interconnected entity descriptions (real-world objects or concepts) that combines characteristics of other data management systems like graph databases. It is basically a knowledge base that has been made machine-readable using logically coherent, connected graphs that form an interconnected set of facts. RDF-based knowledge graphs 89, 193 are the best foundation for data integration and unification in this context. RDF or Resource Description Framework is made to model schemaless databases for the Semantic Web flexibly. Its structure is based on triples, each of which is made up of three entities that formalize semantic data in the form of the subject predicate object. A triple also referred to as statements’ or RDF statements’, signifies a relationship between subject and object predicate captures. As a result, a directed graph, with nodes representing subjects and objects, and edges representing predicates, can be used to describe a set of triples 36, 24. For example, the RDF statement Sara submitted homework’ can be defined in a triplestore and explains the relationship between the sentence’s subject, "Sara" and the object, "homework" The predicate "submitted" expresses the relationship between the subject and the object. As a graph database, Triplestore stores data as a network of objects connected by materialised connections. As a result, RDF triplestores are the best option for organizing heavily interrelated data.
In this study, based on the aforementioned facts, to extract insight from the contextualized data, we construct an RDF-based Graph to represent the knowledge hidden in the contextulaized data (i.e., the result of the proposed data curation pipeline). We call this graph the Educational Knowledge Graph (eKG). Let be an RDF graph where Ent is a set of entities and Rel is a set of relationship labels. be an Entity-Relationship (ER) attributed graph where V is a set of nodes and E is a set of ordered pairs called edges. An ER graph where V is a set of nodes, is an injective function, and is a set of labeled edges. with n number of entities is defined as , , and . The graph is viewed as a directed graph since it is always possible to interpret the direction of a relationship between two entities in the opposite direction.
The eKG graph is composed of entities and relationships among them. An entity is a real-world object that has unique existence and can be distinguished from other objects by physical (e.g., a teacher, a student) or conceptual (e.g., a course, a task) existence. They are defined by a set of attributes, e.g., name, age, gender. A relationship can be defined as a directed link between two or more entities that are defined by a predicate based on the attributes of the entities. We model the featured data as a graph of typed nodes and edges (relationships). The upper part of the Figure 9 depicts a small fragment of a knowledge graph showing possible relationships between objects in an educational setting (A comprehensive example of entitles and their relationships are presented in Section 4.1.). The entities and relationships create different type of triples. Few examples of the triples depicted in the graph are described as follows:
-
•
Assessment Person: States that an assessment (e.g., a homework) is graded by a person (e.g., a teacher).
-
•
Person Person: States that two person debated over a topic (e.g, a teacher and a student debated with each other).
-
•
Assessment Grade: States the grade of an assessment.
-
•
Person Assessment: States that a person (e.g., a student) submitted an assessment.
-
•
Person Society: States the a person (e.g., a student) is volunteered to join a society (e.g., a student society).
The Educational Knowledge Graph will make it easier to find, evaluate, and communicate essential patterns in educational data, allowing us to investigate the possibilities for better understanding and evaluating student behavior and performance.
3.5 Rule-based Insight Discovery
The final step is to derive relevant insights from the data in order to reach a consensus. Insight discovery is the process of extracting evidence from data to help analysts get a precise and in-depth insight into a specific analytic purpose. To this end, we perform user-guided insight discovery 31 to facilitate the insight discovery process and link extracted featured items to the entities in the domain-specific knowledge by using a simple rule language. Many of the flaws inherent in algorithmic approaches can be addressed using rule-based techniques as a declarative alternative. Algorithms are suitable for tackling particular tasks, but datasets are huge and changing all the time in reality. There are various advantages of using rule-based techniques over algorithmic designs such as being easier to produce, faster for correcting errors, and wider coverage of cases 31, 83. Generally, rules can be defined as follows:
| (1) |
Rules can become more complicated by using conjunction or dis-junction of additional rules.
| (2) |
Ultimately, an IF THEN rule can be used to assign a tag and link the extracted featured items to the domain knowledge entities.
| (3) |
Example: To identify a creativity pattern (e.g., strong memory) in a student two rules can be defined and connected to flag a tag as follows:
| (4) |
It should be noted that to understand essential features in the rules, we have interviewed education experts and also conducted surveys to mimic their knowledge. In future work, we plan to use Human-in-the-loop (crowdsourcing) approaches to create the rules and minimize the manipulation of the rules.
Querying RDF Graph. To enable rule-based querying of the RDF stores in the Educational Knowledge Graph, we intend to use the SPARQL query language for analysing and organizing the extracted-enriched data and linked features. SPARQL is a SQL-like edge-based query language for RDFs that will be used on top of a graph to search through the nodes and edges 78. A SPARQL query Q is defined as a tuple . It is built around an algebra expression AE that evaluates an RDF graph in a dataset DS. AE is made up of several graph patterns that can include solution modifiers, including LIMIT, ORDER BY, DISTINCT, PROJECTION. The outcomes of the matching process are handled using the operation result OR (e.g., CONSTRUCT, SELECT, ASK, FILTER, DESCRIBE). A basic SPARQL query has the following format:
 select ?variable1 ?variable2 ...
 where { pattern1. pattern2. ... }
Each pattern has three parts: subject, predicate, and object, which can all be variables or literals. The known literals are specified in the query, while the unknowns are left as variables. To answer a query we should locate all potential variable bindings that meet the given patterns. The ’@’ indication is used to identify attribute edges from the relationship edges between graph nodes. Example 5 presents a sample graph-level query. The triple pattern t is the most straightforward graph pattern specified in SPARQL. The subject, predicate, and object variables can be used in a triple pattern analogous to an RDF triple. Triple patterns, like triples, can be represented as directed graphs. Hence, a SPARQL query is frequently cited as a graph pattern matching problem 96.
| (5) |

where RDF-T denotes the set of RDF terms, I denotes a set of IRIs, and V denotes a set of variables. A basic graph pattern is defined as a set of triple patterns with . If all of the enclosed triple patterns match, it matches a subgraph. Value constraints (FILTER) and other graph patterns can be combined with basic graph patterns. Basic graph patterns and value constraints are evaluated in a non-ordered manner. This indicates that a structure consisting of two basic graph patterns BGP1 and BGP2 controlled by constraint C, could be converted into a single equivalent basic graph pattern followed by a constraint. Filtered basic graph patterns referred to as FBGP are basic graph patterns that have been modified by one or more constraints 139.
Example 1: Figure 10 shows a SPARQL query with one FBGP that search for the name of the students that submitted an assessment and received grades greater than B. The results are ordered by name with a maximum of five results. In this example, ?x plays as subject, dc:name as predicate, and ?name as object in a triple. The question mark comes before variables and literals come between quotations in the queries. FILTER eliminates solutions that do not cause an expression to evaluate to be true. And ORDER BY sorting the results. Finally, the results will be shown in XML or JSON format.
Example 2: Figure 11 shows a more complex SPARQL query using CONSTRUCT statement that returns a new RDF graph out of the different graph datasets. In this example, we are looking for a pattern of motivation as a student who is involved in participating in competitions and social communities.
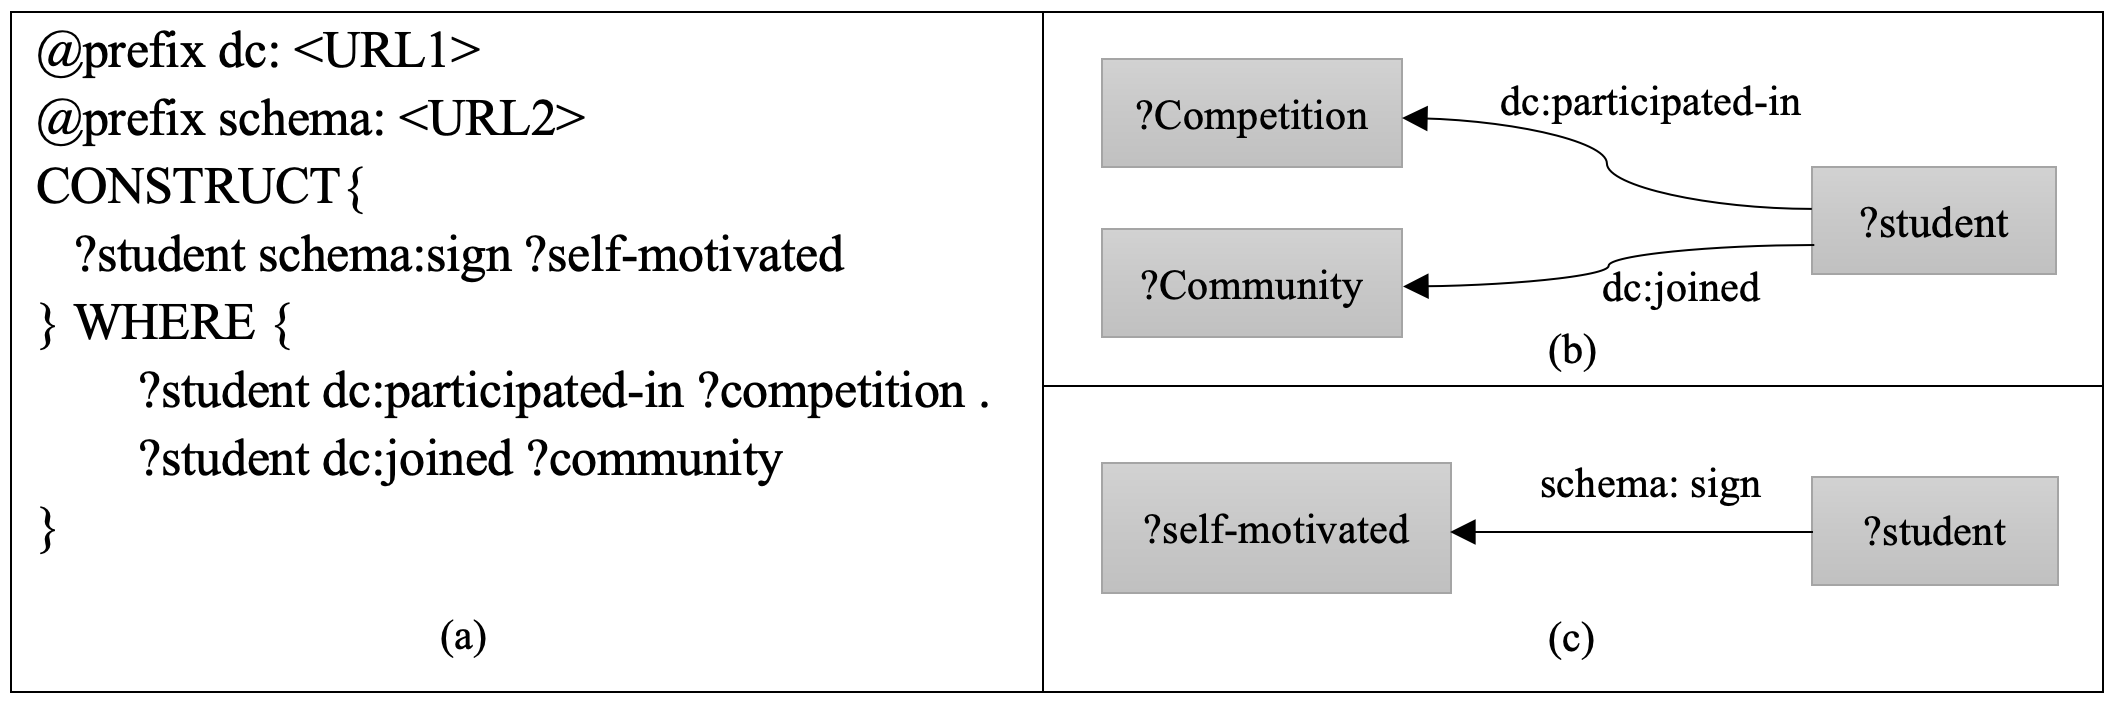
4 Experiments and Evaluation
In this section, we demonstrate and evaluate the outcomes of the proposed method (section 3) and examine how this method can be used to mine patterns of creativity in individuals. We first discuss a motivating educational scenario to clarify our approach toward mining creativity patterns. Next, we provide detailed information on the input data and experimental setting, present the experimental results, and finally explain how the results are evaluated.
4.1 Motivating Scenario
Creativity is seen as a fundamental quality that children today must possess in order to excel in school, and the career 9. From big-picture planning to rigorous organising, this 21st-century talent empowers students to express their inherent strengths. They learn about their creativity as well as how to use it in a healthy and effective manner.
As a motivating scenario, we focus on detecting creativity patterns in students to help teachers find creative students in the classroom. They can also find struggling students and plan for fostering creativity in those. For example, the plan would be to detect motivated, creative students and get help from them to lead groups of students and share their knowledge with others. This spreads creativity; when one student comes up with a unique and interesting approach to solve the problem, after sharing the solution with other students, it is possible that the next student will be encouraged to do something similar.
To facilitate discovering patterns of creativity in students, we propose these three important steps as follows:
Use Case 1: Imitating the Knowledge of Experts in Education. The initial phase in the pattern discovery is building a KB by imitating the knowledge of education experts who have the best knowledge in education and students’ skills. The KB consists of a set of concepts organized into an educational taxonomy, instances for each concept, and relationships among them. We explain the techniques we used to construct the KB domain knowledge.
We spent several months studying major articles and books in education and cognitive research in order to compile a list of the significant notions of creativity and their sub-concepts. We based our work on the publication series of Teresa Amabile 8, and Bloom’s taxonomies 46 in combination with other major works exploring the instances of creativity 87, 98, 167. We finally formalized them with the help of an expert in education and created a creativity taxonomy shown in Figure 12. The main concepts of the taxonomy are identified as follows:
-
•
General Cognitive Thinking Skills: The mental processes involved in gaining knowledge and comprehension. These cognitive thinking processes include idea-generating, remembering, using wide categories, and problem finding skills;
-
•
Domain-relevant Skills and Concepts: The amount to which a person’s product or reaction will outperform past responses in the domain is determined by his or her usage of creativity-relevant abilities. It includes expertise, knowledge, technical skills, intelligence, and talent in the particular domain;
-
•
Affective, Disposition, and Motivation: Affective and Disposition include the ways in which students deal with external and internal phenomena emotionally such as self-efficacy, independence, curiosity, and commitment. Furthermore, motivation encompasses both intrinsic and extrinsic factors such as passion, challenge, interest, enjoyment, and satisfaction.
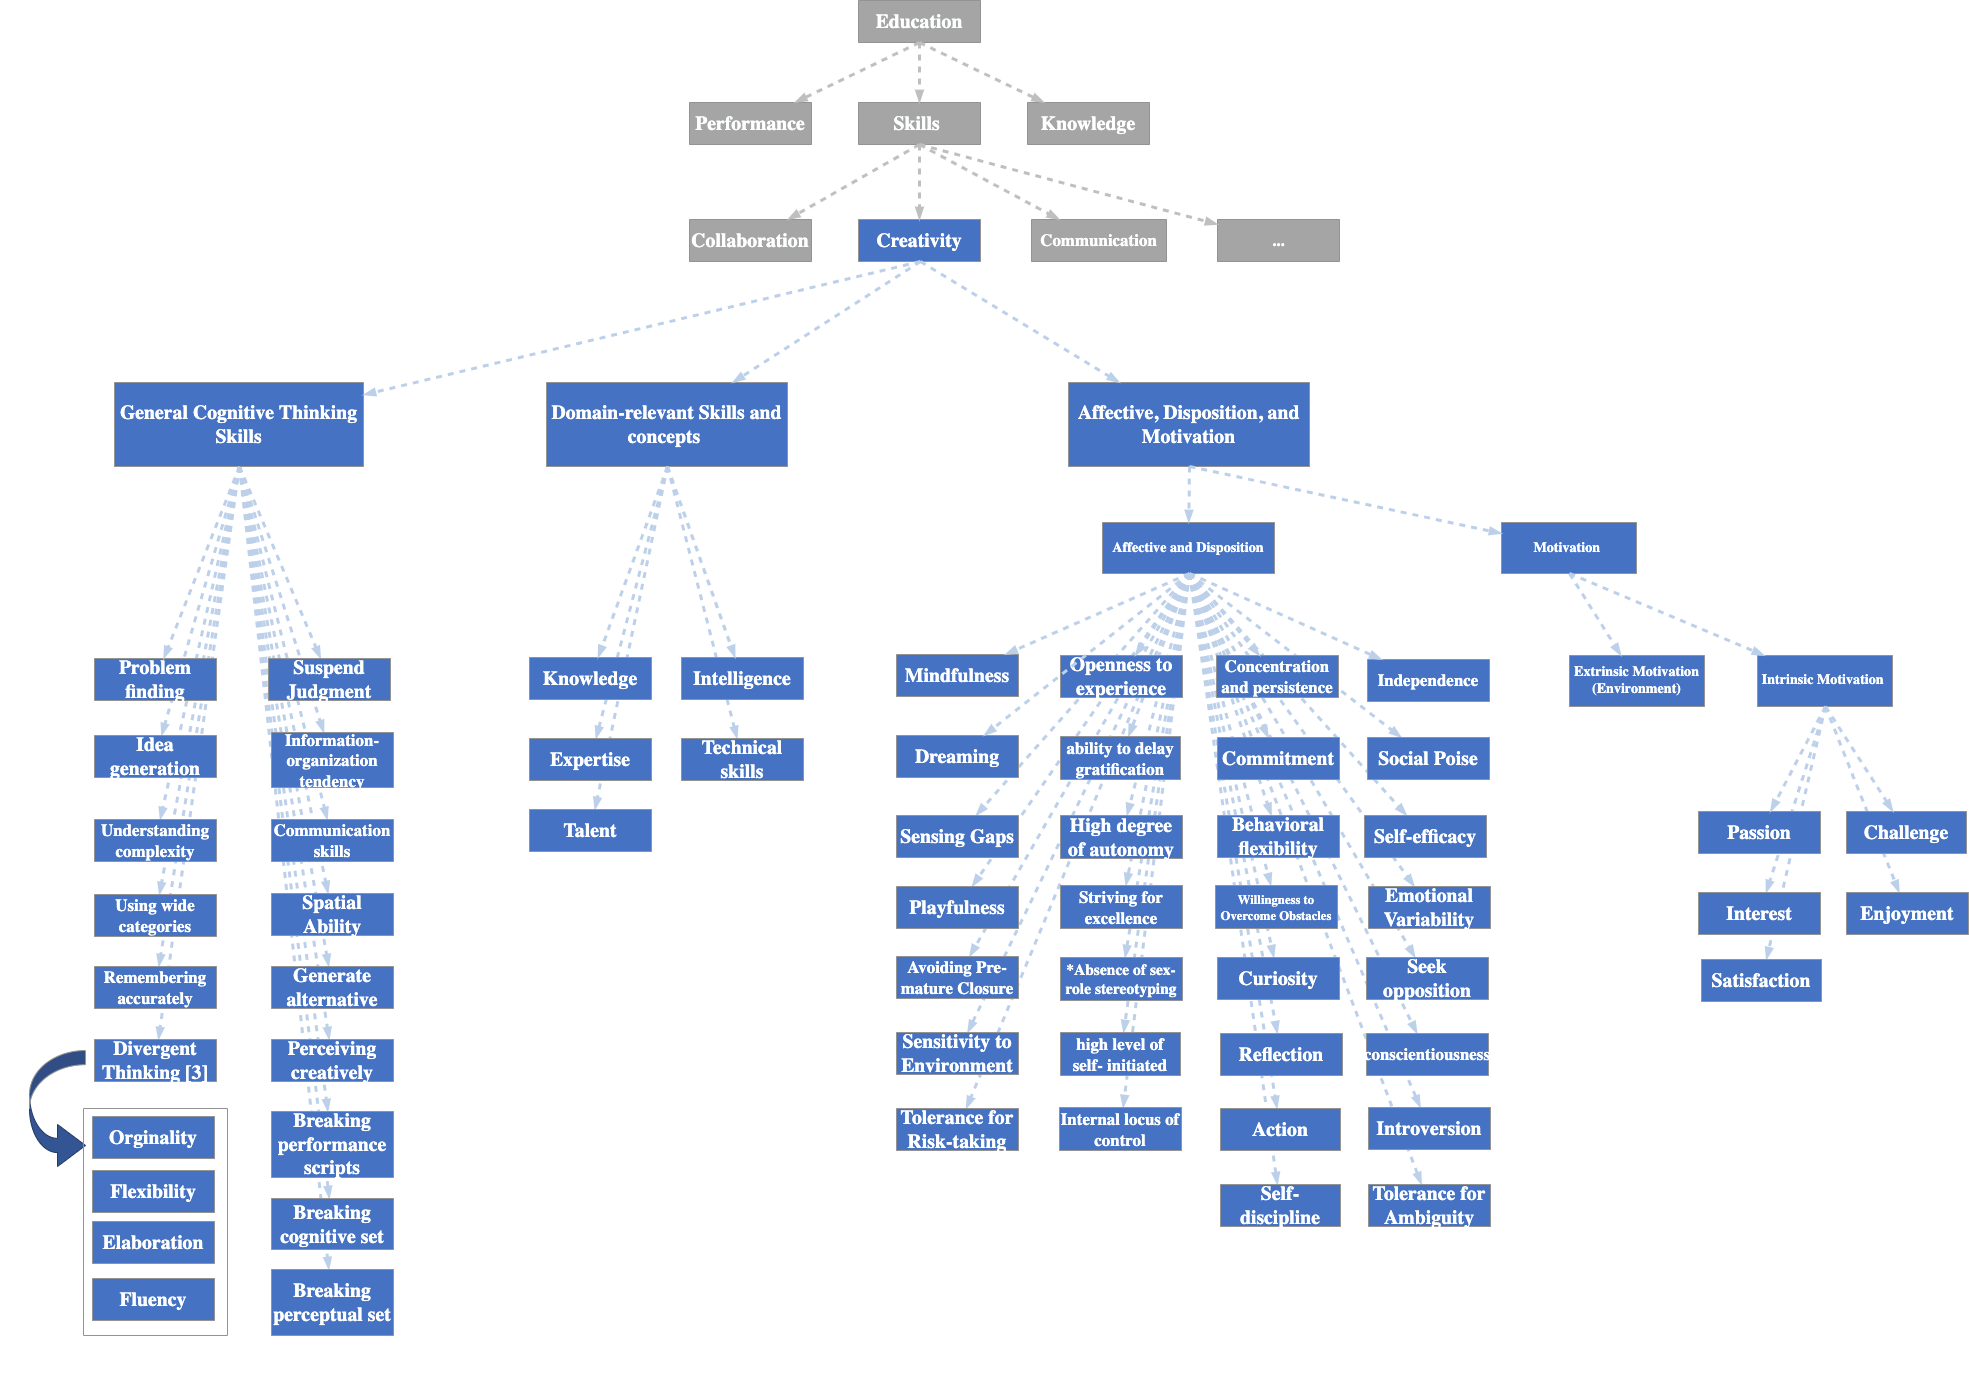
Use Case 2: Educational Knowledge Graph. As is explained in Section 3.4, an RDF graph will be built from the extracted features. The graph consists of two components, entity and relationship, which together create triples of instances. The entities are real-world objects with a distinctive physical (e.g., a teacher, a student) and conceptual (e.g., a course, a task) identity that distinguishes them from other objects. They are defined by a set of attributes, e.g., name, age, gender, nationality, and student ID. In our scenario, entities have name types as School, Person, Course, Training Course, Competition, Assessment, Question Block, Tool, Document, Task, Student Society, Time, Typography Error, Assessment Score, Word-count, Keyword, and Sentiment Analysis.
Relationships that are directed links between entities can be defined by a predicate based on the attributes of the entities. Different types of triples that are shown in Figure 13 are described as follows:

-
•
Course Person: States that a course (e.g., Math) is taught by a person (e.g., a teacher).
-
•
Person Assignment: States that a person (e.g., a student) submitted his/her assignment (e.g., a homework).
-
•
Person Person: States that two persons debated.
-
•
Person Person: States that a person (e.g., a student) volunteered to help another person.
-
•
Assessment QuestionBlock: States that an assessment (e.g., an online math test) contains a question block (e.g., fill-in question, multiple choice).
-
•
Assessment person: States that an assessment (e.g., an online Math test) is graded by a person (e.g., a teacher).
-
•
QuestionBlock Keyword: States that a question block of an assignment (e.g., a homework) contains desired keywords relevant to the context.
-
•
Person StudentCommunity: States that a person (e.g., a student) volunteered to join a student community (e.g., Math community of students)
-
•
QuestionBlock Time: States that a question block of an assessment is completed in a specific amount of time (e.g., 2 min or 120 sec).
-
•
Person TrainningCourse: States that a person (e.g., a student) volunteered to participate in a training course (e.g., MATLAB programming).
Use Case 3: Linking the Knowledge base to the Knowledge Graph We perform a user-guided insight discovery task to analyze the knowledge graph and identify creativity patterns related to each student node. In this step, we link the extracted features to the concepts of creativity in the eKB. To this end, we got help from educational experts and defined a set of rules for each pattern to guide the process of finding related subgraphs. For example, four extracted subgraphs and related rules are depicted in Table 3.
![[Uncaptioned image]](/html/2210.06118/assets/scenario_rules.png)
4.2 Dataset
We used a Kaggle public educational dataset 444https://www.kaggle.com/aljarah/xAPI-Edu-Data which is gathered via the experience API, a learner activity tracker tool (xAPI). The xAPI is a part of the Training and Learning Architecture (TLA) that allows tracking the learners’ progress and activities, such as reading, watching, and viewing learning materials.
The dataset contains information about 480 students with 16 features which are divided into three groups: (1) Academic background features such as educational level, section, and stage. (2) Behavioral features include the number of raised hands in class, involved discussions, and opening resources. (3) Demographic features such as nationality, gender, and age.
The dataset is made from 175 females and 305 males. The students are from various countries (e.g., USA, Morocco, Iran, and Venezuela) with different backgrounds and level of education. The data was gathered over the course of two academic semesters and contains a school attendance feature, in which students are divided into two groups based on the number of days they are absent (under seven days and above seven days). This dataset also includes features related to student’s behavior in the class (e.g., raising a hand, discussion, and visiting resources) in different courses (e.g., IT, Math, English) during a semester. Based on their overall mark, students are divided into three numerical ranges: Low-Level (marks between 0 to 69), Middle-Level (marks between 70 to 89), and High-Level (marks between 90 to 100).
4.3 Experimental Setting
The experiments are performed on two platforms: Google Colab and GraphDB graph database. We used Python 3.10.0, Pandas 1.3.4, Neworkx 2.6.2, and rdflib 6.0.1 for building the RDF Knowledge Graph. The .ttl (Turtle RDF graph) version of the graph model is then imported to the GraphDB environment to perform SPARQL queries.
4.4 Experimental Results
4.4.1 Preprocessing and Feature Selection
After importing the mentioned dataset, we performed some preprocessing tasks such as data cleaning, removing noisy inputs to avoid errors, and renaming the column names and instances to make the graph and queries more readable and clearer. Then we selected the features that are most relevant to our approach. Table 4 shows the first five rows of the selected features. Since the data is anonymized, the students are identified by numbers and indexes.
![[Uncaptioned image]](/html/2210.06118/assets/dataset.png)
4.4.2 Building the Knowledge Graph
The next step is to build an RDF graph out of the selected features. For clarity, we separated a subgraph from the completed graph and showed it in Figure 14. The figure depicts the triples related to three students with their relevant attributes (e.g., Gender, Place of birth, and Grade). The entities and relationships of the rdf subgraph are listed as follows (for Student1):
@prefix ns1: <http://www.example.org/> .
ns1:Student1 ns1:AnnouncementsView 2 ;
ns1:Student1 ns1:Discussion 20 ;
ns1:Student1 ns1:EnrolledIn ns1:IT ;
ns1:Student1 ns1:Score ns1:Middle-Level ;
ns1:Student1 ns1:Semester ns1:Semester1 ;
ns1:Student1 ns1:StudentAbsenceDays ns1:Under-7 ;
ns1:Student1 ns1:VisITedResources 16 ;
ns1:Student1 ns1:raisedhands 15 .
The completed graph then will be saved in .ttl format to be imported into a graph database. To query this huge graph, we make use of SPARQL queries to organize the data and extracted features.

4.4.3 Linking the Graph to the Knowledge Base
To link the constructed RDF graph to the Educational Knowledge Base (explained in Section 4.1), we define a set of rules to be implemented on top of the RDF graph repository. As a result, students that follow the rules will be shown in the result of the queries.
For instance, three rules are applied across the graph, including those about brainstorming, having a great memory, and a lack of motivation. Brainstorming is a concept related to the "Using wide range of categories" concept under "General cognitive thinking skill". A strong memory is also a concept related to the "Strong memory" concept under "General cognitive thinking skill". Furthermore, Motivation is the central concept of creativity that can be found in the creativity hierarchy under the name of "Intrinsic Motivation".
The related SPARQL queries with their node results are shown in Table 5. The queries are specifically looking for creative students enrolled in Math class in Middle School during either semester 1 or 2. As you can see, just four students showed the pattern of "Strong Memory" in their behaviors. This rule involves the students’ marks and the number of visiting resources. Students who gained high marks in their assessments and visited resources lower than 20 times (in comparison with others) during a semester are considered to have strong memory. It is specifically important in Math, Science, and IT courses.
Ten students showed the pattern of "brainstorming" in their behaviors. This rule involves the number of asking questions and discussions in groups. Also, two students did not show the pattern of "Motivation" in their behaviors. This rule involves attending classes and viewing announcements to participate in different events.
| SPARQL Query and Results |
| Strong Memory |
![[Uncaptioned image]](/html/2210.06118/assets/StrongMemory_math.png) |
| Brainstorming |
![[Uncaptioned image]](/html/2210.06118/assets/Brainstorming_math.png) |
| Not Motivated |
![[Uncaptioned image]](/html/2210.06118/assets/nMotivated_math.png) |
4.5 Evaluation
To evaluate the correctness of the model, we carried out a user study. In this study, we tried to validate the following hypotheses.
-
•
H1: The components of the KB are relevant to creativity.
-
•
H2: The designed rules for pattern mining are useful and relevant to creativity patterns.
-
•
H3: The query results are reasonable and show a successful link between the KB and educational data.
4.5.1 Experiment Setup
The experiment was done in a controlled environment to examine our approach. Participants were mostly chosen among academics and students doing research at Data Analytics Research Lab 555https://data-science-group.github.io/ with different backgrounds. Hence, from 10 participants some had strong knowledge in education and cognitive science, some had computing domain expertise, and others had both. We first instructed participants about the educational motivating scenario and demonstrated the functionality of the model through a presentation with the following order:
-
1.
Imitating the Knowledge of Educational Experts: We first underlined the importance of building the KB and how this helped us to link related information in the educational data and components of creativity in education.
-
2.
Data Contextualization: We explained how using existing data curation techniques helped us create enriched-contextualized data and knowledge.
-
3.
Linking Data and Finding Patterns: We presented a fragment of the data in a visualized graph-based format to be easily understood. We also demonstrated the results and implemented the defined rules for each creativity pattern.
4.5.2 Questionnaire
We prepared a questionnaire and shared it with the participants to examine the study’s hypotheses. The questionnaire consisted of four parts having multiple choice questions and participants were instructed to only choose one option based on their interpretation. With each of the participants, we asked them to rate the relevancy of the hypotheses using a Likert scale system which uses a five-point scale to allow the participant express their opinion (5: Strongly relevant, 4: Relevant, 3: Neutral, 2: Weakly relevant, 1: irrelevant).
The first part of the questionnaire was about participants’ demographic and background information and the rest was designed to evaluate H1, H2, and H3 hypotheses. The questionnaire was designed by Google Forms and a few snapshots can be found in Table 6 for evaluating the "using wide range of categories" creativity pattern. In this survey, we provided definitions and hints for the participants and guided them through the whole process.
![[Uncaptioned image]](/html/2210.06118/assets/Q_Part1.png) |
![[Uncaptioned image]](/html/2210.06118/assets/Q_Part2.png) |
| (a) | (b) |
![[Uncaptioned image]](/html/2210.06118/assets/Q_Part3.png) |
![[Uncaptioned image]](/html/2210.06118/assets/Q_Part4.png) |
| (c) | (d) |
4.5.3 Experiment Results
In this section, we aim to confirm or reject the hypotheses using the data acquired throughout the experiment.
-
•
Evaluation of H1: H1 assumes that the components of the KB are relevant to creativity. The Figure 15.a indicates that overall all the participants found that the linked concepts in the KB are relevant to creativity as a skill in education. Concepts such as Using a wide range of categories, Strong Memory, and Motivation have been investigated and rated by participants. All the participants found the concepts either strongly relevant or relevant to creativity.
-
•
Evaluation of H2: H2 states that the designed rules for pattern mining are useful and relevant to creativity patterns. The Figure 15.b indicates that overall all the participants except one found the rules relevant to Using a wide range of categories, Strong Memory, and Motivation concepts in the taxonomy. Except for one, all the participants found the rules either strongly relevant or relevant to creativity.
-
•
Evaluation of H3: H3 assumes that the query results are reasonable and show a successful link between the KB and educational data. The Figure 15.c indicates that overall all the participants except one found that the model was successful in detecting those creativity patterns in the students. Except for one, all the participants found the results either strongly relevant or relevant to creativity.
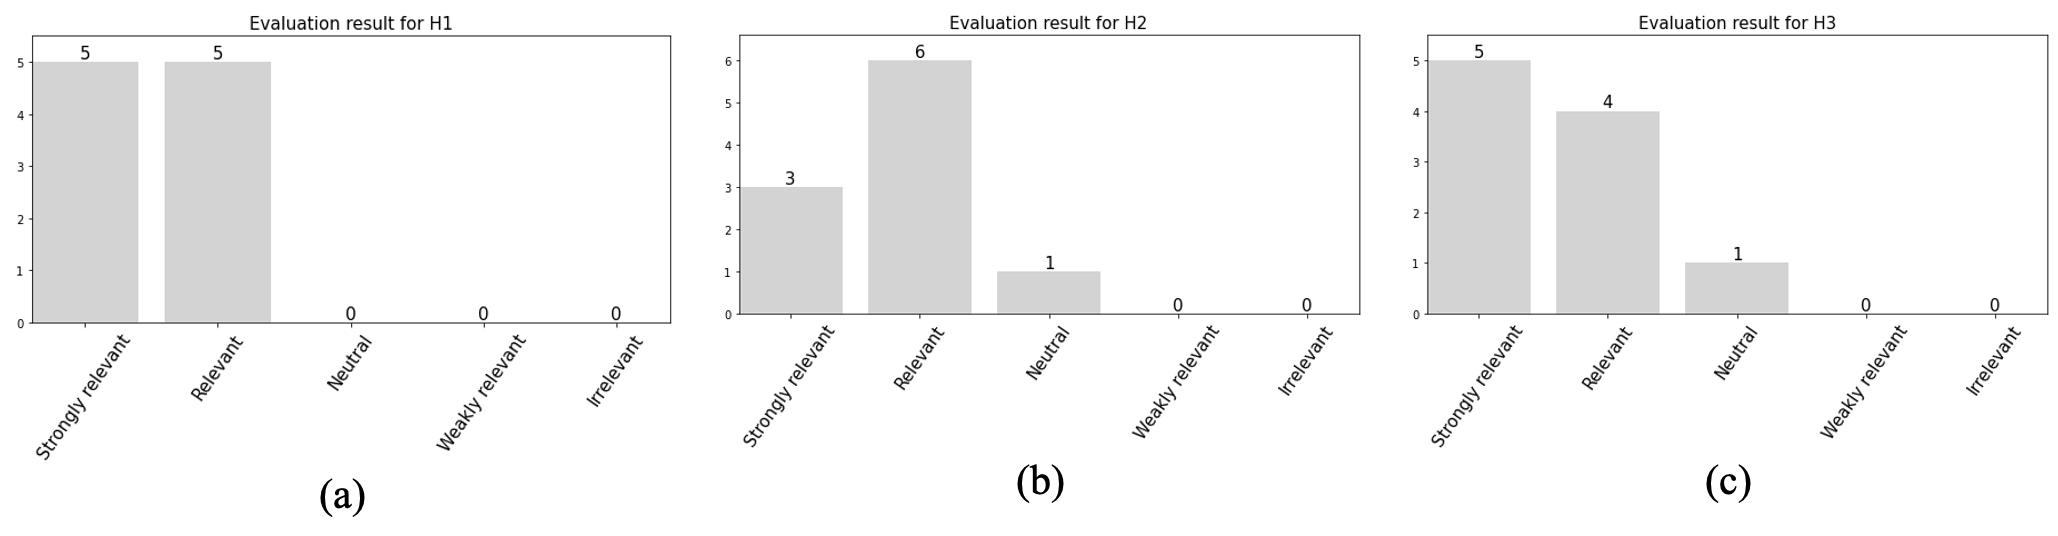
Discussion of Experiment Results. There are a few challenges towards validity, hence the findings of our study may not be regarded as definitive. They do, however, hint at a number of trends.
-
•
The finding of the user study supports the hypotheses H1, H2, and H3. However, H2, the rule-based pattern mining techniques require future improvement to gain higher score in the evaluation.
-
•
The assigned timeframe for training the most of participants seems to be adequate except for two with no background in computing and education. 8 out of 10 participants successfully completed all four sections of the questionnaire in less than half an hour. Those participants with other backgrounds struggled to understand the related concepts and technical concepts. Hence, the training should be improved for future study cases.
-
•
Based on our findings, mainly experts in education with knowledge, expertise, and interest in education and computing found our approach valid and confirmed the hypotheses.
Hence, based on the participants’ feedback and the lessons learned, some future improvements could be considered for the approach. The motivation of participants, time pressure and training, and definition of the rules are important indicators that have a significant impact on the final evaluation results.
-
•
Motivation of Participants: It was completely voluntary to participate in the evaluation process which leads to acceptable engagement. However, in order to improve the evaluation, it is suggested to incentivize with nominal financial reward. As a consequence, participants will most likely be intrigued and passionately engaged in the process.
-
•
Time Pressure and Training: The sessions for training and answering the questionnaire did not have a fixed time to minimize pressure. Still, some of the participants had a time conflict in their schedule and made them hurry towards the end. Although all managed to complete the tasks successfully, this may have impacted the way in which the tasks were completed and the questionnaire was answered. Hence, it is better to set a time limit for the tasks or separate the sessions to make it both flexible and more organized. This also can be helpful for those struggling participants with a limited proficiency in education and computing and let them learn the concepts better and participate actively.
-
•
Definition of the Rules: Our rule-based insight discovery approach, as the name implies, completely relies on the defined rules by educational experts. Thus, future improvements in terms of validity may include increasing the number of involved educational experts to define accurate rules. It is also beneficial to combine the rules with other existing rule mining techniques and compare the evaluation results with the outcomes of this study.
5 Conclusion and Future Work
This section highlights the paper’s contributions and discusses possible future research areas.
5.1 Conclusion
Creativity is becoming a priority in the educational sector as it promotes cognitive complexity. Creativity requires extensive knowledge as well as the ability to use it effectively. Being creative entails experimenting with new possibilities in the pursuit of desired outcomes utilizing an existing set of knowledge or skills in a specific subject or setting. It takes time to develop and the process is more effective if students have certain knowledge and skills. The education system must provide both policy and educational methods to support students in gaining the required knowledge in their field of study. Teachers here can support creativity in their students by considering the ways that help students use their knowledge and come up with creative products. In the creative process, students require ongoing guidance and training. But before providing personalized training, it is needed to first detect creativity patterns in students.
In this paper, a data-driven technique is provided to relate students’ behavior to creative thinking patterns and assist instructors to understand them from students’ activities and assessment tasks. We concentrated on understanding the big educational data, used existing data curation techniques to turn the raw educational data into contextualized data and knowledge, built a domain-specific KB by leveraging the knowledge of education experts, and linked the contextualized data to the KB using a rule-based technique. As a result, we facilitated mining creative thinking patterns from contextualized data and knowledge and made it possible for educators to find students with creative thinking patterns. We also evaluated our approach through a user study, relying on the knowledge of education experts.
5.2 Future Research Areas
Regarding the information provided in this study, several strategies might be used to enhance the performance of the proposed method. This section lays out a plan to identify how these strategies may impact the system’s performance in the future, as well as how they could be applied to the application of pattern mining within the education sector.
5.2.1 Timely Analysis of Student Patterns
Since features and attributes related to each student may change over time, it is beneficial to design a framework to enable educators monitor their students’ performance. Age, level, grade, attendance, asking questions, discussion, score, and volunteering are examples of key attributes and features that will change over time, resulting in changes in previously observed patterns. This model may be expanded to include a dashboard considering all the important features over the time. By monitoring the features some alerts may be triggered and notify the educator to take action. Using this visualized system as a student profile, it will be possible for the educator to track their students’ performance and behavior and plan for their education.
5.2.2 Associate Rule Mining Technique
Associate rule mining technique could be used to discover the relationship among educational features. It will uncover common patterns, relationships, or correlations among groupings of components or items in educational datasets. As future work, we intend to implement an associate rule mining technique to find meaningful relationships among important features in the process of identifying creativity patterns. In this way, we automate the process of creating rules and minimize the manual efforts needed to do so.
5.2.3 Creativity Patterns
In this study, we only investigated three patterns of creativity such as using a wide range of categories, strong memory, and motivation. We aim to continue this effort in the future and complete the identification of other key patterns. Self-esteem, social poise, and suspend judgment are other key patterns of creativity that all students should possess in education and are necessary to be investigated besides the current ones. Hence, to complete the study, we intend to expand the model and improve the data integration to finally be able to evaluate the students better.
Acknowledgements
- I acknowledge the AI-enabled Processes (AIP666https://aip-research-center.github.io/) Research Centre for funding My Master by Research project.
References
- [1] Australian bureau of statistics (abs), australian standard classification of education (asced), 2001.
- [2] The australian curriculum, general capabilities.
- [3] F. Ahmad, N. H. Ismail, and A. A. Aziz. The prediction of students academic performance using classification data mining techniques. Applied Mathematical Sciences, 9(129):6415–6426, 2015.
- [4] N. Ahmad. Users trust in open learner models. PhD thesis, University of Birmingham, 2014.
- [5] G. Alemu and B. Stevens. An emergent theory of digital library metadata: Enrich then filter. Chandos Publishing, 2015.
- [6] M. Allahbakhsh, A. Ignjatovic, B. Benatallah, S.-M.-R. Beheshti, E. Bertino, and N. Foo. Collusion detection in online rating systems. In Asia-Pacific Web Conference, pages 196–207. Springer, 2013.
- [7] M. Allahbakhsh, A. Ignjatovic, B. Benatallah, E. Bertino, N. Foo, et al. Reputation management in crowdsourcing systems. In 8th International conference on collaborative computing: networking, applications and worksharing (CollaborateCom), pages 664–671. IEEE, 2012.
- [8] T. Amabile. Componential theory of creativity. Harvard Business School Boston, MA, 2011.
- [9] T. M. Amabile. How to kill creativity, volume 87. Harvard Business School Publishing Boston, MA, 1998.
- [10] T. M. Amabile, M. A. Collins, R. Conti, E. Phillips, M. Picariello, J. Ruscio, and D. Whitney. Creativity in context: Update to the social psychology of creativity. Routledge, 2018.
- [11] T. M. Amabile and J. Pillemer. Perspectives on the social psychology of creativity. The Journal of Creative Behavior, 46(1):3–15, 2012.
- [12] F. Amouzgar, A. Beheshti, S. Ghodratnama, B. Benatallah, J. Yang, and Q. Z. Sheng. isheets: A spreadsheet-based machine learning development platform for data-driven process analytics. In International Conference on Service-Oriented Computing, pages 453–457. Springer, 2018.
- [13] J. Baer and S. S. McKool. The gold standard for assessing creativity. International Journal of Quality Assurance in Engineering and Technology Education (IJQAETE), 3(1):81–93, 2014.
- [14] M. I. Baig, L. Shuib, and E. Yadegaridehkordi. Big data in education: A state of the art, limitations, and future research directions. International Journal of Educational Technology in Higher Education, 17(1), 2020.
- [15] R. Baker. Data mining. In P. Peterson, E. Baker, and B. McGaw, editors, International Encyclopedia of Education (Third Edition), pages 112–118. Elsevier, Oxford, third edition edition, 2010.
- [16] R. Baker et al. Data mining for education. International encyclopedia of education, 7(3):112–118, 2010.
- [17] R. S. Baker and P. S. Inventado. Educational data mining and learning analytics. In Learning analytics, pages 61–75. Springer, 2014.
- [18] B. Bakhshinategh, O. R. Zaiane, S. ElAtia, and D. Ipperciel. Educational data mining applications and tasks: A survey of the last 10 years. Education and Information Technologies, 23(1):537–553, 2018.
- [19] J. Balla and P. Boyle. Assessment of student performance: a framework for improving practice. Assessment & Evaluation in Higher Education, 19(1):17–28, 1994.
- [20] C. Ballard, D. Herreman, D. Schau, R. Bell, E. Kim, and A. Valencic. Data modeling techniques for data warehousing. IBM Corporation International Technical Support Organization San Jose, 1998.
- [21] B. K. Baradwaj and S. Pal. Mining educational data to analyze students’ performance. arXiv preprint arXiv:1201.3417, 2012.
- [22] F. Barron and D. M. Harrington. Creativity, intelligence, and personality. Annual review of psychology, 32(1):439–476, 1981.
- [23] M. C. Barukh, S. Zamanirad, M. Baez, A. Beheshti, B. Benatallah, F. Casati, L. Yao, Q. Z. Sheng, and F. Schiliro. Cognitive augmentation in processes. In Next-Gen Digital Services. A Retrospective and Roadmap for Service Computing of the Future, pages 123–137. Springer, 2021.
- [24] O. Batarfi, R. E. Shawi, A. G. Fayoumi, R. Nouri, S.-M.-R. Beheshti, A. Barnawi, and S. Sakr. Large scale graph processing systems: survey and an experimental evaluation. Cluster Computing, 18(3):1189–1213, 2015.
- [25] C. R. Beal, L. Qu, and H. Lee. Classifying learner engagement through integration of multiple data sources. In AAAI, pages 151–156, 2006.
- [26] R. E. Beaty and D. R. Johnson. Automating creativity assessment with semdis: An open platform for computing semantic distance. Behavior research methods, 53(2):757–780, 2021.
- [27] A. Beheshti. Knowledge base 4.0: Using crowdsourcing services for mimicking the knowledge of domain experts. In 2022 IEEE International Conference on Web Services (ICWS), pages 425–427. IEEE, 2022.
- [28] A. Beheshti, B. Benatallah, R. Nouri, V. M. Chhieng, H. Xiong, and X. Zhao. Coredb: a data lake service. In Proceedings of the 2017 ACM on Conference on Information and Knowledge Management, pages 2451–2454, 2017.
- [29] A. Beheshti, B. Benatallah, R. Nouri, and A. Tabebordbar. Corekg: a knowledge lake service. Proceedings of the VLDB Endowment, 11(12):1942–1945, 2018.
- [30] A. Beheshti, B. Benatallah, Q. Z. Sheng, and F. Schiliro. Intelligent knowledge lakes: the age of artificial intelligence and big data. In International conference on web information systems engineering, pages 24–34. Springer, 2020.
- [31] A. Beheshti, B. Benatallah, A. Tabebordbar, H. R. Motahari-Nezhad, M. C. Barukh, and R. Nouri. Datasynapse: A social data curation foundry. Distributed and Parallel Databases, 37(3):351–384, 2019.
- [32] A. Beheshti, S. Ghodratnama, M. Elahi, and H. Farhood. Social Data Analytics. CRC Press, 2022.
- [33] A. Beheshti, V. Moraveji-Hashemi, S. Yakhchi, H. R. Motahari-Nezhad, S. M. Ghafari, and J. Yang. personality2vec: Enabling the analysis of behavioral disorders in social networks. In Proceedings of the 13th international conference on web search and data mining, pages 825–828, 2020.
- [34] A. Beheshti, A. Tabebordbar, and B. Benatallah. istory: Intelligent storytelling with social data. In Companion Proceedings of the Web Conference 2020, pages 253–256, 2020.
- [35] A. Beheshti, S. Yakhchi, S. Mousaeirad, S. M. Ghafari, S. R. Goluguri, and M. A. Edrisi. Towards cognitive recommender systems. Algorithms, 13(8):176, 2020.
- [36] S. Beheshti, B. Benatallah, H. R. M. Nezhad, and S. Sakr. A query language for analyzing business processes execution. In Business Process Management - 9th International Conference, BPM 2011, Clermont-Ferrand, France, August 30 - September 2, 2011. Proceedings, volume 6896 of Lecture Notes in Computer Science, pages 281–297. Springer, 2011.
- [37] S.-M.-R. Beheshti, B. Benatallah, and H. R. Motahari-Nezhad. Scalable graph-based olap analytics over process execution data. Distributed and Parallel Databases, 34(3):379–423, 2016.
- [38] S.-M.-R. Beheshti, B. Benatallah, H. R. Motahari-Nezhad, and M. Allahbakhsh. A framework and a language for on-line analytical processing on graphs. In International Conference on Web Information Systems Engineering, pages 213–227. Springer, 2012.
- [39] S.-M.-R. Beheshti, B. Benatallah, S. Sakr, D. Grigori, H. R. Motahari-Nezhad, M. C. Barukh, A. Gater, S. H. Ryu, et al. Process analytics: concepts and techniques for querying and analyzing process data. Springer, 2016.
- [40] S.-M.-R. Beheshti, B. Benatallah, S. Venugopal, S. H. Ryu, H. R. Motahari-Nezhad, and W. Wang. A systematic review and comparative analysis of cross-document coreference resolution methods and tools. Computing, 99(4):313–349, 2017.
- [41] S.-M.-R. Beheshti, H. R. Motahari-Nezhad, and B. Benatallah. Temporal provenance model (tpm): model and query language. arXiv preprint arXiv:1211.5009, 2012.
- [42] P. Berkhin. A Survey of Clustering Data Mining Techniques, pages 25–71. Springer Berlin Heidelberg, Berlin, Heidelberg, 2006.
- [43] S. P. Besemer. Creative product analysis matrix: testing the model structure and a comparison among products–three novel chairs. Creativity Research Journal, 11(4):333–346, 1998.
- [44] M. Bienkowski, M. Feng, and B. Means. Enhancing teaching and learning through educational data mining and learning analytics: An issue brief. Office of Educational Technology, US Department of Education, 2012.
- [45] B. S. Bloom. Taxonomy of Educational Objectives: Affective domain, by DR Krathwohl, BS Bloom [and] BB Masia, volume 2. David McKay, 1964.
- [46] B. S. Bloom et al. Taxonomy of educational objectives. vol. 1: Cognitive domain. New York: McKay, 20(24):1, 1956.
- [47] M. Bogdanović, A. Stanimirović, N. Davidović, and L. Stoimenov. The development and usage of a relational database design tool for educational purposes. In Informing Science & IT Education Conference (InSITE’08), pages 251–258, 2008.
- [48] J. A. Bondy, S. Axler, and K. Ribet. Graduate Texts in Mathematics, Volume 244. Springer London, 2008.
- [49] A. Bordes, N. Usunier, A. Garcia-Duran, J. Weston, and O. Yakhnenko. Translating embeddings for modeling multi-relational data. Advances in neural information processing systems, 26, 2013.
- [50] R. Brown. Knowledge, education, and cultural change: papers in the sociology of education, volume 3. Routledge, 2018.
- [51] P. Brusilovsky, S. Sosnovsky, and O. Shcherbinina. User modeling in a distributed e-learning architecture. In International conference on user modeling, pages 387–391. Springer, 2005.
- [52] P. S. Buffum, A. G. Martinez-Arocho, M. H. Frankosky, F. J. Rodriguez, E. N. Wiebe, and K. E. Boyer. Cs principles goes to middle school: learning how to teach" big data". In Proceedings of the 45th ACM technical symposium on Computer science education, pages 151–156, 2014.
- [53] S. Bull and J. Kay. Student models that invite the learner in: The smili:() open learner modelling framework. International Journal of Artificial Intelligence in Education, 17(2):89–120, 2007.
- [54] S. Bull and J. Kay. Metacognition and open learner models. In The 3rd workshop on meta-cognition and self-regulated learning in educational technologies, at ITS2008, pages 7–20, 2008.
- [55] S. Bull and J. Kay. Open learner models. In Advances in intelligent tutoring systems, pages 301–322. Springer, 2010.
- [56] S. Bull, A. T. McEVOY, and E. Reid. Learner models to promote reflection in combined desktop pc/mobile intelligent learning environments. In Bull, S., Brna, P. And Dimitrova, V.(Eds.), Proceedings of the Learner Modelling for Reflection Workshop, AIED. Citeseer, 2003.
- [57] S. Bull and M. McKay. An open learner model for children and teachers: inspecting knowledge level of individuals and peers. In International Conference on Intelligent Tutoring Systems, pages 646–655. Springer, 2004.
- [58] S. Bull and H. Pain. " Did I Say What I Think I Said, and Do You Agree with Me?": Inspecting and Questioning the Student Model. University of Edinburgh, Department of Artificial Intelligence, 1995.
- [59] M. Cantabella, R. Martínez-España, B. Ayuso, J. A. Yáñez, and A. Muñoz. Analysis of student behavior in learning management systems through a big data framework. Future Generation Computer Systems, 90:262–272, 2019.
- [60] K.-W. Chang, W.-t. Yih, B. Yang, and C. Meek. Typed tensor decomposition of knowledge bases for relation extraction. In Proceedings of the 2014 Conference on Empirical Methods in Natural Language Processing (EMNLP), pages 1568–1579, 2014.
- [61] S. S. Chaurasia, D. Kodwani, H. Lachhwani, and M. A. Ketkar. Big data academic and learning analytics: Connecting the dots for academic excellence in higher education. International Journal of Educational Management, 2018.
- [62] A. Clayphan, R. Martinez-Maldonado, and J. Kay. Open learner models to support reflection on brainstorming at interactive tabletops. In International Conference on Artificial Intelligence in Education, pages 683–686. Springer, 2013.
- [63] A. Clayphan, R. Martinez-Maldonado, M. Tomitsch, S. Atkinson, and J. Kay. An in-the-wild study of learning to brainstorm: comparing cards, tabletops and wall displays in the classroom. Interacting with Computers, 28(6):788–810, 2016.
- [64] A. T. Corbett and J. R. Anderson. Knowledge tracing: Modeling the acquisition of procedural knowledge. User modeling and user-adapted interaction, 4(4):253–278, 1994.
- [65] M. Czarkowski, J. Kay, and S. Potts. Web framework for scrutable adaptation. In Workshop on Learner Modelling for Reflection. AI in Education, pages 11–18, 2005.
- [66] A. Czerepicki. Application of graph databases for transport purposes. Bulletin of the Polish Academy of Sciences. Technical Sciences, 64(3), 2016.
- [67] R. S. d Baker, A. T. Corbett, and V. Aleven. More accurate student modeling through contextual estimation of slip and guess probabilities in bayesian knowledge tracing. In International conference on intelligent tutoring systems, pages 406–415. Springer, 2008.
- [68] W. F. de Carvalho and L. E. Zarate. Causality relationship among attributes applied in an educational data set. In Proceedings of the 34th ACM/SIGAPP symposium on applied computing, pages 1271–1277, 2019.
- [69] Y. Demchenko, P. Grosso, C. De Laat, and P. Membrey. Addressing big data issues in scientific data infrastructure. In 2013 International conference on collaboration technologies and systems (CTS), pages 48–55. IEEE, 2013.
- [70] D. Deng, C. K. Leung, B. H. Wodi, J. Yu, H. Zhang, and A. Cuzzocrea. An innovative framework for supporting cognitive-based big data analytics for frequent pattern mining. In 2018 IEEE International Conference on Cognitive Computing (ICCC), pages 49–56. IEEE, 2018.
- [71] N. Diana, M. Eagle, J. Stamper, S. Grover, M. Bienkowski, and S. Basu. An instructor dashboard for real-time analytics in interactive programming assignments. In Proceedings of the Seventh International Learning Analytics & Knowledge Conference, pages 272–279, 2017.
- [72] V. Dimitrova. Style-olm: Interactive open learner modelling. International Journal of Artificial Intelligence in Education, 13(1):35–78, 2003.
- [73] B. Dinter, T. Jaekel, C. Kollwitz, and H. Wache. Teaching big data management–an active learning approach for higher education. North America: Paper presented at the proceedings of the pre-ICIS, pages 1–17, 2017.
- [74] E. N. Ekwonwune, C. C. Oparah, et al. A multimedia based virtual learning system: A panacea for nigerian tertiary institutions. Circuits and Systems, 11(01):1, 2020.
- [75] O. El Aissaoui, Y. E. A. El Madani, L. Oughdir, A. Dakkak, and Y. El Allioui. A multiple linear regression-based approach to predict student performance. In International Conference on Advanced Intelligent Systems for Sustainable Development, pages 9–23. Springer, 2019.
- [76] L. Ertoz, E. Eilertson, A. Lazarevic, P. Tan, P. Dokas, J. Srivastava, and V. Kumar. Detection and summarization of novel network attacks using data mining. Minnesota INtrusion Detection System (MINDS) Technical Report, 2003.
- [77] P. Esling and C. Agon. Time-series data mining. ACM Computing Surveys (CSUR), 45(1):1–34, 2012.
- [78] M. Farouk and M. Ishizuka. A rule-based sparql endpoint wrapper. In WEBIST, pages 729–732, 2012.
- [79] K. Franze and F. Wehner. A document model for generating adaptable courseware using background data. In WebNet World Conference on the WWW and Internet, pages 1266–1267. Association for the Advancement of Computing in Education (AACE), 1999.
- [80] A. Freitas and E. Curry. Big Data Curation, pages 87–118. Springer International Publishing, Cham, 2016.
- [81] T. Frisendal. Graph data modeling for NoSQL and SQL: Visualize structure and meaning. Technics Publications, 2016.
- [82] R. M. Gagne and L. J. Briggs. Principles of instructional design. Holt, Rinehart & Winston, 1974.
- [83] P. S. GC, C. Sun, H. Zhang, F. Yang, N. Rampalli, S. Prasad, E. Arcaute, G. Krishnan, R. Deep, V. Raghavendra, et al. Why big data industrial systems need rules and what we can do about it. In Proceedings of the 2015 ACM SIGMOD International Conference on Management of Data, pages 265–276, 2015.
- [84] S. Ghodratnama, A. Beheshti, M. Zakershahrak, and F. Sobhanmanesh. Intelligent narrative summaries: From indicative to informative summarization. Big Data Research, 26:100257, 2021.
- [85] J. M. Gomez-Perez, J. Z. Pan, G. Vetere, and H. Wu. Enterprise knowledge graph: An introduction. In Exploiting linked data and knowledge graphs in large organisations, pages 1–14. Springer, 2017.
- [86] S. Goyal. E-learning: Future of education. Learning, 6(2):239–242, 2012.
- [87] J. P. Guilford. Characteristics of creativity. American Psychologist, 5(9):444–454, 1973.
- [88] S. Gupta. A regression modeling technique on data mining. International Journal of Computer Applications, 116(9), 2015.
- [89] M. Hammoud, D. A. Rabbou, R. Nouri, S.-M.-R. Beheshti, and S. Sakr. Dream: distributed rdf engine with adaptive query planner and minimal communication. Proceedings of the VLDB Endowment, 8(6):654–665, 2015.
- [90] A. Hamzah. Learners perception on open learner model. Int. J. Model. Optim, 8(4):250–253, 2018.
- [91] J. Han, J. Pei, and M. Kamber. Data mining: concepts and techniques. Elsevier, 2011.
- [92] B. A. Hennessey and T. M. Amabile. Reality, intrinsic motivation, and creativity. 1998.
- [93] D. Henriksen, P. Mishra, and R. Mehta. Novel, effective, whole: Toward a new framework for evaluations of creative products. Journal of Technology and Teacher Education, 23(3):455–478, 2015.
- [94] A. Hershkovitz, R. S. J. de Baker, J. Gobert, M. Wixon, and M. S. Pedro. Discovery with models: A case study on carelessness in computer-based science inquiry. American Behavioral Scientist, 57(10):1480–1499, 2013.
- [95] D. Hooshyar, K. Kori, M. Pedaste, and E. Bardone. The potential of open learner models to promote active thinking by enhancing self-regulated learning in online higher education learning environments. British Journal of Educational Technology, 50(5):2365–2386, 2019.
- [96] J. Huang, D. J. Abadi, and K. Ren. Scalable sparql querying of large rdf graphs. Proceedings of the VLDB Endowment, 4(11):1123–1134, 2011.
- [97] A. Jalayer, M. Kahani, A. Pourmasoumi, and A. Beheshti. Ham-net: Predictive business process monitoring with a hierarchical attention mechanism. Knowledge-Based Systems, 236:107722, 2022.
- [98] K. James and C. Asmus. Personality, cognitive skills, and creativity in different life domains. Creativity Research Journal, 13(2):149–159, 2001.
- [99] M. E. Jarchow, P. Formisano, S. Nordyke, and M. Sayre. Measuring longitudinal student performance on student learning outcomes in sustainability education. International Journal of Sustainability in Higher Education, 2018.
- [100] D. H. Jonassen, M. Tessmer, and W. H. Hannum. Task analysis methods for instructional design. Routledge, 1998.
- [101] L. Juhaňák, J. Zounek, and L. Rohlíková. Using process mining to analyze students’ quiz-taking behavior patterns in a learning management system. Computers in Human Behavior, 92:496–506, 2019.
- [102] A. Kausar, I. Razzak, M. I. Shapiai, and A. Beheshti. 3d shallow deep neural network for fast and precise segmentation of left atrium. Multimedia Systems, pages 1–11, 2021.
- [103] A. Kerly and S. Bull. Childrens interactions with inspectable and negotiated learner models. In International Conference on Intelligent Tutoring Systems, pages 132–141. Springer, 2008.
- [104] A. Kerly, R. Ellis, and S. Bull. Calmsystem: a conversational agent for learner modelling. In International conference on innovative techniques and applications of artificial intelligence, pages 89–102. Springer, 2007.
- [105] S. Khalid, T. Khalil, and S. Nasreen. A survey of feature selection and feature extraction techniques in machine learning. In 2014 science and information conference, pages 372–378. IEEE, 2014.
- [106] S. Khan and M. Shaheen. From data mining to wisdom mining. Journal of Information Science, page 016555152110308, 07 2021.
- [107] A. Krüger, A. Merceron, and B. Wolf. A data model to ease analysis and mining of educational data. In Educational Data Mining 2010, 2010.
- [108] J. A. Larusson and B. White. Learning analytics: From research to practice, volume 13. Springer, 2014.
- [109] S. J. Lee and S. Bull. An open learner model to help parents help their children. Technology Instruction Cognition and Learning, 6(1):29, 2008.
- [110] S.-H. Liao, P.-H. Chu, and P.-Y. Hsiao. Data mining techniques and applications–a decade review from 2000 to 2011. Expert systems with applications, 39(12):11303–11311, 2012.
- [111] L. C. Liñán and Á. A. J. Pérez. Educational data mining and learning analytics: differences, similarities, and time evolution. International Journal of Educational Technology in Higher Education, 12(3):98–112, 2015.
- [112] B. Lobb and A. C. Doxey. Novel function discovery through sequence and structural data mining. Current opinion in structural biology, 38:53–61, 2016.
- [113] S. Loukusa, L. Mäkinen, S. Kuusikko-Gauffin, H. Ebeling, and E. Leinonen. Assessing social-pragmatic inferencing skills in children with autism spectrum disorder. Journal of communication disorders, 73:91–105, 2018.
- [114] Y.-L. Lu, Y.-C. Wu, W.-M. Chen, Y.-C. Lien, and C.-J. Lien. Using data mining to investigate cognitive processes by a creativity test-a preliminary study. In 9th IEEE International Conference on Cognitive Informatics (ICCI’10), pages 454–457. IEEE, 2010.
- [115] A. Mabbott and S. Bull. Student preferences for editing, persuading, and negotiating the open learner model. In International conference on intelligent tutoring systems, pages 481–490. Springer, 2006.
- [116] A. J. Martin. Examining a multidimensional model of student motivation and engagement using a construct validation approach. British Journal of Educational Psychology, 77(2):413–440, 2007.
- [117] F. Martínez-Abad, A. Gamazo, and M. J. Rodríguez-Conde. Big data in education: Detection of ict factors associated with school effectiveness with data mining techniques. In Proceedings of the Sixth International Conference on Technological Ecosystems for Enhancing Multiculturality, TEEM’18, page 145–150, New York, NY, USA, 2018. Association for Computing Machinery.
- [118] R. T. Mason. Nosql databases and data modeling techniques for a document-oriented nosql database. In Proceedings of Informing Science & IT Education Conference (InSITE), volume 3, pages 259–268, 2015.
- [119] M. D. Merrill. Component display theory. Instructional-design theories and models: An overview of their current status, 1:282–333, 1983.
- [120] T. Mikolov, K. Chen, G. Corrado, and J. Dean. Efficient estimation of word representations in vector space. arXiv preprint arXiv:1301.3781, 2013.
- [121] A. L. Miller. A self-report measure of cognitive processes associated with creativity. Creativity Research Journal, 26(2):203–218, 2014.
- [122] R. J. Miller. Big data curation. In COMAD, page 4, 2014.
- [123] M. E. Modell. Data analysis, data modeling, and classification. McGraw-hill, 1992.
- [124] M. A. Mohamed, O. G. Altrafi, and M. O. Ismail. Relational vs. nosql databases: A survey. International Journal of Computer and Information Technology, 3(03):598–601, 2014.
- [125] K. Muldner and W. Burleson. Utilizing sensor data to model students creativity in a digital environment. Computers in Human Behavior, 42:127–137, 2015.
- [126] M. Nickel, V. Tresp, and H.-P. Kriegel. A three-way model for collective learning on multi-relational data. In Icml, 2011.
- [127] H. Niu, W. Xu, H. Akbarzadeh, H. Parvin, A. Beheshti, and H. Alinejad-Rokny. Deep feature learnt by conventional deep neural network. Computers & Electrical Engineering, 84:106656, 2020.
- [128] G. Oberreuter and J. D. Velásquez. Text mining applied to plagiarism detection: The use of words for detecting deviations in the writing style. Expert Systems with Applications, 40(9):3756–3763, 2013.
- [129] D. L. Olson and G. Lauhoff. Descriptive data mining. In Descriptive Data Mining, pages 129–130. Springer, 2019.
- [130] V. K. Ong. Big data and its research implications for higher education: Cases from uk higher education institutions. In 2015 IIAI 4th International Congress on Advanced Applied Informatics, pages 487–491. IEEE, 2015.
- [131] R. J. Oskouei, M. Askari, and P. R. P. Sajja. Perceived internet usage behaviours as predictor to outlier detection in students communities in academic environments. Indian journal of science and technology, 6(7):4923–4935, 2013.
- [132] Y. Ouyang and M. Zhu. elorm: Learning object relationship mining based repository. In The 9th IEEE International Conference on E-commerce Technology and the 4th IEEE International Conference on Enterprise Computing, E-commerce and E-services (CEC-EEE 2007), pages 691–698. IEEE, 2007.
- [133] K. A. Papanikolaou. Constructing interpretative views of learners interaction behavior in an open learner model. IEEE Transactions on Learning Technologies, 8(2):201–214, 2014.
- [134] K. A. Papanikolaou, M. Grigoriadou, H. Kornilakis, and G. D. Magoulas. Personalizing the interaction in a web-based educational hypermedia system: the case of inspire. User modeling and user-adapted interaction, 13(3):213–267, 2003.
- [135] A. Patel and J. Dharwa. Graph data: The next frontier in big data modeling for various domains. Indian Journal of Science and Technology, 10(21):1–7, 2017.
- [136] A. Peña-Ayala. Educational data mining: A survey and a data mining-based analysis of recent works. Expert systems with applications, 41(4):1432–1462, 2014.
- [137] D. Petrova-Antonova, O. Georgieva, and S. Ilieva. Modelling of educational data following big data value chain. In Proceedings of the 18th International Conference on Computer Systems and Technologies, CompSysTech’17, page 88–95, New York, NY, USA, 2017. Association for Computing Machinery.
- [138] T. N. Phyu. Survey of classification techniques in data mining. In Proceedings of the international multiconference of engineers and computer scientists, volume 1, 2009.
- [139] E. Prudhommeaux and A. Seaborne. Sparql query language for rdf. w3c recommendation (january 2008),.
- [140] A. K. Pujari. Data mining techniques. Universities press, 2001.
- [141] E. Rajabi and S.-M.-R. Beheshti. Interlinking big data to web of data. In Big Data optimization: Recent developments and challenges, pages 133–145. Springer, 2016.
- [142] D. Rajagopal et al. Customer data clustering using data mining technique. arXiv preprint arXiv:1112.2663, 2011.
- [143] D. Raju and R. Schumacker. Exploring student characteristics of retention that lead to graduation in higher education using data mining models. Journal of College Student Retention: Research, Theory & Practice, 16(4):563–591, 2015.
- [144] E. Reategui, M. Klemann, D. Epstein, and A. Lorenzatti. Sobek: A text mining tool for educational applications. In Proceedings of the International Conference on Data Science (ICDATA), page 1. The Steering Committee of The World Congress in Computer Science, Computer …, 2011.
- [145] P. Reyes and P. Tchounikine. Mining learning groups’ activities in forum-type tools. 2005.
- [146] M. Rizun et al. Knowledge graph application in education: a literature review. Acta Universitatis Lodziensis. Folia Oeconomica, 3(342):7–19, 2019.
- [147] C. Romero, J. R. Romero, and S. Ventura. A survey on pre-processing educational data. In Educational data mining, pages 29–64. Springer, 2014.
- [148] C. Romero and S. Ventura. Data mining in e-learning, volume 4. WIT press, 2006.
- [149] C. Romero and S. Ventura. Educational data mining and learning analytics: An updated survey. Wiley Interdisciplinary Reviews: Data Mining and Knowledge Discovery, 10(3):e1355, 2020.
- [150] C. Romero, S. Ventura, M. Pechenizkiy, and R. S. Baker. Handbook of educational data mining. CRC press, 2010.
- [151] E. L. Sagan. A network model for planning and establishing higher education consortiums. The Ohio State University, 1969.
- [152] M. K. Saggi and S. Jain. A survey towards an integration of big data analytics to big insights for value-creation. Information Processing & Management, 54(5):758–790, 2018.
- [153] J. Sander. Density-Based Clustering, pages 270–273. Springer US, Boston, MA, 2010.
- [154] F. Schiliro, A. Beheshti, S. Ghodratnama, F. Amouzgar, B. Benatallah, J. Yang, Q. Z. Sheng, F. Casati, and H. R. Motahari-Nezhad. icop: Iot-enabled policing processes. In International Conference on Service-Oriented Computing, pages 447–452. Springer, 2018.
- [155] A. Schleicher. Measuring Student Knowledge and Skills: A New Framework for Assessment. ERIC, 1999.
- [156] A. Schleicher and C. Tamassia. Measuring Student Knowledge and Skills: The PISA 2000 Assessment of Reading, Mathematical and Scientific Literacy. Education and Skills. ERIC, 2000.
- [157] N. Shabani, A. Beheshti, H. Farhood, M. Bower, M. Garrett, and H. A. Rokny. icreate: Mining creative thinking patterns from contextualized educational data. In International Conference on Artificial Intelligence in Education, pages 352–356. Springer, 2022.
- [158] R. Shaheen et al. Creativity and education. Creative education, 1(03):166, 2010.
- [159] G. Siemens. Learning analytics: The emergence of a discipline. American Behavioral Scientist, 57(10):1380–1400, 2013.
- [160] G. Siemens and R. S. d. Baker. Learning analytics and educational data mining: towards communication and collaboration. In Proceedings of the 2nd international conference on learning analytics and knowledge, pages 252–254, 2012.
- [161] A. Silberschatz, H. F. Korth, S. Sudarshan, et al. Database system concepts, volume 4. McGraw-Hill New York, 1997.
- [162] G. Simsion and G. Witt. Data modeling essentials. Elsevier, 2004.
- [163] L. Singelmann, E. Alvarez, E. Swartz, M. Pearson, R. Striker, and D. Ewert. Innovators, learners, and surveyors: Clustering students in an innovation-based learning course. In 2020 IEEE Frontiers in Education Conference (FIE), pages 1–9. IEEE, 2020.
- [164] R. Socher, D. Chen, C. D. Manning, and A. Ng. Reasoning with neural tensor networks for knowledge base completion. In Advances in neural information processing systems, pages 926–934, 2013.
- [165] S. K. Solanki and J. T. Patel. A survey on association rule mining. In 2015 fifth international conference on advanced computing & communication technologies, pages 212–216. IEEE, 2015.
- [166] R. J. Sternberg and T. I. Lubart. Defying the crowd: Cultivating creativity in a culture of conformity. Free press, 1995.
- [167] R. J. Sternberg and L. A. O’Hara. Creativity and intelligence. 1999.
- [168] T. M. Sweet, A. C. Thomas, and B. W. Junker. Hierarchical network models for education research: Hierarchical latent space models. Journal of Educational and Behavioral Statistics, 38(3):295–318, 2013.
- [169] A. Tabebordbar and A. Beheshti. Adaptive rule monitoring system. In 2018 IEEE/ACM 1st International Workshop on Software Engineering for Cognitive Services (SE4COG), pages 45–51. IEEE, 2018.
- [170] A. Tabebordbar, A. Beheshti, B. Benatallah, and M. C. Barukh. Adaptive rule adaptation in unstructured and dynamic environments. In International conference on web information systems engineering, pages 326–340. Springer, 2020.
- [171] A. Tabebordbar, A. Beheshti, B. Benatallah, and M. C. Barukh. Feature-based and adaptive rule adaptation in dynamic environments. Data Science and Engineering, 5(3):207–223, 2020.
- [172] V. Teeroovengadum, T. Kamalanabhan, and A. K. Seebaluck. Measuring service quality in higher education: Development of a hierarchical model (hesqual). Quality Assurance in Education, 2016.
- [173] F. Tian, B. Gao, E.-H. Chen, and T.-Y. Liu. Learning better word embedding by asymmetric low-rank projection of knowledge graph. Journal of Computer Science and Technology, 31(3):624–634, 2016.
- [174] E. P. Torrance. Predictive validity of the torrance tests of creative thinking. The Journal of creative behavior, 1972.
- [175] M. Ueno. On-line statistical outlier detection of irregular learning processes for e-learning. In EdMedia+ Innovate Learning, pages 227–234. Association for the Advancement of Computing in Education (AACE), 2003.
- [176] R. J. Vallerand and C. F. Ratelle. Intrinsic and extrinsic motivation: a hierarchical model. 2002.
- [177] S. Velampalli and M. V. Jonnalagedda. Graph based knowledge discovery using mapreduce and subdue algorithm. Data & Knowledge Engineering, 111:103–113, 2017.
- [178] M. C. Wang, G. D. Haertel, and H. J. Walberg. Toward a knowledge base for school learning. Review of educational research, 63(3):249–294, 1993.
- [179] R. Wang, H. Ryu, and N. Katuk. Assessment of students cognitive–affective states in learning within a computer-based environment: Effects on performance. Journal of ICT, 14:153–176, 2015.
- [180] S. Wang, A. Beheshti, Y. Wang, J. Lu, Q. Z. Sheng, S. Elbourn, H. Alinejad-Rokny, and E. Galanis. Assessment2vec: Learning distributed representations of assessments to reduce marking workload. In International Conference on Artificial Intelligence in Education, pages 384–389. Springer, 2021.
- [181] J. W. Warren. Zen and the art of metadata maintenance. 18(3), 2015.
- [182] J. Watson. Blended Learning: The Convergence of Online and Face-to-Face Education. North American Council for Online Learning, 2008.
- [183] B. G. Weber and M. Mateas. A data mining approach to strategy prediction. In 2009 IEEE Symposium on Computational Intelligence and Games, pages 140–147. IEEE, 2009.
- [184] X. Wei, N. Saab, and W. Admiraal. Assessment of cognitive, behavioral, and affective learning outcomes in massive open online courses: A systematic literature review. Computers & Education, page 104097, 2020.
- [185] L. R. Winer and M. Carrière. The use of a relational database in qualitative research on educational computing. In Computer Assisted Learning, pages 213–220. Elsevier, 1990.
- [186] I. H. Witten, E. Frank, M. A. Hall, and C. J. Pal. Practical machine learning tools and techniques. Morgan Kaufmann, 578:1, 2005.
- [187] X. Wu, X. Zhu, G.-Q. Wu, and W. Ding. Data mining with big data. IEEE transactions on knowledge and data engineering, 26(1):97–107, 2013.
- [188] Y. Wu, J.-S. Pan, P. Lu, K. Lin, and X. Yu. Knowledge graph embedding translation based on constraints. J. Inf. Hiding Multim. Signal Process., 8(5):1119–1131, 2017.
- [189] S. Yakhchi, A. Beheshti, S. M. Ghafari, and M. Orgun. Enabling the analysis of personality aspects in recommender systems. arXiv preprint arXiv:2001.04825, 2020.
- [190] J. Yang, Y. Tang, and A. Beheshti. Design methodology for service-based data product sharing and trading. In Next-Gen Digital Services. A Retrospective and Roadmap for Service Computing of the Future, pages 221–235. Springer, 2021.
- [191] J. Yu. Rough set based creativity rule extracting for middle school students. In Third International Workshop on Advanced Computational Intelligence, pages 209–212. IEEE, 2010.
- [192] Y. Yu and Y. Tang. The construction of hierarchical network model and wireless activation diffusion optimization model in english teaching. Eurasip journal on wireless communications and networking, 2020(1):1–14, 2020.
- [193] G. Zhang, J. Wu, J. Yang, A. Beheshti, S. Xue, C. Zhou, and Q. Z. Sheng. Fraudre: fraud detection dual-resistant to graph inconsistency and imbalance. In 2021 IEEE International Conference on Data Mining (ICDM), pages 867–876. IEEE, 2021.
- [194] M. Zhang. Internet use that reproduces educational inequalities: Evidence from big data. Computers & Education, 86:212–223, 2015.
- [195] L. Zhao and S. Roberts. An object-oriented data model for database modelling, implementation and access. The Computer Journal, 31(2):116–124, 1988.
- [196] P. Zikopoulos, C. Eaton, D. deRoos, T. Detusch, and G. Lapis. Understanding big data: Analytics for enterprise class hadoop and streaming data (ibm.). new york: Mcgraw, 2012.
- [197] B. J. Zimmerman. Becoming a self-regulated learner: An overview. Theory into practice, 41(2):64–70, 2002.