11email: d.modiano@uva.nl
Discovery of a probable very fast extragalactic nova in a symbiotic binary††thanks: A reproduction package for this paper is available at https://doi.org/10.5281/zenodo.6817684.
Very fast novae are novae which evolve exceptionally quickly (on timescales of only days). Due to their rapid evolution, very fast novae are challenging to detect and study, especially at early times. Here we report the discovery, which was made as part of our Transient UV Objects project, of a probable very fast nova in the nearby spiral galaxy NGC 300. We detected the rise to the peak (which is rarely observed for very fast novae) in the near-ultraviolet (NUV), with the first detection just 2 hours after the eruption started. The peak and early stages of the decay were also observed in UV and optical bands. The source rapidly decayed (2 NUV magnitudes within 3.5 days), making it one of the fastest novae known. In addition, a likely quiescent counterpart was found in archival near-infrared Spitzer and VIRCAM images but not in any deep optical and UV observations, indicating a very red spectral shape in quiescence. The outburst and quiescence properties suggest that the system is likely a symbiotic binary. We discuss this new transient in the context of very fast novae in general and specifically as a promising supernova Type Ia progenitor candidate, due to its very high inferred WD mass ( 1.35 M⊙; determined by comparing this source to other very fast novae).
Key Words.:
methods: data analysis – methods: observational – ultraviolet: stars – binaries: symbiotic – novae1 Introduction
White dwarfs (WDs) in binary systems can accrete matter from their companions. If the companion is a main-sequence (MS) star (although in rare cases it can be another WD), then mass transfer occurs via Roche-Lobe overflow and the system is usually known as a cataclysmic variable (CV; for an extended review see Warner 1995). If the donor is an evolved giant, the orbital separation is large (at least hundreds of days) and the system is known as a symbiotic binary (or a symbiotic; see Mikołajewska 2012; Munari 2019 for reviews). In this case, the WD accretes mass from the strong stellar wind of the companion, although for symbiotics with short orbital periods (600 days) Roche-Lobe overflow may also occur (and could be the primary method of accretion; Mikolajewska 2010) .
When Roche-Lobe overflow is the dominant mode of accretion (i.e. in CVs and short-period symbiotics), then the system can undergo explosive thermonuclear outbursts known as novae (Gallagher & Starrfield 1978; Chomiuk et al. 2021). These eruptions arise because a hydrogen-rich layer of accreted material accumulates on the WD surface, causing the temperature and density to increase and eventually reach the critical conditions for unstable nuclear burning (Starrfield et al. 1972; Bode & Evans 2008). This triggers a thermonuclear runaway event (TNR), which causes the accreted envelope to rapidly expand, and consequently the system to brighten in the ultraviolet (UV) and optical by up to a factor of 1 million (8–15 visual magnitudes) on timescales of days to weeks (for reviews see Bode & Evans 2008; Starrfield et al. 2016; Chomiuk et al. 2021).
Novae are often classified according to their light curve properties, in particular the timescale of their decay. The ‘speed class’ is commonly quantified by the parameters and , which indicate the time taken for the brightness of the nova to decline from its peak by 2 and 3 visual magnitudes, respectively. The classes range from ‘very fast’ ( ¡ 10 d) to ‘very slow’ ( ¿ 150 d; Payne-Gaposchkin 1964). Despite some caveats (see Sect. 4), this parameter is important because the speed of decay is linked to the WD mass, with the fastest-evolving novae likely to harbour the most massive WDs (1.4 M⊙; Hachisu & Kato 2016; Shara et al. 2018; Hachisu & Kato 2018; Darnley 2021). Thus, very fast novae are of interest because of their extreme nature both in terms of light curve properties (and the underlying physical processes) and WD mass.
So far, a few tens of very fast novae have been discovered, but with only seven originating in symbiotics111Here is it worth making a brief note on terminology with regards to novae. The term ‘symbiotic novae’ is usually reserved for very slow (years to decades) and low-amplitude (2–6 magnitudes) outbursts that occur in typical, wide-orbit (orbital periods 800 days) symbiotics (Allen 1980). Due to the physical properties of these slow novae (low accretion rates, low WD masses, and wind-only accretion) and their observational signatures (very slow and very faint), it is important to distinguish them from all other novae. Thus, novae originating in symbiotics are referred to as such, and not as ‘symbiotic novae’. In this paper, we do not include the latter when discussing novae. (Schaefer 2010; Darnley et al. 2016; Jencson et al. 2021 and references therein). There are still many uncertainties regarding the mechanisms of these remarkable outbursts, such as the temperature evolution (e.g. Darnley et al. 2016) and the geometrical structure of the expanding envelope (e.g, Cao et al. 2012). In addition, many very fast novae exhibit plateaus in their light curve (e.g. Strope et al. 2010) which are also not well understood (possibly they arise from the irradiation of the accretion disc by emission from the WD; Hachisu et al. 2000).
Very fast novae are additionally noteworthy because they have been proposed as progenitors of Type Ia supernovae (SNe; Maoz et al. 2014; Hillman et al. 2016; Hachisu & Kato 2018). Although there is general agreement in that Type Ia SNe result from the thermonuclear detonation of a WD after its mass has increased to the Chandrasekhar limit (1.4 M⊙; Nomoto 1982), it is not yet clear how this is achieved. Very fast novae may provide an efficient pathway to sufficiently increasing the mass of a WD, due to their high WD masses and the fact that they can grow (Hillman et al. 2016). A particularly likely channel may be the very fast novae which originate in symbiotics (e.g. Patat et al. 2011). However, although not precisely known, the rates of very fast novae appear to be too low to account for all Type Ia SNe (although this is true of all the likely progenitor channels, suggesting that there are multiple channels; see e.g. Schaefer 2010).
Recently, we have initiated the Transient UV Objects (TUVO) Project, through which we search for and study transients in the relatively underutilised UV wavelength range. Within this project, we focus on the UV data obtained by the Ultraviolet and Optical Telescope (UVOT, Roming et al. 2005; Breeveld et al. 2010) aboard the Neil Gehrels Swift Observatory (Swift, Gehrels et al. 2004). Through our specialised pipeline used to analyse these UVOT data (Modiano et al. 2022), we regularly detect serendipitous new and archival transients. Since novae exhibit strong UV outbursts, this method is well-suited to the discovery and study of these systems. In this letter, we present the TUVO discovery and a photometric study of TUVO-22albb, a new UV transient we detected in the nearby spiral galaxy NGC 300 (1.88 Mpc; Gieren et al. 2005). We determine it to be most likely one of the rare, very fast novae originating in symbiotics, and find that it is one of the fastest-evolving novae known.
2 Observations
2.1 Discovery
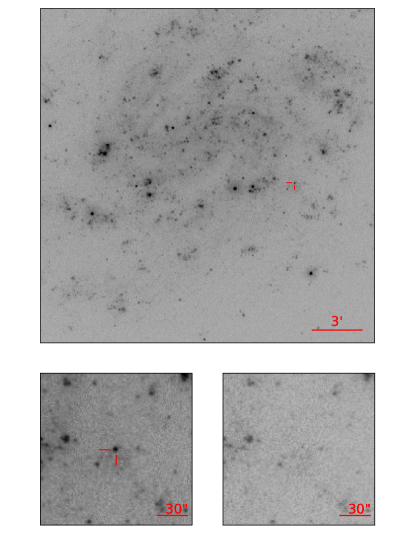
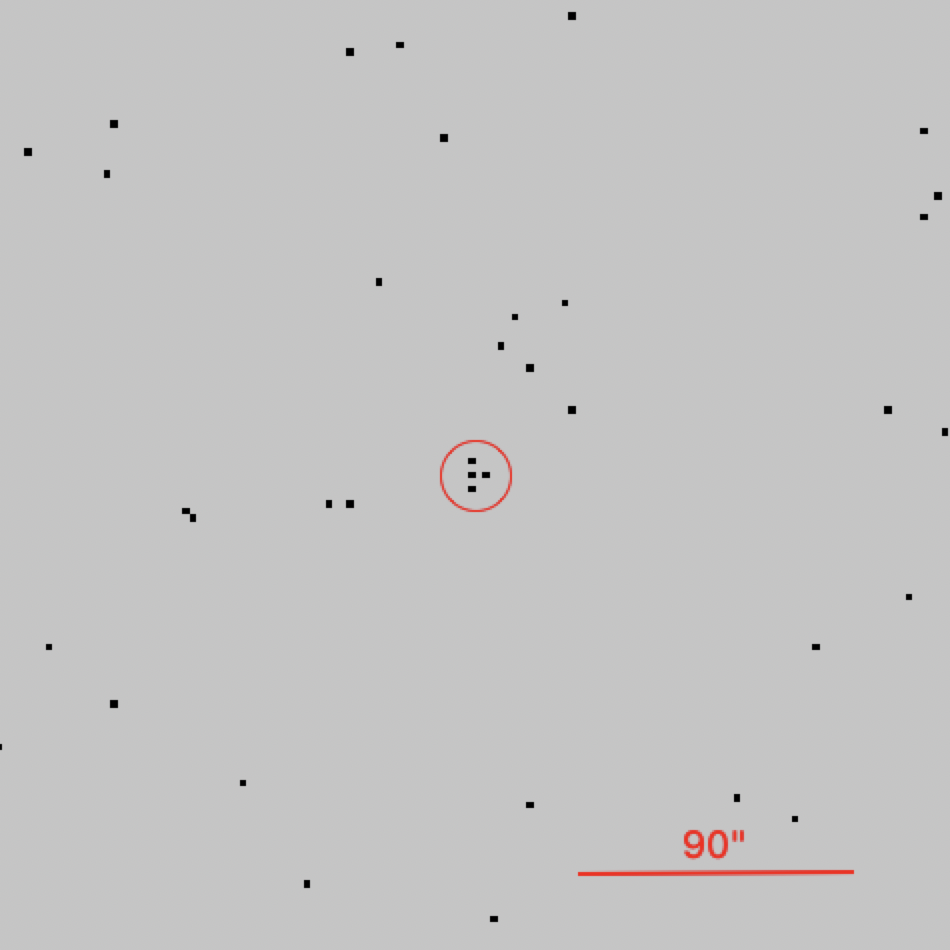
Using our pipeline, we detected a transient in an archival222Archival Swift data are hosted at the High Energy Astrophysics Science Archive Research Centre (HEASARC); at https://heasarc.gsfc.nasa.gov/cgi-bin/W3Browse/swift.pl. UVOT exposure of NGC 300, taken using the filter (central wavelength ; Poole et al. 2008). The source was denoted as TUVO-22albb. We report the position at right ascension=00:54:34.26 and declination=-37:42:50.7, with an error circle of (due to the UVOT astrometric solution; see Poole et al. 2008). In Fig. 1 we show the discovery image, which was taken on Dec. 31, 2006, and cutouts of the discovery and reference images zoomed in on the transient, clearly showing the transient only visible in the discovery image.
A preliminary light curve was automatically created by our pipeline using all archival UVOT data covering the position of the source (shown in Appendix A). This data set includes 164 observations, and as per the UVOT data structure333https://www.swift.ac.uk/analysis/uvot/files.php, each observation consists of one or multiple individual exposures per filter. The full data set spanned 16 years, was of highly varying cadence (between hours and years), and contained data in all six UVOT filters444https://www.swift.ac.uk/analysis/uvot/filters.php. This long-term light curve indicated that the source was only detected during a 10 day period, so we selected these exposures with which to carry out a more customised analysis (see Appendix B for details of the observations used). We note that the late stages of the outburst may have continued for several weeks, but there were no UVOT observations in this period. The gap between the last detection and the subsequent non-detection is 20 days.
2.2 Outburst photometry
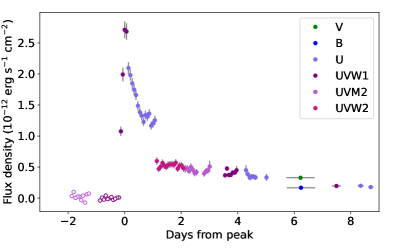
To characterise the outburst brightness evolution of the transient, we used all the selected outburst exposures to construct a light curve, which we display in Fig. 2. Before performing the photometry, we inspected all the exposures during the outburst to check for secure detections of the source. We noted that during the later stages of the outburst ( 6 days after peak), the source had dimmed such that it was not clearly detectable in every individual exposure. Therefore, for these data we co-added some exposures (see Appendix B for details).
We then carried out photometry on all the individual or resulting co-added exposures. All fluxes were obtained using the standard UVOT photometry tool uvotsource555https://heasarc.gsfc.nasa.gov/lheasoft/ftools/headas/uvotsource.html. The methods used for photometry, including aperture selection and dealing with diffuse background emission, are described in Appendix C. The fluxes were corrected for extinction using the Galactic dust and extinction maps available at NASA/IPAC Infrared Science Archive666https://irsa.ipac.caltech.edu/applications/DUST/. Extinction in the line of sight of TUVO-22albb is small (), so this had only a small effect (typically 5 %) on the light curve. We note that the , , and UVOT filter transmission is contaminated by a red leak. However, several studies (e.g. Brown et al. 2010; Siegel et al. 2012, 2014) have found that this does not have a significant effect for hot (5000–10 000 K) sources such as novae at early times (see Sect. 4), so we did not correct for it. For easier comparison with other similar sources for which light curves are often provided in magnitudes, the final corrected fluxes were also converted back into (AB) magnitudes; these are provided in Appendix C (Table 3) for all observations in which a detection was made.
3 Analysis and results
3.1 Outburst: light curve properties
The rise and peak of the outburst were observed only using the filter; the initial rapid decline was observed only using the filter; and the slower subsequent decay was observed using all six UVOT filters. Unfortunately, observations between the filters do not overlap in time (except the late and observations), so we cannot precisely discern the profile of the entire light curve. However, at maximum brightness the spectral energy distribution (SED) of this source is likely strongest in the or near-UV (NUV; e.g. Jencson et al. 2021), so a reasonable assumption is that the SED between the and bands (which are only separated by 800 ) at the peak was fairly flat. Since these were the two filters used for the exposures during and immediately after the light curve peak, the early light curve profile is reasonably well approximated by the combination of the early and data. Overall, the outburst light curve (Fig. 2) of the transient can be broadly characterised by a very rapid (hours) rise, followed by a initial steep decay until t 0.6 d and then a subsequent plateau and slower decay phase (where we have defined t = 0 as MJD=54099.9, which is the time of the peak of the light curve in the filter).
After 1 day, a drop in flux by a factor of 2 occurs between the and band data but this happens in less than 2 hours. This suggests that it does not represent a real decrease in overall luminosity but that the source was fainter in than in , indicating an SED peaking towards the NUV or . Therefore, the assumption of a flat SED between the and filters during the first day of the outburst is not valid for the entire SED (and indeed is only a first-order approximation). However, for the remainder of the light curve (i.e. during the slow decline phase starting from day 2) the very similar fluxes and proximity (in time) of observations between the different filters suggest that the SED rapidly switched to exhibiting a fairly flat shape across the full UV-optical range.
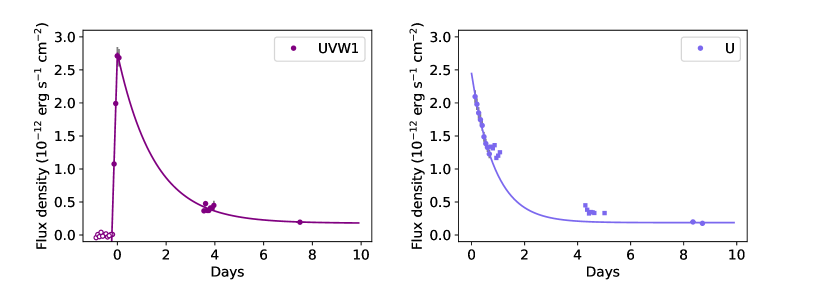
The start time of the eruption can be very well constrained by the non-detections in the data obtained using the filter just a few hours before the first detection (using the same filter). We approximated the rise with a straight-line fit to the earliest three detections (Fig. 3, left panel). This gave a flux of zero at 5.3 hours (0.22 days) before the peak, which gives a good indication of the rise time.
The decay stage is more complex than a simple exponential decay. Nonetheless, exponential fits can still be illustrative of the source behaviour, and allow us to estimate . Therefore, we fitted an exponential decay function to the rapid-decline data (up to 0.6 days) together with the late-time detections at ¿8 days. The fit is shown in Fig. 3 (right panel). We found the best-fit = -1.15 0.04 d-1. Due to the decline break, we cannot fit the decay in before and after 0.6 days with the same exponential function, so we cannot constrain well. However, in order to quantitatively compare the fast initial and slower later declines, we also fitted an exponential function to the data omitting the steep initial decline, obtaining a much slower = -0.48 0.04 d-1. Assuming the peak brightness was similar to that for , an upper limit for can be estimated as 4.3 days, which is the time between the peak and the first exposure for which the brightness had declined by more than 2 magnitudes.
We also fitted an exponential decay function to the data, displayed in Fig. 3 (left panel), with the best fit giving = -0.66 0.04 d-1. This indicates slower decay than that inferred from the t 0.6 day data, which reflects a combination of the faster early decay before 0.6 days and shallower subsequent decay. The value we infer from the exponential fit is 3.5 days777Since the peak is clearly observed in , a robust upper limit for independent of the fitting can be determined by calculating the time between the peak and the exposure during which the brightness had decreased by 2.2 magnitudes. This gives ¡ 3.55 days, which is very close the the value of 3.5 days inferred from the exponential fit.. There is not sufficient sampling in the band for it to be useful to fit the light curve with two different exponential functions. Due to the brightness of the background emission at the source location, the photometry never exhibits a 3 magnitude decrease from the peak, so we are unable to determine . However, at t = 8.3 days it has declined by 2.9 magnitudes, so we take this as a lower limit for .
3.2 Quiescence
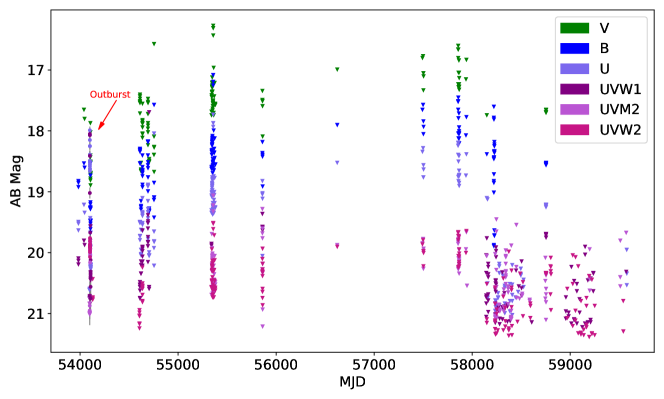
The long-term UVOT light curve (Fig. 5) did not reveal any detections outside of the outburst period, indicating that only one outburst was observed by UVOT. To constrain the source brightness during quiescence, we co-added all pre- and post-outburst UVOT exposures per filter, which ranged in time from 2007 to 2022 (see Appendix A). This resulted in data sets with total exposure times of 17 ks, 23 ks, 66 ks, 91 ks, 91 ks, and 98 ks in the filters , , , , , and , respectively. The source was not detected in any of the co-added exposures. While the detection limits of these exposures overall reached 23-24 magnitudes, the diffuse emission due to NGC 300 at the source position resulted in weaker upper limits for the quiescent counterpart. To determine these, we ran uvotsource at the source position (when no source is detected the tool calculates a 3- upper limit). We obtained upper limits of 18.6, 18.7, 19.5, 20.5, 20.7, and 20.5 magnitudes in the filters , , , , , and , respectively (see Appendix C). Comparing the and quiescence upper limits to their corresponding peak magnitudes of 17.9, this suggests outburst amplitudes of at least 1.6 and 2.6 magnitudes, respectively. However, during quiescence the source was likely much fainter than the upper limits (see Sect. 4) so these are very weak lower limits to the amplitudes.
We searched various publicly available astronomical databases for archival observations covering the position of the source (see Table A.1 in Modiano et al. 2022 for details of all the catalogues we probe automatically in the TUVO project). We found no previous classifications of this source in any of these databases, and no detections in X-ray, UV, or optical catalogues. We looked at archival optical ( band; 380–550nm) images from OmegaCam (Kuijken 2011) mounted on the ESO-VLT Survey Telescope (Shanks et al. 2015) and did not detect the source, with an upper limit of 23.4 magnitudes (5-; the provided detection limit). This significantly improves the optical upper limits on the quiescent counterpart determined from UVOT.
Potential matches to our source, which we define as any catalogued source within of the position of TUVO-22albb, were found in archival near-infrared (NIR) images obtained by the Spitzer (Werner et al. 2004) Infrared Array Camera (IRAC; Fazio et al. 2004) and by VIRCAM888https://www.eso.org/sci/facilities/paranal/instruments/vircam/inst.html mounted on the VISTA telescope (Sutherland et al. 2015; source IDs SSTSL2 J005434.20-374251.3 and 473505681893, respectively). The Spitzer-IRAC catalogued photometry measurements for this source in Channel 1 (3.1–3.9 m) and Channel 2 (3.9–5.1 m) were 17.90.1 and 18.20.1 magnitudes, respectively. The VISTA-VIRCAM (1.15–1.4 m) and (1.95–2.35 m) band photometry measurements were 19.10.1 and 18.20.2 magnitudes, respectively.
3.3 X-ray data
We also examined the data taken with the X-ray telescope (XRT; Burrows et al. 2005) aboard Swift, which operates simultaneously with the UVOT. Combining both quiescence and outburst observations did not result in a detection at the source position (see Appendix D for details). However, the observation subsequent to the last detection in the light curve, which was taken 30 days after the peak, possibly revealed a very faint X-ray source (albeit with SNR 1.9) coincident with the position of TUVO-22albb. Using the ximage999https://www.swift.ac.uk/analysis/xrt/xrtcentroid.php tool, we found a count rate of 0.0040.002 c s-1, and we used the Webpimms101010https://heasarc.gsfc.nasa.gov/cgi-bin/Tools/w3pimms/w3pimms.pl tool available from HEASARC to calculate a flux in the 0.3-10 keV band of 1.910-13 erg cm-2 s-1 (for details see Appendix D). Assuming the distance to NGC 300 of 1.88 Mpc, this corresponds to an X-ray luminosity of 8.11037 erg s-1.
4 Discussion
Using our method to search for UV transients in Swift UVOT data (Modiano et al. 2022), we discovered an archival transient in the nearby spiral galaxy NGC 300. The UV and optical light curve was exceptionally well sampled, including detections during the rise, peak, and early (¡ 10 days) decay stages. We used the light curve to characterise the evolution of the outburst. We further investigated the quiescent counterpart using both Swift data and additional publicly available optical and NIR images.
The data presented suggest that TUVO-22albb is most likely a very fast nova originating in a symbiotic. The arguments in favour of this classification are:
-
•
The spatial coincidence with NGC 300. This suggests an association with this galaxy and that it is not a fainter, foreground Milky Way transient such as a stellar flare or a dwarf nova (DN; a 2–6 mag outburst caused by accretion disc instabilities in a CV; see Lasota 2001). We note that flares are further ruled out by the transient duration: flares last between a seconds and 1 day (e.g. Shibayama et al. 2013; Günther et al. 2020), while this transient was active for at least 9 days. If the association with NGC 300 is correct, this implies a distance of 1.88 Mpc (Gieren et al. 2005) and consequently peak absolute (AB) magnitudes of = 8.3 and 8.4. This is consistent with typical nova luminosities (see e.g. Schaefer 2010; Strope et al. 2010).
-
•
The shape and speed of evolution of the light curve. The rapid rise, occurring in just 5 hours, and the fast decay in the subsequent days, closely resemble that of other very fast novae (e.g. Darnley et al. 2016; Jencson et al. 2021). A plot displaying the light curves of some very fast novae originating in symbiotics together with that of TUVO-22albb is displayed in Fig. 4 (see below for a more extended discussion comparing TUVO-22albb to similar sources). The of 3.5 days places TUVO-22albb in the speed class of very fast novae and it is one of the fastest known novae.
-
•
The evolution of the SED. The data are consistent with the SED peaking in the U or NUV at early times (t ¡ 1 day) and then flattening. For very fast novae, it is expected that the material ejected expands and cools, therefore shifting the SED from a hot, blue continuum to a flatter SED (e.g. Darnley 2021; see also the extended discussion below).
-
•
The brightness and colour of the likely quiescent counterpart we found in NIR images. For this source - = 0.9 and = 8.2 (at the distance of NGC 300). Using the colour-magnitude diagrams of evolved giants from Cioni et al. (2006) and Whitelock et al. (2009), we find that this source is brighter than the tip of the red giant (RG) branch (), and consistent with asymptotic giant branch (AGB) stars. The likely presence of an evolved giant indicates that the system is a symbiotic, and specifically we suggest that the companion in TUVO-22albb is an AGB star.
-
•
The lack of detections in archival optical and UV images down to 23.4 magnitudes. This further rules out the source being a nearby (Milky Way) DN, because its quiescent optical brightness should have been ¡ 23 mags (moreover, the quiescent SED in DNe is expected to be flat, not very red). Similarly, stellar flares do not cause brightenings of more than a few magnitudes (e.g. Günther et al. 2020). Unfortunately, the Hubble Space Telescope did not image the exact position of our source (this would have provided a very good constraint on the quiescence magnitude and therefore the outburst amplitude).
-
•
The possible X-ray source coincident with the position of TUVO-22albb in an XRT image taken 30 days after the outburst peak. The luminosity of the source (81037 erg s-1; assuming it was a real detection) is similar to that of other X-ray detections of novae days to weeks after the peak. For example, for the very fast nova U Scorpii soft X-rays were detected and peak in brightness 30 days after the optical maximum (Mason et al. 2012). Similar X-ray detections were made for very fast novae in symbiotics (peaking at varying times after the optical nova peak), such as V745 Sco (Page et al. 2015), V3890 Sgr (Page et al. 2020), and RS Oph (Page et al. 2022). X-ray detections are likely influenced by the orbital phase during the observations (e.g. Mason et al. 2012).
Although the parameter does not encapsulate the many complications and diversities exhibited by nova light curves, it is still a good indication of the speed class and can be used to infer properties of the system. The of 3.5 days makes TUVO-22albb one the fastest-evolving novae known. This source then belongs to the class of very fast novae originating in symbiotics. To our knowledge, until now only eight of these sources were known: the famous RS Ophiuci (e.g. Munari & Valisa 2022), along with T CrB (Iłkiewicz et al. 2016), V745 Sco (Sekiguchi et al. 1990), V1534 Sco (Joshi et al. 2015), V3890 Sgr (Page et al. 2020), V407 Cyg (Munari et al. 2011), M31N 2008-12a (Darnley et al. 2016), and the recently discovered AT 2019qyl (Jencson et al. 2021). Among these, TUVO-22albb together with AT 2019qyl exhibit the third fastest (3.5 days; although the fastest, V745 Sco, was not observed at peak, so its of 2.0 days is uncertain). Fig. 4 shows the light curves of TUVO-22albb along with four other very fast novae originating in symbiotics for which data are available.
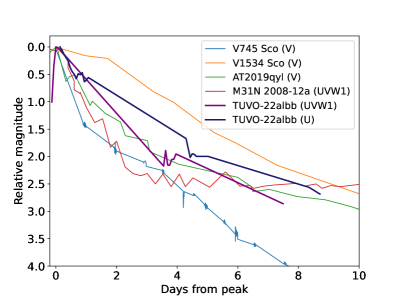
The shape and speed of evolution of the light curve of TUVO-22albb clearly resembles those of other very fast novae in symbiotics. The decline is slightly slower than those of M31N 2008-12a and V745 Sco, slightly faster than that of V1534 Sco, and very similar to that of AT 2019qyl (as also suggested by the same of 3.5 days). The shape of the decay is also similar. We note that due to the inhomogenous sampling for each particular filter for TUVO-22albb, the light curve shape suggested by the connected lines is slightly misleading; most likely the true decline is exponential-like (see Sect. 3) and therefore matches the behaviour of AT 2019qyl even more clearly. We note that this comparison is based on different filters (due to data availability). However, the general behaviour of the decay in very fast novae light curves is typically very similar between filters in the optical to NUV; therefore comparisons of the decay shapes still give insightful information about similarities between different systems.
In Table 1 we compile basic properties (the absolute magnitude at maximum brightness , , , and the most likely companion type) of all the known very fast novae which are thought to originate in symbiotics (to our knowledge). By and , TUVO-22albb ( = 3.5 d and ¿ 8.3 d) is slightly faster than the averages of 4.4 d and 10.3 d, respectively (where the averages include TUVO-22albb). The absolute magnitude of TUVO-22albb at its peak shows that it is on the brighter side of similar sources, though our observations at the peak were in the NUV ( and ) while other sources typically have only -band observations at the peak. The table further highlights the remarkable similarity of this source with AT 2019qyl, in terms of peak brightness, decay properties, and most likely companion stars.
| Object | (filter) | Donor | ||
| RS Oph | 8.0 () | 7 | 14 | RG |
| V745 Sco | 7.9 () | 2 | 4 | RG |
| V1534 Sco | 5.8 () | 5.6 | 9.2 | RG |
| T CrB | 6.9 () | 4 | 6 | RG |
| V407 Cyg | 9.0 () | 5.9 | 24 | Mira |
| M31N 2008-12a | 6.0 () | 1.65 | 2.47 | RG |
| V3890 Sgr | 5.2 () | 6 | 14 | RG |
| AT2019qyl | 9.2 (), -9.8 () | 3.5 | 10.3 | AGB |
| TUVO-22albb | 9.2 () | 3.5 | ¿8.3 | AGB |
Notes. The data for M31N 2008-12a are taken from Darnley et al. (2016); for V3890 from Strope et al. (2010); for AT2019qyl from Jencson et al. (2021); for TUVO-22albb from this paper; for all others from Hachisu & Kato (2018) and references therein. As novae magnitudes are usually provided in the Vega system, all magnitudes in this table (including for TUVO-22albb) are given in the Vega system (this is in contrast with the AB system which we use for other magnitudes quoted this paper).
Here we highlight a limitation in comparisons using . A striking feature of the light curve of TUVO-22albb is the sharp break in the decline at 0.6 days, which marks the start of a plateau phase. Such plateaus have been observed in some novae, mostly fast novae with short recurrence times. Indeed, this feature has been suggested as a telltale signature for such systems (Schaefer 2010; Darnley et al. 2016) and thus strengthens our interpretation of TUVO-22albb as a member of this class of object. The tendency is that the faster the nova, the earlier the plateau phase begins (e.g. Strope et al. 2010); however, to our knowledge no nova exhibits a plateau beginning as early as 0.6 days. For instance, the plateau phase for M31N 2008-12a (one of the fastest novae known, with a similar light curve to TUVO-22albb but with ¡ 2 days) begins at 4 days. This highlights the caveats associated with using the parameter: for most very fast novae, the plateau phase (if present) occurs after has passed. Therefore, when comparing the early decay speed of TUVO-22albb to that of other very fast novae, our reported is artificially high (i.e. slow). Extrapolating the early rapid decay observed in (i.e. ignoring the plateau data; see Fig. 3, right panel) results in a faster of 2.2 days.
Plateaus in nova light curves are thought to be caused by the irradiation of the disc by the radiation emitted from the nuclear burning on the WD surface (which becomes visible as the envelope recedes), combined with the decreasing flux from photons emitted in the ejecta (Schaefer 2010; Hachisu & Kato 2000). Hachisu et al. (2000) modelled fast nova light curves and find that several properties of the system, including the accretion disc radius, the thickness of the disc, and the irradiation efficiency might affect the plateau. However, it is not clear what would cause the very early plateau phase of TUVO-22albb.
The SED evolution of TUVO-22albb is difficult to discern because of the lack of simultaneous data in multiple filters. Nonetheless, as suggested in Sect. 3.1, at the peak of the outburst the SED is consistent with having its maximum in the and NUV followed by a rapid (a few days) evolution towards a flat spectrum across the UV-optical during the decay of the outburst. This is similar to the SED evolution for both AT 2019qyl and M31N 2008-12a, where the SEDs are observed to peak in the NUV at maximum brightness followed by a flattening of the SED over the course of the first 10 days (see Fig. 5 in Jencson et al. 2021 for AT 2019qyl and Fig. 16 in Darnley et al. 2016 for M31N 2008-12a). Flat UV-optical SEDs are expected throughout the outburst for very fast novae in symbiotics but not those in CVs (Darnley et al. 2016; Hachisu & Kato 2016). These similarities therefore further suggest a symbiotic nature for TUVO-22albb. Rapid SED evolution is indicative of a fast evolution of the temperature, which is achievable with a relatively low mass ejecta shell (e.g. Jencson et al. 2021), so this is consistent with the low of TUVO-22albb.
As discussed Sect. 1, very fast nova light curves are indicative of massive WDs. While this general connection is well-established (e.g. Hachisu & Kato 2016; Shara et al. 2018; Hachisu & Kato 2018; Darnley 2021), the variety of different parameters of a nova that affect the light curve111111For example, the chemical composition of the WD and of the accreted matter, internal shocks in the ejecta, dust formation in the ejecta, and interactions of the ejecta with the giant’s wind in the case of a symbiotic. See (Chomiuk et al. 2021) and references therein for a discussion. imply that obtaining precise estimates of the WD mass based solely on the speed class is difficult. Nonetheless, useful first approximations can be inferred. Very fast novae should harbour massive WDs of at least M⊙ (Yaron et al. 2005; Hillman et al. 2016; Shara et al. 2018), which gives a likely lower limit for the WD of TUVO-22albb. By comparing for TUVO-22albb to those of other very fast novae in symbiotics (e.g. T CrB with =4 d and MWD=1.38 M⊙; V1534 with =5.6 d and MWD=1.37 M⊙; V745 Sco with =2 d and MWD=1.38 M⊙; Hachisu & Kato 2018), we suspect that the mass of the WD is in fact at least 1.35 M⊙, which is near the maximum possible mass for a WD.
The progenitors of Type Ia SNe, which are still not known, must have WD masses close to the Chandrasekhar mass limit of 1.4 M⊙ (Nomoto 1982). Very fast novae already have WDs with masses close to this (1.25 M⊙), but to be viable Type Ia SN progenitor candidates, their WDs must be able to grow further. Hillman et al. (2016) show that WDs in novae can grow in mass to the Chandrasekhar limit for a large range of accretion rates and initial WD masses. The very fast novae which originate in symbiotics may represent an even more likely channel to Type Ia SNe than those in CVs (Munari & Renzini 1992; Patat et al. 2011; Darnley et al. 2011). This may be because the presence of the evolved giant in symbiotics results in a higher accretion rate (Darnley et al. 2011), which allows the WD to grow more quickly (assuming not all the accreted material is ejected; e.g. Hillman et al. 2016). The very fast nature of TUVO-22albb and consequently its high inferred WD mass, together with its likely origin in a symbiotic, overall make it an optimal candidate for the Type Ia SN progenitor channel.
Acknowledgements.
DM is partly supported by the Netherlands Research School for Astronomy (NOVA).We acknowledge the use of public data from the Swift data archive.
This research has made use of the VizieR catalogue access tool, CDS, Strasbourg, France (DOI : 10.26093/cds/vizier), and NASA’s Astrophysics Data System Bibliographic Services.
We thank the referee greatly for the very helpful and insightful suggestions to improve this paper.
References
- Allen (1980) Allen, D. A. 1980, MNRAS, 192, 521
- Bode & Evans (2008) Bode, M. F. & Evans, A. 2008, Classical Novae, Vol. 43
- Bozzo et al. (2022) Bozzo, E., Romano, P., Ferrigno, C., & Oskinova, L. 2022, MNRAS, 513, 42
- Breeveld et al. (2010) Breeveld, A. A., Curran, P. A., Hoversten, E. A., et al. 2010, MNRAS, 406, 1687
- Brown et al. (2010) Brown, P. J., Roming, P. W. A., Milne, P., et al. 2010, ApJ, 721, 1608
- Burrows et al. (2005) Burrows, D. N., Hill, J. E., Nousek, J. A., et al. 2005, Space Sci. Rev., 120, 165
- Cao et al. (2012) Cao, Y., Kasliwal, M. M., Neill, J. D., et al. 2012, ApJ, 752, 133
- Chomiuk et al. (2021) Chomiuk, L., Metzger, B. D., & Shen, K. J. 2021, ARA&A, 59 [arXiv:2011.08751]
- Cioni et al. (2006) Cioni, M. R. L., Girardi, L., Marigo, P., & Habing, H. J. 2006, A&A, 448, 77
- Darnley (2021) Darnley, M. J. 2021, in The Golden Age of Cataclysmic Variables and Related Objects V, Vol. 2-7, 44
- Darnley et al. (2016) Darnley, M. J., Henze, M., Bode, M. F., et al. 2016, ApJ, 833, 149
- Darnley et al. (2011) Darnley, M. J., Ribeiro, V. A. R. M., Bode, M. F., & Munari, U. 2011, A&A, 530, A70
- Evans et al. (2009) Evans, P. A., Beardmore, A. P., Page, K. L., et al. 2009, MNRAS, 397, 1177
- Fazio et al. (2004) Fazio, G. G., Hora, J. L., Allen, L. E., et al. 2004, ApJS, 154, 10
- Gallagher & Starrfield (1978) Gallagher, J. S. & Starrfield, S. 1978, ARA&A, 16, 171
- Gehrels (1986) Gehrels, N. 1986, ApJ, 303, 336
- Gehrels et al. (2004) Gehrels, N., Chincarini, G., Giommi, P., et al. 2004, ApJ, 611, 1005
- Gieren et al. (2005) Gieren, W., Pietrzyński, G., Soszyński, I., et al. 2005, ApJ, 628, 695
- Günther et al. (2020) Günther, M. N., Zhan, Z., Seager, S., et al. 2020, AJ, 159, 60
- Hachisu & Kato (2000) Hachisu, I. & Kato, M. 2000, ApJ, 540, 447
- Hachisu & Kato (2016) Hachisu, I. & Kato, M. 2016, ApJS, 223, 21
- Hachisu & Kato (2018) Hachisu, I. & Kato, M. 2018, ApJS, 237, 4
- Hachisu et al. (2000) Hachisu, I., Kato, M., Kato, T., & Matsumoto, K. 2000, ApJ, 528, L97
- Hillman et al. (2016) Hillman, Y., Prialnik, D., Kovetz, A., & Shara, M. M. 2016, ApJ, 819, 168
- Iłkiewicz et al. (2016) Iłkiewicz, K., Mikołajewska, J., Stoyanov, K., Manousakis, A., & Miszalski, B. 2016, MNRAS, 462, 2695
- Jencson et al. (2021) Jencson, J. E., Andrews, J. E., Bond, H. E., et al. 2021, ApJ, 920, 127
- Joshi et al. (2015) Joshi, V., Banerjee, D. P. K., Ashok, N. M., Venkataraman, V., & Walter, F. M. 2015, MNRAS, 452, 3696
- Kuijken (2011) Kuijken, K. 2011, The Messenger, 146, 8
- Lasota (2001) Lasota, J.-P. 2001, New A Rev., 45, 449
- Maoz et al. (2014) Maoz, D., Mannucci, F., & Nelemans, G. 2014, ARA&A, 52, 107
- Mason et al. (2012) Mason, E., Ederoclite, A., Williams, R. E., Della Valle, M., & Setiawan, J. 2012, A&A, 544, A149
- Mikolajewska (2010) Mikolajewska, J. 2010, arXiv e-prints, arXiv:1011.5657
- Mikołajewska (2012) Mikołajewska, J. 2012, Baltic Astronomy, 21, 5
- Modiano et al. (2020) Modiano, D., Parikh, A. S., & Wijnands, R. 2020, A&A, 634, A132
- Modiano et al. (2022) Modiano, D., Wijnands, R., Parikh, A., et al. 2022, A&A, 663, A5
- Munari (2019) Munari, U. 2019, arXiv e-prints, arXiv:1909.01389
- Munari et al. (2011) Munari, U., Joshi, V. H., Ashok, N. M., et al. 2011, MNRAS, 410, L52
- Munari & Renzini (1992) Munari, U. & Renzini, A. 1992, ApJ, 397, L87
- Munari & Valisa (2022) Munari, U. & Valisa, P. 2022, arXiv e-prints, arXiv:2203.01378
- Nomoto (1982) Nomoto, K. 1982, ApJ, 253, 798
- Page et al. (2022) Page, K. L., Beardmore, A. P., Osborne, J. P., et al. 2022, MNRAS, 514, 1557
- Page et al. (2020) Page, K. L., Kuin, N. P. M., Beardmore, A. P., et al. 2020, MNRAS, 499, 4814
- Page et al. (2015) Page, K. L., Osborne, J. P., Kuin, N. P. M., et al. 2015, MNRAS, 454, 3108
- Patat et al. (2011) Patat, F., Chugai, N. N., Podsiadlowski, P., et al. 2011, A&A, 530, A63
- Payne-Gaposchkin (1964) Payne-Gaposchkin, C. 1964, The Galactic Novae, DOVER BOOKS ON ASTRONOMY AND ASTROPHYSICS (Dover Publications)
- Poole et al. (2008) Poole, T. S., Breeveld, A. A., Page, M. J., et al. 2008, MNRAS, 383, 627
- Roming et al. (2005) Roming, P. W. A., Kennedy, T. E., Mason, K. O., et al. 2005, Space Sci. Rev., 120, 95
- Schaefer (2010) Schaefer, B. E. 2010, ApJS, 187, 275
- Sekiguchi et al. (1990) Sekiguchi, K., Whitelock, P. A., Feast, M. W., et al. 1990, MNRAS, 246, 78
- Shanks et al. (2015) Shanks, T., Metcalfe, N., Chehade, B., et al. 2015, MNRAS, 451, 4238
- Shara et al. (2018) Shara, M. M., Prialnik, D., Hillman, Y., & Kovetz, A. 2018, ApJ, 860, 110
- Shibayama et al. (2013) Shibayama, T., Maehara, H., Notsu, S., et al. 2013, ApJS, 209, 5
- Siegel et al. (2012) Siegel, M. H., Hoversten, E., Bond, H. E., Stark, M., & Breeveld, A. A. 2012, AJ, 144, 65
- Siegel et al. (2014) Siegel, M. H., Porterfield, B. L., Linevsky, J. S., et al. 2014, AJ, 148, 131
- Starrfield et al. (2016) Starrfield, S., Iliadis, C., & Hix, W. R. 2016, PASP, 128, 051001
- Starrfield et al. (1972) Starrfield, S., Truran, J. W., Sparks, W. M., & Kutter, G. S. 1972, ApJ, 176, 169
- Strope et al. (2010) Strope, R. J., Schaefer, B. E., & Henden, A. A. 2010, AJ, 140, 34
- Sutherland et al. (2015) Sutherland, W., Emerson, J., Dalton, G., et al. 2015, A&A, 575, A25
- Warner (1995) Warner, B. 1995, Cataclysmic variable stars, Vol. 28
- Werner et al. (2004) Werner, M. W., Roellig, T. L., Low, F. J., et al. 2004, ApJS, 154, 1
- Whitelock et al. (2009) Whitelock, P. A., Menzies, J. W., Feast, M. W., et al. 2009, MNRAS, 394, 795
- Yaron et al. (2005) Yaron, O., Prialnik, D., Shara, M. M., & Kovetz, A. 2005, ApJ, 623, 398
Appendix A Long-term UVOT light curve
In Fig. 5 we provide the long-term UVOT light curve of TUVO-22albb. Details of how this light curve is created are described in (Modiano et al. 2022; Sect. 2.6), and we refer to the reproduction package of this paper for further details. The light curve only shows one outburst detected from the source. This outburst is extensively discussed in the main text of the paper.
Appendix B Co-addition of exposures
Here we provide details for the observations used to create the light curve shown in Figs. 2 and 3. Table 2 summarises the observations that were used to study the outburst of the source.
As discussed in Sect. 2.2, some exposures in which there was no clear detection of the source were co-added. We chose the intervals over which to co-add exposures such that each co-added exposure resulted in a clear detection. The co-addition of exposures and the intervals that were co-added are detailed in Table 2. Co-addition was always performed independently for each filter, using the HEASoft (v6.29) tool uvotimsum121212https://heasarc.gsfc.nasa.gov/lheasoft/ftools/headas/uvotimsum.html.
For the two pre-outburst observations (ObsIDs 00030848002 and 00030848003), we co-added all exposures to check for a detection. Since no detection was made in either filter in the resulting co-added exposures, in Figs. 2 and 3 and in Table 2 we only include the individual exposures for those observations.
For all co-added exposures, the time stamps used for the light curve shown in Fig. 2 are the average of the time stamps of their constituent exposures, weighted by exposure time. The standard deviation on the time stamps (also weighted by exposure time) was used as the error on the time. For the exposures that were not co-added, we define the error bars on the time as the exposure times. However, these were not included in Fig. 2 because they were much smaller than the size of the markers.
Appendix C Photometry
Here we provide details about how we optimised the uvotsource photometry in order to obtain the most accurate results. We refer to the reproduction package of this paper for all the files and details needed to perform the photometry as described. We additionally provide a table of all the magnitudes measured from the UVOT data for all images in which a detection was made (Table 3). The magnitudes given were converted from fluxes after the corrections described in Sect. 2.2.
The aperture used for photometry was selected as a circular region of radius centred at the position of the transient. The aperture was checked by eye for each exposure, and the centre was manually adjusted if needed to account for small-scale misalignments between exposures (of 0.5; Poole et al. 2008). The radius of the aperture was chosen so as to optimise the signal-to-noise (SNR) on the data during the outburst peak (and then not modified for all other observations for consistency). Specifically, this was done in order to keep contamination from sources close to the transient position minimal. We note however that a smaller aperture radius of 1.5 was tested and had almost no effect on the photometry, because uvotsource corrects for aperture size. However, the measured fluxes still suffer from contamination from the high background emission at the source position (due to unresolved stars and diffuse emission objects in NGC 300; see Fig. 1). To take this effect into account, we used the same method described in Modiano et al. (2020), who encountered a similar issue with diffuse emission in the globular cluster 47 Tuc. The method consists of determining the flux at the source position by carrying out photometry using the same source aperture, but during quiescence (i.e. when the source was not detected; see Sect. 3.2). This ‘contamination flux’ is equal to the flux from other sources in NGC 300 at the source position. For each measured flux of the transient during the outburst, we subtracted this contamination flux, independently for each filter.
The instrumental background is accounted for automatically by uvotsource using a user-provided background region. We selected a background region near the edge of the exposures (far from the centre of NGC 300), to avoid over-correcting (because the galaxy background is already accounted for in our method).
For the pre-outburst and exposures, no source was detected in any of the exposures nor in the co-added exposures. We therefore reported the photometry on these data (in Fig. 2) for individual exposures. The photometry for these exposures was performed in the same exact way as for the detections, including the removal of the diffuse emission. Therefore they are all exhibit roughly zero flux (minor departures from zero, including to negative fluxes, are likely due to small-scale variations in the diffuse emission at the source position). To represent these as non-detections we, display them as open circles in Fig. 2.
To determine upper limits from the co-added quiescence exposures built from the entire archival UVOT data set of NGC 300 (except the outburst observations), we used a smaller aperture size of , to avoid contamination from bright objects close to the source position.
Appendix D XRT data
Here we provide details regarding the XRT data analysed. We used the online XRT analysis tool131313https://www.swift.ac.uk/user_objects/ developed by Evans et al. (2009) to build combined X-ray images of the field of TUVO-22albb in the energy ranges 0.3–10 keV, 0.3–1.5 keV, and 1.5–10 keV. We combined the outburst observations (ObsIDs 00030848001–00030848012; all in photon counting, PC, mode), resulting in a total of 84 ks of exposure time. We separately combined all quiescence observations (all other ObsIDs; also all in PC mode), which accounted for 500 ks of exposure time. No detections were made at the source position in either the combined outburst images or the combined quiescent images (in any of the energy ranges). We estimated upper limits using the Webpimms141414https://heasarc.gsfc.nasa.gov/cgi-bin/Tools/w3pimms/w3pimms.pl tool available from HEASARC, by inputting the predicted column density NH (at the source position) obtained using the NH tool151515https://heasarc.gsfc.nasa.gov/cgi-bin/Tools/w3nh/w3nh.pl, an expected power law index of 1.8 (similar to other quiescent symbiotics; see e.g. Bozzo et al. 2022), and the 3- confidence interval prescriptions from Gehrels (1986). We report unabsorbed X-ray 0.3–10 keV flux upper limits of 3.710-15 erg cm-2 s-1 and 6.210-16 erg cm-2 s-1 for outburst and quiescence, respectively. Using the distance to NGC 300 of 1.88 Mpc, we report upper limits on the outburst and quiescence X-ray luminosity of 1.61036 erg s-1 and 2.61035 erg s-1, respectively.
We inspected all individual XRT images during outburst by eye, and found no detections. We also checked the observation carried out 30 days after the outburst peak (ObsID 00035866004), and found a possible, faint detection (SNR ¡ 2), shown in Fig. 6. For the fluxes derived from this tentative detection, we used the same inputs as above (power-law index and NH), together with the measured count rate, to determine the flux (see Sect. 3.3). We did not check any subsequent XRT data by eye (all further observations were obtained over a year later).
| Filter | ObsID | No. of exposures | Total exp. time (s) | Co-added exposures? | Notes |
| 00030848002 | 10 | 9982 | No | Source never detected∗ | |
| 00030848003 | 15 | 9695 | No | Source never detected∗ | |
| 00030848004 | 15 | 9511 | No | ||
| 00030848005 | 15 | 9333 | No | ||
| 00030848006 | 11 | 7798 | No | ||
| 00030848007 | 7 | 8969 | No | ||
| 00030848008 | 7 | 2333 | No | ||
| 00030848009,00030848010 | 11,11 | 2410,4184 | Yes | ||
| 00030848009,00030848010 | 11,11 | 2725,4489 | Yes | ||
| 00030848011 | 11 | 7101 | Yes | ||
| 00030848012 | 11 | 2061 | Yes | Co-added exposures 1–6 | |
| 00030848012 | 11 | 1798 | Yes | Co-added exposures 7–11 |
∗ Co-addition was performed for this ObsID, but the source was not detected in any of the individual exposures nor in the co-added exposure. Therefore, in this table (and in Fig. 2) the exposures are not co-added.
| MJD | Days after peak | Filter | Magnitude |
| 54099.79 | -0.13 | 19.1 | |
| 54099.86 | -0.07 | 18.4 | |
| 54099.93 | 0.00 | 18.1 | |
| 54099.99 | 0.07 | 18.1 | |
| 54100.06 | 0.13 | 18.0 | |
| 54100.13 | 0.20 | 18.0 | |
| 54100.19 | 0.27 | 18.1 | |
| 54100.26 | 0.33 | 18.2 | |
| 54100.33 | 0.40 | 18.2 | |
| 54100.39 | 0.47 | 18.3 | |
| 54100.46 | 0.54 | 18.4 | |
| 54100.53 | 0.60 | 18.5 | |
| 54100.59 | 0.67 | 18.5 | |
| 54100.66 | 0.74 | 18.4 | |
| 54100.73 | 0.80 | 18.5 | |
| 54100.80 | 0.87 | 18.4 | |
| 54100.86 | 0.94 | 18.6 | |
| 54100.93 | 1.00 | 18.6 | |
| 54100.99 | 1.07 | 18.5 | |
| 54101.06 | 1.14 | 19.9 | |
| 54101.13 | 1.21 | 20.1 | |
| 54101.20 | 1.27 | 20.1 | |
| 54101.26 | 1.34 | 19.9 | |
| 54101.33 | 1.41 | 20.0 | |
| 54101.40 | 1.47 | 20.1 | |
| 54101.46 | 1.54 | 20.0 | |
| 54101.53 | 1.61 | 20.0 | |
| 54101.60 | 1.67 | 20.0 | |
| 54101.67 | 1.74 | 20.0 | |
| 54101.73 | 1.81 | 19.9 | |
| 54101.80 | 1.87 | 20.1 | |
| 54101.87 | 1.94 | 20.0 | |
| 54101.93 | 2.01 | 20.0 | |
| 54102.00 | 2.07 | 20.1 | |
| 54102.07 | 2.14 | 20.1 | |
| 54102.13 | 2.21 | 20.0 | |
| 54102.20 | 2.28 | 20.1 | |
| 54102.27 | 2.34 | 20.0 | |
| 54102.34 | 2.41 | 20.1 | |
| 54102.40 | 2.48 | 20.2 | |
| 54102.47 | 2.54 | 20.2 | |
| 54102.74 | 2.81 | 20.2 | |
| 54102.80 | 2.88 | 20.1 | |
| 54102.87 | 2.95 | 20.1 | |
| 54102.93 | 3.01 | 20.0 | |
| 54103.48 | 3.55 | 20.2 | |
| 54103.54 | 3.62 | 20.0 | |
| 54103.61 | 3.69 | 20.2 | |
| 54103.68 | 3.75 | 20.2 | |
| 54103.74 | 3.82 | 20.1 | |
| 54103.81 | 3.89 | 20.1 | |
| 54103.88 | 3.96 | 20.0 | |
| 54104.22 | 4.29 | 19.6 | |
| 54104.29 | 4.36 | 19.8 | |
| 54104.35 | 4.43 | 20.0 | |
| 54104.42 | 4.50 | 19.9 | |
| 54104.49 | 4.56 | 19.9 | |
| 54104.55 | 4.63 | 20.0 | |
| 54104.94 | 5.02 | 20.0 | |
| 54106.15 | 6.22 | 19.5 | |
| 54106.16 | 6.24 | 20.5 | |
| 54107.42 | 7.49 | 20.9 | |
| 54108.28 | 8.35 | 20.5 | |
| 54108.63 | 8.71 | 20.6 |
Notes. For details about how the fluxes were determined, see Sect. 2.2. The peak time is defined as MJD=54099.90. All magnitudes are in the AB system. Errors on magnitudes are all on the order of 0.1–0.2 mags. For the co-added exposures, the MJD given is the average of the time stamps of each individual exposures, weighted by exposure time.