Multi-Granularity Cross-modal Alignment for Generalized Medical Visual Representation Learning
Abstract
Learning medical visual representations directly from paired radiology reports has become an emerging topic in representation learning. However, existing medical image-text joint learning methods are limited by instance or local supervision analysis, ignoring disease-level semantic correspondences. In this paper, we present a novel Multi-Granularity Cross-modal Alignment (MGCA) framework for generalized medical visual representation learning by harnessing the naturally exhibited semantic correspondences between medical image and radiology reports at three different levels, i.e., pathological region-level, instance-level, and disease-level. Specifically, we first incorporate the instance-wise alignment module by maximizing the agreement between image-report pairs. Further, for token-wise alignment, we introduce a bidirectional cross-attention strategy to explicitly learn the matching between fine-grained visual tokens and text tokens, followed by contrastive learning to align them. More important, to leverage the high-level inter-subject relationship semantic (e.g., disease) correspondences, we design a novel cross-modal disease-level alignment paradigm to enforce the cross-modal cluster assignment consistency. Extensive experimental results on seven downstream medical image datasets covering image classification, object detection, and semantic segmentation tasks demonstrate the stable and superior performance of our framework.
1 Introduction
In recent decades, deep learning techniques have significantly advanced medical image understanding when large-scale labeled datasets are available ronneberger2015u ; gulshan2016development ; esteva2017dermatologist ; de2018clinically ; rajpurkar2018deep . However, assembling such large annotated data is expensive and time-consuming. As an alternative, learning directly from radiology reports accompanied by medical images becomes mainstream without any extra manual annotation, which aims to learn general medical vision representations from physicians’ detailed medical records and then transfer the learned representations to downstream tasks. In the previous literature, image-text contrastive learning has achieved huge success for a wide range of medical downstream tasks zhang2020contrastive ; huang2021gloria ; zhou2022generalized by predicting which radiology report goes with which medical image. Considering one limitation that pathologies usually occupy a small part of the whole image, Huang et al. huang2021gloria proposed attention-based contrastive learning strategy to learn local representations, which can capture fine-grained semantics in medical images to facilitate localized downstream tasks, e.g., medical object detection and medical semantic segmentation.
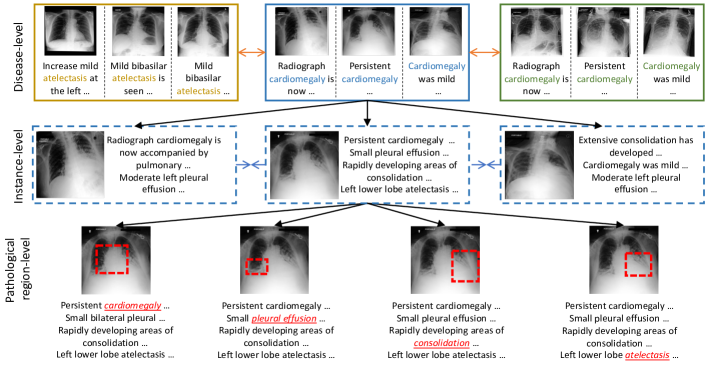
As we can see in Figure 1, medical images and radiology reports naturally exhibit multi-granularity semantic correspondence at different levels, e.g., disease-level, instance-level, and pathological region-level. However, existing image-text joint learning methods are limited to explore correspondence supervision from only a part of levels chen2020simple ; he2020momentum ; zhang2020contrastive ; huang2021gloria ; muller2021joint , leading to inefficient usage of the valuable medical image/report information and insufficient representation capability of models. Thus, how to effectively leverage this intrinsic multi-granularity cross-modal correspondences between medical images and radiology reports from all three levels to enhance medical visual representation remains an open question.
In this paper, we present a novel Multi-Granularity Cross-modal Alignment (MGCA) framework to seamlessly leverage the multi-granular semantic correspondences between medical images and radiology reports for generalized medical visual representation learning. Specifically, we incorporate well-known instance-wise alignment, fine-grained token-wise alignment, and disease-level alignment via contrastive learning to enhance the generalizability of learned visual representations. Particularly, for token-wise alignment, we introduce an effective bidirectional cross-attention strategy to explicitly learn the soft matching between local image-text representations, and then adopt a cross-modal contrastive learning scheme to improve the sensitivity of local features. For disease-level alignment, we leverage the inter-subject relationship correspondence between medical images and radiology reports by enforcing the cross-modal cluster assignment consistency. By exploiting multi-granular cross-modal correspondences from three aspects, our MGCA framework has the ability to boost downstream tasks at both image and pixel levels, where only limited annotated data are required. We pre-train our MGCA framework with a large-scale medical image and report dataset, i.e., MIMIC-CXR, and then validate our learned medical visual representations with seven downstream datasets, belonging to three medical tasks: image classification, object detection, and semantic segmentation. Experimental results demonstrate that our model achieves stable superior transfer performance even training with of training data, when compared with existing state-of-the-art medical image-text pre-training methods. Our code is in https://github.com/fuying-wang/MGCA.
2 Related Work
Learning Medical Visual Representations from Reports There are two mainstream paradigms to learn medical visual representations from report supervision. The first is to extract disease labels from radiology reports via human-designed rules irvin2019chexpert ; johnson2019mimic ; wang2017chestx and then pre-train an image model for downstream tasks. However, defining such rules requires a lot of human labor and expert knowledge. Also, the trained models may be suboptimal, as the extracted labels are usually noisy wang2017chestx . The second focuses on leveraging vision-language contrastive learning to pre-train image and text encoders in an unsupervised manner zhang2020contrastive ; huang2021gloria ; muller2021joint ; zhou2022generalized . Supervised by naturally occurring of medical images and radiology reports, these methods demonstrate remarkable performance in various medical image downstream tasks (e.g., image classification zhang2020contrastive ; huang2021gloria , semantic segmentation huang2021gloria , image-image retrieval zhang2020contrastive , image-text retrieval zhang2020contrastive ; huang2021gloria ). However, these methods only utilize partial correspondence supervision of cross-modal semantics, leading to suboptimal performance for downstream tasks.
Contrastive Learning Contrastive learning hadsell2006dimensionality ; chen2020simple ; he2020momentum ; feng2020parts2whole aims to learn an embedding space where positive instances stay close to each other, while negative pairs are far apart. One of the key technique is to find effective positive and negative pairs. To improve the efficiency of contrastive learning, some recent works proposed to predict one view’s representations from another view chen2020simple ; grill2020bootstrap . Moreover, chaitanya2020contrastive ; han2021pneumonia ; taleb2022contig ; feng2020parts2whole brought the power of contrastive learning into medical image domain and have achieved substantial performance . We refer the readers to the survey le2020contrastive ; jaiswal2020survey for more details. Recently, some prototypical contrast learning approaches were proposed to exploit the prototype-level semantics in the dataset. For example, li2020pcl ; wang2021unsupervised ; guo2022hcsc proposed contrasting instance features with its paired prototype features, while li2021contrastive ; caron2020unsupervised proposed clustering-based methods to contrast prototype-prototype pairs. Different from these methods working on a single modality, we propose a cross-modal prototype alignment module to exploit the cross-modal prototype-level semantic consistency.
Unsupervised Learning for Dense Prediction Learning fine-grained semantic correspondence is essential for dense prediction tasks, e.g., object detection everingham2010pascal ; lin2014microsoft , semantic segmentation cordts2016cityscapes , etc.Recent studies have proposed various paradigms to tackle this problem lee2018stacked ; huang2018learning ; li2019visual ; diao2021similarity ; xu2022groupvit . However, most of these methods require a pre-trained object detector to generate proposals of interested objects. Dense contrastive learning is thus proposed to learn fine-grained visual representations without a pre-trained object detector xie2021propagate ; xie2021detco ; wang2021dense ; chaitanya2020contrastive . By optimizing a contrastive loss at pixel-level (or region-level) between two views of input images, these methods effectively learn the correspondence between local features, which significantly benefits dense prediction tasks.
3 Method
3.1 Overview
We aim to learn a generalized medical image representations from radiology reports to benefit various downstream medical image recognition tasks where annotated data is limited. Given a training set of image-report pairs , we utilize an image encoder (e.g., ViT dosovitskiy2020vit ) and a text encoder (e.g., BERT devlin2018bert ) to map into the latent space , where . In detail, for the -th image-report pair , the image encoder generates a sequence of encoded visual tokens and a global image representation . Similarly, the text encoder generates a sequence of encoded text tokens and a global report representation . Here, and denote the total number of visual tokens and text tokens, respectively.
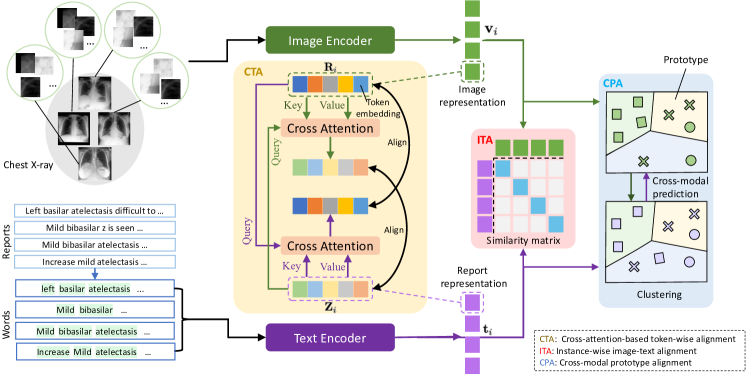
As illustrated in Figure 2, we design a novel multi-granularity cross-modal alignment framework for representation learning by exploiting the naturally exhibited multi-granularity cross-modal correspondences, i.e., disease (prototype)-level, instance-level, and pathology region (token)-level, between images and reports. Specifically, we incorporate an instance-wise image-text alignment (ITA) module to retain the cross-modal smoothness by maximizing the agreement between true image-report pairs versus random pairs. Meanwhile, to harness the benefits of naturally existing fine-grained correspondence between visual and text tokens, we also introduce a bidirectional cross-attention-based token-wise alignment (CTA) module to learn the soft matching between the visual token sequence and text token sequence , as well as align them via the contrastive learning. More important, we design a novel cross-modal prototype alignment (CPA) module to benefit the high-level semantic (e.g., disease) understanding by capturing the inter-subject relationship correspondence between two modalities.
3.2 Multi-granularity Cross-modal Alignment
Instance-wise Cross-modal Alignment
As the core workhorses in our framework, we incorporate an instance-wise Image-Text Alignment (ITA) module to encourage the framework to map correct image-report pairs nearby in the latent space, while mapping random pairs far apart. Specifically, following common practice chen2020simple , we first use two non-linear projection layers ( and ) to transform and into normalized lower-dimensional embeddings and , respectively. Then, the cosine similarity of -th image-report pair is denoted as:
| (1) |
For -th image-report pair in a minibatch, we regard two modality data as queries and keys alternatively to learn the correct image-report pairings. This results in two symmetric temperature-normalized InfoNCE oord2018cpc losses (image-to-text contrastive loss and text-to-image contrastive loss) to maximally preserve the mutual information between the true pairs in latent space:
| (2) |
where is the batch size and is the instance-level temperature hyperparameter. The overall objective of our instance-wise cross-modal alignment is the average of the two losses:
| (3) |
where is the total number of image-report pairs.
Token-wise Cross-modal Alignment
Fine-grained information is more significant in medical field: pathologies only occupy a small portion of the whole image and only a few disease tags in a report depict the crucial medical condition. Considering that these important subtle clues are likely to be ignored when optimizing the global instance-wise representations, we introduce an effective bidirectional Cross-attention-based Token-wise Alignment (CTA) module to explicitly match and align the cross-modal local presentations between medical images and radiology reports.
Specifically, for the -th image-report pair , the generated visual and text token embeddings will first be projected into normalized lower-dimensional embeddings, which results in and , where , . In order to conduct the token-wise alignment, we need to find the matching between visual and text tokens. Instead of directly computing the cosine similarity of different tokens huang2021gloria , we propose to calculate the soft matching between generated visual and text tokens with the cross-attention mechanism vaswani2017attention ; chen2019uniter ; lu2016hierarchical . Formally, for the -th visual token embedding in -th image-report pair, we let attend to all text token embeddings in and then calculate its corresponded cross-modal text embedding ,
| (4) |
where are learnable matrices. After that, we adopt a Local Image-to-text Alignment (LIA) loss to pull close to its cross-modal text embedding but push away from other cross-modal text embeddings, which maximizes the lower bound on local cross-modal mutual information within each image-report pair oord2018cpc . Considering that different visual tokens have various importance (e.g., visual tokens containing pathologies are obviously more important than those with irrelevant information), we further assign a weight to the -th visual token when calculating the LIA loss. So the LIA loss can be formulated as:
| (5) |
where is the token-level temperature hyperparameter. Similar with the instance-level alignment, we also employ two symmetric InfoNCE losses by taking the visual token embedding and its cross-modal text embedding as queries, respectively. Note that we set as the last-layer attention weight from -th visual token to [CLS] token averaged across multiple heads. Similarly, for -th text token embedding in -th image-report pair, we also calculate a cross-modal image embedding with the same manner and construct a Local Text-to-image alignment (LTA) loss by contrasting with . The final objective of our CTA module is the combination of LIA and LTA losses:
| (6) |
Discussion Note that our token-wise alignment is different from the local contrastive loss in huang2021gloria . Our module explicitly contrasts similarities between local tokens to maximize their mutual information and calculates per-token InfoNCE, whereas the local contrastive loss in huang2021gloria contrasts aggregated instance-level similarities and still calculates per-instance InfoNCE.
Disease-level Cross-modal Alignment
Both ITA and CTA treat two samples as a negative pair as long as they are from different instances. Many pairs sharing the similar high-level semantics (e.g., disease) are undesirably pushed apart in the embedding space. Therefore, we design a novel Cross-modal Prototype Alignment (CPA) module to harness the cross-modal inter-subject correspondences between medical images and reports.
For each image-report embedding pair in (1), we employ the iterative Sinkhorn-Knopp clustering algorithm cuturi2013sinkhorn to acquire two soft cluster assignment codes and , by individually assigning and into clusters. Meanwhile, we also pre-define trainable cross-modal prototypes as , where . After that, we calculate the visual softmax probability of the cosine similarities between and all cross-modal prototypes in , and the text softmax probability of the cosine similarities between and all cross-modal prototypes in ,
| (7) |
where is the prototype-level temperature parameter and indicates the -th element of the vector. The cross-modal disease-level (i.e., prototype) alignment is achieved by conducting cross-modal prediction and optimizing the following two cross-entropy losses:
| (8) |
Here, the cross-modal prediction is implemented by taking the soft text cluster assignment code as "pseudo-label" to train the image representation and taking the soft image cluster assignment code as "pseudo-label" to train the report representation . Finally, the overall CPA loss is the average of two prediction losses over all the image-report pairs:
| (9) |
3.3 Overall Objective
We train our MGCA framework with jointly optimizing the three cross-modal alignment modules, encouraging the network to learn discriminative and generalizable medical image representation. The overall training objective can be represented as:
| (10) |
where , , and are hyperparameters to balance three-level cross-modal alignments.
4 Experiments
We pre-train our MGCA framework on a large-scale medical image-report dataset and then evaluate the effectiveness of learned medical image representations on seven datasets from three important downstream tasks in medical imaging. In the following subsections, we first introduce the experimental setup of pre-training in Section 4.1 and three downstream tasks in Section 4.2. Then, we compare our proposed framework with state-of-the-art medical image-text pre-training methods and show the comparison results in Section 4.3-4.5. Finally, we analyze our framework in Section 4.6. More analysis results can be found in the Appendix.
4.1 Pre-Training Setup
Dataset
We pre-train our MGCA framework on the JPG version of MIMIC-CXR 2.0.0 dataset johnson2019mimic . We follow zhang2020contrastive to preprocess the dataset. We remove all lateral views from the dataset, as the downstream datasets only contain frontal-view chest images. Also, we extract the impression and finding sections from free-text reports to obtain detailed descriptions of medical diseases and remove reports which are empty or have less than tokens, resulting in roughly image-text pairs.
Implementation Details
Following huang2021gloria , we use BioClinicalBERT alsentzer2019publicly as the text encoder. We choose ViT-B/16 dosovitskiy2020vit as the image encoder backbone by default for unified modal architecture design. It is worth noting that our framework is model-agnostic to the image encoder backbone and we also report the results with ResNet50 he2016deep as image encoder backbone for fair comparison with other methods. We train our framework epochs on pieces of RTX 3090 GPUs with batch size of . The optimizer is AdamW loshchilov2017adamw with learning rate of and weight decay of . We use a linear warmup with cosine annealing scheduler loshchilov2016sgdr . We initialize learning rate as and warmup epoch as . Following the practice in contrastive learning chen2020simple ; he2020momentum , the dimension and the temperature hyperparameters are . The number of prototypes is . We set , , . More pre-training details can be found in the Appendix.
4.2 Downstream Tasks and Experimental Setup
Medical Image Classification
We conduct medical image classification on three representative datasets: (1) CheXpert irvin2019chexpert , which contains frontal chest radiographs. The task is to classify each image into individual binary labels: atelectasis, cardiomegaly, consolidation, edema, and pleural effusion. Following zhang2020contrastive ; huang2021gloria , we hold out the expert-labeled validation set as test data and randomly select radiographs from training data for validation. (2) RSNA Pneumonia shih2019rsna . We use the stage 2 version, which contains around frontal view chest radiographs. The task is a binary classification, i.e., classifying each chest image into normal or pneumothorax positive. Following huang2021gloria , we manually split the dataset into training, validation, and test set with ratio. (3) COVIDx wang2020covid , which contains over CXR images from a multinational cohort of over patients. This dataset contains positive COVID-19 images from over patients. We use the latest version 6 of this dataset. The task is a three-class classification, i.e., classifying each radiograph into COVID-19, non-COVID pneumonia or normal. We use the original validation dataset as test data and manually split of original training set for validation.
Following the previous work huang2021gloria , we use the Linear Classification setting to evaluate the transferability of our pre-trained image encoder, i.e., freezing the pre-trained ViT/ResNet-50 image encoder and only training a randomly initialized linear classification head for the downstream classification task. Also, we evaluate our model with , , and training data on each classification dataset to further verify the data efficiency of our method. We report area under the ROC curve (AUROC) on CheXpert and RSNA and acuracy (ACC) on COVIDx-v6 as the evaluation metric following zhang2020contrastive .
Medical Object Detection
We evaluate the localized performance of pre-trained image encoder on two object detection tasks: (1) RNSA Pneumonia shih2019rsna contains frontal view radiograph. The task is to predict bounding boxes indicating evidence of pneumonia. We randomly split the original training set into for training/validation/testing. (2) Object CXR jf2020object contains frontal-view chest X-rays with detection targets for foreign objects. We use the original development set as test set () and randomly split the original training set into training () and validation () sets.
We evaluate the detection performance by YOLOv3 redmon2018yolov3 frozen setting, i.e., using the pre-trained ResNet-50 image encoder as a frozen backbone of a YOLOv3 model and only fine-tuning the non-backbone layers. Similarly, we fine-tune the model by , and training data to evaluate the data efficiency. Mean Average Precisions (mAP) are reported as evaluation metric with IOU thresholds .
Medical Semantic Segmentation
We also evaluate the performance of our framework for medical semantic segmentation on SIIM and RNSA datasets: (1) SIIM Pneumothorax kaggle2019siim dataset contains chest radiographs with manually annotated segmentation mask of pneumothorax. Following huang2021gloria , train/validation/test split respectively constitutes // of original dataset. (2) RNSA Pneumonia shih2019rsna is with the same split protocol as object detection task. We convert object detection ground truths into masks for semantic segmentation.
Following huang2021gloria , we evaluate the segmentation performance by U-Net ronneberger2015u fine-tuning protocol. We use the pre-trained ResNet-50 image encoder as a frozen encoder backbone of U-Net and train the decoder portion using , and training data. Dice scores are reported to evaluate the segmentation performance. The other downstream experimental setup can be found in the Appendix.
| CheXpert (AUC) | RSNA (AUC) | COVIDx (ACC) | |||||||
|---|---|---|---|---|---|---|---|---|---|
| Method | 1% | 10% | 100% | 1% | 10% | 100% | 1% | 10% | 100% |
| Random Init | 56.1 | 62.6 | 65.7 | 58.9 | 69.4 | 74.1 | 50.5 | 60.3 | 70.0 |
| ImageNet Init | 74.4 | 79.7 | 81.4 | 74.9 | 74.5 | 76.3 | 64.8 | 78.8 | 86.3 |
| pre-trained on CheXpert | |||||||||
| DSVE engilberge2018dsve | 50.1 | 51.0 | 51.5 | 49.7 | 52.1 | 57.8 | - | - | - |
| VSE++ faghri2017vse++ | 50.3 | 51.2 | 52.4 | 49.4 | 57.2 | 67.9 | - | - | - |
| GLoRIA huang2021gloria | 86.6 | 87.8 | 88.1 | 86.1 | 88.0 | 88.6 | 67.3 | 77.8 | 89.0 |
| pre-trained on MIMIC-CXR | |||||||||
| Caption-Transformer cornia2020meshed | 77.2 | 82.6 | 83.9 | - | - | - | - | - | - |
| Caption-LSTM xu2015show | 85.2 | 85.3 | 86.2 | - | - | - | - | - | - |
| Contrastive-Binary tan2019lxmert su2019vl | 84.5 | 85.6 | 85.8 | - | - | - | - | - | - |
| ConVIRT zhang2020contrastive | 85.9 | 86.8 | 87.3 | 77.4 | 80.1 | 81.3 | 72.5 | 82.5 | 92.0 |
| GLoRIA-MIMIC huang2021gloria | 87.1 | 88.7 | 88.0 | 87.0 | 89.4 | 90.2 | 66.5 | 80.5 | 88.8 |
| MGCA(Ours, ResNet-50) | 87.6 | 88.0 | 88.2 | 88.6 | 89.1 | 89.9 | 72.0 | 83.5 | 90.5 |
| MGCA(Ours, ViT-B/16) | 88.8 | 89.1 | 89.7 | 89.1 | 89.9 | 90.8 | 74.8 | 84.8 | 92.3 |
| RSNA | Object CXR | |||||
|---|---|---|---|---|---|---|
| Method | 1% | 10% | 100% | 1% | 10% | 100% |
| Random | 1.00 | 4.00 | 8.90 | - | 0.49 | 4.40 |
| ImageNet | 3.60 | 8.00 | 15.7 | - | 2.90 | 8.30 |
| ConVIRT zhang2020contrastive | 8.20 | 15.6 | 17.9 | - | 8.60 | 15.9 |
| GLoRIA huang2021gloria | 9.80 | 14.8 | 18.8 | - | 10.6 | 15.6 |
| GLoRIA-MIMIC huang2021gloria | 11.6 | 16.1 | 24.8 | - | 8.90 | 16.6 |
| MGCA (Ours) | 12.9 | 16.8 | 24.9 | - | 12.1 | 19.2 |
| SIIM | RSNA | |||||
|---|---|---|---|---|---|---|
| Method | 1% | 10% | 100% | 1% | 10% | 100% |
| Random | 9.00 | 28.6 | 54.3 | 6.90 | 10.6 | 18.5 |
| ImageNet | 10.2 | 35.5 | 63.5 | 34.8 | 39.9 | 64.0 |
| ConVIRTzhang2020contrastive | 25.0 | 43.2 | 59.9 | 55.0 | 67.4 | 67.5 |
| GLoRIAhuang2021gloria | 35.8 | 46.9 | 63.4 | 59.3 | 67.5 | 67.8 |
| GLoRIA-MIMIC huang2021gloria | 37.4 | 57.1 | 64.0 | 60.3 | 68.7 | 68.3 |
| MGCA (Ours) | 49.7 | 59.3 | 64.2 | 63.0 | 68.3 | 69.8 |
4.3 Results
Results on Medical Image Classification Table 1 reports the results on three classification tasks. The results of other methods on CheXpert and RSNA are from original papers111 The results of ConVIRT zhang2020contrastive on RSNA dataset are from the reimplemented results in huang2021gloria as the RSNA dataset are updated by the organizer.. According to the pre-training dataset, we group the existing pre-training methods into two categories : pre-trained on CheXpert and pre-trained on MIMIC-CXR. As GLoRIA only reports results with pre-training on CheXpert dataset, we also reimplement their method with pre-training on MIMIC-CXR dataset (GLoRIA-MIMIC) for a fair comparison. It is observed that our MGCA with ViT-B/16 backbone shows the best performance in all nine settings, outperforming state-of-the-art GLoRIA huang2021gloria and ConVIRT zhang2020contrastive . With the same ResNet-50 image encoder backbone, our framework also achieves second-best performance on four settings and competitive performance on the remaining five settings, showing the effectiveness of our framework. When fine-tuning with proportion of data, our MGCA with ViT-B/16 backbone outperforms GLoRIA-MIMIC with AUROC on CheXpert, AUROC on RSNA dataset and ACC on COVIDx dataset, showing larger improvement than other methods and also indicating the data efficiency of our method.
Results on Medical Object Detection Table 2 reports the object detection performance on RSNA and Object CXR datasets. All methods adopt the same ResNet-50-YOLOv3 architecture. It is observed that under each setting, our MGCA outperforms ConVIRT, GLoRIA, and GLoRIA-MIMIC by a large margin. Importantly, our model shows superior detection performance when fine-tuning on training data, indicating that multi-granularity semantic alignment benefits the image encoder to learn more discriminative localized representations.
Results on Medical Semantic Segmentation Table 3 shows the semantic segmentation performance on SIIM and RSNA datasets with the same ResNet50-U-Net architecture. Compared with GLoRIA, GLoRIA-MIMIC, and ConVIRT, our MGCA shows higher dice scores on five over six settings. When training with portion of data, our MGCA achieves and Dice improvement than GLoRIA-MIMIC on SIIM and RSNA segmentation tasks, respectively. This comparison further validates the data efficiency of our method when transferring into dense prediction tasks.
| Training tasks | CheXpert (AUC) | RSNA (AUC) | SIIM (Dice) | ||||||||
|---|---|---|---|---|---|---|---|---|---|---|---|
| ITA | CTA | CPA | |||||||||
| ✓ | 87.6 | 88.2 | 88.5 | 88.4 | 89.5 | 90.5 | 25.0 | 43.2 | 59.9 | ||
| ✓ | ✓ | 88.3 | 88.9 | 89.1 | 88.9 | 89.8 | 90.7 | 47.6 | 54.4 | 61.3 | |
| ✓ | ✓ | 88.5 | 88.9 | 89.0 | 88.6 | 89.2 | 90.4 | 37.4 | 46.7 | 55.0 | |
| ✓ | ✓ | ✓ | 88.8 | 89.1 | 89.7 | 89.1 | 89.9 | 90.8 | 49.7 | 59.3 | 64.2 |
| CheXpert (AUC) | RSNA (AUC) | |||||
|---|---|---|---|---|---|---|
| BLIP li2022blip | 69.1 | 74.9 | 77.7 | 53.7 | 82.0 | 84.1 |
| MGCA (Ours) | 88.8 | 89.1 | 89.7 | 89.1 | 89.9 | 90.8 |
| CheXpert (AUC) | |||
|---|---|---|---|
| RSNA (AUC) | |||
| COVIDX (ACC) |
4.4 Analysis of Our Framework
Visualization
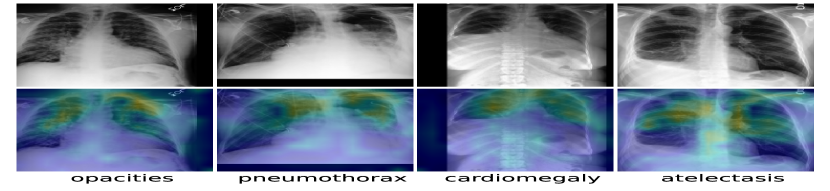
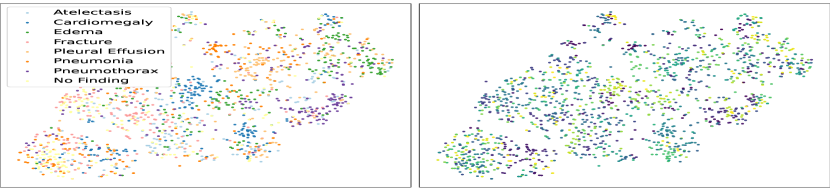
To better understand the behaviour of our MGCA framework, we visualize the learned local correspondence of radiographs and medical reports in Figure 3. Our MGCA learns meaningful local correspondence between visual tokens and text tokens, which is helpful for the local discriminative feature learning. Moreover, we select medical images, each with one excluded abnormality, and present t-SNE plots van2008visualizing in Figure 4 to visualize image embeddings. The colors represent the ground truth and cluster assignment in left and right sub-figures. It is observed that our multi-modal prototypes can learn reasonable disease-level semantic information.
Ablation Study of Component Design Table 4 shows the ablation study results on two settings: medical image classification on CheXpert and RSNA datasets with ViT-B/16 as the image encoder backbone, and medical semantic segmentation on SIIM dataset with ResNet50 as the image encoder backbone. It is observed that CTA and CPA modules can both improve the classification performance, indicating that token-level alignment and prototype-level alignment facilitate the image encoder to learn more generalizable representations for downstream tasks. When combining CTA and CPA, we can obtain further improvement on all datasets, indicating that the benefits of CTA and CPA are complementary. According to the results on SIIM dataset, we notice that CTA and CPA can both improve semantic segmentation performance when combined with ITA. Interestingly, CTA improves a larger margin on the semantic segmentation performance than CPA, which further elaborates that CTA is helpful to learn fine-grained information. When we train ITA, CTA, and CPA jointly, it achieves the best performance.
Results of Natural Vision-Language Pre-trained Model Table 5 shows the results of fine-tuning the state-of-the-art natural Vision-Language Pre-trained (VLP) model BLIP li2022blip , which is pre-trained on 14M image-text pairs. Due to the large domain discrepancy between natural image-text and medical image-text, directly transferring the pre-trained BLIP model to the downstream medical image tasks leads to inferior performance. This comparison indicates that pre-training on medical image-text datasets is necessary for capturing useful medical prior knowledge.
Analysis of Error Bars Table 6 shows error bars of our method on linear classification setting with ViT-B/16 as the image encoder backbone. We re-run each downstream task three times and calculate the mean and standard deviations. It is observed that the error bars are relatively small while comparing against other methods, which shows that our proposed method performs stably in these downstream tasks.
5 Discussion and Conclusion
This work presents MGCA, a multi-granularity cross-modal alignment framework for learning generalized medical visual representations from free-text radiology reports. By harnessing the naturally exhibited multi-granularity semantic correspondences across medical images and reports, our framework can learn generalized and discriminative medical image presentations for versatile downstream tasks to reduce the annotation burden. Extensive experimental results on seven downstream datasets demonstrate that our framework achieves substantial performance with limited annotated data.
Limitations and Future Work As our work mainly focuses on medical visual representation learning, we did not conduct experiments on image-image or image-text retrieval downstream tasks, which can be regarded as a limitation of our work. Our current framework learns the multi-granularity cross-modal alignment in parallel. In future work, we would like to explore how to leverage the multi-granularity correspondence in a holistic manner. Moreover, this paper mainly investigates the discrimination-based image-text pre-training. We also plan to extend our framework as the integration of discrimination-based and generation-based pre-training methods for medical image and text learning.
Social Impacts Our MGCA provides a promising solution to automatically diagnose abnormality of chest X-rays with limited annotated data, which can assist in reducing the workload of radiologists and promote the health in poor area. On the other hand, medical data (e.g., chest X-rays, radiology reports etc.) may contain unintended private information or harmful texts, and we highly recommend users conduct a careful analysis of data before employing our model into practical applications.
Acknowledgement
We gratefully thank HK HADCL for the support of this project. The work described in this paper is supported by HKU Seed Fund for Basic Research (Project No. 202009185079 and 202111159073).
References
- [1] E. Alsentzer, J. R. Murphy, W. Boag, W.-H. Weng, D. Jin, T. Naumann, and M. McDermott. Publicly available clinical bert embeddings. arXiv preprint arXiv:1904.03323, 2019.
- [2] M. Caron, I. Misra, J. Mairal, P. Goyal, P. Bojanowski, and A. Joulin. Unsupervised learning of visual features by contrasting cluster assignments. Advances in Neural Information Processing Systems, 33:9912–9924, 2020.
- [3] K. Chaitanya, E. Erdil, N. Karani, and E. Konukoglu. Contrastive learning of global and local features for medical image segmentation with limited annotations. Advances in Neural Information Processing Systems, 33:12546–12558, 2020.
- [4] T. Chen, S. Kornblith, M. Norouzi, and G. Hinton. A simple framework for contrastive learning of visual representations. In International conference on machine learning, pages 1597–1607. PMLR, 2020.
- [5] Y.-C. Chen, L. Li, L. Yu, A. El Kholy, F. Ahmed, Z. Gan, Y. Cheng, and J. Liu. Uniter: Learning universal image-text representations. ECCV, 2020.
- [6] M. Cordts, M. Omran, S. Ramos, T. Rehfeld, M. Enzweiler, R. Benenson, U. Franke, S. Roth, and B. Schiele. The cityscapes dataset for semantic urban scene understanding. In Proceedings of the IEEE conference on computer vision and pattern recognition, pages 3213–3223, 2016.
- [7] M. Cornia, M. Stefanini, L. Baraldi, and R. Cucchiara. Meshed-memory transformer for image captioning. In Proceedings of the IEEE/CVF Conference on Computer Vision and Pattern Recognition, pages 10578–10587, 2020.
- [8] M. Cuturi. Sinkhorn distances: Lightspeed computation of optimal transport. Advances in neural information processing systems, 26, 2013.
- [9] J. De Fauw, J. R. Ledsam, B. Romera-Paredes, S. Nikolov, N. Tomasev, S. Blackwell, H. Askham, X. Glorot, B. O’Donoghue, D. Visentin, et al. Clinically applicable deep learning for diagnosis and referral in retinal disease. Nature medicine, 24(9):1342–1350, 2018.
- [10] J. Devlin, M.-W. Chang, K. Lee, and K. Toutanova. Bert: Pre-training of deep bidirectional transformers for language understanding. arXiv preprint arXiv:1810.04805, 2018.
- [11] H. Diao, Y. Zhang, L. Ma, and H. Lu. Similarity reasoning and filtration for image-text matching. arXiv preprint arXiv:2101.01368, 2021.
- [12] A. Dosovitskiy, L. Beyer, A. Kolesnikov, D. Weissenborn, X. Zhai, T. Unterthiner, M. Dehghani, M. Minderer, G. Heigold, S. Gelly, et al. An image is worth 16x16 words: Transformers for image recognition at scale. arXiv preprint arXiv:2010.11929, 2020.
- [13] M. Engilberge, L. Chevallier, P. Pérez, and M. Cord. Finding beans in burgers: Deep semantic-visual embedding with localization. In Proceedings of the IEEE Conference on Computer Vision and Pattern Recognition, pages 3984–3993, 2018.
- [14] A. Esteva, B. Kuprel, R. A. Novoa, J. Ko, S. M. Swetter, H. M. Blau, and S. Thrun. Dermatologist-level classification of skin cancer with deep neural networks. nature, 542(7639):115–118, 2017.
- [15] M. Everingham, L. Van Gool, C. K. Williams, J. Winn, and A. Zisserman. The pascal visual object classes (voc) challenge. International journal of computer vision, 88(2):303–338, 2010.
- [16] F. Faghri, D. J. Fleet, J. R. Kiros, and S. Fidler. Vse++: Improving visual-semantic embeddings with hard negatives. arXiv preprint arXiv:1707.05612, 2017.
- [17] R. Feng, Z. Zhou, M. B. Gotway, and J. Liang. Parts2whole: Self-supervised contrastive learning via reconstruction. In Domain Adaptation and Representation Transfer, and Distributed and Collaborative Learning, pages 85–95. Springer, 2020.
- [18] S. for Imaging Informatics in Medicine. Siim-acr pneumothorax segmentation. 2019.
- [19] J.-B. Grill, F. Strub, F. Altché, C. Tallec, P. Richemond, E. Buchatskaya, C. Doersch, B. Avila Pires, Z. Guo, M. Gheshlaghi Azar, et al. Bootstrap your own latent-a new approach to self-supervised learning. Advances in Neural Information Processing Systems, 33:21271–21284, 2020.
- [20] V. Gulshan, L. Peng, M. Coram, M. C. Stumpe, D. Wu, A. Narayanaswamy, S. Venugopalan, K. Widner, T. Madams, J. Cuadros, et al. Development and validation of a deep learning algorithm for detection of diabetic retinopathy in retinal fundus photographs. Jama, 316(22):2402–2410, 2016.
- [21] Y. Guo, M. Xu, J. Li, B. Ni, X. Zhu, Z. Sun, and Y. Xu. Hcsc: Hierarchical contrastive selective coding. arXiv preprint arXiv:2202.00455, 2022.
- [22] R. Hadsell, S. Chopra, and Y. LeCun. Dimensionality reduction by learning an invariant mapping. In 2006 IEEE Computer Society Conference on Computer Vision and Pattern Recognition (CVPR’06), volume 2, pages 1735–1742. IEEE, 2006.
- [23] Y. Han, C. Chen, A. Tewfik, Y. Ding, and Y. Peng. Pneumonia detection on chest x-ray using radiomic features and contrastive learning. In 2021 IEEE 18th International Symposium on Biomedical Imaging (ISBI), pages 247–251. IEEE, 2021.
- [24] K. He, H. Fan, Y. Wu, S. Xie, and R. Girshick. Momentum contrast for unsupervised visual representation learning. In Proceedings of the IEEE/CVF conference on computer vision and pattern recognition, pages 9729–9738, 2020.
- [25] K. He, X. Zhang, S. Ren, and J. Sun. Deep residual learning for image recognition. In Proceedings of the IEEE conference on computer vision and pattern recognition, pages 770–778, 2016.
- [26] J. Healthcare. Object-cxr - automatic detection of foreign objects on chest x-rays. MIDL, 2020.
- [27] S.-C. Huang, L. Shen, M. P. Lungren, and S. Yeung. Gloria: A multimodal global-local representation learning framework for label-efficient medical image recognition. In Proceedings of the IEEE/CVF International Conference on Computer Vision, pages 3942–3951, 2021.
- [28] Y. Huang, Q. Wu, C. Song, and L. Wang. Learning semantic concepts and order for image and sentence matching. In Proceedings of the IEEE Conference on Computer Vision and Pattern Recognition, pages 6163–6171, 2018.
- [29] J. Irvin, P. Rajpurkar, M. Ko, Y. Yu, S. Ciurea-Ilcus, C. Chute, H. Marklund, B. Haghgoo, R. Ball, K. Shpanskaya, et al. Chexpert: A large chest radiograph dataset with uncertainty labels and expert comparison. In Proceedings of the AAAI conference on artificial intelligence, volume 33, pages 590–597, 2019.
- [30] A. Jaiswal, A. R. Babu, M. Z. Zadeh, D. Banerjee, and F. Makedon. A survey on contrastive self-supervised learning. Technologies, 9(1):2, 2020.
- [31] A. E. Johnson, T. J. Pollard, S. J. Berkowitz, N. R. Greenbaum, M. P. Lungren, C.-y. Deng, R. G. Mark, and S. Horng. Mimic-cxr, a de-identified publicly available database of chest radiographs with free-text reports. Scientific data, 6(1):1–8, 2019.
- [32] P. H. Le-Khac, G. Healy, and A. F. Smeaton. Contrastive representation learning: A framework and review. IEEE Access, 8:193907–193934, 2020.
- [33] K.-H. Lee, X. Chen, G. Hua, H. Hu, and X. He. Stacked cross attention for image-text matching. In Proceedings of the European Conference on Computer Vision (ECCV), pages 201–216, 2018.
- [34] J. Li, D. Li, C. Xiong, and S. Hoi. Blip: Bootstrapping language-image pre-training for unified vision-language understanding and generation. arXiv preprint arXiv:2201.12086, 2022.
- [35] J. Li, P. Zhou, C. Xiong, and S. C. Hoi. Prototypical contrastive learning of unsupervised representations. arXiv preprint arXiv:2005.04966, 2020.
- [36] K. Li, Y. Zhang, K. Li, Y. Li, and Y. Fu. Visual semantic reasoning for image-text matching. In Proceedings of the IEEE/CVF International conference on computer vision, pages 4654–4662, 2019.
- [37] Y. Li, P. Hu, Z. Liu, D. Peng, J. T. Zhou, and X. Peng. Contrastive clustering. In 2021 AAAI Conference on Artificial Intelligence (AAAI), 2021.
- [38] T.-Y. Lin, M. Maire, S. Belongie, J. Hays, P. Perona, D. Ramanan, P. Dollár, and C. L. Zitnick. Microsoft coco: Common objects in context. In European conference on computer vision, pages 740–755. Springer, 2014.
- [39] I. Loshchilov and F. Hutter. Sgdr: Stochastic gradient descent with warm restarts. arXiv preprint arXiv:1608.03983, 2016.
- [40] I. Loshchilov and F. Hutter. Decoupled weight decay regularization. arXiv preprint arXiv:1711.05101, 2017.
- [41] J. Lu, J. Yang, D. Batra, and D. Parikh. Hierarchical question-image co-attention for visual question answering. Advances in neural information processing systems, 29, 2016.
- [42] P. Müller, G. Kaissis, C. Zou, and D. Rückert. Joint learning of localized representations from medical images and reports. arXiv preprint arXiv:2112.02889, 2021.
- [43] A. v. d. Oord, Y. Li, and O. Vinyals. Representation learning with contrastive predictive coding. arXiv preprint arXiv:1807.03748, 2018.
- [44] P. Rajpurkar, J. Irvin, R. L. Ball, K. Zhu, B. Yang, H. Mehta, T. Duan, D. Ding, A. Bagul, C. P. Langlotz, et al. Deep learning for chest radiograph diagnosis: A retrospective comparison of the chexnext algorithm to practicing radiologists. PLoS medicine, 15(11):e1002686, 2018.
- [45] J. Redmon and A. Farhadi. Yolov3: An incremental improvement. arXiv preprint arXiv:1804.02767, 2018.
- [46] O. Ronneberger, P. Fischer, and T. Brox. U-net: Convolutional networks for biomedical image segmentation. In International Conference on Medical image computing and computer-assisted intervention, pages 234–241. Springer, 2015.
- [47] G. Shih, C. C. Wu, S. S. Halabi, M. D. Kohli, L. M. Prevedello, T. S. Cook, A. Sharma, J. K. Amorosa, V. Arteaga, M. Galperin-Aizenberg, et al. Augmenting the national institutes of health chest radiograph dataset with expert annotations of possible pneumonia. Radiology: Artificial Intelligence, 1(1):e180041, 2019.
- [48] W. Su, X. Zhu, Y. Cao, B. Li, L. Lu, F. Wei, and J. Dai. Vl-bert: Pre-training of generic visual-linguistic representations. arXiv preprint arXiv:1908.08530, 2019.
- [49] A. Taleb, M. Kirchler, R. Monti, and C. Lippert. Contig: Self-supervised multimodal contrastive learning for medical imaging with genetics. In Proceedings of the IEEE/CVF Conference on Computer Vision and Pattern Recognition, pages 20908–20921, 2022.
- [50] H. Tan and M. Bansal. Lxmert: Learning cross-modality encoder representations from transformers. arXiv preprint arXiv:1908.07490, 2019.
- [51] L. Van der Maaten and G. Hinton. Visualizing data using t-sne. Journal of machine learning research, 9(11), 2008.
- [52] A. Vaswani, N. Shazeer, N. Parmar, J. Uszkoreit, L. Jones, A. N. Gomez, Ł. Kaiser, and I. Polosukhin. Attention is all you need. Advances in neural information processing systems, 30, 2017.
- [53] L. Wang, Z. Q. Lin, and A. Wong. Covid-net: A tailored deep convolutional neural network design for detection of covid-19 cases from chest x-ray images. Scientific Reports, 10(1):1–12, 2020.
- [54] X. Wang, Z. Liu, and S. X. Yu. Unsupervised feature learning by cross-level instance-group discrimination. In Proceedings of the IEEE/CVF Conference on Computer Vision and Pattern Recognition, pages 12586–12595, 2021.
- [55] X. Wang, Y. Peng, L. Lu, Z. Lu, M. Bagheri, and R. M. Summers. Chestx-ray8: Hospital-scale chest x-ray database and benchmarks on weakly-supervised classification and localization of common thorax diseases. In Proceedings of the IEEE conference on computer vision and pattern recognition, pages 2097–2106, 2017.
- [56] X. Wang, R. Zhang, C. Shen, T. Kong, and L. Li. Dense contrastive learning for self-supervised visual pre-training. In Proceedings of the IEEE/CVF Conference on Computer Vision and Pattern Recognition, pages 3024–3033, 2021.
- [57] E. Xie, J. Ding, W. Wang, X. Zhan, H. Xu, P. Sun, Z. Li, and P. Luo. Detco: Unsupervised contrastive learning for object detection. In Proceedings of the IEEE/CVF International Conference on Computer Vision, pages 8392–8401, 2021.
- [58] Z. Xie, Y. Lin, Z. Zhang, Y. Cao, S. Lin, and H. Hu. Propagate yourself: Exploring pixel-level consistency for unsupervised visual representation learning. In Proceedings of the IEEE/CVF Conference on Computer Vision and Pattern Recognition, pages 16684–16693, 2021.
- [59] J. Xu, S. De Mello, S. Liu, W. Byeon, T. Breuel, J. Kautz, and X. Wang. Groupvit: Semantic segmentation emerges from text supervision. In Proceedings of the IEEE/CVF Conference on Computer Vision and Pattern Recognition, pages 18134–18144, 2022.
- [60] K. Xu, J. Ba, R. Kiros, K. Cho, A. Courville, R. Salakhudinov, R. Zemel, and Y. Bengio. Show, attend and tell: Neural image caption generation with visual attention. In International conference on machine learning, pages 2048–2057. PMLR, 2015.
- [61] Y. Zhang, H. Jiang, Y. Miura, C. D. Manning, and C. P. Langlotz. Contrastive learning of medical visual representations from paired images and text. arXiv preprint arXiv:2010.00747, 2020.
- [62] H.-Y. Zhou, X. Chen, Y. Zhang, R. Luo, L. Wang, and Y. Yu. Generalized radiograph representation learning via cross-supervision between images and free-text radiology reports. Nature Machine Intelligence, pages 1–9, 2022.
Checklist
-
1.
For all authors…
-
(a)
Do the main claims made in the abstract and introduction accurately reflect the paper’s contributions and scope? [Yes]
-
(b)
Did you describe the limitations of your work? [Yes] See the second paragraph in Section 5.
-
(c)
Did you discuss any potential negative societal impacts of your work? [Yes] See the last paragraph in Section 5.
-
(d)
Have you read the ethics review guidelines and ensured that your paper conforms to them? [Yes]
-
(a)
-
2.
If you are including theoretical results…
-
(a)
Did you state the full set of assumptions of all theoretical results? [N/A] Our work mainly involves empirical contributions.
-
(b)
Did you include complete proofs of all theoretical results? [N/A] Our work mainly involves empirical contributions.
-
(a)
-
3.
If you ran experiments…
-
(a)
Did you include the code, data, and instructions needed to reproduce the main experimental results (either in the supplemental material or as a URL)? [Yes] See the Section 4.1 for pre-training dataset and model details. More experimental details is included in the supplementary material. Our code is in the supplementary material and will be released later.
-
(b)
Did you specify all the training details (e.g., data splits, hyperparameters, how they were chosen)? [Yes] See Section 4.2 for data splits. Most of dataset details are following previous work.
-
(c)
Did you report error bars (e.g., with respect to the random seed after running experiments multiple times)? [No]
-
(d)
Did you include the total amount of compute and the type of resources used (e.g., type of GPUs, internal cluster, or cloud provider)? [Yes] See the second paragraph of Section 4.1.
-
(a)
-
4.
If you are using existing assets (e.g., code, data, models) or curating/releasing new assets…
- (a)
-
(b)
Did you mention the license of the assets? [Yes] All dataset are publicly available. They are under a non-commercial license.
-
(c)
Did you include any new assets either in the supplemental material or as a URL? [Yes] Our code and pre-trained model will be released later for the assets.
-
(d)
Did you discuss whether and how consent was obtained from people whose data you’re using/curating? [N/A] We are using publicly available datasets for all experiments.
-
(e)
Did you discuss whether the data you are using/curating contains personally identifiable information or offensive content? [N/A] We are using publicly available datasets for all experiments. No personally identifiable information involved.
-
5.
If you used crowdsourcing or conducted research with human subjects…
-
(a)
Did you include the full text of instructions given to participants and screenshots, if applicable? [N/A] No human subjects involved in our experiments.
-
(b)
Did you describe any potential participant risks, with links to Institutional Review Board (IRB) approvals, if applicable? [N/A] No human subjects involved in our experiments.
-
(c)
Did you include the estimated hourly wage paid to participants and the total amount spent on participant compensation? [N/A] No human subjects involved in our experiments.
-
(a)