Field Induced Multiple Superconducting Phases in UTe2 along Hard Magnetic Axis
Abstract
The superconducting (SC) phase diagram in uranium ditelluride is explored under magnetic fields () along the hard magnetic -axis using a high-quality single crystal with K. Simultaneous electrical resistivity and AC magnetic susceptibility measurements discern low- and high-field SC (LFSC and HFSC, respectively) phases with contrasting field-angular dependence. Crystal quality increases the upper critical field of the LFSC phase, but the of T, at which the HFSC phase appears, is always the same through the various crystals. A phase boundary signature is also observed inside the LFSC phase near , indicating an intermediate SC phase characterized by small flux pinning forces.
Uranium ditelluride (UTe2) has attracted considerable attention as a strong candidate for spin-triplet and topological superconductivity. Ran et al. [1] initially reported unconventional superconductivity of this compound with a superconducting (SC) transition temperature () of 1.6 K and vast upper critical field () that exceeds the Pauli-limiting field. Slight decreases in the nuclear magnetic resonance (NMR) shift strongly suggest the spin-triplet SC pairing under ambient pressure [2, 3, 4]. Meanwhile, the discovery of multiple SC phases under pressure further supports spin-triplet formation with spin-degrees of freedom [5, 6, 7, 8]. The topological aspect of the SC state is experimentally suggested through scanning tunneling microscopy [9], polar Kerr effect [10], and London penetration depth [11] measurements.
UTe2 crystallizes in a body-centered orthorhombic structure () [12, 13]. Magnetic-field-reinforced superconductivity, an extraordinary phenomenon in UTe2, appears when a magnetic field () is applied along the crystallographic -axis, which is perpendicular to the easy magnetic -axis, along which uranium spin moments favor aligning with an Ising character [14, 15, 16, 17, 18]. In , initially decreases with increasing , and then starts to increase above T, i.e., a characteristic ‘’-shape appears. Superconductivity persists up to a metamagnetic transition at T and suddenly disappears above .
Previously, one might assume a uniform SC state was realized in UTe2 below the -shape because an internal transition could not be found. However, two discernible SC phases in the case of are reported by specific heat measurement using a crystal with K in the case of [19], which is also detected by AC magnetic susceptibility () for a crystal of K [20]. Remarkably, a second-order phase transition is observed inside the SC state, which separates the low- and high-field SC (LFSC and HFSC, respectively) phases with T. As a thermodynamic consideration [21], however, three second-order transition lines cannot meet at a single point unless another line emerges from here. These results motivate us to continue the studies using a higher-quality single crystal.
The SC properties of UTe2 clearly depend on the sample quality. Since impurity effects are completely unknown in rare spin-triplet SC cases, it is exceptionally necessary to remove defects as much as possible. Although growth condition optimization using a chemical vapor transport (CVT) method increased up to 2 K and the residual resistivity ratio (RRR) up to 88 [22, 23], CVT crystals still contain a small number of uranium vacancies within 1% –even in high crystals [24, 25]. Recently, UTe2 crystals higher of 2.1 K and larger RRRs far over 100 have been grown using the molten salt flux (MSF) method [26]. Successful detection of de Haas–van Alphen oscillation signals [27] guarantees the crystals of high quality with a long mean free path and lower impurity scatterings. In this letter, we explore the SC phase diagram of such an ultla-clean UTe2 crystal obtained by the MSF growth to search for a missing phase line inside of the SC state. For this purpose, the electrical resistivity () and change of were in situ measured simultaneously on an identical crystal.
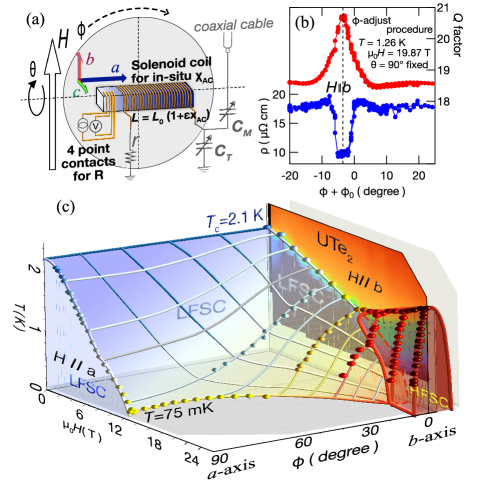
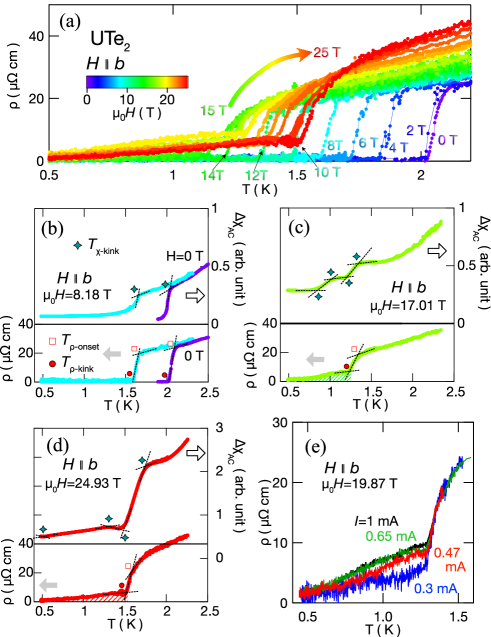
Figure S2(a) schematically illustrates the experimental setup of this study. A crystal was selected with a size of mm3 and RRR=180. The crystal was mounted on a two-axis goniostage, and the probe was inserted into a 3He cryostat. was measured using the AC four-probe method with a current of 0.3 mA. The resonance frequency of the circuit is , where and are the inductance and capacitance, respectively. If is reduced due to SC diamagnetism, decreases, where is a filling factor of the sample to the coil. Consequently, the onset was detected as a kink in . Here, we set MHz by tuning the variable capacitors shown in Fig. S2(a), which were fixed during measurements. External fields were applied using a 25 T cryogen-free SC magnet (25T-CSM) in the High Field Laboratory for Superconducting Materials (HFLSM), IMR, Tohoku University. We could precisely adjust the orientation along the crystal -axis by monitoring and the quality factor () of the RF circuit by rotating the goniostage, as shown in Fig. S2(b), where is proportional to .
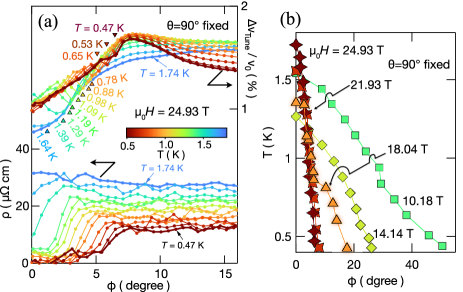
In this study, the distinction between the LFSC and HFSC phases was observed based on their orientation dependence, which is summarized as a three-dimensional phase diagram in Fig. S2(c). To determine of each phase, the kink of is tracked by rotating the field angle from the and directions (See the Supplementary Material (SM)[28].) As also shown in this figure, the HFSC phase is rapidly suppressed when is turned away from the direction, whereas the LFSC phase is much more robust to the . The strong dependence of the HFSC state is consistent with that of a previous study on CVT-grown crystals [15]. The narrow field-angle HFSC phase is also observed in ferromagnetic (FM) superconductors UCoGe and URhGe when the field is rotated around the magnetically hard axis [29, 30]. For these FM superconductors, the behavior is considered a consequence of -induced suppression of Ising-type, longitudinal FM spin fluctuations, as detected by NMR [31, 32]. However, this longitudinal mode of fluctuations in the high has not been confirmed yet in UTe2.
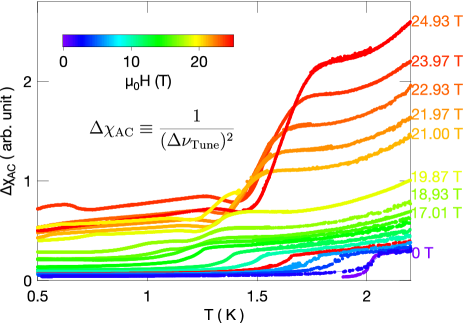
Hereafter, we focus on the experiments of applying along the -axis. Figure 2(a) shows the dependence of at various along the -axis (also see the SM [28]). The change of AC magnetic susceptibility is defined as . The results of simultaneous measurements are presented in the SM [28]. At zero field, as shown in Figs. 2(a) and 2(b), drops at K and becomes zero below K. also exhibits a kink at the same temperature (denoted as ). Similarly, we can recognize related anomalies that correspond to , , and for the data in T.
As for the data in T, we can still recognize anomalies for K and K. Meanwhile, the anomaly in at is no longer a distinct kink but becomes a shoulder-like bend. Notably, the value of remains finite below . As the is further lowered, gradually decreases and finally drops to zero at of 0.5 K. In Figs. 2(c) and 2(d), we hatch the area where is finite below . The finite is attributed to the so-called flux-flow resistivity, which is also supported by the current () dependence of , as shown in Fig. 2(e). Notably, this flux-flow resistivity appears only above T, as shown in Fig. 2(a) (also see the SM[28]). In high fields, bends slightly above and multiple kinks are observed as is further lowered, (e.g., see Fig. 2(c)). In T, as shown in Fig. 2(d), the first kink of appears at K higher than K, and then multiple kinks appear at lower temperatures.
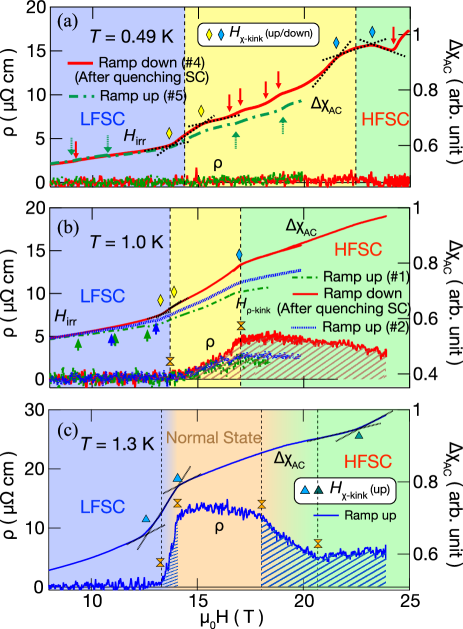
Subsequently, let us turn to scans along the -axis. Figure 3 shows the -dependence of and at , 1.0, and 1.3 K. In some cases, the measurements were performed with ramping up and down of to confirm a hysteretic behavior (also see the SM [28]). At the lowest of 0.49 K, is zero in the field range of T. Also, above T, a very small finite resistivity corresponding to the flux flow resistivity seems to appear. However, it is observed just barely because the temperature is quite low relative to . The exhibits several kinks ( marks in Fig. 3(a)). In addition, minor step anomalies by small flux jumps are randomly observed (small arrows in Fig. 3(a)), along with a hysteretic behavior above T. Note that the kinks marked by in Fig. 3(a) appear in the same fields, despite this hysteresis.
At 1.0 K, the hysteretic behavior is observed in above T, suggesting a non-equilibrium depinning phase transition from a static (pinned) vortex state to a mobile vortex state. As increases above T, becomes finite, then it saturates at T, as marked by opposite-triangles ( ) in Fig. 3(b). Here, the finite corresponds to the flux-flow resistivity described above. In contrast, at K (Fig. 3(c)), as increases from 5 T, the static vortex state in the LFSC phase suddenly collapses at T and undergoes a transition completely to the normal state at T. As further increases, the onset of the HFSC state is observed at T. Above this field, decreases gradually, and becomes almost constant above T. This again corresponds to the flux-flow resistivity.
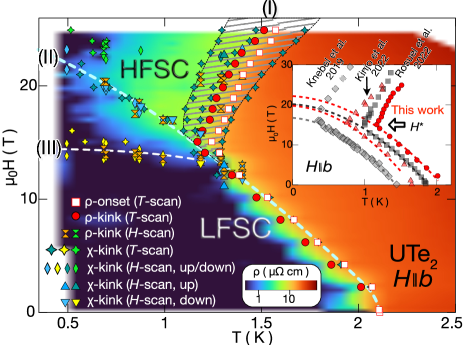
We summarize our experimental observations in as the – phase diagram. In Fig. 4, we plot the characteristic temperatures and fields at which anomalies are observed in and/or . We also show the color contour of in the same figure to identify the region where the flux-flow resistivity appears. For the LFSC phase, the onset of K at zero field is gradually suppressed by applying and is continued to the kinks in and in the SC state, labeled as (II) above T. Extrapolation of boundary (II) provides the upper critical field of the LFSC phase to be around 22 T.
On the other hand, the HFSC phase emerges above , of which the boundary is labeled as (I) in Fig. 4. Boundary (I) is much broader than boundary (II). For both and , the separation between the onset and kink temperatures becomes much more significant than that in the LFSC transition. In addition, the kinks in are seen on both the high and low-temperature side of is seen. This broad feature of boundary (I) is consistent with the very broad peak observed in the specific heat for the HFSC transition, and the thermal expansion anomaly at in the HFSC phase, which becomes quite blurred compared to that in the LFSC phase [19]. Remarkably, as shown in Fig. 4, the flux-flow resistivity is observed in a wide range of the HFSC phase below , and zero resistivity appears only deep inside of the SC state [15, 19]. Such a broadening of boundary (I) can be caused by flux motions due to SC fluctuations yielded in the high .
The current study found an additional boundary called (III) (Fig. 4) that appears inside the LFSC phase. Boundary (III) is detected most clearly as the kink in from the scan. Above 0.7 K, it is also observable as , corresponding to the onset of flux-flow resistivity. As illustrated in Fig. 4, boundary (III) locates near and is nearly -independent. Thus, this boundary is challenging to detect using specific heat or other thermodynamic probes with scans. Recent specific heat measurement as a function of [19] does not exhibit an apparent anomaly corresponding to the boundary (III), suggesting that a significant entropy change does not accompany the phase transition at (III). Note that the flux-flow resistivity occurs between boundaries (II) and (III), while it is absent below boundary (III). Thus, the area between boundaries (II) and (III) is characterized by highly mobile vortices, similar to the HFSC phase. Boundary (III) may become noticeable because pinning centers have been significantly reduced in the high-quality crystal. Note that the boundary (III) does not coincide with where the hysterical behavior begins as denoted above as T and T (also see the SM [28]).
Boundary (III) detected inside the LFSC phase near indicates the possible existence of an intermediate SC phase characterized by a small flux pinning force between and . Thus, from the thermodynamic consideration[21], boundary (III) could be the missing transition line in the previously proposed phase diagram in UTe2. However, whether this boundary is indeed connected to the intersection of the phase lines of boundaries (I) and (II) has not also been confirmed thus far. Whether the boundary (III) is an actual thermodynamic phase transition should also be confirmed.
The observation of boundary (III) also raises the possibility that the area between boundaries (II) and (III) can be regarded as a new intermediate phase, possibly emerging as a mixture of LFSC and HFSC states. Following a recent theoretical work [33], such a mixed state could be understood as the anapole SC phase if the LFSC and HFSC states might have different parity. The order parameters of the anapole SC phase are equivalent to an anapole (magnetic toroidal) moment and stabilize a non-uniform Fulde–Ferrell–Larkin–Ovchinnikov (FFLO) state. Highly mobile vortices with small currents might be expected in such an FFLO state. Furthermore, domain alignment by supercurrent may assist flux mobility. [33]. Alternatively, chiral SC symmetry proposed in UTe2 [9, 10, 34, 11] might also explain the vortex mobility by SC currents because the directionality of SC pairing can form SC domains.
In the inset of Fig. 4, we compare in reported for UTe2 crystals with different qualities [15, 20, 19]. Evidently, quality improvement rapidly increases both the onset and extrapolated (also see the SM [28]). However, the characteristic field of T, above which the HFSC phase emerges on top of the LFSC phase, remains unchanged. This result might indicate that is concerned with an internal electronic phase transition, such as a metamagnetic cross-over or Lifshitz transition. In the case of , such a transition seems to boost the SC above 7 T [35]. However, in , no signature of the electronic transition was found in the normal state around 15 T. Because is found to be independent of sample quality, the bounday (III), which branches off almost horizontally from , most likely does not change its position much. Then, and the bounday (III) are probably too close to each other in the low- samples to be detected separetely.
In the last, we also note that the kink anomalies rest in the low-temperature high- region above phase line (II) shown as yellow-green-colored marks in Fig.4. These high- anomalies may also have been due to the flux dynamics of a vortex lattice and melting. Hence, further experiments are required to examine flux dynamics at higher .
Acknowledgements.
We thank M. Nagai and K. Shirasaki for their support in the experiments. We are also grateful for the stimulating discussions with K. Kubo, Y. Nagai, M. Machida, K. Ishida, H. Ikeda, K. Machida, and Y. Yanase. This work (a part of high magnetic field experiments) was performed at HFLSM under the IMR-GIMRT program (Proposal Numbers 202012-HMKPB-0012, 202112-HMKPB-0010, and 202112-RDKGE-0036). A part of this work was also supported by JSPS KAKENHI Grant Nos. JP16KK0106, JP17K05522, JP17K05529, and JP20K03852, JP20K03852, JP20H00130, JP20KK0061, and JP22H04933, and by the JAEA REIMEI Research Program.I Supplementary Materials [28]
I.1 Magnetic field orientation dependence of and in
As shown in Fig. S2(a), we define the superconducting (SC) onset by the kink of . At the same time, the SC onset can be confirmed by the drop of . As seen in Fig S2(b), the HFSC state for and 21.93 T is quenched by the rotation of o from the to the direction. In contrast, the data for and 10.18 T correspond to a wide LFSC range with the -rotation. Interestingly, the data for T shows two humps corresponding to the LFSC and HFSC phases, respectively.
I.2 Temperature dependence of electrical resistivity for various magnetic fields along the axis in
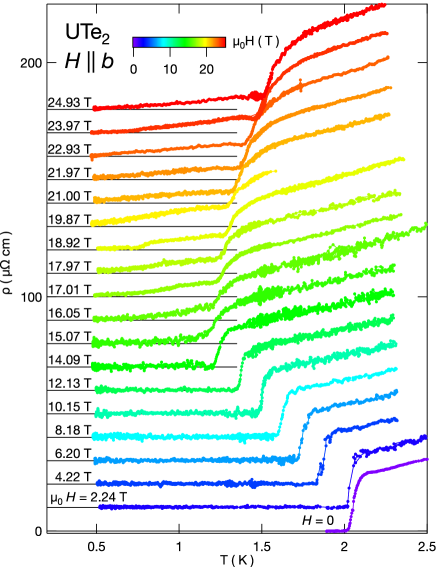
The temperature dependence of electrical resistivity on various magnetic fields along the -axis presented as Fig. 2(a) in the main text is replotted as Fig. S3 with each data shifted vertically by 10 cm. In the lower fields below T, the superconductivity occurs rather sharply at , while the SC transition becomes rather broader above .
As described in the main text, the flux-flow resistivity is clearly seen for the field of in the wider temperature range. The resistivity at is no longer a distinct kink but becomes a shoulder-like bend, then the flux-flow resistivity remains below , which gradually decreases as temperature decreases.
I.3 Temperature dependence of for various magnetic fields along the axis in
The change of AC magnetic susceptibility is formally defined as with , where MHz. After the resonant frequency, MHz and the RF matching were adjusted at 4 K using the variable capacitors shown in Fig. 1(a). Figure S4 shows the temperature dependence of at various magnetic fields along the axis. In the lower fields than T, the kink of at corresponds to the where becomes zero. On the other hand, in the higher fields than , the kink of at becomes broad. The kink of at no longer match or . Note that although the apparent for high fields appears large, this is due to the formal definition, and does not mean that the actual is large.
I.4 Close look of the along the -axis in
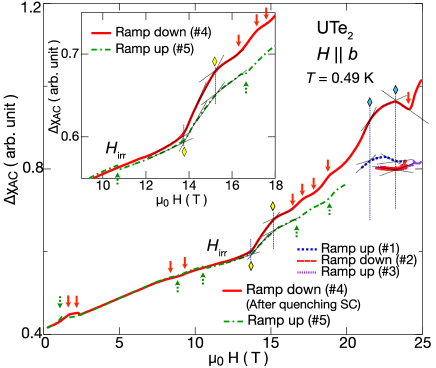
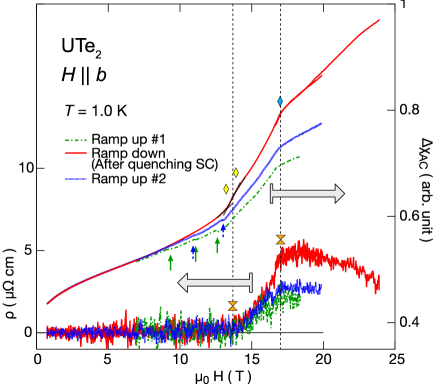
Figure S5 shows the field dependence of at 0.49 K. In the initial run, the data acquisition started from 21.04 T, then the field was ramped up to 23.91 T (#1), then ramped down to 21.94 T (#2), and ramped up to 24.93 T (#3). To reset the field history, the sample was rotated from the direction to quench the SC state, and then the magnetic field direction was precisely set to the direction again. Afterward, the second run was started by lowering the field down to 0.24 T (#4) and ramped up to 19.88 T (#5). The data above 8 T for the above procedures of #4 and #5 are the same as shown in Fig. 3(a) of the main text.
At low fields of 2-3 T, in addition to around 10 T, flux jumps were observed in the ramp-up and down sequences, but each occurred at entirely different magnetic fields. For example, although no kink appeared around 10.7 T in the ramp-down sequence #4, a slight kink at 10.7 T was observed when the field was ramped up #5. When such a flux jump occurred, a sudden small change and/or a slight kink was seen in . Similarly, such minor kinks due to flux jumps were observed in the higher fields above as shown in Fig. S5.
On the other hand, at the regular fields (), which are marked by diamonds in Figs. 3(a) and S5, a large kinks are observed. These fields can be tracked by the data for different temperatures as plotted in – phase diagram. The hysteretic behavior in appears above T, suggesting a non-equilibrium depinning phase transition from a static (pinned) vortex state to a mobile vortex state.
Figure S6 shows the field dependence of at 1.0 K, together with the electrical resistivity . For 1.0 K, the experimental procedure was as follows: (i) ramp up (#1) from 2 T to 18.5 T (the data acquisition was started from about 7 T), (ii) quench the SC state by tilting largely from the axis at 18.5 T, then reorient to the axis, then ramp up to 24 T, (the data acquisition was paused during the field ramping) (iii) ramp down to 0.7 T, and finally (iv) ramp up again to 20 T (#2). As shown in Fig. S6, the hysteretic behavior at 1.0 K is observed in above T.
I.5 Comparison with previously reported SC – phase diagram along the -axis in
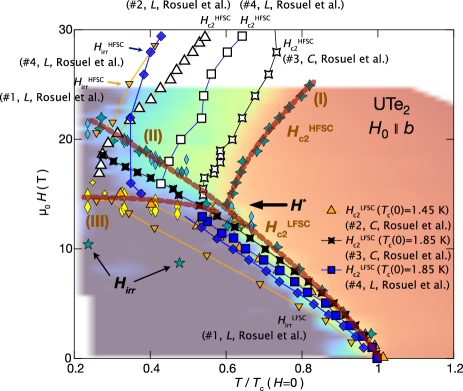
As shown in Fig. S7, the SC phase diagram is plotted together with the reported and for the several sample with different in Ref. [19]. The horizontal axis is normalized for comparison purposes by the respective . The boundaries (I), (II), and (III) in our sample are schematically drawn, as shown in Fig.4 of the main text.
As described in the main text, this comparison phase diagram shows that the emergent field of the HFSC phase is not sample-dependent. Next, we can see that the of the LFSC phase has a weak sample dependence but is larger for higher sample. Furthermore, , i.e., the boundary (I) is seen shifting to the higher temperature side as is higher.
As reported in Ref. [19], the irreversible field was determined by the linear magnetostriction measurement, which observes strong vortex pinning in the mixed state of type II superconductors. The seems to appear in different positions depending on the sample quality and , which may be dependent on concentrations of the flux-pinning centers. It can also be seen that the temperature dependence of is almost similar to on the lower-temperature side of for the respective sample.
As seen in Fig. S7, the for the MSF-grown crystal with K [26], which is observed in the field-swept measurement described in the main text, appears deep inside the LFSC phase. It may mean that the flux-pinning centers induced by uranium defects are scarce in the crystal. With this comparison, it can also be emphasized that the does not coincide with the boundary (III).
References
- Ran et al. [2019a] S. Ran, C. Eckberg, Q.-P. Ding, Y. Furukawa, T. Metz, S. R. Saha, I.-L. Liu, M. Zic, H. Kim, J. Paglione, and N. P. Butch, Science 365, 684 (2019a).
- Nakamine et al. [2019] G. Nakamine, S. Kitagawa, K. Ishida, Y. Tokunaga, H. Sakai, S. Kambe, A. Nakamura, Y. Shimizu, Y. Homma, D. Li, F. Honda, and D. Aoki, Journal of the Physical Society of Japan 88, 113703 (2019).
- Nakamine et al. [2021] G. Nakamine, K. Kinjo, S. Kitagawa, K. Ishida, Y. Tokunaga, H. Sakai, S. Kambe, A. Nakamura, Y. Shimizu, Y. Homma, D. Li, F. Honda, and D. Aoki, Phys. Rev. B 103, L100503 (2021).
- Fujibayashi et al. [2022] H. Fujibayashi, G. Nakamine, K. Kinjo, S. Kitagawa, K. Ishida, Y. Tokunaga, H. Sakai, S. Kambe, A. Nakamura, Y. Shimizu, Y. Homma, D. Li, F. Honda, and D. Aoki, Journal of the Physical Society of Japan 91, 043705 (2022).
- Braithwaite et al. [2019] D. Braithwaite, M. Vališka, G. Knebel, G. Lapertot, J. P. Brison, A. Pourret, M. E. Zhitomirsky, J. Flouquet, F. Honda, and D. Aoki, Communications Physics 2, 147 (2019).
- Ran et al. [2020] S. Ran, H. Kim, I.-L. Liu, S. R. Saha, I. Hayes, T. Metz, Y. S. Eo, J. Paglione, and N. P. Butch, Phys. Rev. B 101, 140503(R) (2020).
- Thomas et al. [2020] S. M. Thomas, F. B. Santos, M. H. Christensen, T. Asaba, F. Ronning, J. D. Thompson, E. D. Bauer, R. M. Fernandes, G. Fabbris, and P. F. S. Rosa, Science Advances 6, eabc8709 (2020), https://www.science.org/doi/pdf/10.1126/sciadv.abc8709 .
- Aoki et al. [2020] D. Aoki, F. Honda, G. Knebel, D. Braithwaite, A. Nakamura, D. Li, Y. Homma, Y. Shimizu, Y. J. Sato, J.-P. Brison, and J. Flouquet, Journal of the Physical Society of Japan 89, 053705 (2020).
- Jiao et al. [2020] L. Jiao, S. Howard, S. Ran, Z. Wang, J. O. Rodriguez, M. Sigrist, Z. Wang, N. P. Butch, and V. Madhavan, Nature 579, 523 (2020).
- Hayes et al. [2021] I. M. Hayes, D. S. Wei, T. Metz, J. Zhang, Y. S. Eo, S. Ran, S. R. Saha, J. Collini, N. P. Butch, D. F. Agterberg, A. Kapitulnik, and J. Paglione, Science 373, 797 (2021).
- Ishihara et al. [2021] K. Ishihara, M. Roppongi, M. Kobayashi, Y. Mizukami, H. Sakai, Y. Haga, K. Hashimoto, and T. Shibauchi, Chiral superconductivity in UTe2 probed by anisotropic low-energy excitations, arXiv:2105.13721 (2021).
- Haneveld and Jellinek [1970] A. Haneveld and F. Jellinek, Journal of the Less Common Metals 21, 45 (1970).
- Beck and Dausch [1988] H. P. Beck and W. Dausch, Zeitschrift für Naturforschung B 43, 1547 (1988).
- Ran et al. [2019b] S. Ran, I.-L. Liu, Y. S. Eo, D. J. Campbell, P. M. Neves, W. T. Fuhrman, S. R. Saha, C. Eckberg, H. Kim, D. Graf, F. Balakirev, J. Singleton, J. Paglione, and N. P. Butch, Nature Physics 15, 1250 (2019b).
- Knebel et al. [2019] G. Knebel, W. Knafo, A. Pourret, Q. Niu, M. Vališka, D. Braithwaite, G. Lapertot, M. Nardone, A. Zitouni, S. Mishra, I. Sheikin, G. Seyfarth, J.-P. Brison, D. Aoki, and J. Flouquet, Journal of the Physical Society of Japan 88, 063707 (2019).
- Aoki et al. [2019] D. Aoki, A. Nakamura, F. Honda, D. Li, Y. Homma, Y. Shimizu, Y. J. Sato, G. Knebel, J.-P. Brison, A. Pourret, D. Braithwaite, G. Lapertot, Q. Niu, M. Vališka, H. Harima, and J. Flouquet, Journal of the Physical Society of Japan 88, 043702 (2019).
- Miyake et al. [2019] A. Miyake, Y. Shimizu, Y. J. Sato, D. Li, A. Nakamura, Y. Homma, F. Honda, J. Flouquet, M. Tokunaga, and D. Aoki, Journal of the Physical Society of Japan 88, 063706 (2019).
- Imajo et al. [2019] S. Imajo, Y. Kohama, A. Miyake, C. Dong, M. Tokunaga, J. Flouquet, K. Kindo, and D. Aoki, Journal of the Physical Society of Japan 88, 083705 (2019).
- Rosuel et al. [2022] A. Rosuel, C. Marcenat, G. Knebel, T. Klein, A. Pourret, N. Marquardt, Q. Niu, S. Rousseau, A. Demuer, G. Seyfarth, G. Lapertot, D. Aoki, D. Braithwaite, J. Flouquet, and J.-P. Brison, Thermodynamic evidence for two superconducting phases under magnetic field in UTe2, arXiv:.2205.04524 (2022).
- Kinjo et al. [2022] K. Kinjo, H. Fujibayashi, S. Kitagawa, K. Ishida, Y. Tokunaga, H. Sakai, S. Kambe, A. Nakamura, Y. Shimizu, Y. Homma, D. X. Li, F. Honda, D. Aoki, K. Hiraki, M. Kimata, and T. Sasaki, Magnetic field-induced transition with spin rotation in the superconducting phase of UTe2, arXiv.2206.02444 (2022).
- Yip et al. [1991] S. K. Yip, T. Li, and P. Kumar, Phys. Rev. B 43, 2742 (1991).
- Cairns et al. [2020] L. P. Cairns, C. R. Stevens, C. D. O’Neill, and A. Huxley, Journal of Physics: Condensed Matter 32, 415602 (2020).
- Rosa et al. [2022] P. F. S. Rosa, A. Weiland, S. S. Fender, B. L. Scott, F. Ronning, J. D. Thompson, E. D. Bauer, and S. M. Thomas, Communications Materials 3, 33 (2022).
- Haga et al. [2022] Y. Haga, P. Opletal, Y. Tokiwa, E. Yamamoto, Y. Tokunaga, S. Kambe, and H. Sakai, Journal of Physics: Condensed Matter 34, 175601 (2022).
- Weiland et al. [2022] A. Weiland, S. M. Thomas, and P. F. S. Rosa, Journal of Physics: Materials 5, 044001 (2022).
- Sakai et al. [2022] H. Sakai, P. Opletal, Y. Tokiwa, E. Yamamoto, Y. Tokunaga, S. Kambe, and Y. Haga, Phys. Rev. Materials 6, 073401 (2022).
- Aoki et al. [2022] D. Aoki, H. Sakai, P. Opletal, Y. Tokiwa, J. Ishizuka, Y. Yanase, H. Harima, A. Nakamura, D. Li, Y. Homma, Y. Shimizu, G. Knebel, J. Flouquet, and Y. Haga, Journal of the Physical Society of Japan 91, 083704 (2022).
- [28] See supplemental material at (insert url) for (i) magnetic field orientation dependence of and , (ii) dependence of at various , (iii) dependence of at various , (iv) close look of , and (v) comparison with previously reported SC – phase diagram along the -axis in UTe2.
- Aoki et al. [2009] D. Aoki, T. D. Matsuda, V. Taufour, E. Hassinger, G. Knebel, and J. Flouquet, Journal of the Physical Society of Japan 78, 113709 (2009).
- Lévy et al. [2009] F. Lévy, I. Sheikin, B. Grenier, C. Marcenat, and A. Huxley, Journal of Physics: Condensed Matter 21, 164211 (2009).
- Hattori et al. [2012] T. Hattori, Y. Ihara, Y. Nakai, K. Ishida, Y. Tada, S. Fujimoto, N. Kawakami, E. Osaki, K. Deguchi, N. K. Sato, and I. Satoh, Phys. Rev. Lett. 108, 066403 (2012).
- Tokunaga et al. [2015] Y. Tokunaga, D. Aoki, H. Mayaffre, S. Krämer, M.-H. Julien, C. Berthier, M. Horvatić, H. Sakai, S. Kambe, and S. Araki, Phys. Rev. Lett. 114, 216401 (2015).
- Kanasugi and Yanase [2022] S. Kanasugi and Y. Yanase, Communications Physics 5, 39 (2022).
- Bae et al. [2021] S. Bae, H. Kim, Y. S. Eo, S. Ran, I.-l. Liu, W. T. Fuhrman, J. Paglione, N. P. Butch, and S. M. Anlage, Nature Communications 12, 2644 (2021).
- Tokiwa et al. [2022] Y. Tokiwa, P. Opletal, H. Sakai, K. Kubo, E. Yamamoto, S. Kambe, M. Kimata, S. Awaji, T. Sasaki, D. Aoki, Y. Tokunaga, and Y. Haga, Stabilization of superconductivity by metamagnetism in an easy-axis magnetic field on UTe2, arXiv.2210.11769 (2022).