Perplexity by PLM Is Unreliable for Evaluating Text Quality
Abstract
Recently, perplexity (PPL) has been adopted to evaluate text quality, or more specifically fluency, of generated text in a few studies. A smaller PPL value means better text quality or better fluency. Through carefully designed experiments, we show that PPL is an unreliable measure for text quality. Specifically, we show that: (i) PPL of short text is more likely to be larger than that of long text. (ii) Repeated text spans lead to lower PPL values although repeated spans often do not contribute to better text quality, and (iii) PPL values can be largely affected by punctuation marks. Based on the findings, we further discuss the key issues in evaluating text quality using language models.
Perplexity by PLM Is Unreliable for Evaluating Text Quality
Yequan Wang1∗, Jiawen Deng2∗, Aixin Sun3, Xuying Meng4 1Beijing Academy of Artificial Intelligence, Beijing, China 2CoAI Group, DCST, IAI, BNRIST, Tsinghua University, Beijing, China 3School of Computer Science and Engineering, Nanyang Technological University, Singapore 4Institute of Computing Technology, Chinese Academy of Sciences, Beijing, China tshwangyequan@gmail.com, dengjw2021@mail.tsinghua.edu.cn, axsun@ntu.edu.sg, mengxuying@ict.ac.cn
1 Introduction
The rapid development in natural language processing, particularly the success of pre-trained language models, has brought tremendous growth and progress to various text generation tasks. Examples include machine translation Tu et al. (2016); Zhang et al. (2021), question answering Duan et al. (2017), and generation-based dialog system Tu et al. (2022). How to evaluate the quality of the generated text in a cost efficient manner has become a key challenge.
Researchers have adopted various statistical metrics to evaluate the generated text. These measures include word-based measures like BLEU Papineni et al. (2002) and ROUGE Lin (2004)), character-based metrics like chrF Popovic (2015), and embedding-based metrics like Vector Extrema Forgues et al. (2014) and Greedy Matching Rus and Lintean (2012). Specifically, BLEU reflects the ratio of overlapping -grams to the total -grams, denoting a precision-based measure. ROUGE and its variants, also evaluating text based on -grams, are recall-based measures Sai et al. (2023). Vector Extrema prioritizes informative words by taking the extreme value along each dimension. All these measures are widely adopted in many experiments and tasks. However, such statistical-based measures cannot well evaluate the creativeness, diversity, and complexity of texts, particularly in the scenario that the same semantic is expressed in different expressions, e.g., different words/phrases, or different sentence structures.
In addition to the aforementioned statistical-based measures, perplexity (PPL) has also been used to evaluate the text quality or fluency in generation tasks. PPL is an intrinsic measure to quantify to what extent classical language models, e.g., -gram models, learn natural language Meister and Cotterell (2021a). Considering the large-scale pre-trained language models (PLMs) e.g., BERT Devlin et al. (2019) and GPT Radford et al. (2019), have well captured language knowledge, PPL has also been used to evaluate quality of generated text.111https://huggingface.co/spaces/evaluate-metric/perplexity Given a PLM model and a sequence of generated text, perplexity reflects how likely the model is to generate this text sequence. If we assume a large PLM well captures language knowledge and is well-behaved, then the PPL value computed in this way could reflect the quality of the input sequence to some extent.
In this paper, we use PLM to compute PPL values of high quality sentences, as if these sentences were outputs from some generative models. Based on the distributions of PPL values, we claim that PPL computed in this way cannot fairly evaluate text quality. Specifically, we used GPT-2 model Radford et al. (2019) to compute PPL of sentences in WikiText-2 dataset.222https://huggingface.co/datasets/wikitext As the sentences in WikiText dataset were extracted from verified good and featured articles on Wikipedia, we trust these sentences are of high quality. However, our experiments lead to the following findings.
(i)
PPL is sensitive to text length, i.e., PPL of short text is likely to be much larger than that of long text. On the other hand, the generated texts to be evaluated may have different lengths Meister and Cotterell (2021b). Strictly speaking, text quality is independent of text length.
(ii)
PPL is lower for text with repeated span(s). Generative text may contain repeated span(s). Although legitimate repeated text spans can be used to express emphasis in sentences, PPL cannot distinguish valid semantic emphasis in sentences from unreasonable straightforward repetitions.
(iii)
PPL is sensitive to punctuation marks in sentences. Simply removing the last punctuation mark in a sentence may lead a significant increase in its PPL. On the other hand, removing the last punctuation from a sentence may only lead to a very small impact to human perception of the sentence.
To the best of our knowledge, this is the first attempt to systematically analyze PPL for its suitability as a quality measure for generative text. Based on the findings, we call for more carefully designed metrics which are expected to be (i) not sensitive to length; (ii) sensitive to common mistakes, e.g., unnecessary repeated text; (iii) not sensitive to minor punctuation changes. In other words, a measure of text fluency shall not be much affected by text length, while penalizing unnecessary text spans and not attending to non-significant punctuation marks.
2 Preliminary and Experiment Setup
In our experiments, we follow the mainstream approach using GPT-2 Radford et al. (2019) as the pre-trained language model to calculate PPL. More specifically, we use the GPT2-large model.
Given an input sentence , we get its token sequence with size by the PLM. We use GPT2-large to compute the PPL:
| (1) |
where denotes the predicted probability of the -th token. PPL of the input sentence is computed as the cross entropy of each token:
| (2) |
Here, is the perplexity value of the input sentence .
The sentences in our experiments are from the test split of the WikiText-2 dataset. We filter sentences with fewer than 3 words to avoid extremely short sentences. As the result, we have 2,786 texts left in our experiments. The maximum, minimum, and average lengths are , , and tokens, respectively.
As sentences in WikiText were orginally from a set of carefully selected high quality Wikipedia articles, we assume the quality of all these sentences is high. Accordingly, if PPL computed by PLM is a suitable text quality measure, we expect a reasonably stable PPL value for all these sentences. On the other hand, if the PPL values of these high quality sentences are spread in a large range, then PPL values may not well reflect the text quality of generative text.
3 Experiments and Findings
3.1 PPL vs Text Length
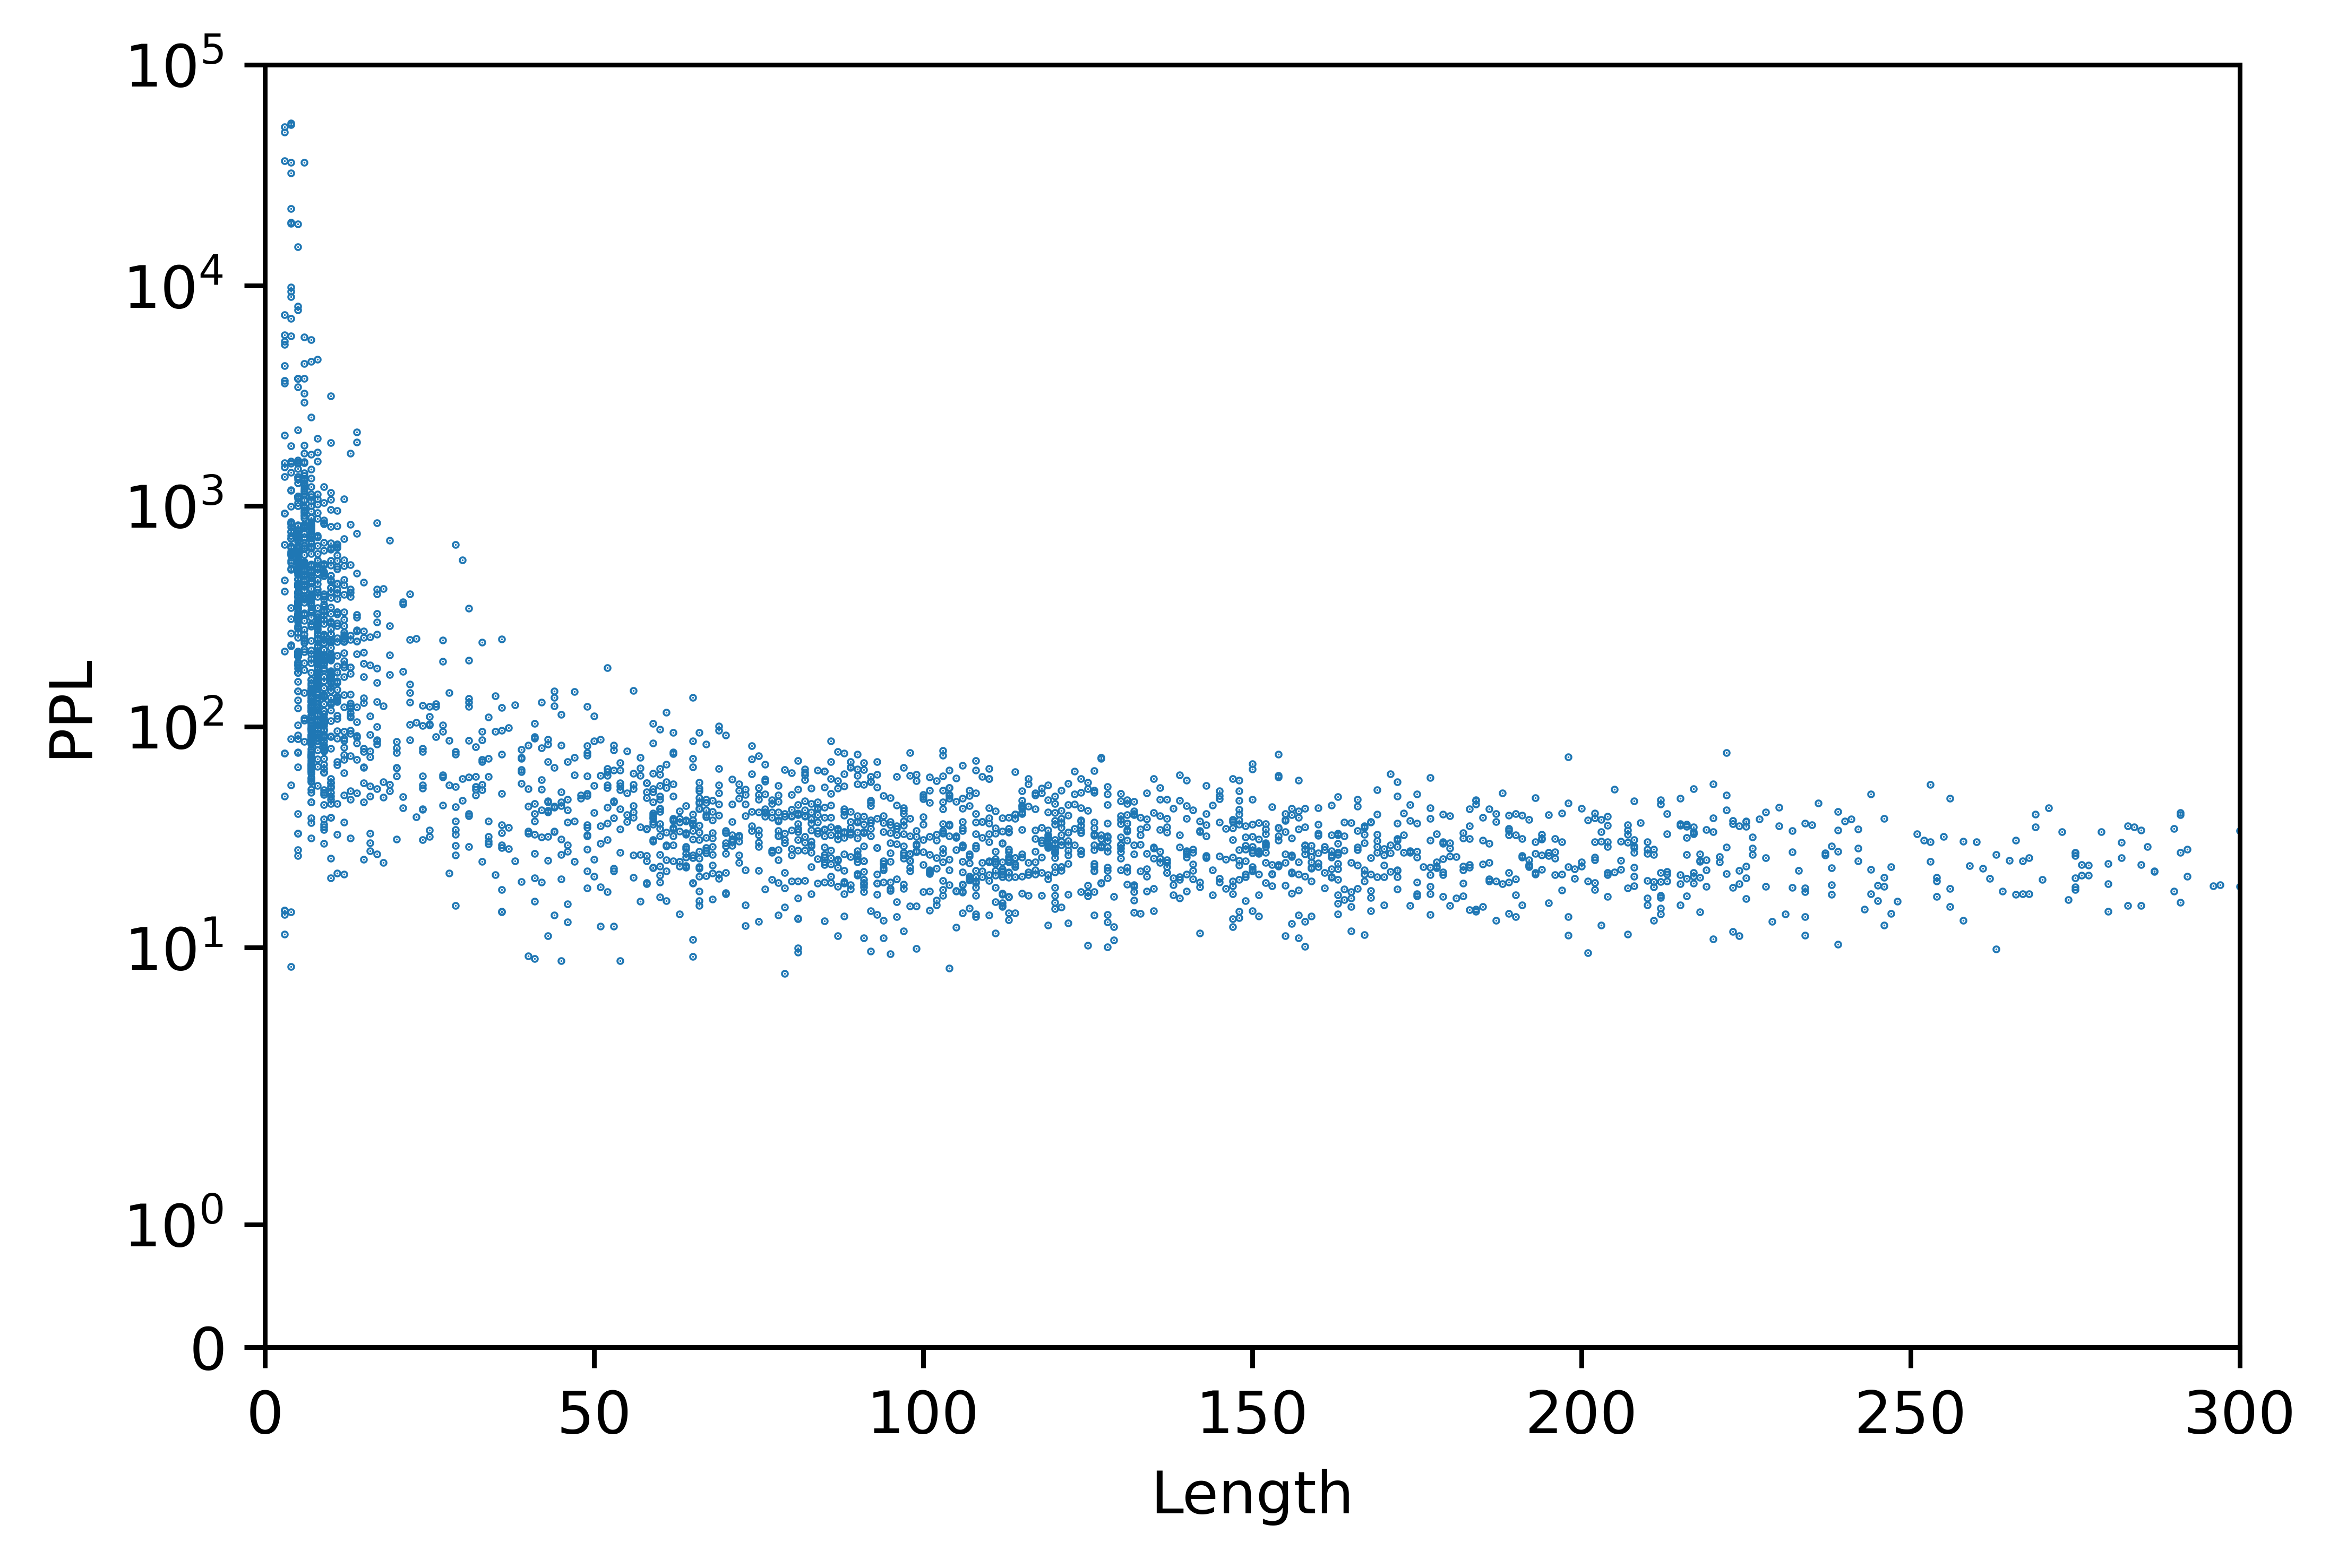
We first evaluate whether PPL is sensitive to text length of high quality text. In human perception, text quality is not strongly correlated with text length. Given the high quality sentences from WikiText, we expect a stable PPL value for all sentences. Figure 1 plots the PPL values of text against their lengths in number of tokens. Note that the PPL values on -axis are in log scale.
Finding 1
PPL values are unstable for short texts, and become lower along the increase of text length.
Observe that, a good number of sentences are short sentences, shorter than 25 tokens. These short sentences have a very wide range of PPL values with the majority in the range. Then along the increase of text length, the PPL values become lower. Nevertheless, fluctuation of PPL values exist for sentences in similar length, although the amplitude is not as large as when the text is short.
If we consider text quality or fluency does not have high correlation with text length, then the PPL value distribution of these high quality sentences are unexpected. In this sense, we claim that PPL is not a good measure for text quality of generated text. In text generation tasks, the generated sentences may be of very different lengths. The changes in PPL values of generated sentences could be due to the text quality as well as simply the lengths of the sentences.
| PPL_avg | PPL_std | Len_avg | Normal_ratio | ||
| 0 | 0 | 411.99 | 3546.23 | 86.52 | – |
| 1 | 1 | 235.39 | 1333.33 | 87.52 | 70.17 |
| 1 | 3 | 87.78 | 250.82 | 89.52 | 24.59 |
| 1 | 9 | 36.48 | 363.83 | 95.52 | 0.54 |
| 1 | 12 | 34.93 | 583.00 | 98.52 | 0.36 |
| 5 | 1 | 50.21 | 70.96 | 91.48 | 39.16 |
| 5 | 3 | 21.85 | 13.09 | 101.41 | 0.86 |
| 5 | 9 | 10.37 | 6.97 | 131.18 | 0.0 |
| 5 | 12 | 8.35 | 5.75 | 146.07 | 0.0 |
| 10 | 1 | 35.74 | 59.70 | 95.61 | 2.40 |
| 10 | 3 | 14.43 | 8.22 | 113.79 | 0.0 |
| 10 | 9 | 6.13 | 4.04 | 168.33 | 0.0 |
| 10 | 12 | 4.84 | 3.15 | 195.60 | 0.0 |
3.2 PPL vs Repeated Text Span
It is our understanding that if a generative model does not behave well, the model may cause duplication in the generated text, particularly the later part of a sentence. For example, to answer “Can you tell me what natural language processing is?”, a dialog system may generate “Natural language processing is a sub-field of linguistics, computer science science science…”. The repeated text span “science science” damages the semantics of the text. A qualified referee would have the ability to detect such unreasonable repetition, and give a low quality rating for such case.
To mimic such common mistakes in generative models, we design the following experiments. Given an original sentence with tokens, we repeat the last tokens for times to generate a new sentence . Accordingly, sentence has tokens.
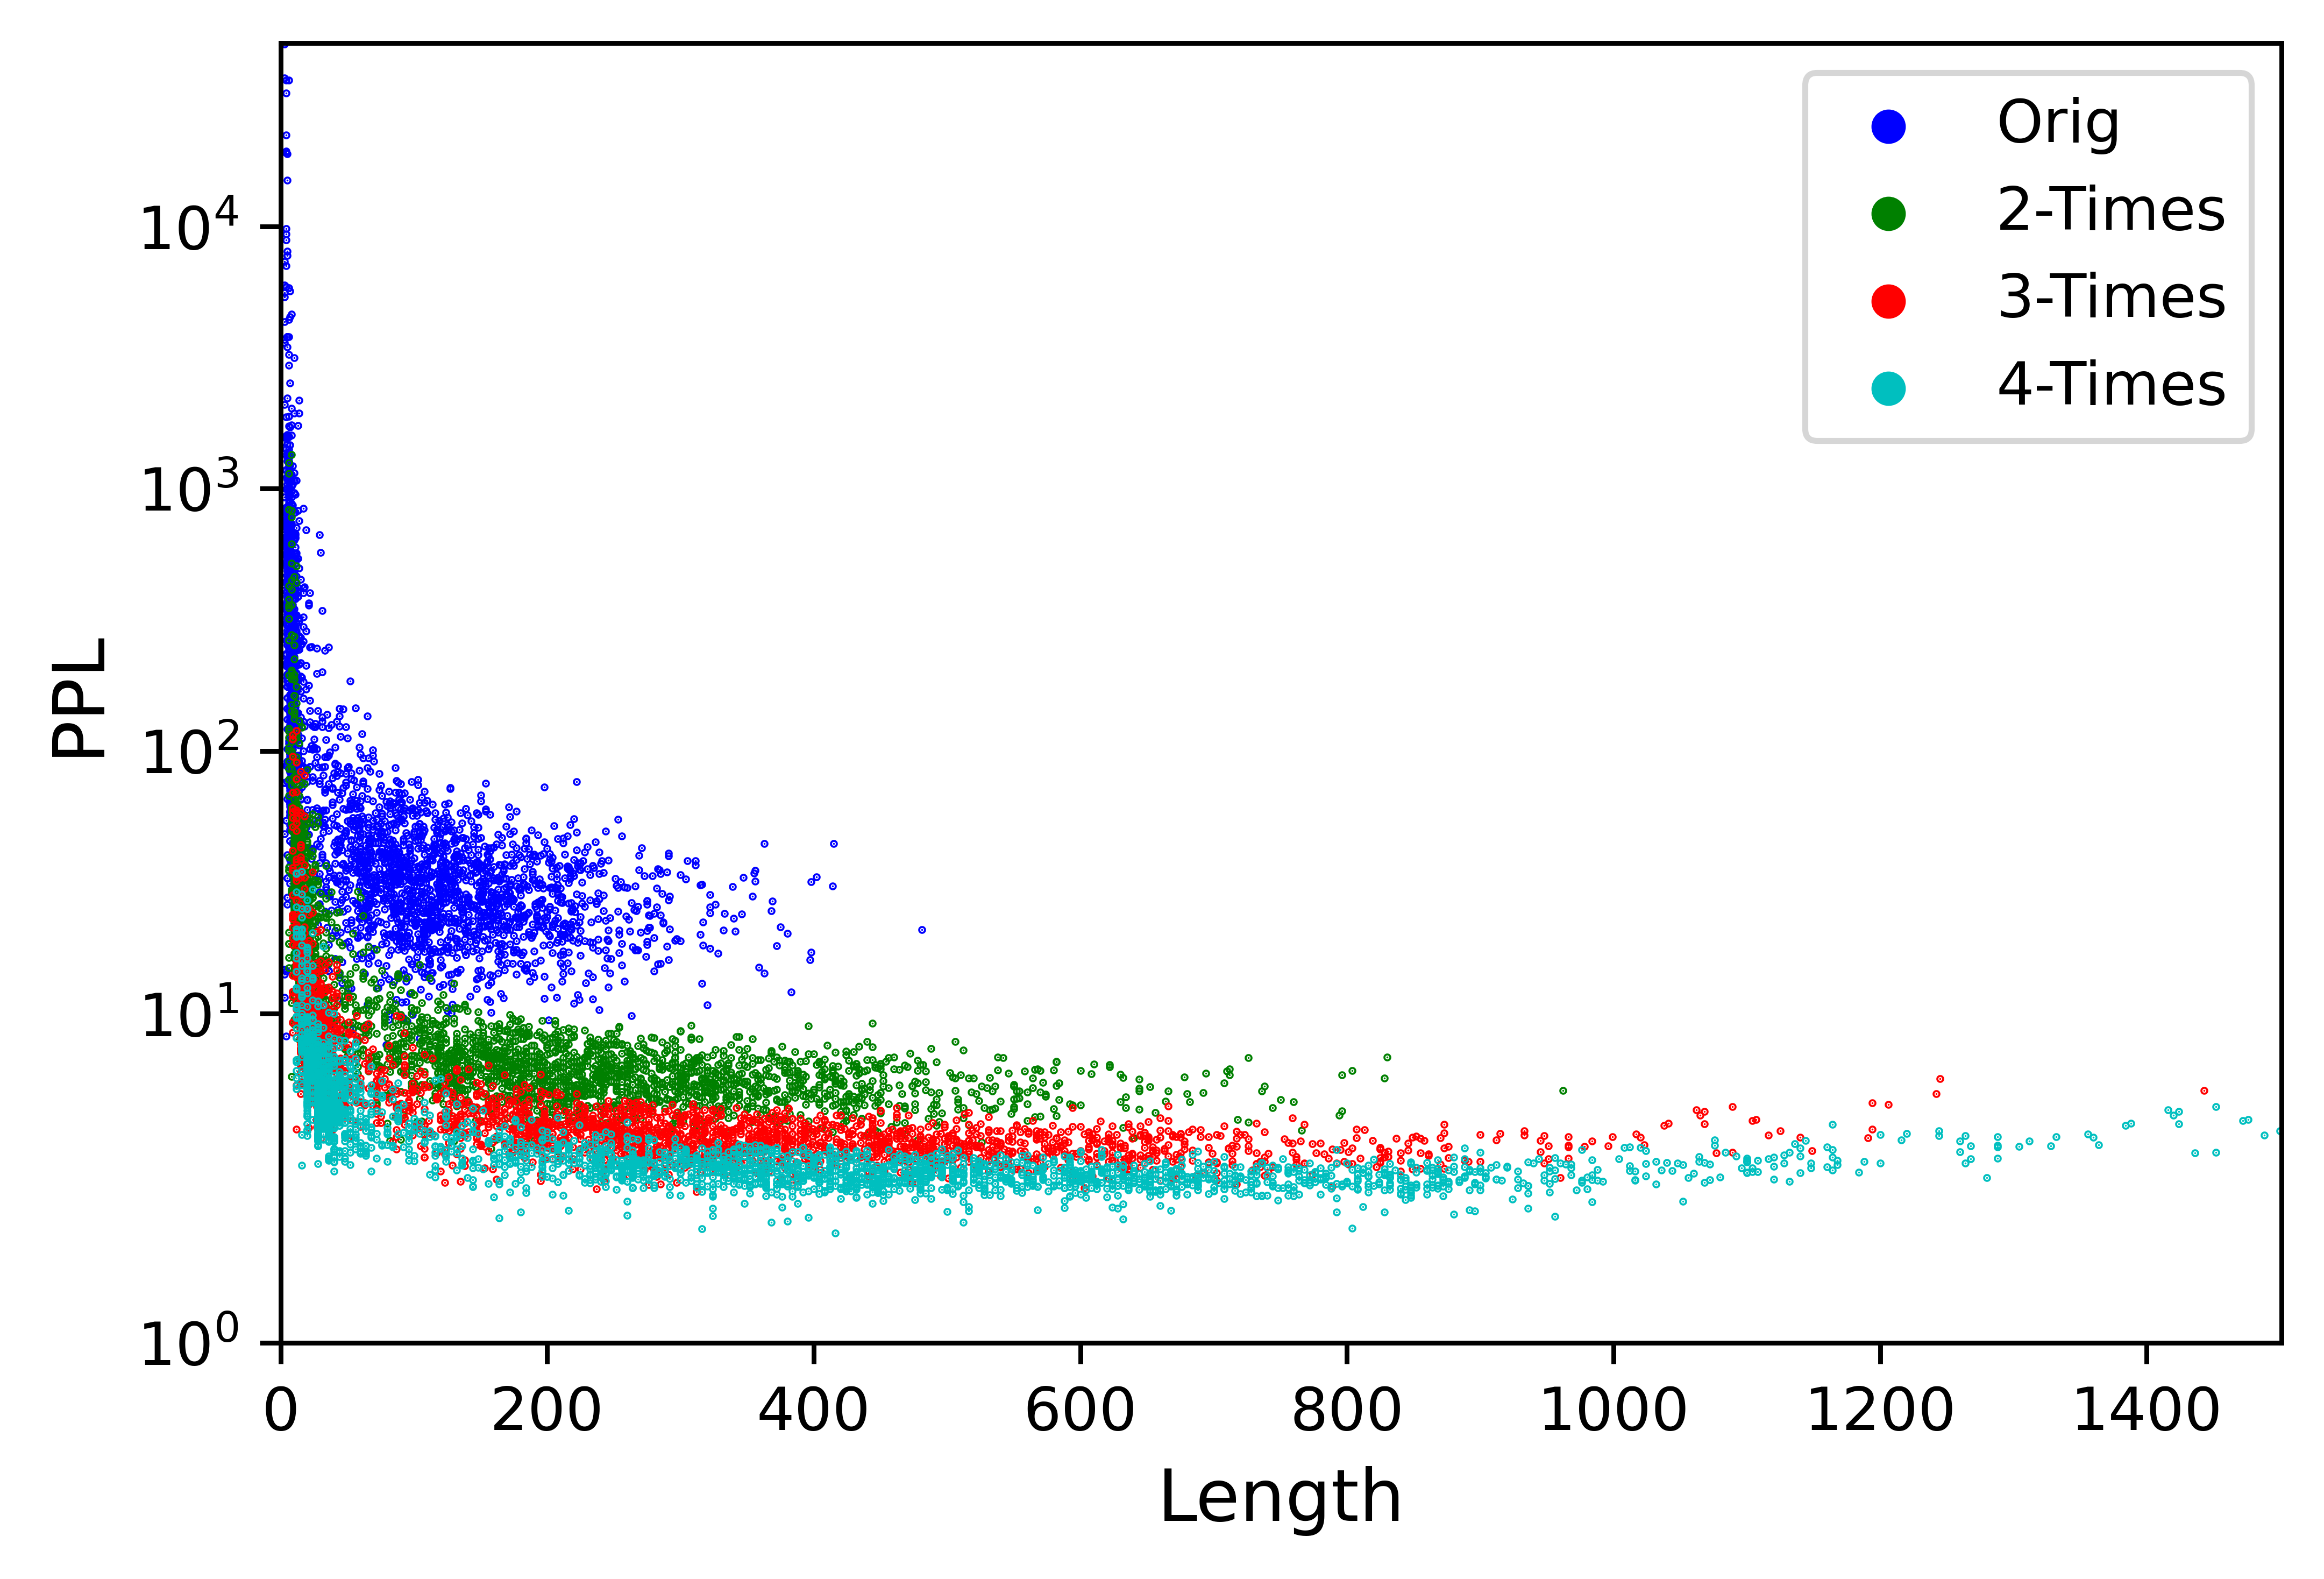
Table 1 reported the averaged PPL (PPL_avg) values of the original sentences in the collection (, ), and the averaged PPL of the sentences with different repetitive spans. The table also reports the standard deviation of the PPL values, the average length of the original sentences and the sentences with repetitive spans. To assess the proportion of PPL that behaves normally, we define Ratio of samples with increasing ppl value shown as Normal_ratio in Table 1. Figure 2 plots the distribution of PPL values of the original text, and that of repeating the entire text 2, 3, and 4 times.
Finding 2
The PPL value gets lower with more repetitive tokens.
Table 1 shows that the PPL values become lower when more repetitive tokens are included in the text. The reduction in PPL values are significant, even when only the last token is repeated for one time. Figure 2 shows that simply repeating the entire sentence multiple times leads to significant lower PPL values.
Meaningless repetition does not contribution positively to text quality, and may damage a sentence structure, making it grammatically incorrect. If PPL were a perfect measure for text quality, we expect PPL values of the sentences with repetitive spans to be higher than the original high quality text. Our experiments show the opposite. More importantly, the normal ratio shows significant decreases when the repeated times increase. This phenomenon reveals that perplexity is unreliable.
Note that, text repetition could be used to express emotions such as emphasis, anger, or other purposes of highlights. However, in our experiment design, given the large number of sentences in the datasets, simply repeating the last few tokens in every sentence certainly is not in this category of language use. In other words, the repeats in our experiment design is largely meaningless repeats and shall adversely affect text quality. We also note that, by repeating the last few tokens, the sentences become longer, which would lead to lower PPL based on our first finding.
3.3 PPL vs Punctuation Mark
| Data | PPL_avg | PPL_std | Len_avg | Normal_ratio |
| Orig. | 169.3 | 1009.3 | 102.0 | – |
| w/o Last | 279.5 | 2195.5 | 101.1 | 12.51 |
| w/o All | 690.2 | 4706.9 | 88.1 | 13.70 |
We know that punctuation marks are important for human reading and understanding. We design two sets of experiments to evaluate the impact of removing punctuation marks in sentences to PPL. In the first set of experiments, we remove all punctuation marks from a sentence , and the resultant sentence is . In the second set of experiments, we remove the last punctuation mark from the original sentence , and we get sentence .333We observe that very few sentences ends with two continuous punctuation marks. For such sentences, only the last punctuation mark is removed, to be consistent with all other sentences.
In our understanding, removal of all punctuation marks from a sentence would make the sentence difficult to read if the original sentence contains many punctuation marks. However, removing the last punctuation typically does not significantly affect reading or its semantic meaning, for most sentences. In this experiment design, the first set of experiments serves as a reference. Our main focus is on the PPL values changes in the second set of experiments.
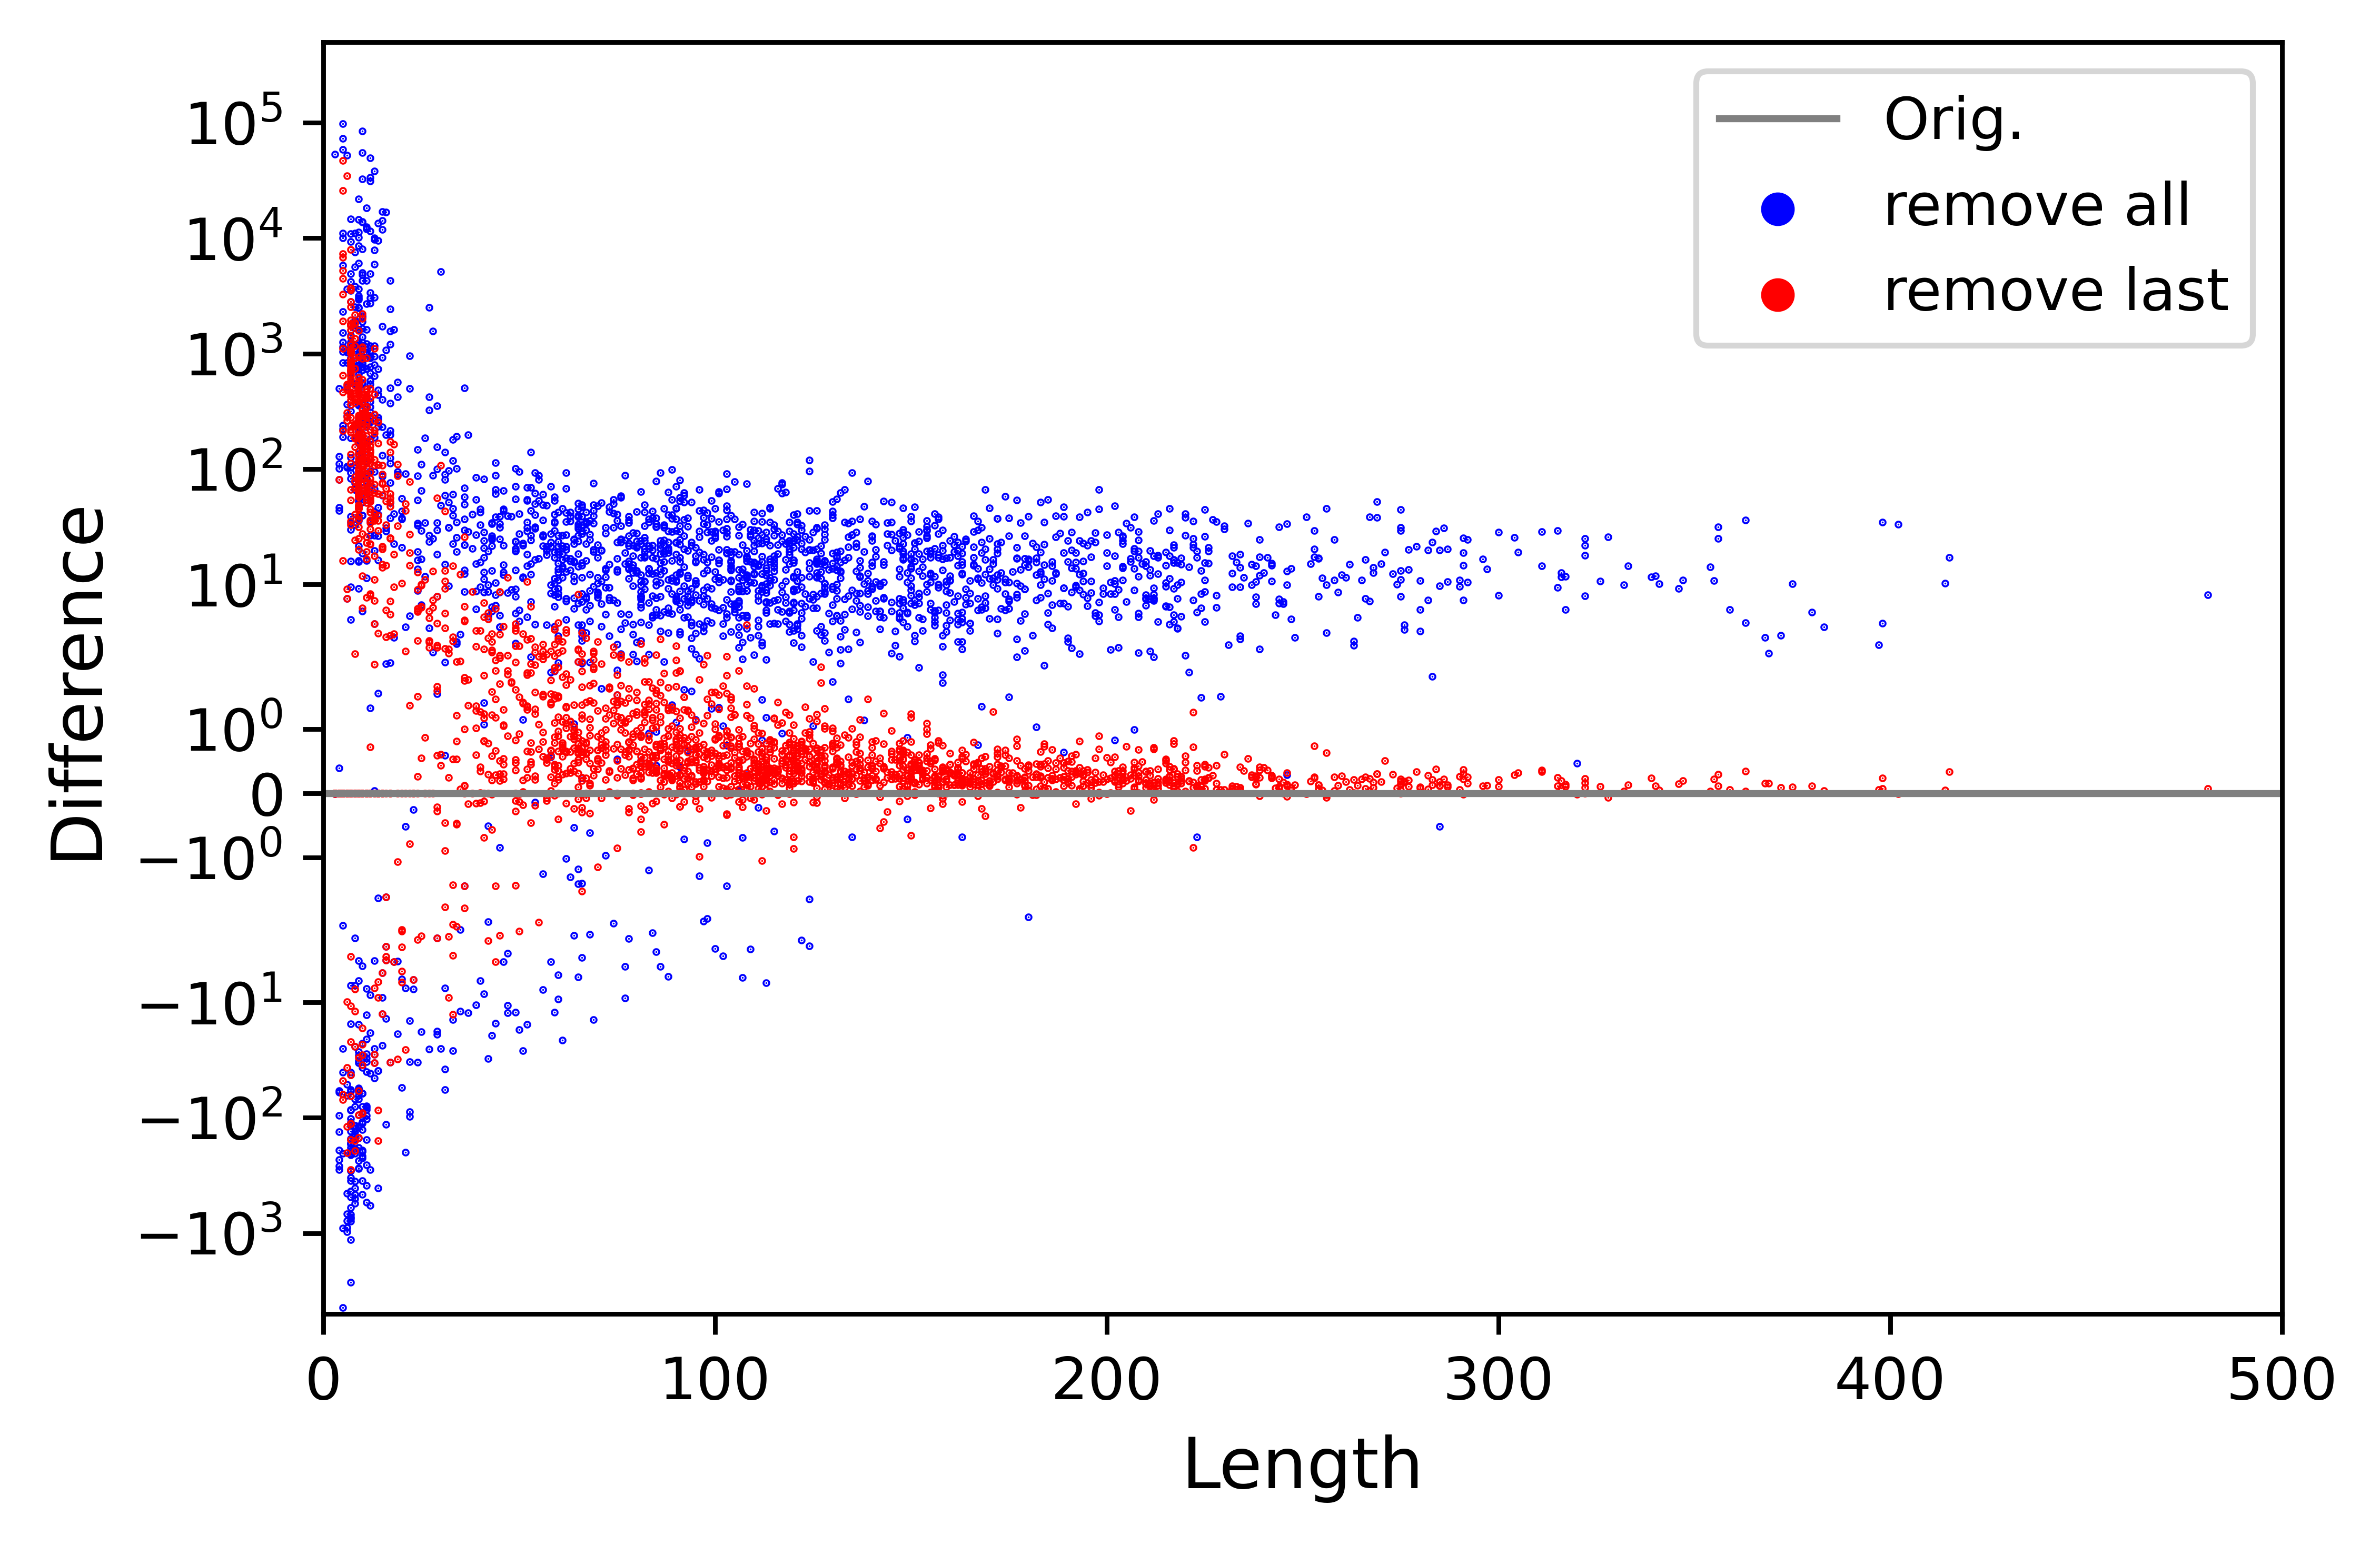
Table 2 shows the averaged PPL of the original sentences, and also the sentences after removing punctuation marks. PPL values shown in Table 1 represent the results of length-filtered samples, and this table shows no filtering, so the original PPL values in Table 2 are different from Table 1. Figure 3 plots the differences of PPL values with reference to the original sentences, due to punctuation marks removal.
Finding 3
Removing the last punctuation mark usually does not significantly affect the text quality, but results in significant changes in PPL values.
As discussed, we would expect a minor or negligible change in PPL values if only the last punctuation mark is removed. Table 2 and Figure 3 tell us differently. That is, PPL is very sensitive the punctuation marks. Removal of the last punctuation marks does not lead to significant change to the sentence meaning or sentence length. The PPL changes significantly, particularly for short sentences.
4 Discussion
Through experiments of PPL values on high quality text, we show that PPL value is sensitive to text length. The good news is that PPL tends to be relatively stable if text length is greater than . Unfortunately, text length is not the only factor that is independent of text quality. Our experiments also show that PPL is unexpected to favor sentences containing meaningless repetitive text spans, and is sensitive to punctuation marks.
All these results strongly suggest that PPL by PLM is unreliable for evaluating text quality. We argue that a fair metric should well consider the impacts of text length, meaningless text repetition, and punctuation perturbation, among the other factors that may contribute to text quality. In particular, diversity is an important indicator of text quality. The fluctuations of PPL values due to text repetition could be mitigated with text diversity, e.g., penalizing the scoring based on the frequency of n-gram occurrences, and even penalizing consecutive occurrences of the same expression, if such a measure is well designed. In short, we believe it is more reasonable to evaluate text quality with a collection of measures which check and balance each other. The widely used precision and recall in Information Retrieval is an example. Lastly, for text quality, the correct use of punctuation is undoubtedly essential. But in the case of lower text quality, a good evaluation metric should focus more on the word coherence instead of the non-significant punctuation e.g., the full stop at the end of a sentence.
5 Conclusion
In this paper, we evaluate PPL by PLM as an evaluation of text quality. Through experiments, we find that PPL by PLM is sensitive to text length, cannot well handle the common problem of unusual text duplication, and could be easily affected by punctuation marks. To this end, we consider PPL by PLM is unreliable for evaluating quality of text by generative models. We suggest a few factors for consideration when developing a new evaluation metric for text quality.
Limitations
There are two main limitations in this work. First, the three factors i.e., text length, repetitive spans, and punctuation marks, are from a full coverage of a comprehensive understanding of text quality. Nevertheless, these are the factors that can be controlled through experiments, to study the behavior of PPL by PLMs. Second, we are not able to provide a more meaningful alternative measure for text quality.
Acknowledgments
This work was supported by the National Key R&D Program of China (2020AAA0105200) and the National Science Foundation of China (NSFC No. 62106249, 61902382, 61972381).
References
- Devlin et al. (2019) Jacob Devlin, Ming-Wei Chang, Kenton Lee, and Kristina Toutanova. 2019. BERT: pre-training of deep bidirectional transformers for language understanding. In Proceedings of the 2019 Conference of the North American Chapter of the Association for Computational Linguistics: Human Language Technologies, NAACL-HLT 2019, Minneapolis, MN, USA, June 2-7, 2019, Volume 1 (Long and Short Papers), pages 4171–4186. Association for Computational Linguistics.
- Duan et al. (2017) Nan Duan, Duyu Tang, Peng Chen, and Ming Zhou. 2017. Question generation for question answering. In Proceedings of the 2017 Conference on Empirical Methods in Natural Language Processing, EMNLP 2017, Copenhagen, Denmark, September 9-11, 2017, pages 866–874. Association for Computational Linguistics.
- Forgues et al. (2014) Gabriel Forgues, Joelle Pineau, Jean-Marie Larchevêque, and Réal Tremblay. 2014. Bootstrapping dialog systems with word embeddings. In Nips, modern machine learning and natural language processing workshop, volume 2, page 168.
- Lin (2004) Chin-Yew Lin. 2004. ROUGE: A package for automatic evaluation of summaries. In Text Summarization Branches Out, pages 74–81, Barcelona, Spain. Association for Computational Linguistics.
- Meister and Cotterell (2021a) Clara Meister and Ryan Cotterell. 2021a. Language model evaluation beyond perplexity. In Proceedings of the 59th Annual Meeting of the Association for Computational Linguistics and the 11th International Joint Conference on Natural Language Processing, ACL/IJCNLP 2021, (Volume 1: Long Papers), Virtual Event, August 1-6, 2021, pages 5328–5339. Association for Computational Linguistics.
- Meister and Cotterell (2021b) Clara Meister and Ryan Cotterell. 2021b. Language model evaluation beyond perplexity. In Proceedings of the 59th Annual Meeting of the Association for Computational Linguistics and the 11th International Joint Conference on Natural Language Processing (Volume 1: Long Papers), pages 5328–5339, Online. Association for Computational Linguistics.
- Papineni et al. (2002) Kishore Papineni, Salim Roukos, Todd Ward, and Wei-Jing Zhu. 2002. Bleu: a method for automatic evaluation of machine translation. In Proceedings of the 40th Annual Meeting of the Association for Computational Linguistics, July 6-12, 2002, Philadelphia, PA, USA, pages 311–318. ACL.
- Popovic (2015) Maja Popovic. 2015. chrf: character n-gram f-score for automatic MT evaluation. In Proceedings of the Tenth Workshop on Statistical Machine Translation, WMT@EMNLP 2015, 17-18 September 2015, Lisbon, Portugal, pages 392–395. The Association for Computer Linguistics.
- Radford et al. (2019) Alec Radford, Jeff Wu, Rewon Child, David Luan, Dario Amodei, and Ilya Sutskever. 2019. Language models are unsupervised multitask learners.
- Rus and Lintean (2012) Vasile Rus and Mihai C. Lintean. 2012. A comparison of greedy and optimal assessment of natural language student input using word-to-word similarity metrics. In Proceedings of the Seventh Workshop on Building Educational Applications Using NLP, BEA@NAACL-HLT 2012, June 7, 2012, Montréal, Canada, pages 157–162. The Association for Computer Linguistics.
- Sai et al. (2023) Ananya B. Sai, Akash Kumar Mohankumar, and Mitesh M. Khapra. 2023. A survey of evaluation metrics used for NLG systems. ACM Comput. Surv., 55(2):26:1–26:39.
- Tu et al. (2022) Quan Tu, Yanran Li, Jianwei Cui, Bin Wang, Ji-Rong Wen, and Rui Yan. 2022. MISC: A mixed strategy-aware model integrating COMET for emotional support conversation. In Proceedings of the 60th Annual Meeting of the Association for Computational Linguistics (Volume 1: Long Papers), ACL 2022, Dublin, Ireland, May 22-27, 2022, pages 308–319. Association for Computational Linguistics.
- Tu et al. (2016) Zhaopeng Tu, Zhengdong Lu, Yang Liu, Xiaohua Liu, and Hang Li. 2016. Modeling coverage for neural machine translation. In Proceedings of the 54th Annual Meeting of the Association for Computational Linguistics, ACL 2016, August 7-12, 2016, Berlin, Germany, Volume 1: Long Papers. The Association for Computer Linguistics.
- Zhang et al. (2021) Jiacheng Zhang, Huanbo Luan, Maosong Sun, Feifei Zhai, Jingfang Xu, and Yang Liu. 2021. Neural machine translation with explicit phrase alignment. IEEE ACM Trans. Audio Speech Lang. Process., 29:1001–1010.
Appendix A Appendix
A.1 Case Study
| Text | Len. | PPL |
| Split1: Over the course of his reign , Nero often made rulings that pleased the lower class . | 17 | 77.3 |
| Split2: Nero was criticized as being obsessed with personal popularity . | 10 | 187.9 |
| Combine: Over the course … the lower class . Nero was criticized … with personal popularity . | 27 | 60.6 |
| Split1: Lesnar appears in the video games WWE SmackDown ! Shut Your Mouth , WWE SmackDown ! | 16 | 26.3 |
| Split2: Here Comes the Pain , Madden NFL 06 , UFC 2009 Undisputed , UFC Undisputed 2010 , WWE ’ 12 , WWE ’ 13 , WWE 2K14 , WWE 2K15 , WWE 2K16 , and WWE 2K17 . | 38 | 10.4 |
| Combine: Lesnar appears in … , WWE SmackDown ! Here Comes the Pain , … and WWE 2K17 . | 54 | 8.7 |
| Split1: The Great Fire of Rome erupted on the night of 18 July to 19 July 64 . | 17 | 62.8 |
| Split2: The fire started at the southeastern end of the Circus Maximus in shops selling flammable goods . | 17 | 65.7 |
| Combine: The Great Fire … 19 July 64 . The fire started … selling flammable goods . | 34 | 31.9 |
| Split1: This isn ’t acceptable to get to where we want to go . But what does that really mean ? | 20 | 40.9 |
| Split2: It ’s not just get better defensively , it is , if we give up 3 less baskets a game , then we will be at 40 percent field goal percentage defense which will be top 20 in the country | 40 | 44.3 |
| Combine: This isn ’t acceptable … that really mean ? It ’s not just … in the country | 60 | 32.0 |
| ID | Text | Len. | Orig. | 2-Times | w/o Punc. | w/o Last Punc. | |||
| 1 | To use absolutely no word that does not contribute to the presentation . | 13 | 140.1 | 64.8 | 24.0 | 20.5 | 17.0 | 106.6 | 106.6 |
| 2 | Coastal service and riverine vessels , including ’ floating batteries ’ and ’ monitors’ | 14 | 321.4 | 255.1 | 41.2 | 53.6 | 31.1 | 282.3 | 235.0 |
| 3 | = = Plans , mobilization , and escalating violence = = | 11 | 952.6 | 370.4 | 60.2 | 32.3 | 55.8 | 1,690.1 | 1,870.9 |
| 4 | = = = Loans to Peterborough and Molde = = = | 11 | 295.6 | 110.5 | 31.3 | 19.9 | 22.7 | 216.6 | 488.2 |
| 5 | Gregzilla ( Greg Harrison ) — guitar ( 2015 – current ) | 12 | 711.1 | 519.5 | 117.5 | 39.5 | 41.5 | 50,441.8 | 1,210.7 |
| 6 | Above the cut @-@ off frequency the image impedance is imaginary , | 12 | 1,075.6 | 505.3 | 103.7 | 58.3 | 57.5 | 500.1 | 1,131.9 |
In order to have an intuitive feeling, we selected data from the testing set as a case study. Table 3 and Table 4 report the detail, and reveal that the PPL metric is unreliable.
Table 3 shows that long texts are more likely to get lower values. But when it is sliced into multiple sub-sentences, the PPL of each piece always rise substantially, even if they use the same word sequence as the original long texts.
As reported in Table 4, PPL is deeply perturbed by unusual text span duplication. It shows the trend that PPL decrease is greater as the length of the duplicated text increases (Orig. –> –> –> ). This indicates that low-quality text can easily fool the metric by a large number of repetitions and achieve lower PPL values, making PPL metric less trustworthy.
PPL is also too sensitive to punctuation. For example, after removing the last punctuation in the third sentence, the PPL rises to 196.4% of the original text (increased from 952.6 to 1870.9). And even the removal of punctuation of little significance (e.g. full stop) does not escape the disaster of PPL fluctuations. For example, in the first sentence, ppl drops to 76.1% of the original sentence (decrease from 140.1 to 106.6) after removing the last mark.
Perturbations from unusual text span and punctuations are common problems in generative models. However, the above-mentioned cases tell us that these problems can easily break the PPL metric, cause large fluctuations and make it difficult to score the text quality fairly.