Supplementary Material: Pair distribution function analysis driven by atomistic simulations: Application to microwave radiation synthesized Ti and Zr
Shuyan Zhang1Jie Gong1Daniel Xiao2B. Reeja Jayan1Alan J. H. McGaughey11Department of Mechanical Engineering, Carnegie Mellon University,
Pittsburgh, Pennsylvania 15213, USA
2Department of Materials Science and Engineering, Carnegie Mellon University,
Pittsburgh, Pennsylvania 15213, USA
S1 Lattice constants and elastic constants
S1.1 Rutile and anatase Ti
Table S1: Ti lattice constants (Å), elastic constants (GPa), bulk modulus (GPa), and shear modulus (GPa) calculated using SMTB-Q, ReaxFF, and the literature values.
Table S2: Zr lattice constants (Å), elastic constants (GPa), bulk modulus (GPa), and shear modulus (GPa) calculated using SMTB-Q and the literature values.
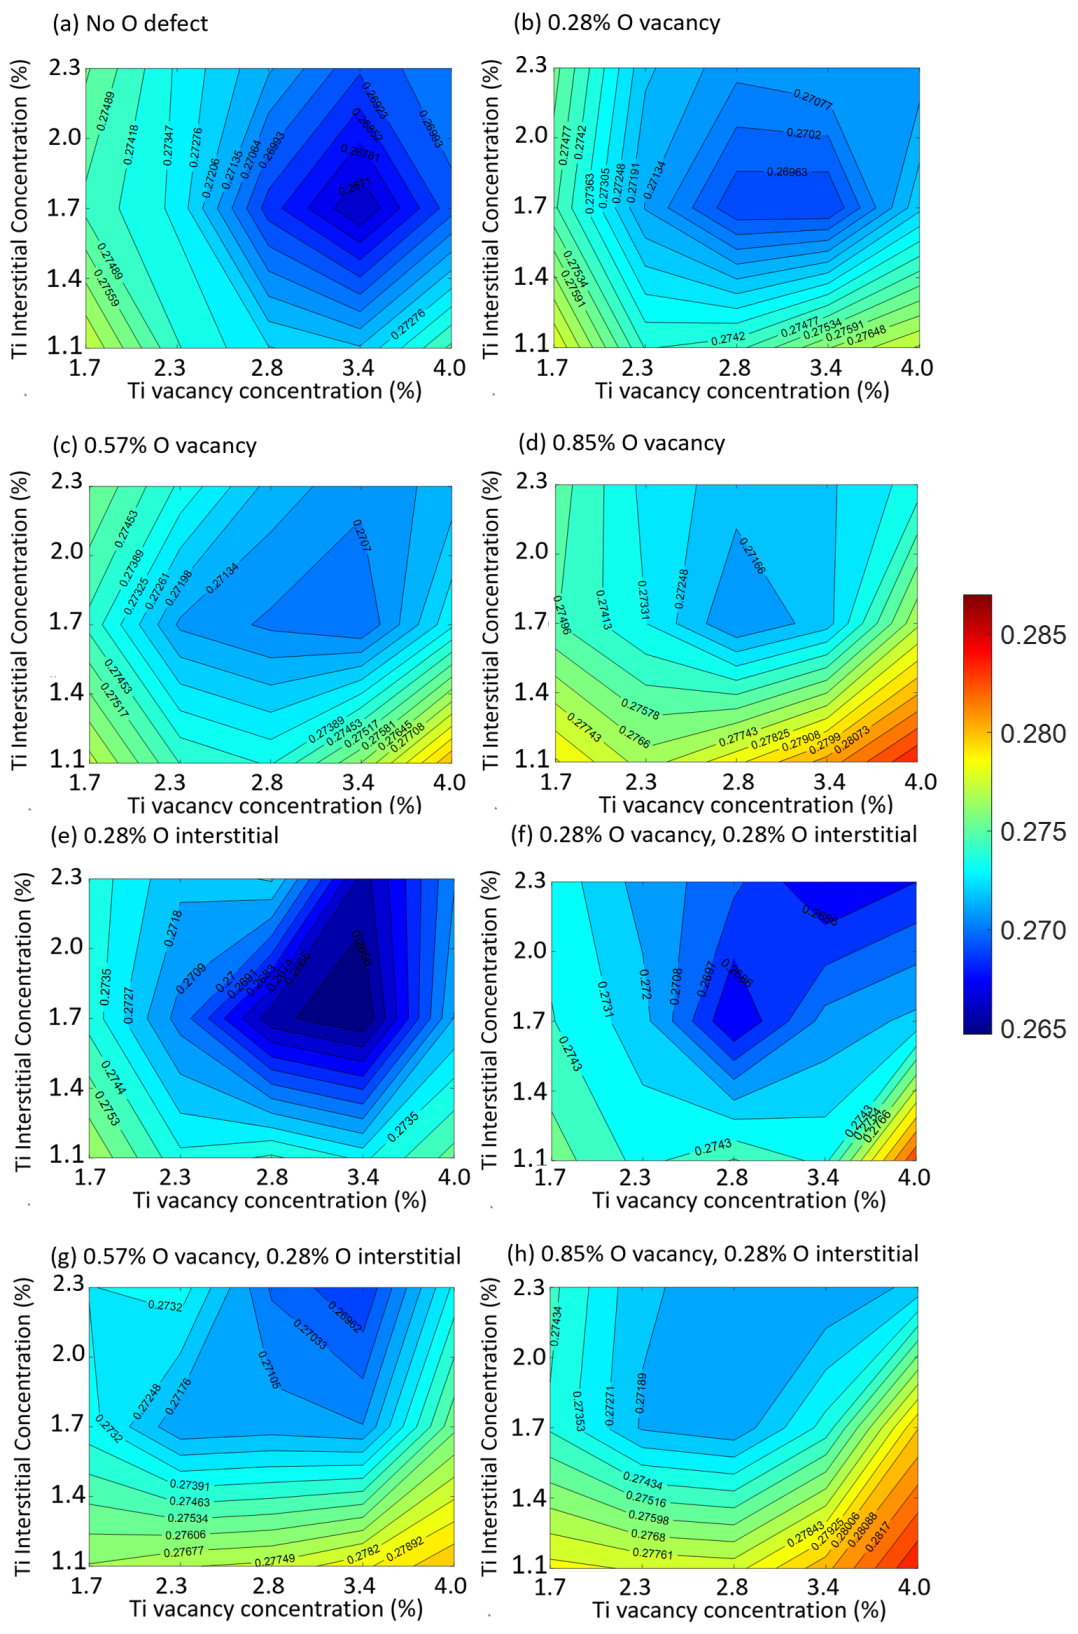
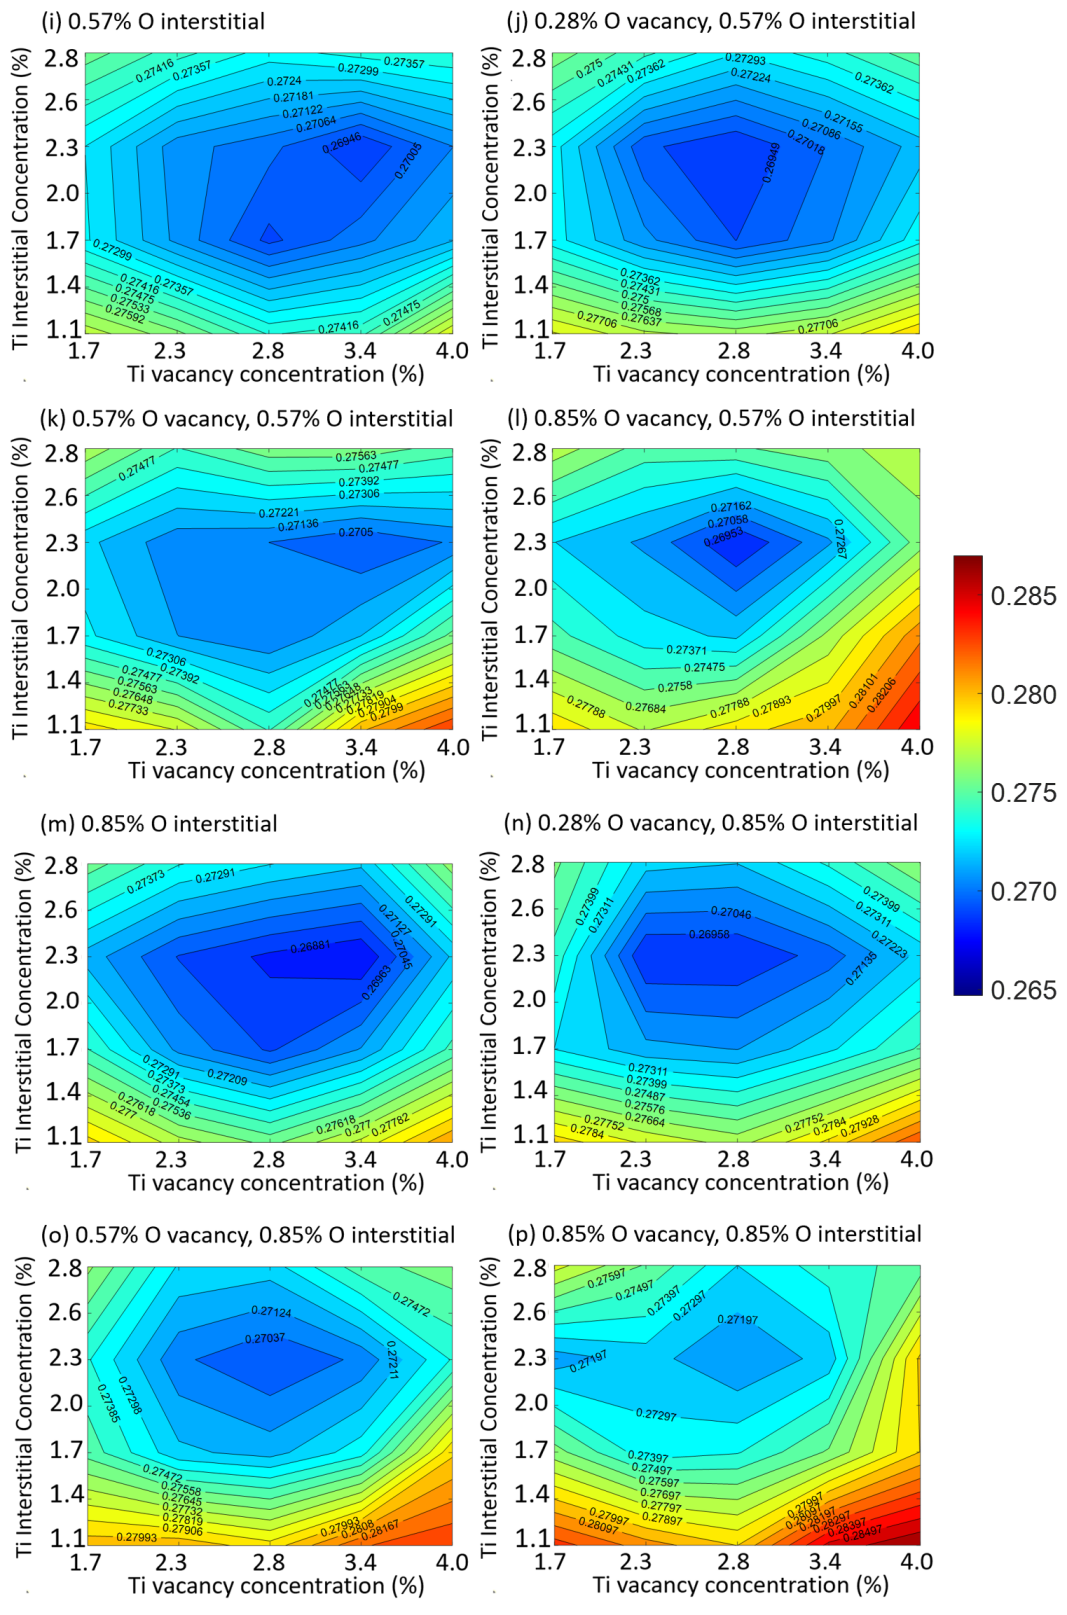
Figure S1: Variation of with Ti defect concentration. The lowest results from the PDF refinement of a structure model with 3.4% Ti vacancies, 1.7% Ti interstitial and 0.28% O interstitial.Figure S2: Variation of with Ti defect concentration. The lowest results from the PDF refinement of a structure model with 3.4% Ti vacancies, 1.7% Ti interstitial and 0.28% O interstitial.
S4 PDF refinement parameters
Table S5: The refined parameters for the MWR-grown anatase Ti using perfect structure and defected structure.
Perfect
Defected
(Å)
3.788
3.793
(Å)
9.487
9.492
Ti (Å2)
0.00665
0.00510
O (Å2)
0.0238
0.0164
(Å)
34.4
33.0
2.93
2.54
0.325
0.264
Table S6: The refined parameters for the MWR-grown tetragonal Zr using perfect structure and defected structure.
Perfect
Defected
(Å)
3.551
3.554
(Å)
5.097
5.097
Zr (Å2)
0.00848
0.00270
O (Å2)
0.0170
0.0274
(Å)
40.5
39.6
1.87
3.32
0.236
0.214
Table S7: Refined anisotropic ADPs, isotropic ADPs, and values for defected and perfect TiO2. The refined is an order of magnitude smaller than that for the perfect structure, which is nonphysical. The values do not show significant improvement for either the defected or perfect structures.
Defected
Perfect
Anisotropic
Isotropic
Anisotropic
Isotropic
(Å2)
0.00443
0.00817
(Å2)
0.00510
0.00026
0.00420
(Å2)
0.00520
0.00358
(Å2)
0.0186
0.0242
(Å2)
0.0164
0.00732
0.0128
(Å2)
0.0141
0.0110
0.264
0.264
0.101
0.107
Table S8: Refined anisotropic ADPs, isotropic ADPs, and value of defected ZrO2. The refined is two orders of magnitude smaller the refined for the defected structure, which is nonphysical. The value does not show a significant improvement. No experimental sample for perfect ZrO2 is available.
Defected
Anisotropic
Isotropic
(Å2)
0.00442
(Å2)
0.00270
(Å2)
0.00089
(Å2)
0.0050
(Å2)
0.0274
(Å2)
0.1710
0.203
0.213
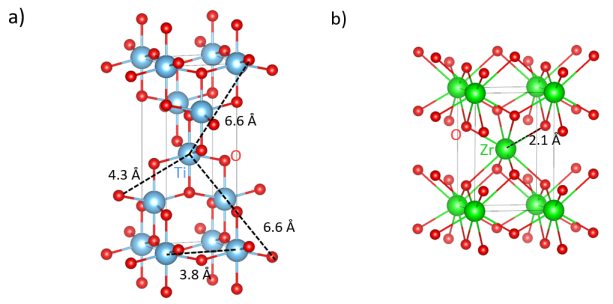
S5 Illustration of atomic separation corresponding to PDF peaks
Figure S3: Atom pairs that correspond to improved peak refinement for (a) TiO2 and (b) ZrO2.
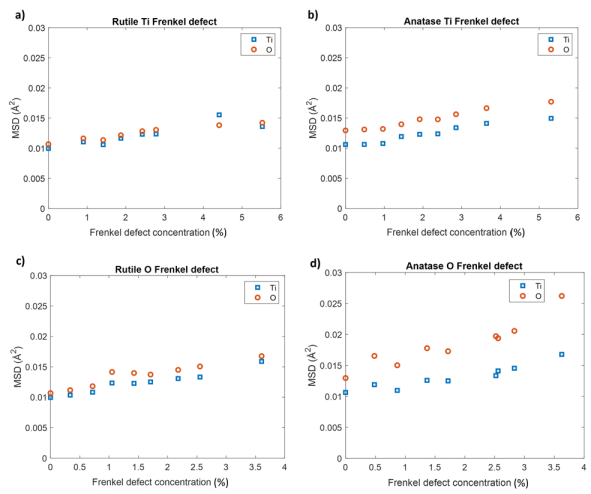
S6 The effect of defect concentration on thermal vibration
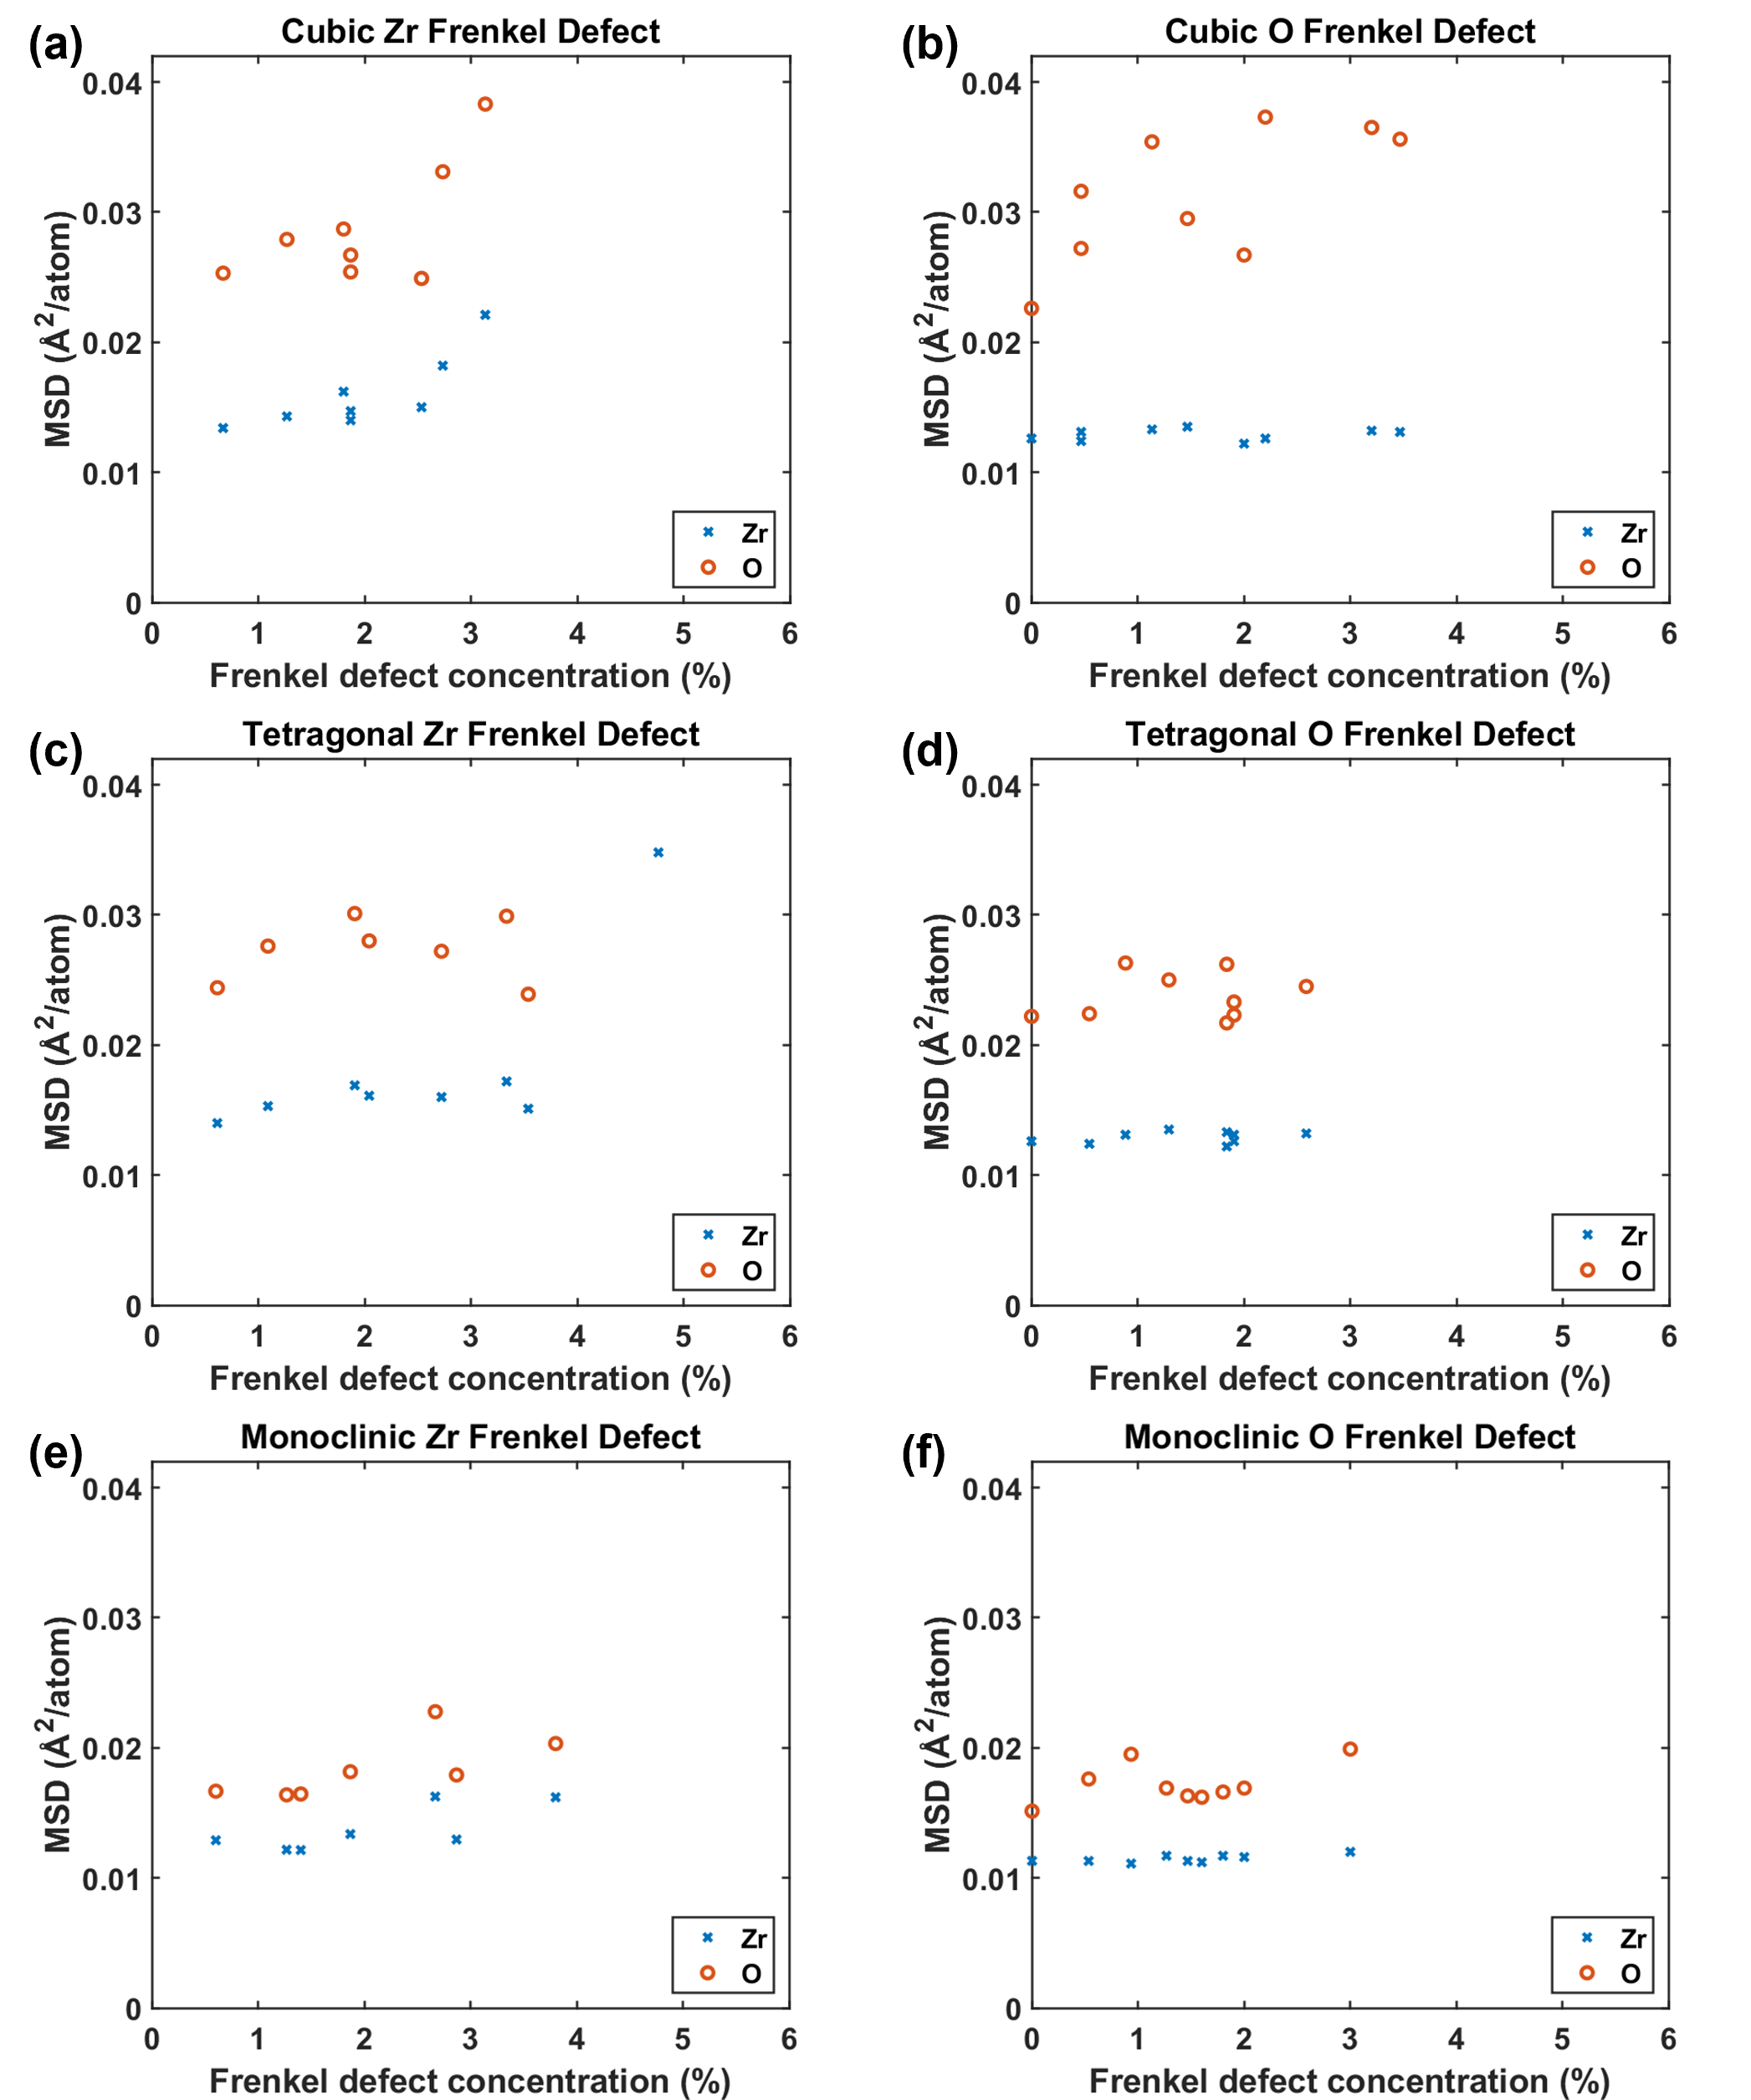
Figure S4: The element-wise MSDs of a) rutile with Ti Frenkel defects, b) anatase with Ti Frenkel defects, c) rutile with O Frenkel defects and d) anatase with O Frenkel defects.Figure S5: The element-wise MSDs of a) cubic ZrO2 with Zr Frenkel defects, b) cubic Zr with O Frenkel defects, c) tetragonal Zr with Zr Frenkel defects, d) tetragonal Zr with O Frenkel defects, e) monoclinic Zr with Zr Frenkel defects and f) monoclinic Zr with O Frenkel defects.
S7 X-ray PDF vs. neutron PDF
Table S9: The scattering factors used in DiffPy for Ti, Zr, and O.
Element
X-ray (e/atom)
Neutron (fm)
Ti
22.00
-3.37
Zr
39.98
7.16
O
8.00
5.81
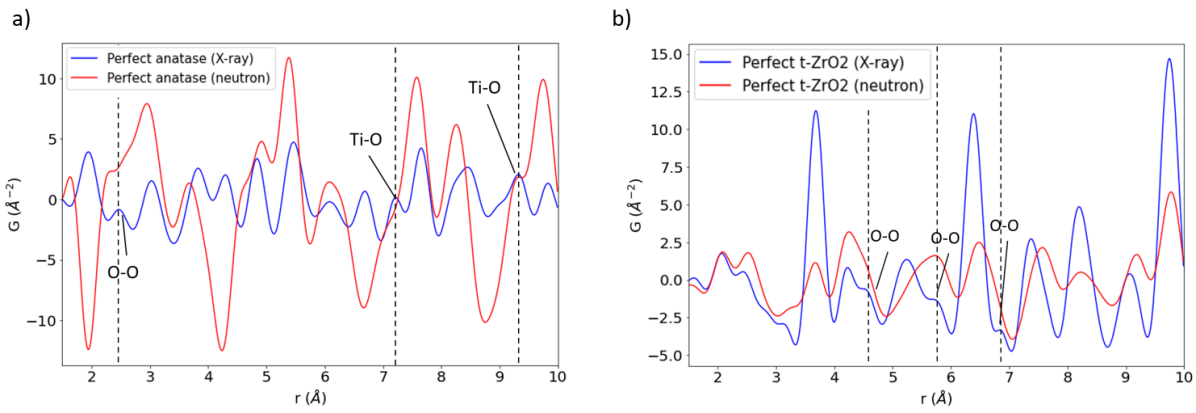
The X-ray and neutron PDFs of perfect anatase TiO2 and tetragonal ZrO2 are shown in Fig. S6. No refinement was performed and the calculation parameters were kept the same for the X-ray and neutron PDFs to enable a fair comparison. The strongly negative peaks in the neutron PDF are due to the negative neutron scattering length of Ti. These negative peaks lead to cancellation effects with the positive peaks that result from the positive scattering length of O.
Figure S6: Comparisons of X-ray (blue) and neutron (red) PDFs for perfect (a) anatase TiO2 and (b) tetragonal ZrO2.
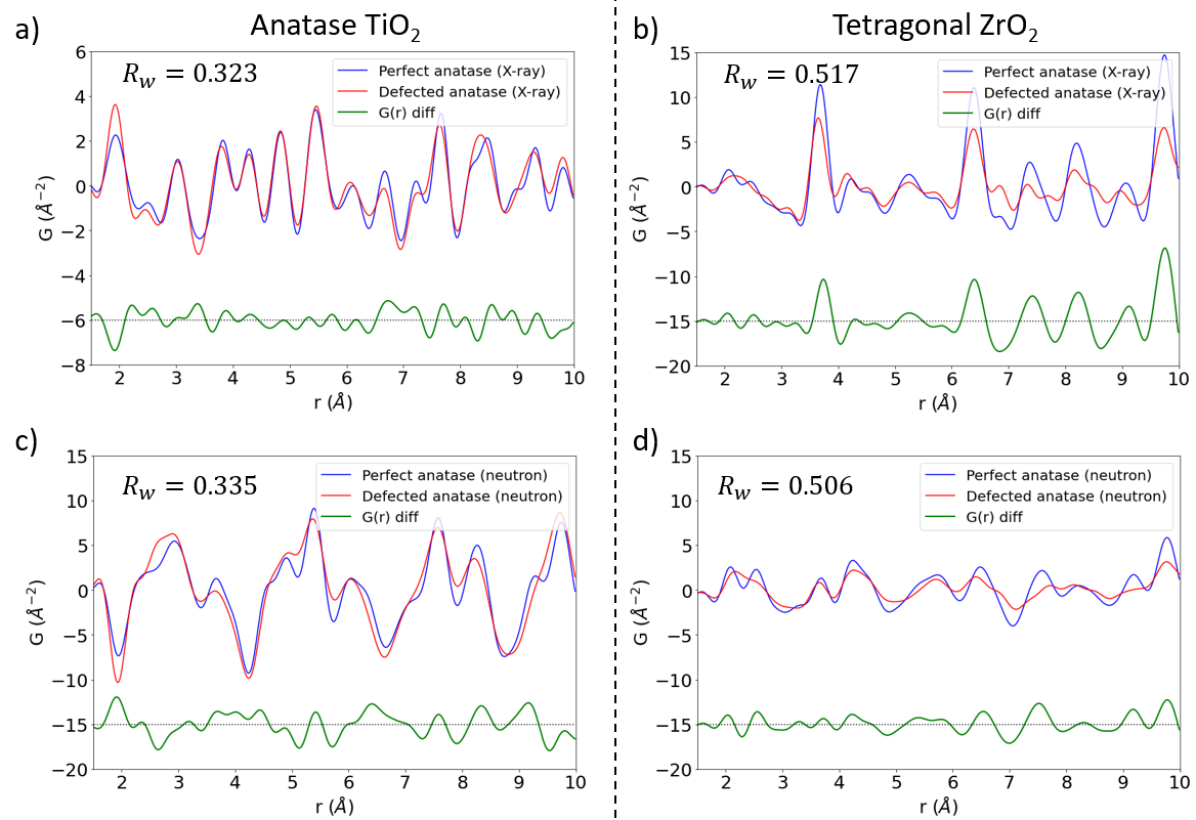
The PDFs for defected and perfect structures based on X-ray and neutron scattering are shown in Fig. S7. The defected TiO2 and ZrO2 structures are the ones that result in the lowest when refined against the PDFs of the microwave radiation-grown experimental structures. The effect of the point defects on the lattice constants is removed by setting the lattice constants of the perfect and defected structures to be the same. The difference between the PDFs of the perfect and defected structures are comparable for X-rays and neutrons. Some features, such as the peaks indicated by the vertical dashed lines in Fig S6, that are visible in X-ray PDFs are harder to see in the neutron PDFs.
Figure S7: Calculated X-ray and neutron PDFs for perfect and defected structures of anatase TiO2 [(a) and (c)] and tetragonal ZrO2 [(b) and (d)].
References
Rahimi et al. [2016]N. Rahimi, R. A. Pax, and E. M. Gray, Review of functional titanium oxides.
I: TiO2 and its modifications, Progress in Solid State Chemistry 44, 86 (2016).
Yao et al. [2007]H. Yao, L. Ouyang, and W.-Y. Ching, Ab initio calculation of elastic constants of
ceramic crystals, Journal of the American Ceramic Society 90, 3194 (2007).
Wang et al. [1999]D. Wang, Y. Guo, K. Liang, and K. Tao, Crystal structure of zirconia by rietveld refinement, Science in China Series A:
Mathematics 42, 80
(1999).
Nevitt et al. [1988]M. Nevitt, S.-K. Chan,
J. Liu, M. Grimsditch, and Y. Fang, The elastic properties of monoclinic ZrO2, Physica B+ C 150, 230 (1988).
Igawa et al. [1993]N. Igawa, Y. Ishii,
T. Nagasaki, Y. Morii, S. Funahashi, and H. Ohno, Crystal structure of metastable tetragonal zirconia by neutron
powder diffraction study, Journal of the American Ceramic Society 76, 2673 (1993).
Kisi and Howard [1998]E. H. Kisi and C. J. Howard, Elastic constants of
tetragonal zirconia measured by a new powder diffraction technique, Journal of the
American Ceramic Society 81, 1682 (1998).
Kandil et al. [1984]H. Kandil, J. Greiner, and J. Smith, Single-crystal elastic constants of
yttria-stabilized zirconia in the range 20° to 700° C, Journal of the American Ceramic
Society 67, 341
(1984).
Morgan and Watson [2010]B. J. Morgan and G. W. Watson, Intrinsic n-type defect
formation in TiO2: a comparison of rutile and anatase from GGA+U
calculations, The Journal of Physical Chemistry C 114, 2321 (2010).
Na-Phattalung et al. [2006]S. Na-Phattalung, M. F. Smith, K. Kim, M.-H. Du, S.-H. Wei, S. Zhang, and S. Limpijumnong, First-principles study of native defects in anatase TiO2, Physical Review B 73, 125205 (2006).
He and Sinnott [2005]J. He and S. B. Sinnott, Ab initio calculations of
intrinsic defects in rutile TiO2, Journal of the American Ceramic Society 88, 737 (2005).
Zhang et al. [2011]P. Zhang, Y. Lu, C.-H. He, and P. Zhang, First-principles study of the incorporation and diffusion of helium
in cubic zirconia, Journal of Nuclear Materials 418, 143 (2011).
Youssef and Yildiz [2012]M. Youssef and B. Yildiz, Intrinsic point-defect
equilibria in tetragonal ZrO2: Density functional theory analysis with
finite-temperature effects, Physical Review B 86, 144109 (2012).
Zheng et al. [2007]J. Zheng, G. Ceder,
T. Maxisch, W. Chim, and W. Choi, First-principles study of native point defects in hafnia and
zirconia, Physical Review B 75, 104112 (2007).
Liu et al. [2014]B. Liu, H. Xiao, Y. Zhang, D. S. Aidhy, and W. J. Weber, Investigation of oxygen point defects in cubic ZrO2 by density
functional theory, Computational materials science 92, 22 (2014).
Dong et al. [2017]Y. Dong, L. Qi, J. Li, and I.-W. Chen, A computational study of yttria-stabilized zirconia: II. cation
diffusion, Acta
Materialia 126, 438
(2017).