Improved Dark Matter Search Sensitivity Resulting from
LUX Low-Energy Nuclear Recoil Calibration
Abstract
Dual-phase xenon time projection chamber (TPC) detectors have demonstrated superior search sensitivities to dark matter over a wide range of particle masses. To extend their sensitivity to include low-mass dark matter interactions, it is critical to characterize both the light and charge responses of liquid xenon to sub-keV nuclear recoils. In this work, we report a new nuclear recoil calibration in the LUX detector in situ using neutron events from a pulsed Adelphi Deuterium-Deuterium neutron generator. We demonstrate direct measurements of light and charge yields down to 0.45 keV (1.4 scintillation photons) and 0.27 keV (1.3 ionization electrons), respectively, approaching the physical limit of liquid xenon detectors. We discuss the implication of these new measurements on the physics reach of dual-phase xenon TPCs for nuclear-recoil-based low-mass dark matter detection.
Introduction.—Dual-phase (liquid/gas) xenon time projection chamber (TPC) detectors provide world-leading sensitivity for a broad range of particle dark matter masses in the general class of weakly interacting massive particle (WIMP) searches Akerib et al. (2017a); Aprile et al. (2018); Meng et al. (2021); Aalbers et al. (2022). These TPCs detect nuclear recoils, producing both scintillation light (S1) and ionization charge (S2), expected from WIMP scattering off xenon nuclei in the liquid xenon (LXe) target. The low-mass dark matter detection sensitivities are partially limited by the availability of calibrations for the low-energy nuclear recoil response. Much effort has been made to understand the nuclear recoil response of this medium down to the sub-keV energy scale through various calibration techniques Akerib et al. (2016a); Lenardo et al. (2019). No previous experiment has achieved sub-keV nuclear recoil yield measurement on scintillation (S1), the limiting channel for low-mass WIMP detection. The measurements presented in this work simultaneously determine the light (Ly) and charge (Qy) yields—the generated mean quanta (light or charge) per keV for given energy depositions—down to the sub-keV scale for nuclear recoils in LXe for the first time. This work improves dark matter search sensitivity by significantly reducing uncertainty in the low energy response in these TPCs.
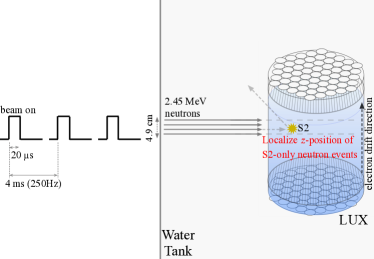
Data Collection and Analysis.—We performed an improved nuclear recoil calibration in the Large Underground Xenon (LUX) detector Akerib et al. (2013) in situ using neutron events from a pulsed Adelphi111Adelphi Technology Inc. 2003 E. Bayshore Road Redwood City, CA 94063. Deuterium-Deuterium (D-D) neutron generator in 2016.222The first LUX D-D neutron calibration (LUX DD2013) and its technique are presented in Akerib et al. (2016b); Verbus (2016); Verbus et al. (2017). LUX was a 250 kg active mass dual-phase xenon TPC instrumented with 122 2-inch photomultiplier tubes (PMTs) in two arrays at top and bottom. It was immersed in a 7.6 m diameter 6.1 m tall cylindrical water tank that provides shielding to the detector. The S1 scintillation photons are generated promptly (within a few tens of ns) at the interaction site by an incident particle (e.g. WIMP or neutron) and detected by PMTs with a scintillation gain () of photon detected (phd)/photon Akerib et al. (2016c); Faham et al. (2015). The charge signal generated from the same site is drifted upwards (1.5 mm/s) by an applied electric drift field in LXe. The electrons comprising the charge signal are subsequently extracted from the liquid surface to the gas phase and produce the proportional scintillation signal (i.e. S2). The ionization gain () is phd/electron. Each extracted electron induces a mean of phd and a 1- width of phd across PMTs Huang (2020). The time delay between S1 and S2 signals (drift time) indicates the depth () of the interaction in the LXe TPC. The position of the event is reconstructed based on the hit map of the S2 signal on the top PMT array. For more information about the LUX detector, we refer the reader to Akerib et al. (2014, 2016c, 2017b, 2016d, 2019, 2020a, 2017c, 2017d, 2016e, 2016b); Verbus (2016).
A schematic of the experimental setup is shown in Fig. 1. A collimated 2.45 MeV monoenergetic neutron beam (4.9 cm diameter) is aimed at the LUX detector about 10 cm below liquid xenon surface (the LUX active LXe volume depth is about 50 cm) to produce neutron single elastic scatter signal events. The D-D generator was operated at 250 Hz pulsing frequency and 20 s width with an instantaneous flux of ( neutrons/s). At this neutron rate the probability for more than one neutron to interact with LXe in one LUX event window (1 ms) is calculated to be around 2. In the pulsed mode, the D-D generator trigger time provides an estimate of the neutron interaction time in the TPC and thus enabled us to study low-energy events that only produce detectable ionization signals without accompanying scintillation signals (known as S2-only events).333LUX event acquisitions are triggered on S2s as in Akerib et al. (2017b) during this calibration. A total of 413.9 live-hours of short pulsed D-D neutron calibration data were collected.
Single elastic scatter D-D neutron events with exactly one observed S2 greater than 1.7 extracted electrons were selected for yield measurements, below which threshold spurious background single electrons (SE) start to have a significant impact on signals. This energy cut may accept neutron multiple scatter events with one S2 greater than the S2 threshold and others below the threshold, and this effect is taken into consideration in the signal modeling to be elaborated later. Because this experiment focuses on the low-energy neutron-induced xenon recoil events, a candidate event is allowed to have zero or one observed S1 pulses before the S2. In this work, an S1 is defined as a candidate scintillation signal without a two-fold PMT coincidence as required by other LUX analyses, and the S1 size is quantified with the number of “spikes”, the discrete photon counts in the per-channel waveforms Akerib et al. (2016c). S2s are required to follow a D-D trigger by 65 to 125 s, in line with neutron conduit depth, and be within the neutron beam projection in the plane (7 cm diameter cylinder) to reject random coincidence background. A S1–S2 time cut above s is applied to remove events with fake S1 pulses misclassified from the leading edge of an S2 pulse. No radial fiducialization cut is applied to maximize statistics. Charge loss of S2 signals for neutron events near the TPC wall is found to be a negligible systematic effect ( of signal events) Huang (2020), due to some charge buildup on the TPC wall Akerib et al. (2017b), which pushes S2 charge signals radially inward as they drift upwards.
The dominant background in this work is the so-called electron-train (e-train) events observed in all xenon TPCs. An e-train is a collection of single and clustered few-electron emissions that follow large S2 pulses with time constants of order 10 ms Akerib et al. (2020b). An S2-like e-train pulse in the TPC can mimic a low-energy neutron interaction and bias the neutron calibration. Requiring a coincidence between the D-D trigger and the TPC signals strongly rejects prevalent e-train background. Two additional data quiet-time cuts are developed to further reduce e-train background. One cut requires that there be no LUX-triggered events appearing within 4 ms before a selected signal event. The other cut requires that there be no SE pulses preceding the one S2 within a signal event (no-SE-ahead-S2 cut). Both cuts are optimized to have overall signal acceptances of , while reducing the e-train background rate by another factor of 3 and 2, respectively. The SE in the no-SE-ahead-S2 cut, however, can also be due to a neutron low-energy elastic scatter, which biases the event selection and results in a loss of signal acceptance. This cut is modeled later to address the systematics. In addition, the D-D trigger allows us to estimate the residual e-train background in the coincidence window in situ by measuring the TPC events with the S2 appearing before the D-D trigger pulse.
PMT dark counts are the major background for signal events with no (0-spike) and 1-spike S1s. The average observed rate of dark counts is in the 1-ms event windows. An accidental coincidence of dark counts with a 0-spike (S1) signal event can result in its loss and a fake 1-spike signal event. Similarly, dark counts can cause two or more observed 1-spike S1 pulses before the S2 in a 1-spike signal event. Fortunately, in the time distribution of 1-spike S1 pulses relative to the S2, PMT dark counts are uniformly distributed, while signal 1-spike S1 pulses appear in a narrow time window (D-D S1 window) before the S2s. The 0 and 1-spike S1 signal events can be disentangled from each other based on where the 1-spike S1 pulses of each event are located in the distribution. Details of the analyses are described in Huang (2020).
Two remaining backgrounds are identified and assessed. One comes from events that have an accidental S1 ( spikes) coinciding with an 0-spike signal event before the S2. These events are uniformly distributed in S1–S2 time separation. This background rate is measured using events with S1s outside the D-D S1 window and found to be about 1–2 of signal rate thanks to a low background S1 rate in LUX. The other consists of events with a D-D neutron S1, but no observed D-D neutron S2, coinciding with a random background S2 (mainly associated with the tail of an e-train). This background contaminates the lowest-energy bins. The D-D trigger tagged e-train rate is directly measured from data. The D-D neutron S1-only event rate is modeled using a LUX-adapted NEST2.0.444This background rate is constantly updated along with NEST2.0 yield models when fitting the signal model to the data to be discussed later. This background rate is given by the random coincidence rate of these two populations.
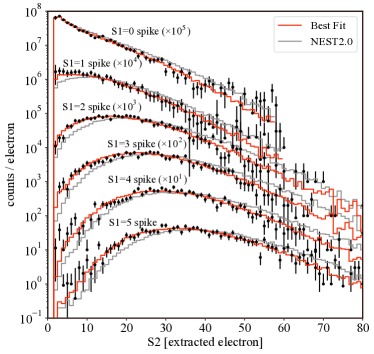
Following the event selection and background analysis, absolute rates of D-D neutron single elastic scatter event for S1 spikes are measured. The S2 spectra for each S1 are presented in Fig. 2 (black data points). The pulse areas are corrected for position-dependent detection efficiency for S2s with S1 spike using a 83mKr calibration source. The correction is not implemented for S2s with 0 and 1-spike S1s due to a lack of accurate -position information. For consistency, the same treatment for S2 pulse area is made in the signal modeling.
Signal Modeling.—To model the differential NR spectra from single elastic scatter neutron interactions at low energies, we perform a GEANT4 Agostinelli et al. (2003) based simulation with complete LUX geometry (LUXSim Akerib et al. (2012)), including the LUX water tank and the D-D neutron conduit. Neutron events with only elastic scatters or a radiative neutron capture555Radiative neutron capture by xenon isotopes results in a finite (up to 0.3 keV) NR energy deposition in LXe due to the momentum conservation from effectively instantaneous high energy gamma-ray cascades during the nuclear de-excitation following the neutron capture Huang (2020); Amarasinghe et al. (2022). but no ER energy depositions (e.g. from gamma-rays) in the active volume are selected. The four largest vertices (i.e. neutron scattering and radiative neutron capture sites) in deposited energy, if they are available, are recorded in each simulated neutron event for their neutron energies, deposited energies, and positions. This provides sufficient vertices in each event to model the aforementioned event selection systematics associated with the S2 threshold, the no-SE-ahead-S2 cut, and pulse merger of adjacent S2s in the vertical direction. The GEANT4 simulation also indicates that the neutron inelastic scatter event rate, where gamma-rays from nuclear de-excitation escape from the LUX active volume, is of the neutron single elastic scatter event rate. Neutron inelastic scatters are typically caused by fast neutrons with relatively large energy depositions. The contribution of neutron inelastic scatter events to the low energy signal population is essentially negligible and not included in the signal modeling.
The electric field strength at each recorded vertex is calculated using a LUX field model Akerib et al. (2017e) developed for the time period of this calibration as an input for the following S1 and S2 signal production modeling. In addition, due to the particularly non-uniform field Akerib et al. (2017b) in the active volume during this calibration, the observed position of a vertex is biased relative to the real position. As the above analysis is conducted in the observed space, each simulated vertex in the real space is mapped into the observed space using the same field model.
A LUX-adapted NEST2.0 Szydagis et al. (2018) program is used to simulate both production and detection of S1 and S2 signals for each recorded vertex from its deposited energy, electric field strength, and position. At the core of NEST2.0 are the empirically-determined Ly and Qy models. The recoil interaction initially produces N excitons (Xe∗) and N electron-ion (e-Xe+) pairs at the interaction site. They de-excite or recombine and produce S1 and S2 signals. The fluctuations of N and N are modeled independently by Gaussian statistics with widths () given by and , respectively, in NEST2.0, where is a Fano-like factor. The value of is consistent with 1 based on DD2013 Akerib et al. (2016b); Verbus (2016) and the XENON10 AmBe calibration Sorensen et al. (2009), but with a large uncertainty due to the lack of mono-energetic lines in NR calibrations. The treatment of is discussed in the next section.
LUX detector parameters are measured Huang (2020); Akerib et al. (2018a) in situ for the period of this calibration, including single photoelectron (SPE) mean pulse area and 1- width, double photoelectron (DPE) Faham et al. (2015) probability, SE mean pulse area and 1- width, and , etc. These parameters are used in NEST2.0 for simulating signal detection processes. Following the signal detection modeling, any two S2s in a simulated neutron event that have a separation of s (D-D neutron S2 1–99 width) in drift time are combined. The S1 to D-D trigger time is sampled from a time distribution directly measured from data and added to the drift time of each vertex to obtain the S2 to D-D trigger time for each vertex. The S2 trigger efficiency of the data acquisition system measured from a separate D-D calibration dataset Akerib et al. (2018b) is applied on S2s of each simulated event for determining an event trigger. The S2 pulse area of surviving events with S1 spike is corrected as in real data. In addition, S1 pulse finding and classification efficiencies of the LUX software as a function of size are evaluated through a dedicated visual assessment of 6000 events using the calibration data. The measured efficiencies are applied on simulated events to match with real data. In the end, all simulated events undergo the same event selection as in the real data and the resulting signal model are shown in Fig. 2 (gray histograms).
A sizeable discrepancy is seen between the calibration data and the original signal model. The discrepancy can be explained by weak constraints of the yields on the very low energy end from Akerib et al. (2016b); Verbus (2016), which the NEST2.0 yield models are mainly based on.
Yield Measurements.—Following the detailed signal modeling, we made the yield measurements by systematically adjusting the Ly and Qy models (both shapes and amplitudes down to 0 keV) embedded in NEST2.0 until the best fit of the signal model to the calibration data is achieved using the method of least squares. Both Ly and Qy models are adjusted simultaneously but independently. The shape adjustments are primarily at the low energy end ( keV). The high energy are well constrained by DD2013 Akerib et al. (2016b). Only one overall event rate normalization factor is used when fitting the six S2 spectra simultaneously. The Fano-like factor is used to adjust the S2 spectrum widths in the signal model. It is treated as a free parameter in the fitting due to its unknown uncertainty. This is a conservative treatment, and also captures other secondary factors that contribute to the signal distribution widths. The best fit is achieved at = 211.4 with 243 degrees of freedom and 8 parameters. The uncertainties on both Ly and Qy are conservatively determined through marginalizing over all other fitting parameters. This captures systematics due to degeneracy between Ly and Qy in the fitting. Because and are both in direct degeneracy with both Ly and Qy for the observed S1 and S2 distributions, contributions of their non-negligible uncertainties to the yield measurements are evaluated by repeating the fitting using and values at their 1- uncertainty levels. Details of the fitting procedures are described in Huang (2020).
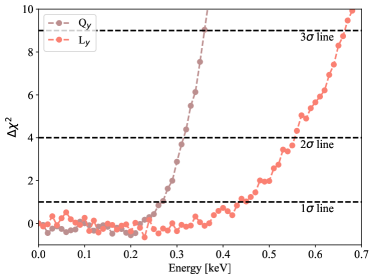
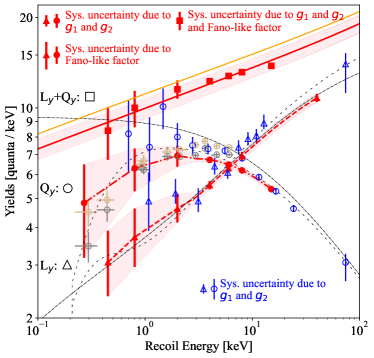
The lowest energies this calibration data are sensitive to for Ly and Qy are independently evaluated based on the above best-fit yield models. This is done by cutting off the corresponding yield (assume zero yield) below certain energies from the best-fit yield model and calculating the values with respect to the case of no energy cutoff of the signal model against the calibration data. The results are shown in Fig. 3 with 1-, 2-, and 3- sensitivity lines indicated. The quoted uncertainties are systematics due to the Fano-like factor. The lowest energies the data are sensitive to for both Ly and Qy are quoted at the 1- sensitivity level. This gives Ly and Qy measurements at keV and keV, respectively, representing the lowest-energy nuclear recoil calibrations in LXe to date. The final Ly and Qy measurements of this work (DD2016) are shown in Fig. 4.
With both Ly and Qy measurements, the Lindhard model Sorensen and Dahl (2011); Lindhard et al. (1963) which describes the quenching of electronic excitation from NR in LXe, can be constrained. The Lindhard-factor is measured to be by assuming a constant value (energy required to produce a scintillation or ionization quanta) of 13.7 eV Dahl (2009). The biexcitonic quenching Mei et al. (2008), which only effects total quanta yield at energy of keV Akerib et al. (2016b), is not included in this measurement. The value agrees with the standard Lindhard model value of 0.166 within (Fig. 4). The DD2013 measurement is Akerib et al. (2016b).
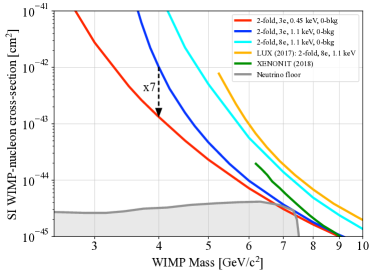
Impact on low-mass WIMP search.—This work enables us to estimate the potential sensitivity of an optimized dual-phase xenon TPC to low-mass WIMP interactions in the standard halo model Lewin and Smith (1996). The limit curves (blue and red) are generated using the NEST2.3.11 Szydagis et al. (2022) with light and charge yield models matching this work. The search looks at both S1 and S2 channels with respective two-fold PMT coincidence requirement and 3 extracted-electron threshold. A background-free 92 kg year exposure (same as LUX full exposure Akerib et al. (2017b)) is assumed. Zero WIMP acceptance is enforced for recoil energy below 0.45 keV and 1.1 keV, corresponding to the lowest yield measurements of this work and Akerib et al. (2016b), respectively. Greater than a factor of sensitivity improvement is achieved for WIMP mass GeV/c2. For tonne scale dark matter detectors, such as XENON1t Aprile et al. (2021), PandaX-4T Ma et al. (2022) and LZ Mount et al. (2017), a careful study of detector accidental coincidence backgrounds will be required to enable S1 and S2 thresholds at this level. Leveraging the DPE effect Akerib et al. (2020c, 2021) will make the approach more feasible.
This work was partially supported by the U.S. Department of Energy (DOE) under Award No. DE-AC02-05CH11231, DE-AC05-06OR23100, DE-AC52-07NA27344, DE-FG01-91ER40618, DE-FG02-08ER41549, DE-FG02-11ER41738, DE-FG02-91ER40674, DE-FG02-91ER40688, DE-FG02-95ER40917, DE-NA0000979, DE-SC0006605, DE-SC0010010, DE-SC0015535, and DE-SC0019066; the U.S. National Science Foundation under Grants No. PHY-0750671, PHY-0801536, PHY-1003660, PHY-1004661, PHY-1102470, PHY-1312561, PHY-1347449, PHY-1505868, and PHY-1636738; the Research Corporation Grant No. RA0350; the Center for Ultra-low Background Experiments in the Dakotas (CUBED); and the South Dakota School of Mines and Technology (SDSMT). Laboratório de Instrumentação e Física Experimental de Partículas (LIP)-Coimbra acknowledges funding from Fundação para a Ciência e a Tecnologia (FCT) through the Project-Grant PTDC/FIS-NUC/1525/2014. Imperial College and Brown University thank the UK Royal Society for travel funds under the International Exchange Scheme (IE120804). The UK groups acknowledge institutional support from Imperial College London, University College London, the University of Sheffield, and Edinburgh University, and from the Science & Technology Facilities Council for PhD studentships R504737 (EL), M126369B (NM), P006795 (AN), T93036D (RT) and N50449X (UU). This work was partially enabled by the University College London (UCL) Cosmoparticle Initiative. The University of Edinburgh is a charitable body, registered in Scotland, with Registration No. SC005336. This research was conducted using computational resources and services at the Center for Computation and Visualization, Brown University, and also the Yale Science Research Software Core. We gratefully acknowledge the logistical and technical support and the access to laboratory infrastructure provided to us by SURF and its personnel at Lead, South Dakota. SURF was developed by the South Dakota Science and Technology Authority, with an important philanthropic donation from T. Denny Sanford. SURF is a federally sponsored research facility under Award Number DE-SC0020216.
References
- Akerib et al. (2017a) D. Akerib et al. (LUX), Phys. Rev. Lett. 118, 021303 (2017a), arXiv:1608.07648 [astro-ph.CO] .
- Aprile et al. (2018) E. Aprile et al. (XENON), Phys. Rev. Lett. 121, 111302 (2018), arXiv:1805.12562 [astro-ph.CO] .
- Meng et al. (2021) Y. Meng et al. (PandaX-4T), Phys. Rev. Lett. 127, 261802 (2021), arXiv:2107.13438 [hep-ex] .
- Aalbers et al. (2022) J. Aalbers et al. (LUX-ZEPLIN), (2022), arXiv:2207.03764 [hep-ex] .
- Akerib et al. (2016a) D. Akerib et al. (LUX), (2016a), arXiv:1608.05381 [physics.ins-det] .
- Lenardo et al. (2019) B. Lenardo et al., Phys. Rev. Lett. 123, 231106 (2019).
- Akerib et al. (2013) D. S. Akerib et al. (LUX Collaboration), Nucl. Instrum. Methods A704, 111 (2013).
- Akerib et al. (2016b) D. S. Akerib et al. (LUX Collaboration), (2016b), arXiv:1608.05381 [physics.ins-det] .
- Verbus (2016) J. R. Verbus, An Absolute Calibration of Sub-1 keV Nuclear Recoils in Liquid Xenon Using D-D Neutron Scattering Kinematics in the LUX Detector, Ph.D. thesis, Brown University (2016).
- Verbus et al. (2017) J. R. Verbus et al., Nucl. Instrum. Meth. A851, 68 (2017), arXiv:1608.05309 [physics.ins-det] .
- Akerib et al. (2016c) D. S. Akerib et al. (LUX Collaboration), Phys. Rev. Lett. 116, 161301 (2016c).
- Faham et al. (2015) C. Faham, V. Gehman, A. Currie, A. Dobi, P. Sorensen, and R. Gaitskell, Journal of Instrumentation 10, P09010 (2015).
- Huang (2020) D. Q. Huang, Ultra-Low Energy Calibration of the LUX and LZ Dark Matter Detectors, Ph.D. thesis, Brown University (2020).
- Akerib et al. (2014) D. S. Akerib et al. (LUX Collaboration), Phys. Rev. Lett. 112, 091303 (2014).
- Akerib et al. (2017b) D. S. Akerib et al. (LUX), Phys. Rev. Lett. 118, 021303 (2017b), arXiv:1608.07648 [astro-ph.CO] .
- Akerib et al. (2016d) D. S. Akerib et al. (LUX Collaboration), Phys. Rev. Lett. 116, 161302 (2016d).
- Akerib et al. (2019) D. S. Akerib et al. (LUX), Phys. Rev. Lett. 122, 131301 (2019), arXiv:1811.11241 [astro-ph.CO] .
- Akerib et al. (2020a) D. S. Akerib et al. (LUX), Phys. Rev. D 101, 012003 (2020a), arXiv:1908.03479 [hep-ex] .
- Akerib et al. (2017c) D. S. Akerib et al. (LUX), Phys. Rev. Lett. 118, 261301 (2017c), arXiv:1704.02297 [astro-ph.CO] .
- Akerib et al. (2017d) D. S. Akerib et al. (LUX), Phys. Rev. D96, 112011 (2017d), arXiv:1709.00800 [physics.ins-det] .
- Akerib et al. (2016e) D. S. Akerib et al. (LUX Collaboration), Phys. Rev. D 93, 072009 (2016e).
- Akerib et al. (2020b) D. S. Akerib et al. (LUX), Phys. Rev. D 102, 092004 (2020b), arXiv:2004.07791 [physics.ins-det] .
- Agostinelli et al. (2003) S. Agostinelli et al. (GEANT4), Nucl. Instrum. Meth. A 506, 250 (2003).
- Akerib et al. (2012) D. S. Akerib et al., Nucl. Instrum. Meth. A675, 63 (2012), arXiv:1111.2074 [physics.data-an] .
- Amarasinghe et al. (2022) C. S. Amarasinghe, R. Coronel, D. Q. Huang, Y. Liu, M. Arthurs, S. Steinfeld, R. Gaitskell, and W. Lorenzon, (2022), arXiv:2204.03109 [physics.ins-det] .
- Akerib et al. (2017e) D. S. Akerib et al. (LUX), JINST 12, P11022 (2017e), arXiv:1709.00095 [physics.ins-det] .
- Szydagis et al. (2018) M. Szydagis et al., “Noble element simulation technique,” (2018).
- Sorensen et al. (2009) P. Sorensen et al., Nuclear Instruments and Methods in Physics Research Section A: Accelerators, Spectrometers, Detectors and Associated Equipment 601, 339 (2009).
- Akerib et al. (2018a) D. S. Akerib et al. (LUX), Phys. Rev. D97, 102008 (2018a), arXiv:1712.05696 [physics.ins-det] .
- Akerib et al. (2018b) D. S. Akerib et al., Nucl. Instrum. Meth. A908, 401 (2018b), arXiv:1802.07784 [physics.ins-det] .
- Sorensen and Dahl (2011) P. Sorensen and C. E. Dahl, Phys.Rev.D 83:063501,2011 (2011), 1101.6080 .
- Lindhard et al. (1963) J. Lindhard, M. Scharff, and H. E. Schiott, Mat. Fys. Medd . Dan. Vid. Selsk. 33 (1963).
- Dahl (2009) C. E. Dahl, The physics of background discrimination in liquid xenon, and first results from Xenon10 in the hunt for WIMP dark matter, Ph.D. thesis, Princeton U. (2009).
- Mei et al. (2008) D. M. Mei, Z. B. Yin, L. C. Stonehill, and A. Hime, Astropart. Phys. 30, 12 (2008), arXiv:0712.2470 [nucl-ex] .
- Lewin and Smith (1996) J. D. Lewin and P. F. Smith, Astropart. Phys. 6, 87 (1996).
- Szydagis et al. (2022) M. Szydagis et al., “NESTCollaboration/nest: New, flexible LXe NR yields and resolution model + G4 improvements + linear Noise + much more,” (2022).
- Aprile et al. (2021) E. Aprile et al. (XENON), Phys. Rev. Lett. 126, 091301 (2021), arXiv:2012.02846 [hep-ex] .
- Ma et al. (2022) W. Ma et al. (PandaX), (2022), arXiv:2207.04883 [hep-ex] .
- Mount et al. (2017) B. J. Mount et al., (2017), arXiv:1703.09144 [physics.ins-det] .
- Akerib et al. (2020c) D. S. Akerib et al. (LUX), Phys. Rev. D 101, 042001 (2020c), arXiv:1907.06272 [astro-ph.CO] .
- Akerib et al. (2021) D. S. Akerib et al., (2021), arXiv:2101.08753 [astro-ph.IM] .