The MURALES survey
This paper is the seventh work in the MUse RAdio Loud Emission lines Snapshot (MURALES) project series, presenting the results of observations obtained with the VLT/MUSE integral field spectrograph of 3C radio sources. Here, we discuss the optical spectral properties of the nuclei of 26 objects with (median redshift 0.51). At these redshifts, the H and [N II] emission lines are not covered by optical spectra and alternative diagnostic diagrams are needed to separate the different spectroscopic sub-classes. We derived a robust spectroscopic classification into high and low-excitation galaxies (HEGs and LEGs) by only using the ratios of emission lines in the rest-frame UV and the blue portion of the spectra. A key result of this study is that FR II LEGs are also found at the highest level of radio power (up to ), placing them among the most luminous radio sources in the Universe. Furthermore, their fraction within the FR II RG population does not strongly depend on radio luminosity. This suggests that the jet properties in powerful FR II radio sources do not depend on the accretion mode or on the structure of the accretion disk – as would otherwise be expected if the jet launching process were due to the extraction of the rotational energy of the supermassive black hole. The alternative possibility of recurrent transitions between a LEG and a HEG phase is disfavored based on the variation timescales of the various active galactic nucleus (AGN) components.
Key Words.:
Galaxies: active – Galaxies: ISM – Galaxies: nuclei – galaxies: jets1 Introduction
Optical spectroscopic information plays a major role in improving our understanding of the properties of the central engines of active galactic nuclei (AGNs). Heckman (1980) and Baldwin et al. (1981) proposed the use of optical line ratios as diagnostic tools to classify emission-line objects in general – and AGNs in particular. They introduced diagnostic diagrams (DDs) comparing selected emission line ratios showing that these are able to distinguish H II regions ionized by young stars from gas clouds ionized by nuclear activity. Moreover, AGNs were separated into Seyferts and Low Ionization Nuclear Emission-line Regions (LINERs, Heckman 1980) based on the relative ratios of the optical oxygen lines ([O I]6364, [O II]3727, and [O III]5007). Subsequently Veilleux & Osterbrock (1987) revised the definition of the DDs, using only ratios of lines with small separation in wavelength, thus removing the problems related to reddening as well as to uncertainties on the flux calibration of the spectra. These authors used the following line combinations in their study: [O III]/H as a function of [N II]6584/H, [S II]6716,6731/H, and [O I]/H. Kewley et al. (2006) selected emission line galaxies from the SDSS, finding that Seyferts and LINERs form separated branches in the DDs. They suggested that the observed dichotomy corresponds to the presence of two sub-populations of AGNs associated with different accretion states.
An attempt to adopt a similar scheme for the optical classification focusing on radio-galaxies (RGs) was made by Laing et al. (1994). They put on firmer ground the original suggestion by Hine & Longair (1979) that the edge-brightened type II Fanaroff & Riley (1974) sources (FR IIs) can be distinguished into two sub-classes. They proposed a separation into high-excitation galaxies (HEGs, defined as galaxies with [O III]H and equivalent width (EW) of [O III] 3 Å) and low-excitation galaxies (LEGs). Tadhunter et al. (1998) found a similar result from an optical spectroscopic study of the 2Jy sample, in which a sub-class of weak-line radio galaxies (sources with EW of [O III])Å) stands out due to a low ratio between emission line and radio luminosities as well as in the [O III]/[O II] line ratio.
However, despite the amount of spectroscopic data collected over the last decades for RGs, there are still several key questions awaiting clear answers; in particular, we must consider whether there are indeed two (or more) distinct populations of FR II RGs, the basis on which they can be separated, and the relevant physical parameters driving these distinctions.
Buttiglione et al. (2009, 2010, 2011) presented the results of an optical spectroscopic survey of 115 3C RGs with based on observations with the Telescopio Nazionale Galileo (TNG) and found a bimodal distribution of the relative intensity of low and high-excitation lines. Generally, HEGs are all associated with powerful radio sources () of FR II morphology, while LEGs are found at all radio power and are of both FR classes. Such a dichotomy also corresponds to a separation in nuclear properties at different wavelengths, with the HEGs being brighter than the LEGs (e.g., Chiaberge et al. 2002; Hardcastle et al. 2006; Baldi et al. 2010). This is likely related to a different structure of the accretion disk, namely, an advection-dominated accretion flow (ADAF, Narayan & Yi 1995) in LEGs and a thin radiatively efficient disk (Shakura & Sunyaev 1973) (SS disk) in HEGs; as well as to the mode of accretion (cold versus hot; Hardcastle et al. 2007). Finally, the LEGs with the highest radio power have FR II morphologies indistinguishable from those seen in HEGs (Baldi et al. 2013). This opens the possibility that the various classes of RGs might be linked by an evolutionary sequence (see, e.g., Macconi et al. 2020). This idea is supported by the results of Balmaverde et al. (2021): the sizes and luminosities of the extended emission line regions (EELRs) are similar in both HEGs and LEGs of the FR II class, indicating that they live in a similar gas rich environment. However, there are some objections with regard to this interpretation: LEGs appear to live in a richer environment (Hardcastle et al. 2007; Ineson et al. 2015) and less frequently show signs of mergers (Ramos Almeida et al. 2011, 2012) than HEGs. However, these differences are not conclusive enough to discard the evolutionary scenario because there is a substantial overlap in the properties of both the host and environment of HEGs and LEGs. Furthermore, these might be linked to the accretion and evolution of the radio source, thereby increasing, for instance, the fraction of LEGs in large galaxies and in a denser environment (Tadhunter 2016).
We have been carrying out the MUse RAdio Loud Emission lines Snapshot (MURALES) survey of observations of 3C radio sources, with the integral field spectrograph MUSE at the Very Large Telescope (VLT). We initially observed 37 galaxies with and (Balmaverde et al. 2019, 2021, 2022) and we have now extended MURALES to RGs at higher redshift observing 26 3C radio sources with (there are 29 such sources in the 3C with , but the observations of three of them were not obtained due to scheduling constraints). Here, we explore the nuclear properties of these AGNs with the main aim of deriving a spectroscopic classification, information that is key to understanding their nuclear properties and to unveil connections with, for instance, their radio power and morphology. This sample extends the coverage toward higher radio power by a factor of 10 with respect to that studied by Buttiglione et al. (2010). From the point of view of their radio structure, all 26 sources have a FR II radio morphology with a size exceeding 30 kpc, with the only exception of 3C 138, a compact steep spectrum source with a triple structure extending for only 6 kpc (Akujor et al. 1993).
These new observations also allow us to further test the unified model (UM) for radio-loud AGNs. The UM postulates that different classes of objects can be unified in a single population, differing solely for their orientation with respect to our line of sight (see, e.g., Antonucci 1993 for a review). The origin of the aspect dependent classification is due to the presence of: i) circumnuclear absorbing material that produces selective absorption when the source is observed at a large angle from its radio axis; ii) Doppler boosting associated with relativistic motions in AGN jets. Among the several pieces of evidence in favor of the UM, the most convincing one is the detection of broad lines in the polarized spectra of narrow-line objects (Antonucci 1982, 1984) interpreted as the result of scattered light from an otherwise obscured nucleus. The UM has very successfully explained the observed properties of, for instance, BL Lac object and type I Fanaroff & Riley (1974) sources, as well as of narrow and broad lined FR IIs (Urry & Padovani 1995 for a review). Lawrence (1991), Hill et al. (1996) and Willott et al. (2000) found that the fraction of narrow-line objects decreases with radio power. They proposed that this is due to a lower covering factor of the circumnuclear absorption structure in the more luminous sources, the so-called “receding torus” model.
Laing et al. (1994) have pointed out that LEGs should be excluded from a sample while testing the unified model as they represent a separate population from the HEGs (see also Wall & Jackson 1997 and Jackson & Wall 1999). Therefore, in order to test the validity of the UM for RL AGNs, it is necessary to separately treat FR II HEGs (including those showing broad permitted lines, i.e., the broad line objects, BLOs) and LEGs. The 3C catalog (Bennett 1962b, a; Spinrad et al. 1985) is perfectly suited for probing the validity the UM because it is based on the low-frequency radio emission (namely, 178 MHz), free from orientation biases. Baldi et al. (2013) already tested the UM on the 3C sources with and we are now in the position of extending this analysis to larger redshift and radio power.
However, at redshift , not all diagnostic lines (in particular H and [N II]) are covered by optical spectra and alternative diagnostics must be used. Lamareille (2010) considered the spectra of a sample of emission-line galaxies of intermediate redshift and classified them in sub-classes, star forming (SF), LINERs, and Seyferts, based on the standard DDs. These sources were then used to define the boundaries between these classes in a diagram comparing the [O III]/H and [O II]/H ratios. This method appears to be quite robust, leading to a classification generally consistent with that derived from the standard DDs for a large fraction of galaxies, paving the way for the spectral classification of sources at a higher redshift.
| Name | z | Obs. date | Exp. time | Seeing |
|---|---|---|---|---|
| 3C 016 | 0.406 | Nov 05 2020 | 1794 | 0.49 |
| 3C 093 | 0.358 | Nov 09 2020 | 1274 | 0.82 |
| 3C 099 | 0.426 | Dec 08 2020 | 1674 | 0.44 |
| 3C 107 | 0.785 | Dec 08 2020 | 2848 | 0.40 |
| 3C 109 | 0.305 | Oct 27 2020 | 1274 | 0.38 |
| 3C 114 | 0.815 | Dec 09 2020 | 2848 | 0.95 |
| 3C 138 | 0.759 | Dec 08 2020 | 21780 | 0.48 |
| 3C 142.1 | 0.406 | Dec 17 2020 | 1794 | 0.55 |
| 3C 175 | 0.768 | Dec 21 2020 | 21780 | 0.45 |
| 3C 187 | 0.465 | Dec 10 2020 | 1394 | 0.58 |
| 3C 207 | 0.684 | Dec 20 2020 | 2848 | 0.78 |
| 3C 215 | 0.411 | Nov 14 2020 | 1794 | 0.37 |
| 3C 225B | 0.582 | Feb 18 2021 | 2248 | 0.90 |
| 3C 226 | 0.817 | Mar 06 2021 | 2848 | 0.83 |
| 3C 228 | 0.552 | Jan 20 2021 | 2248 | 0.63 |
| 3C 275 | 0.480 | Apr 07 2021 | 2248 | 0.50 |
| 3C 275.1 | 0.557 | Feb 13 2021 | 2248 | 0.65 |
| 3C 277.2 | 0.766 | Mar 13 2021 | 2848 | 0.57 |
| 3C 293.1 | 0.709 | Mar 13 2021 | 2848 | 0.53 |
| 3C 306.1 | 0.441 | Feb 24 2021 | 1794 | 1.30 |
| 3C 313 | 0.461 | Mar 12 2021 | 1794 | 0.41 |
| 3C 327.1 | 0.462 | Mar 18 2021 | 1794 | 1.00 |
| 3C 334 | 0.555 | Mar 13 2021 | 2248 | 0.48 |
| 3C 434 | 0.322 | Nov 05 2020 | 1354 | 0.53 |
| 3C 435 | 0.471 | Nov 05 2020 | 1794 | 0.81 |
| 3C 455 | 0.542 | Nov 08 2020 | 2248 | 0.61 |
Column description: (1) source name (2) redshift; (3) date of the observation; (4) exposure time [s]; (5) mean seeing of the observation (in arcseconds).
| Name | z | L178 | L | AV | H | [O II] | [Ne III] | [Ne V] | Class |
|---|---|---|---|---|---|---|---|---|---|
| 3C 016.0 | 0.405 | 34.71 | 41.06 | 0.182 | 0.567 ( 2) | 2.332 ( 4) | 0.230 ( 5) | 0.063 (29) | LEG |
| 3C 093.0 | 0.357 | 34.70 | 42.20 | 0.668 | 0.104 ( 1) | 0.143 ( 5) | 0.106 ( 6) | — | BLO |
| 3C 099.0 | 0.426 | 34.74 | 43.36 | 1.057 | 0.114 ( 1) | 0.280 ( 1) | 0.089 ( 1) | 0.033 ( 1) | HEG |
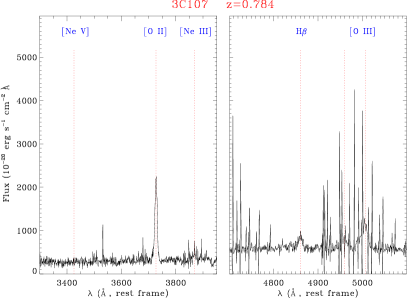
| 3C 107.0 | 0.784 | 35.31 | 41.45 | 0.442 | 0.456 ( 2) | 2.850 ( 3) | 0.140 ( 2) | 0.038 (42) | LEG |
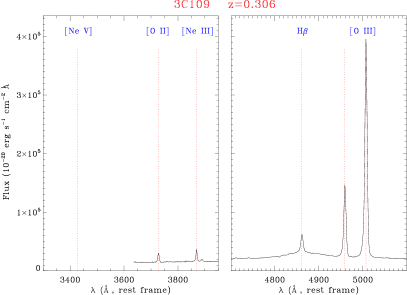
| 3C 109.0 | 0.306 | 34.73 | 43.36 | 1.608 | 0.081 ( 1) | 0.084 ( 1) | 0.076 ( 1) | — | BLO |
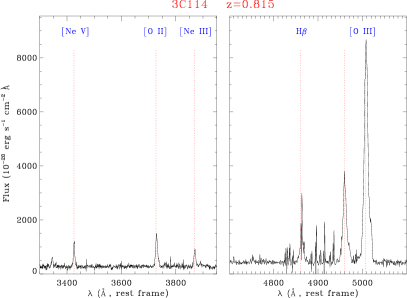
| 3C 114.0 | 0.815 | 35.13 | 42.73 | 1.543 | 0.098 ( 1) | 0.179 ( 4) | 0.084 ( 4) | 0.111 ( 1) | HEG |
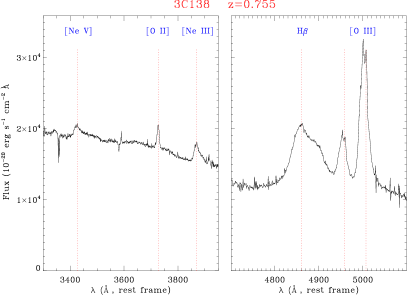
| 3C 138.0 | 0.755 | 35.59 | 43.50 | 0.799 | 0.145 ( 1) | 0.105 ( 1) | 0.090 ( 1) | 0.031 ( 1) | BLO |
| 3C 142.1 | 0.406 | 34.95 | 41.86 | 0.916 | 0.114 ( 2) | 0.722 ( 2) | 0.103 ( 4) | 0.047 ( 4) | HEG |
| 3C 175.0 | 0.770 | 35.51 | 43.40 | 0.398 | 0.089 ( 1) | 0.149 ( 1) | 0.138 ( 1) | 0.055 ( 1) | BLO |
| 3C 187.0 | 0.467 | 34.70 | 41.30 | 0.210 | 0.080 ( 4) | 0.719 ( 2) | 0.159 ( 6) | 0.084 (16) | HEG |
| 3C 207.0 | 0.680 | 35.28 | 42.80 | 0.265 | 0.079 ( 1) | 0.116 ( 1) | 0.114 ( 1) | 0.105 ( 1) | BLO |
| 3C 215.0 | 0.411 | 34.73 | 42.68 | 0.109 | 0.103 ( 1) | 0.123 ( 1) | 0.122 ( 1) | 0.140 ( 1) | BLO |
| 3C 225.0 | 0.583 | 35.33 | 42.35 | 0.151 | 0.255 ( 1) | 1.415 ( 1) | 0.147 ( 2) | 0.031 ( 5) | LEG |
| 3C 226.0 | 0.817 | 35.50 | 42.79 | 0.074 | 0.112 ( 1) | 0.254 ( 1) | 0.074 ( 1) | 0.074 ( 1) | HEG |
| 3C 228.0 | 0.552 | 35.29 | 42.08 | 0.092 | 0.139 ( 1) | 0.660 ( 1) | 0.113 ( 2) | 0.068 ( 3) | HEG |
| 3C 275.0 | 0.478 | 34.98 | 42.34 | 0.067 | 0.103 ( 1) | 0.213 ( 2) | 0.140 ( 2) | 0.196 ( 1) | HEG |
| 3C 275.1 | 0.556 | 35.22 | 42.88 | 0.076 | 0.086 ( 1) | 0.397 ( 1) | 0.089 ( 2) | 0.037 ( 1) | BLO |
| 3C 277.2 | 0.765 | 35.34 | 43.09 | 0.067 | 0.077 ( 1) | 0.126 ( 7) | 0.065 ( 9) | 0.059 ( 1) | HEG |
| 3C 293.1 | 0.709 | 35.15 | 41.00 | 0.058 | 0.259 ( 3) | 1.791 ( 4) | 0.147 (28) | 0.138 (24) | LEG |
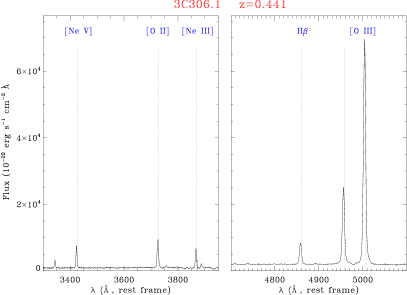
| 3C 306.1 | 0.441 | 34.87 | 42.59 | 0.274 | 0.091 ( 1) | 0.131 ( 2) | 0.063 ( 2) | 0.079 ( 1) | HEG |
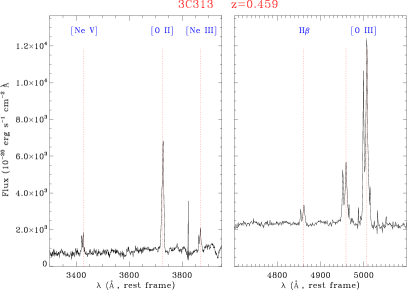
| 3C 313.0 | 0.459 | 35.09 | 41.82 | 0.084 | 0.114 ( 1) | 0.645 ( 5) | 0.096 ( 9) | 0.111 ( 3) | HEG |
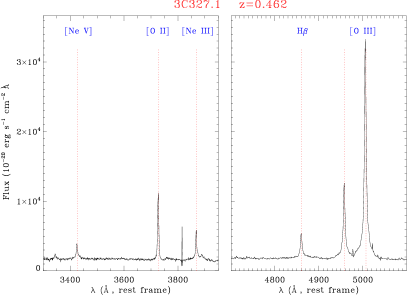
| 3C 327.1 | 0.462 | 35.16 | 42.39 | 0.364 | 0.107 ( 1) | 0.280 ( 1) | 0.144 ( 1) | 0.081 ( 1) | HEG |
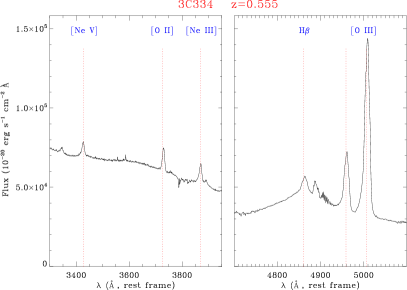
| 3C 334.0 | 0.555 | 34.99 | 43.29 | 0.113 | 0.042 ( 1) | 0.197 ( 1) | 0.156 ( 1) | 0.043 ( 2) | BLO |
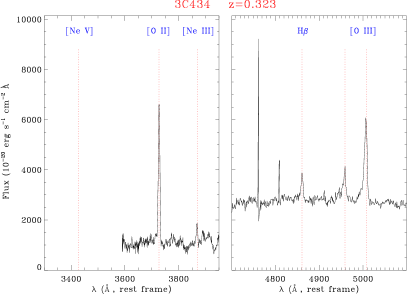
| 3C 434.0 | 0.323 | 34.13 | 41.14 | 0.255 | 0.332 ( 3) | 1.496 ( 5) | 0.210 ( 4) | — | LEG |
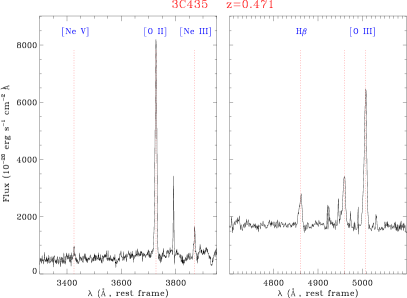
| 3C 435.0 | 0.471 | 34.87 | 41.46 | 0.163 | 0.253 ( 1) | 2.006 (12) | 0.177 (30) | 0.081 (10) | LEG |
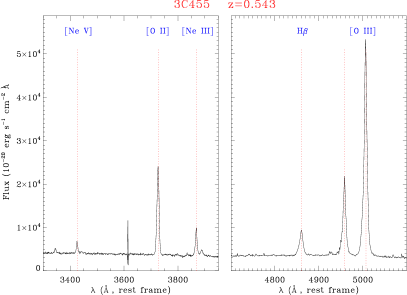
| 3C 455.0 | 0.543 | 35.04 | 42.76 | 0.138 | 0.119 ( 1) | 0.448 ( 4) | 0.140 ( 3) | 0.041 ( 2) | HEG |
Column descriptions: (1) name; (2) redshift, (3) logarithm of the radio luminosity at 178 MHz [erg s-1 Hz-1] derived from the fluxes listed by Spinrad et al. (1985) and K-corrected assuming a radio spectral index of 0.7; (4) logarithm of the [O III]5007 luminosity [erg s-1], corrected for the Galactic absorption; (5) Galactic AV; (6 through 9) de-reddened flux ratios of the diagnostic lines with respect to [O III]. The values in parentheses report the errors (in percentage) of each line; (10) spectroscopic classification, as derived in Sect. 3.
Here, we follow a similar approach with the aim of exploring the nuclear properties of the 3C sources. With respect to the analysis of Lamareille (2010), we consider additional forbidden lines, namely [Ne III] and [Ne V], testing whether they can be used to obtain a robust spectroscopic classification of these sources into the different classes. These emission lines are closer in wavelength to the [O II] doublet and this reduces the uncertainties related to the reddening correction.
The paper is organized as follows. In Sect. 2, we present the observations of the 26 RGs at intermediate redshift (izRGs) and describe the data reduction. In Sect. 3, we explore the ability of the blue diagnostic diagrams, based only on lines at wavelengths shorter than the [O III] line, to separate the various sub-classes of emission line galaxies and we derive a classification for the sources in the present sample. In Sects. 4 and 5, we study the connection between radio power and line emission and consider the implications of our findings for the unified model of radio-loud AGNs. In Sect. 6, we discuss our results and in Sect. 7, we provide a summary and our conclusions.
We adopt the following set of cosmological parameters: Mpc-1 and =0.286 (Bennett et al. 2014). The results from the literature used for comparison are all scaled to this cosmology.
2 Observations and data reduction
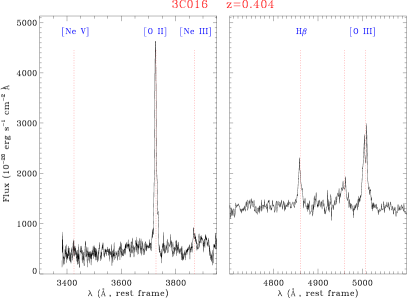
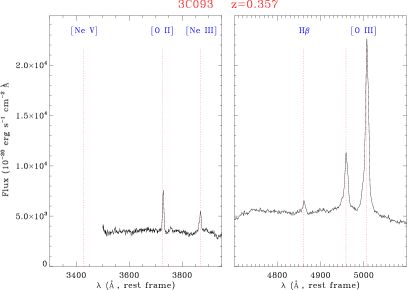
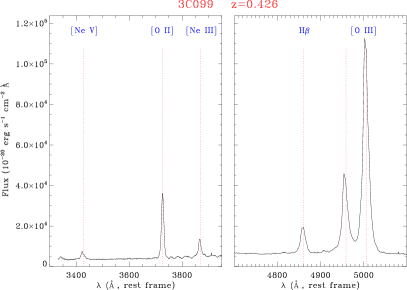
The 26 izRGs were observed between October 2020 and April 2021 with the MUSE spectrograph. The observing times increase with redshift and range from 1274 to 2848 s, see Tab. 1.1113C 138 and 3C 175 were observed twice with an exposure time of 1780 s. We used the ESO MUSE pipeline (version 1.6.2) to obtain a fully reduced and calibrated data cube. We extracted the spectrum from a synthetic aperture of 2″ 2 ″. This is the same extraction aperture used by Buttiglione et al. (2009) but in the izRGs covers a region with size between 9 and 15 kpc. We expect that the larger physical size of the extraction aperture has a limited effect, due to the dominance of the small scale emission line fluxes in all classes of RGs and, as we show later, to the similarity of the line ratios for the central and extended regions. The resulting spectra are shown in Appendix A. In several of these, stellar absorption lines are clearly visible. In these cases we subtracted the stellar continuum by using stellar population models based on the MILES stellar templates library (Vazdekis et al. 2010) and the Penalized Pixel-Fitting code (pPXF, Cappellari & Emsellem 2004; Cappellari 2017). In the remaining sources, we modeled the featureless continuum with a power law.
We then fitted the brightest emission-lines, namely [Ne V], [O II], [Ne III], H, [O III]4959,5007, in the continuum subtracted spectra. For sources having low signal-to-noise ratio (S/N) lines, we assumed that those close in wavelength (i.e., the two groups in the UV and blue portion of the spectra) have the same velocity profile. This is actually only the case for the [Ne V] line. In the sources with the lowest redshift, also the [O I]6300,6363, H, and [N II]6548,6584 lines are accessible and their intensities were also measured. The relative intensities of the lines of the [O III] and [N II] doublets were fixed to their atomic ratio of three. A single Gaussian rarely reproduces accurately the lines profiles and in most galaxies we included a second Gaussian component, with the same constraints described above. In the eight sources marked as broad line objects (BLOs), in Table 2 we include an additional broad component for the H (when visible) and H lines. In three sources (namely, 3C 138, 3C 175, and 3C 334), there is a significant contribution from iron lines. This component is removed from the spectra by using the Fe templates (properly scaled and broadened) of Vestergaard & Wilkes (2001).
3 Exploring new diagnostic diagrams
3.1 Blue diagnostic diagrams
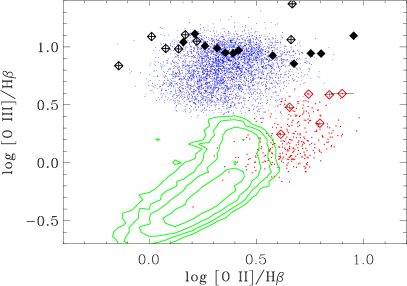
Lamareille (2010) showed that the [O III]/H versus [O II]/H diagram is a useful tool for classifying emission line galaxies at moderate redshift with optical spectra (thus not covering the [N II] and H spectral region) into star-forming, Seyferts, and LINERs. We here follow a similar approach and extend it to include additional emission line ratios. We define these diagnostic diagrams as blue-DDs.
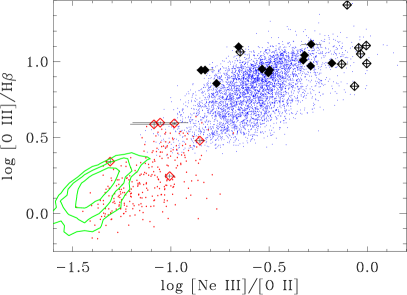
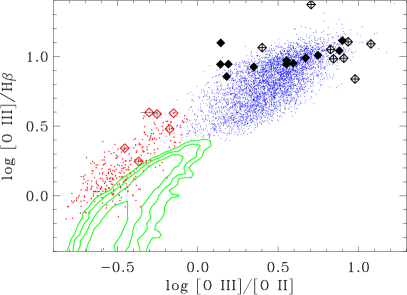
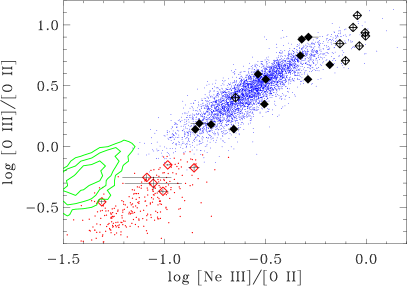
In Fig. 1 (top-left panel), we show the location in the blue-DDs of the emission line galaxies included in the main sample of 800000 sources with spectra available from the SDSS (York et al. 2000), Data Release 7, by using the MPA-JHU release of spectral measurements222Available at http://www.mpa-garching.mpg.de/SDSS/DR7/. We selected a sub-sample of sources in which all lines of interest are covered by the SDSS spectrum (i.e., with ) and are detected with a significance of at least 5. We separated them into the three classes (Seyferts, LINERs, and SF) based on their location in the [O III]/H versus [S II]/H diagram where they are best separated. We left aside the sources located at less than 0.1 dex from the boundaries between the various classes, to exclude objects of ambiguous classification. The three groups populate different regions of [O III]/H versus [O II]/H diagram with only marginal overlaps. As shown by Curti et al. (2017), the SF sequence corresponds to an increasing metallicity moving towards lower [O III]/H ratios. Out of the 26 3C izRGs (the black symbols in this figure), six are located among the LINERs/LEGs, while the eight BLOs are located into the region of Seyferts/HEGs; the remaining sources are located among the Seyferts/HEGs.
This diagram has various disadvantages with respect to the traditional DDs: 1) the quantities on both axis depend on the H line, a relatively weak line whose measurement is often difficult due to the presence of stellar absorption (in faint AGNs) or of a broad component (in type I AGNs); 2) the relatively large separation between the [O II] and H lines causes their ratio to depend on the correction for dust absorption. We then experimented with alternative blue-DDs in which one or both of these issues are overcome. Three of these diagrams are presented in Fig. 1. Overall, they confirm the results obtained from the comparison of the [O III]/H and [O II]/H ratios. In particular in the two bottom panels (showing [O III]/H versus [O III]/[O II] and [O III]/[O II] versus [Ne III]/[O II], respectively) the different spectroscopic classes among the SDSS galaxies are best separated. The 26 izRGs form two distinct groups and their location into the different regions of the diagrams is consistently maintained.
These diagrams thus enable us to classify them into the different spectroscopic classes, as reported in Tab. 2: six are LEGs and 20 are HEGs. Eight of the HEGs show the presence of broad H lines: we then classify them as BLOs. This confirms the conclusion of Buttiglione et al. (2010) that the narrow lines in BLOs have line ratios similar to those of high-excitation galaxies.
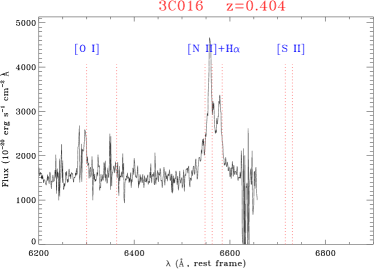
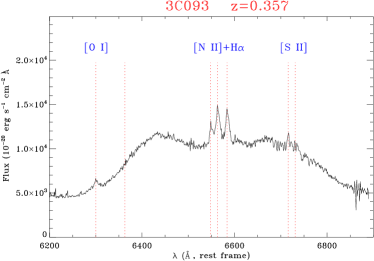
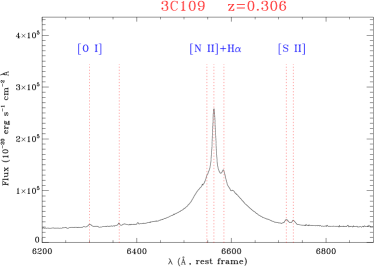
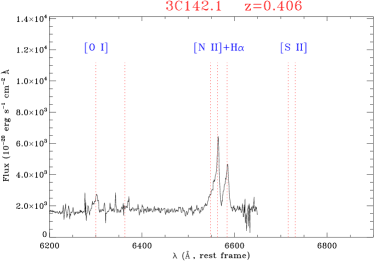
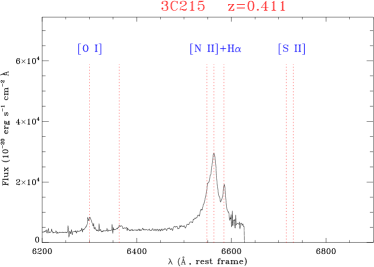
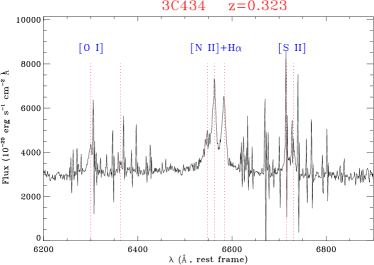
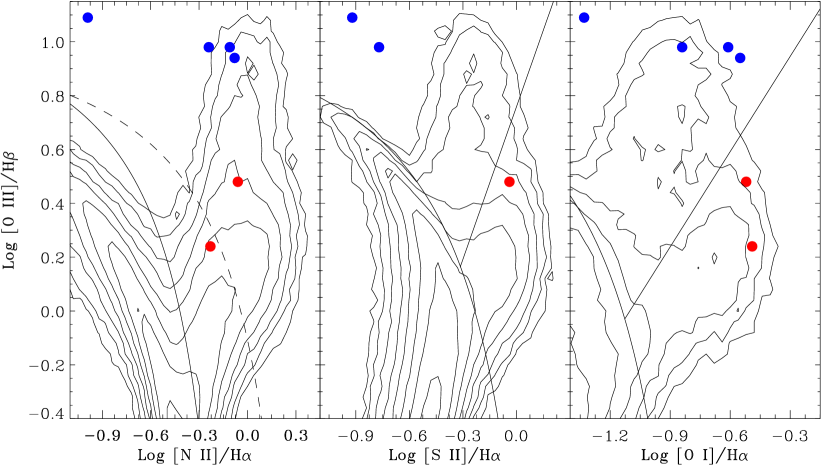
In the six izRGs at the lowest redshift (), the MUSE spectra cover the [N II]+H complex (see Fig. 5). For these objects, it is possible to derive a classification based on the traditional DDs as a sanity check for the results based on the blue-DDs. These are 3C 016 (LEG), 3C 093 (BLO), 3C 109 (BLO), 3C 142.1 (HEG), 3C 215 (BLO), and 3C 434 (LEG). Their line ratios are listed in Table 3. As shown by Fig. 6, the classification based on the blue-DDs is confirmed for these sources.
| Name | [O III]/H | [N II]/H | [S II]/H | [O I]/H |
|---|---|---|---|---|
| 3C 016.0 | 0.24 (2) | -0.23 (1) | — | -0.49 (1) |
| 3C 093.0 | 0.98 (1) | -0.11 (2) | -0.77 (2) | -0.84 (3) |
| 3C 109.0 | 1.09 (1) | -0.99 (1) | -0.92 (3) | -1.33 (1) |
| 3C 142.1 | 0.94 (2) | -0.08 (1) | — | -0.55 (1) |
| 3C 215.0 | 0.98 (1) | -0.24 (1) | — | -0.61 (1) |
| 3C 434.0 | 0.48 (3) | -0.04 (1) | -0.34 (3) | -0.52 (1) |
Columns description: (1) name; (2-4) logarithm of the diagnostic line ratios. In Fig. 6, we show the standard DDs for these sources.
3.2 Diagnostic diagrams from UV lines
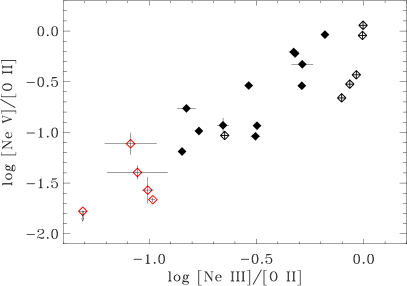
Having obtained a spectroscopic classification based on the blue-DDs, we can explore new diagrams based only on UV lines, namely, [Ne V]3426, [O II]3727, and [Ne III], the UV-DDs. In Fig. 2 we report the location of the izRGs into the [Ne V]/[O II] versus [Ne III]/[O II] plane. This is possible for all but the three sources at the lowest redshift whose MUSE spectra do not include the [Ne V] line. The sources classified as LEGs from the blue-DDs are all located in the bottom left corner of this diagram, that is, they have a relatively brighter low-ionization line with respect to the HEGs and BLOs, and they are adequately separated from the objects belonging to these two spectroscopic classes. We conclude that the UV-DDs provide us with a further robust tool for obtaining a spectroscopic AGN classification.
The importance of this UV-DDs is two-fold: it is based only on lines that are very close in wavelength, making it robust against uncertainties in the correction for dust absorption, which is particularly important in this spectral region. Secondly, these three lines are visible in optical spectra out to a redshift and this makes this diagram a unique tool for the spectral classification of distant sources.
4 Radio and emission lines connection
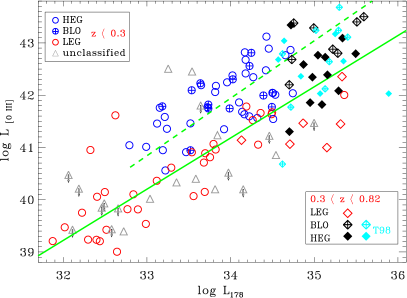
Buttiglione et al. (2010) found, based on the subsample of 3C sources with z0.3, a clear trend of increasing line luminosity with radio power. This radio-optical connection was already found and discussed by several authors (e.g., Baum & Heckman 1989a, b; Rawlings et al. 1989; Rawlings & Saunders 1991; Willott et al. 1999). By separating the different spectroscopic classes, Buttiglione et al. noted that while LEGs cover the whole range of radio power, HEGs are only found at radio luminosities larger than . By considering separately the sub-populations of HEGs and LEGs, they found that both classes obey to a quasi-linear correlation between and , with the HEGs having a line luminosity a factor of higher than LEGs in the common range of radio power.
In Fig. 3, we compare the [O III] line luminosity with the total radio luminosity at 178 MHz of the 3C sources from Buttiglione et al. (2010) and including the new measurements for the 26 3C izRGs. As expected, because the 3C is a flux limited sample, the higher redshift sources are in general those of higher radio power, extending the coverage to . We confirm the finding that HEGs and BLOs have larger line luminosities than LEGs at similar radio power. It is of great interest the result that LEGs are also found among the sources of highest radio power and we return to this topic in Sect. 6.
Overall, the eight BLOs and the 12 HEGs are located at higher line luminosities than the lower redshift 3C. However, the majority of these sources (17 out of 20) lie below the extrapolation of the - relation of the objects of these same spectroscopic classes at low-z. Considering their median radio (log [erg/s]), the expected line luminosity is a factor of 2.5 higher than the observed median value (log [erg/s]). A similar effect is found when considering the LEGs. Although the trend of increasing line luminosity with radio power is still present, the slope of radio-line decreases at the highest power.
To improve the statistical significance of this result we included in the analysis the spectroscopic study presented by Tadhunter et al. (1998). In their sample there are 16 izRGs, nine BLOs and seven HEGs based on their [O III]/[O II] ratios. Eleven izRGs of this sample are located below the extrapolation of the - relation, strengthening the statistical significance of its decreased slope at high luminosities.
Croom et al. (2002) found a similar effect in quasi-stellar objects (QSOs) where a decrease in the equivalent width of the narrow lines with increasing nuclear luminosity is observed. This is reminiscent of the Baldwin effect that is, however, seen in the permitted UV emission lines (Baldwin 1977; Baldwin et al. 1989). Croom et al. argued that this behavior is due to the NLR dimensions becoming larger than the host galaxy. This effect is directly seen from NLR imaging of type II quasars that show a flattening of the relationship between NLR size and AGN luminosity (Hainline et al. 2013, 2014). These results do not imply that there is a lack of gas at larger distances (indeed, ionized gas is seen in most of the RGs studied on scales of several tens of kiloparsec) but they indicate that in more luminous AGNs a higher fraction of nuclear ionizing photons escape without being absorbed and reprocessed by the interstellar medium (ISM).
5 Unified model for radio-loud AGNs.
As discussed in the Introduction, the unified model for radio-loud AGNs is based on the idea that the different sub-classes, for instance, broad- and narrow-lined FR II, differ only with respect to their orientation with respect to our line of sight. Here, we limit our analysis to the optical spectroscopic classification: BLOs and HEGs share similar narrow-line properties and differ mainly for the presence of an obscuring structure hiding the broad line region (BLR) in the HEG class. LEGs must be instead considered as a intrinsically different sub-class as already pointed out by Wall & Jackson (1997) and Jackson & Wall (1999).
In the sample of 3C radio sources with Baldi et al. (2013) found 18 BLOs and 33 HEGs, implying that nuclear obscuration hides the BLR in 65% of the objects: this fraction is independent of redshift, up to , and radio power, up to . In the present sample, we have 12 HEGs and 8 BLOs, with a fraction of the HEGs (40%) being slightly smaller than in lower redshift sources. Nonetheless, a test of equal proportions (Wilson 1927) indicates that there is no evidence for a statistically significant difference between the fraction of broad- and narrow-line sources below and above : a larger sample of izRGs is required to properly test the receding torus model, that is, the possibility that in the more luminous sources, the circumnuclear absorption structure has a lower covering factor.
Looking in more detail at the narrow line properties of HEGs and BLOs, the latter class shows generally higher [Ne V]/[O II], [Ne III]/[O II], and [O III]/[O II] ratios than HEGs. A similar effect has been noted by Baldi et al. (2013) by comparing the luminosity of the [O III] and [O II] lines of 3C RG with z0.3. They interpreted this result as due to the presence of a narrow line emitting region with a density higher than the [O II] critical density located within the walls of the obscuring torus: this region is visible in BLOs but is obscured in HEGs, leading to a difference in the ratios of these emission lines. The same conclusion applies to the comparison of the relative strength of the BLOs and HEGs among the 3C izRGs because, similarly to [O III], also the [Ne V] and [Ne III] have a larger critical density than [O II].333The critical densities are 1.6, 4.5, 9.7, and 7.0 cm-3 for [Ne III], [O II], [Ne V], and [O III], respectively (De Robertis & Osterbrock 1986). The presence of a density stratification within the NLR is also supported by the larger widths that are generally observed in AGN, coming from the forbidden lines with higher critical density produced by ionized gas located at smaller distances from the supermassive black hole (e.g., Balmaverde & Capetti 2014). The presence of a portion of the NLR hidden by the torus was suggested also by Haas et al. (2005) for radio-galaxies and Baum et al. (2010) for Seyfert galaxies. The connection between line and radio luminosity is also affected by the presence of this high density component of the NLR, visible only in BLOs: the median ratio is in fact 30% higher in BLOs than in HEGs.
Concerning the population of LEGs, in the izRGs sample we have 6 LEGs, corresponding to 23%; below we have 21 LEGs with a FR II morphology, 29% of the edge-brightened sources. The fraction of LEGs apparently does not strongly depend on redshift and the equal proportions test does not return a statistically significant difference between the low- and intermediate-redshift RGs.
6 Discussion
The various classes of radio loud AGNs have been interpreted as the result of different accretion rates (and accretion modes) onto the central supermassive black hole (SMBH) related to the change of the structure of the accretion disk and of the spectral energy distribution of the nuclear radiation field (Baum et al. 1995; Ghisellini & Celotti 2001; Hardcastle et al. 2007; Buttiglione et al. 2010). In fact, HEGs and LEGs differ for their nuclear properties, with HEGs/BLOs having more luminous nuclei (both in the optical, Chiaberge et al. 2002, in the X-ray, Hardcastle & Worrall 2000; Hardcastle et al. 2006, and in the near-infrared, Baldi et al. 2010) and higher Eddington ratios than LEGs of similar radio power. More specifically, LEGs are thought to be associated with a low accretion rate of hot gas forming an ADAF-like disk, while HEGs (and BLOs) are powered by a thin radiatively efficient disk maintained by a high accretion rate of cold gas. Nagao et al. (2002) suggested that the harder nuclear ionization field produced by ADAFs with respect to standard accretion disks, in particular, the larger fraction of X-ray photons, causes a relatively higher intensity of the low ionization lines. While LEGs nuclei are found both in FR classes, HEGs are only found in FR IIs.
A key result of our spectroscopic analysis of the izRGs is that FR II/LEGs are found also at the highest level of radio power, among the most luminous radio sources in the Universe. Furthermore, their fraction within the FR II RGs population does not strongly depend on radio luminosity, being 23% for 0.30.82 and 29% of the edge-brightened sources at .
Baldi et al. (2013) have shown that the distributions of radio luminosity, core dominance, and source size of the LEG and HEG/BLO classes in the FR II 3C sources at are not statistically different. A similar analysis for the izRGs is plagued by the smaller sample size. We measured the source sizes and core flux densities from the Very Large Array Sky Survey images at 3 GHz (Lacy et al. 2020). The median sizes (240 kpc and 310 kpc for LEGs and HEGs, respectively) and the median power at 178 MHz for the two classes (log L178=35.09 and log L178=35.02, both in units, for LEGs and HEGs, respectively) are both similar. Radio core measurements are possible for only 3/6 6 LEGs, 6/12 HEGs, and 6/8 BLOS. This hinders us from drawing any robust comparison of the core dominance of the different spectroscopic classes among the izRGs. Furthermore, the LEGs and HEGs cannot be readily distinguished also from a more subjective comparison, based on the presence of hot spots or on the morphology of the radio lobes.
The similarity of the radio properties between FR IIs LEGs and HEGs, contrasted by the differences in the nuclear characteristics, appear to imply that the process of jet formation is unrelated to the disk structure and to the accretion process. This is what is expected if the jet launching process in powerful radio-loud AGN is due to the extraction of the rotational energy of the supermassive black hole (Blandford & Znajek 1977; Penna et al. 2013). The link between radio power and line emission (a proxy for the AGN bolometric luminosity) indicates that, within each spectroscopic class, a connection between accretion rate and radio power is present.
Alternatively, there might be an evolutionary link between LEGs and HEGs and, for instance, the transition from a HEG to a LEG (or vice versa) might occur following a drop (or an increase) in the fuel supply within an activity cycle. Capetti et al. (2011) discussed the properties of a class of radio sources, the extremely low-excitation galaxies (ELEGs), identified as remnant objects in which the accretion has ceased. The ELEGs are characterized by an extremely low level of gas excitation, a high deficit of line emission with respect to RGs of similar radio luminosity, and a relatively low luminosity of their radio cores. Capetti et al. (2013) showed that, from the point of view of the nuclear line ratios, the transition from HEG to ELEG occurs in a time interval smaller than the NLR light travel time, namely, years. The timescale during which such sources display LEG-like line ratios is even shorter: given the duration of this phase, compared to the lifetime of radio galaxies, remnant sources cannot contribute significantly to the population of radio galaxies and to the LEG population in particular. Furthermore, ELEG have a radio core dominance much lower than the remaining population of RGs, an effect that is not observed in the LEGs.
Instead, HEGs and LEGs might be related to episodes of high and low accretion rate, namely, that the HEG phase is recurrent. The various structures of RGs respond to a change of their nuclear activity on different timescales (see Tadhunter 2016, for a more detailed discussion of this issue). In particular, the transition from HEG to LEG in the spectrum extracted from a synthetic nuclear aperture occurs, as already discussed, in years. However, Balmaverde et al. (2021) showed that ionized gas structures extend to sizes often exceeding tens of kpc in the FR IIs (in both HEGs and LEGs) and with a median size of 16 kpc. The EELR responds to changes in the nuclear ionizing field on its light travel crossing time, years. Balmaverde et al. (2022) show that the EELR in all the 15 HEGs/BLOs with has line ratios similar to those seen in their nuclei and corresponding to a classification as high-excitation regions. In a forthcoming paper, where we discuss the properties of the EELR in the izRGs, we show that the same result applies to the izRGs. Twenty-two of them (15 of which are HEGs or BLOs) have well-resolved EELR and the emission line intensities measured in the off-nuclear regions lead to the same spectroscopic classification of the nucleus (although the EELR in these higher redshift sources are often punctuated by star forming regions). The same result applies to 9 LEGs in the two samples, for a total of sources. Therefore, we have no evidence for RGs caught during the transition between HEG and LEG, or viceversa: the minimum value for this transition timescale is then years.
The extended radio structures also change if the amount of energy carried by the relativistic jets decreases following a transition from HEG to LEG, that is, if the jet properties are closely related to the accretion mode. When the jets are no longer carrying relativistic electrons (or when the injection is strongly reduced), the lobes will significantly suffer for adiabatic expansion and cooling after a timescale on the order of years (e.g., English et al. 2019). However, the hot spots will be affected on a much shorter timescale, namely, after one light crossing time to the edges of the radio source: considering the median distance of the hot spots in the RGs of our sample ( kpc), this is on the order of years. The internal sound crossing time of the hot spots, the time corresponding to a significant expansion and consequent drop of luminosity, is instead negligible in this context.
The tension between the transition timescale derived from the properties of the EELR and that obtained from the presence of hot spots in the LEGs suggests that the recurrency scenario in which HEGs and LEGs represent the manifestation of episodes of high and low accretion rates, also related to a change in the structure of the accretion disk, is highly contrived.
7 Summary and conclusions
We presented the optical nuclear spectra of 26 radio-sources from the 3C sample with a redshift (median redshift 0.51) obtained from observations with VLT/MUSE integral field unit. The aim of the present analysis is to derive an optical spectroscopic classification of these sources based on the nuclear emission line ratios, to compare the properties of the various sub-classes, and to further explore their nature.
At these redshifts, the optical spectra do not include some of the emission lines (e.g., the H and [N II] lines) that are generally used for this classification. We then considered alternative diagnostic diagrams (that we define as blue-DDs) including only emission lines with a rest-frame wavelength of Å (i.e., [Ne V], [O II], [Ne III], H, and [O III]). We showed that the blue-DDs provide a robust spectral classification. We found, among the 26 izRGs observed, six LEGs and 20 HEGs; eight sources of the latter class show broad emission lines. No star-forming galaxies are present in the sample. We also found that a diagnostic diagram based on the relative strengths of UV lines only ([Ne V], [O II], and [Ne III]) provides a clear separation between the various classes: this result is particularly important because: 1) it can be used for emission line galaxies with redshift up to and 2) these line are very close in wavelength, making their ratios robust against uncertainties in the correction for dust absorption, a significant issue in this spectral region.
The positive connection between line luminosity and radio power, already found for lower redshift sources, continues in the izRGs. However, the majority of these sources lie below the extrapolation of the - relation of the objects of these same spectroscopic classes at low-z, that is, the slope of radio-line correlation decreases at the highest power. It is likely that in more luminous AGNs a higher fraction of nuclear ionizing photons escape without being reprocessed by the ISM – a similar effect to what has already been found in QSOs.
We addressed the question of the link between the different spectroscopic classes associated with FR II radio galaxies. We found that the fraction of LEGs does not vary significantly with increasing redshift and that LEGs reach the highest level of radio power. The similarity between the radio properties of HEGs and LEGs suggests that the jet properties of the two RGs classes do not depend on the accretion mode and on the structure of the accretion disk. This is what is expected if the jet launching process in powerful radio-loud AGN is due to the extraction of the rotational energy of the supermassive black hole. The accretion mode (and rate) instead guides the dichotomy of the high energy (in the optical, UV, and X-ray bands) nuclear properties.
A possible alternative is that HEGs and LEGs are connected by a temporal sequence, due to a recurrent variation of the accretion rate. However, this is disfavored when looking at the spectroscopic properties of the EELR that are closely connected with those of the NLR: none of the radio galaxies we observed with MUSE is caught in the transition between the two classes, namely, with a HEG nucleus and a LEG EELR (or viceversa). When considering the sample as a whole, this sets a lower limit to the timescale for the duration of the different activity phases of years. This value is larger than the time of survival of the radio hot spots, of order of years, after a drop in the jet power.
Apparently, the two classes of radio galaxies are the result of different manifestations of accretion onto a supermassive black hole. Nonetheless, both populations are able to produce relativistic jets with similar properties.
Acknowledgements.
We acknowledge the contribution of the anonymous referee whose comments helped us to improve the clarity of this manuscript. B.B. acknowledges financial contribution from the agreement ASI-INAF I/037/12/0. G.V. acknowledges support from ANID program FONDECYT Postdoctorado 3200802. A.M. acknowledges financial support from PRIN-MIUR contract 2017PH3WAT. S.B. and C.O. acknowledge support from the Natural Sciences and Engineering Research Council (NSERC) of Canada. Based on observations made with ESO Telescopes at the La Silla Paranal Observatory under programme ID 0106.B-0564(A). This research has made use of the CIRADA cutout service at URL cutouts.cirada.ca, operated by the Canadian Initiative for Radio Astronomy Data Analysis (CIRADA). CIRADA is funded by a grant from the Canada Foundation for Innovation 2017 Innovation Fund (Project 35999), as well as by the Provinces of Ontario, British Columbia, Alberta, Manitoba and Quebec, in collaboration with the National Research Council of Canada, the US National Radio Astronomy Observatory and Australia’s Commonwealth Scientific and Industrial Research Organisation. This research has made use of the NASA/IPAC Extragalactic Database (NED), which is operated by the Jet Propulsion Laboratory, California Institute of Technology, under contract with the National Aeronautics and Space Administration. S. Baum and C. O’Dea are grateful to the Natural Sciences and Engineering Research Council (NSERC) of Canada.References
- Akujor et al. (1993) Akujor, C. E., Spencer, R. E., Zhang, F. J., et al. 1993, A&A, 274, 752
- Antonucci (1993) Antonucci, R. 1993, ARA&A, 31, 473
- Antonucci (1982) Antonucci, R. R. J. 1982, Nature, 299, 605
- Antonucci (1984) Antonucci, R. R. J. 1984, ApJ, 278, 499
- Baldi et al. (2013) Baldi, R. D., Capetti, A., Buttiglione, S., Chiaberge, M., & Celotti, A. 2013, A&A, 560, A81
- Baldi et al. (2010) Baldi, R. D., Chiaberge, M., Capetti, A., et al. 2010, ApJ, 725, 2426
- Baldwin (1977) Baldwin, J. A. 1977, ApJ, 214, 679
- Baldwin et al. (1981) Baldwin, J. A., Phillips, M. M., & Terlevich, R. 1981, PASP, 93, 5
- Baldwin et al. (1989) Baldwin, J. A., Wampler, E. J., & Gaskell, C. M. 1989, ApJ, 338, 630
- Balmaverde & Capetti (2014) Balmaverde, B. & Capetti, A. 2014, A&A, 563, A119
- Balmaverde et al. (2022) Balmaverde, B., Capetti, A., Baldi, R. D., et al. 2022, A&A, 662, A23
- Balmaverde et al. (2019) Balmaverde, B., Capetti, A., Marconi, A., et al. 2019, A&A, 632, A124
- Balmaverde et al. (2021) Balmaverde, B., Capetti, A., Marconi, A., et al. 2021, A&A, 645, A12
- Baum et al. (2010) Baum, S. A., Gallimore, J. F., O’Dea, C. P., et al. 2010, ApJ, 710, 289
- Baum & Heckman (1989a) Baum, S. A. & Heckman, T. 1989a, ApJ, 336, 681
- Baum & Heckman (1989b) Baum, S. A. & Heckman, T. 1989b, ApJ, 336, 702
- Baum et al. (1995) Baum, S. A., Zirbel, E. L., & O’Dea, C. P. 1995, ApJ, 451, 88
- Bennett (1962a) Bennett, A. S. 1962a, MNRAS, 125, 75
- Bennett (1962b) Bennett, A. S. 1962b, MmRAS, 68, 163
- Bennett et al. (2014) Bennett, C. L., Larson, D., Weiland, J. L., & Hinshaw, G. 2014, ApJ, 794, 135
- Blandford & Znajek (1977) Blandford, R. D. & Znajek, R. L. 1977, MNRAS, 179, 433
- Buttiglione et al. (2009) Buttiglione, S., Capetti, A., Celotti, A., et al. 2009, A&A, 495, 1033
- Buttiglione et al. (2010) Buttiglione, S., Capetti, A., Celotti, A., et al. 2010, A&A, 509, A6
- Buttiglione et al. (2011) Buttiglione, S., Capetti, A., Celotti, A., et al. 2011, A&A, 525, A28+
- Capetti et al. (2011) Capetti, A., Buttiglione, S., Axon, D. J., et al. 2011, A&A, 527, L2+
- Capetti et al. (2013) Capetti, A., Robinson, A., Baldi, R. D., et al. 2013, A&A, 551, A55
- Cappellari (2017) Cappellari, M. 2017, MNRAS, 466, 798
- Cappellari & Emsellem (2004) Cappellari, M. & Emsellem, E. 2004, PASP, 116, 138
- Chiaberge et al. (2002) Chiaberge, M., Capetti, A., & Celotti, A. 2002, A&A, 394, 791
- Croom et al. (2002) Croom, S. M., Rhook, K., Corbett, E. A., et al. 2002, MNRAS, 337, 275
- Curti et al. (2017) Curti, M., Cresci, G., Mannucci, F., et al. 2017, MNRAS, 465, 1384
- De Robertis & Osterbrock (1986) De Robertis, M. M. & Osterbrock, D. E. 1986, ApJ, 301, 727
- English et al. (2019) English, W., Hardcastle, M. J., & Krause, M. G. H. 2019, MNRAS, 490, 5807
- Fanaroff & Riley (1974) Fanaroff, B. L. & Riley, J. M. 1974, MNRAS, 167, 31P
- Fitzpatrick (1999) Fitzpatrick, E. L. 1999, PASP, 111, 63
- Ghisellini & Celotti (2001) Ghisellini, G. & Celotti, A. 2001, A&A, 379, L1
- Haas et al. (2005) Haas, M., Siebenmorgen, R., Schulz, B., Krügel, E., & Chini, R. 2005, A&A, 442, L39
- Hainline et al. (2013) Hainline, K. N., Hickox, R., Greene, J. E., Myers, A. D., & Zakamska, N. L. 2013, ApJ, 774, 145
- Hainline et al. (2014) Hainline, K. N., Hickox, R. C., Greene, J. E., et al. 2014, ApJ, 787, 65
- Hardcastle et al. (2006) Hardcastle, M. J., Evans, D. A., & Croston, J. H. 2006, MNRAS, 370, 1893
- Hardcastle et al. (2007) Hardcastle, M. J., Evans, D. A., & Croston, J. H. 2007, MNRAS, 376, 1849
- Hardcastle & Worrall (2000) Hardcastle, M. J. & Worrall, D. M. 2000, MNRAS, 314, 359
- Heckman (1980) Heckman, T. M. 1980, A&A, 87, 152
- Hill et al. (1996) Hill, G. J., Goodrich, R. W., & Depoy, D. L. 1996, ApJ, 462, 163
- Hine & Longair (1979) Hine, R. G. & Longair, M. S. 1979, MNRAS, 188, 111
- Ineson et al. (2015) Ineson, J., Croston, J. H., Hardcastle, M. J., et al. 2015, MNRAS, 453, 2682
- Jackson & Wall (1999) Jackson, C. A. & Wall, J. V. 1999, MNRAS, 304, 160
- Kewley et al. (2006) Kewley, L. J., Groves, B., Kauffmann, G., & Heckman, T. 2006, MNRAS, 372, 961
- Lacy et al. (2020) Lacy, M., Baum, S. A., Chandler, C. J., et al. 2020, PASP, 132, 035001
- Laing et al. (1994) Laing, R. A., Jenkins, C. R., Wall, J. V., & Unger, S. W. 1994, in Astronomical Society of the Pacific Conference Series, Vol. 54, The Physics of Active Galaxies, ed. G. V. Bicknell, M. A. Dopita, & P. J. Quinn, 201
- Lamareille (2010) Lamareille, F. 2010, A&A, 509, A53
- Lawrence (1991) Lawrence, A. 1991, MNRAS, 252, 586
- Macconi et al. (2020) Macconi, D., Torresi, E., Grandi, P., Boccardi, B., & Vignali, C. 2020, MNRAS, 493, 4355
- Nagao et al. (2002) Nagao, T., Murayama, T., Shioya, Y., & Taniguchi, Y. 2002, ApJ, 567, 73
- Narayan & Yi (1995) Narayan, R. & Yi, I. 1995, ApJ, 444, 231
- Penna et al. (2013) Penna, R. F., Narayan, R., & S\kadowski, A. 2013, MNRAS, 436, 3741
- Ramos Almeida et al. (2012) Ramos Almeida, C., Bessiere, P. S., Tadhunter, C. N., et al. 2012, MNRAS, 419, 687
- Ramos Almeida et al. (2011) Ramos Almeida, C., Tadhunter, C. N., Inskip, K. J., et al. 2011, MNRAS, 410, 1550
- Rawlings & Saunders (1991) Rawlings, S. & Saunders, R. 1991, Nature, 349, 138
- Rawlings et al. (1989) Rawlings, S., Saunders, R., Eales, S. A., & Mackay, C. D. 1989, MNRAS, 240, 701
- Shakura & Sunyaev (1973) Shakura, N. I. & Sunyaev, R. A. 1973, A&A, 500, 33
- Spinrad et al. (1985) Spinrad, H., Marr, J., Aguilar, L., & Djorgovski, S. 1985, PASP, 97, 932
- Tadhunter (2016) Tadhunter, C. 2016, A&A Rev., 24, 10
- Tadhunter et al. (1998) Tadhunter, C. N., Morganti, R., Robinson, A., et al. 1998, MNRAS, 298, 1035
- Urry & Padovani (1995) Urry, C. M. & Padovani, P. 1995, PASP, 107, 803
- Vazdekis et al. (2010) Vazdekis, A., Sánchez-Blázquez, P., Falcón-Barroso, J., et al. 2010, MNRAS, 404, 1639
- Veilleux & Osterbrock (1987) Veilleux, S. & Osterbrock, D. E. 1987, ApJS, 63, 295
- Vestergaard & Wilkes (2001) Vestergaard, M. & Wilkes, B. J. 2001, ApJS, 134, 1
- Wall & Jackson (1997) Wall, J. V. & Jackson, C. A. 1997, MNRAS, 290, L17
- Willott et al. (1999) Willott, C. J., Rawlings, S., Blundell, K. M., & Lacy, M. 1999, MNRAS, 309, 1017
- Willott et al. (2000) Willott, C. J., Rawlings, S., Blundell, K. M., & Lacy, M. 2000, MNRAS, 316, 449
- Wilson (1927) Wilson, E. B. 1927, Journal of the American Statistical Association, 22, 209
- York et al. (2000) York, D. G., Adelman, J., Anderson, Jr., J. E., et al. 2000, AJ, 120, 1579
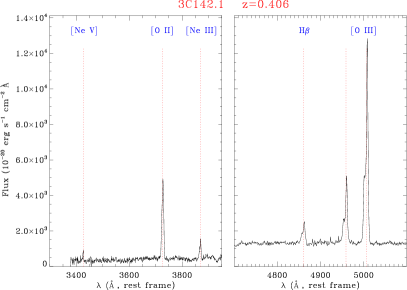
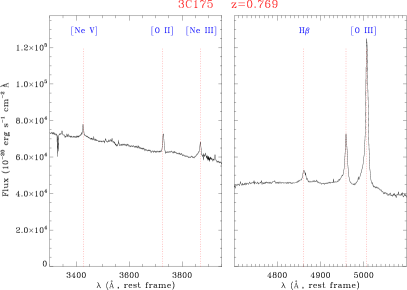
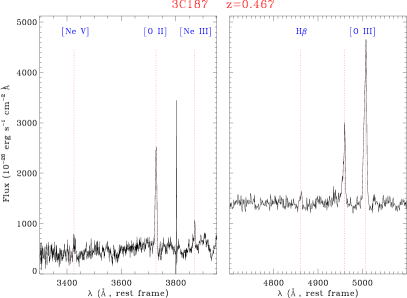
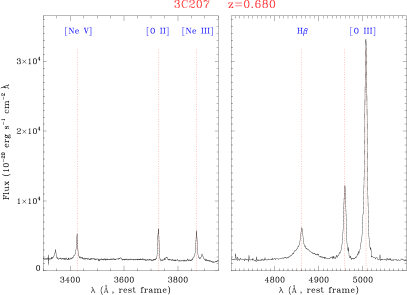
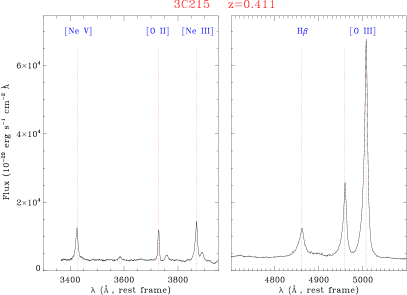
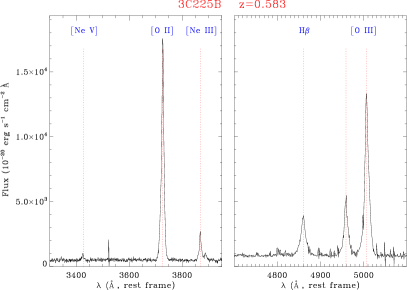
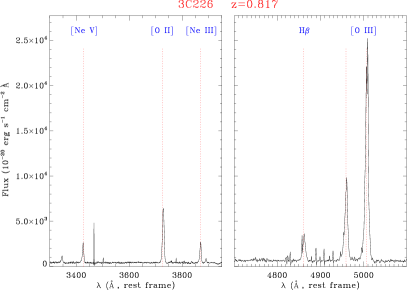
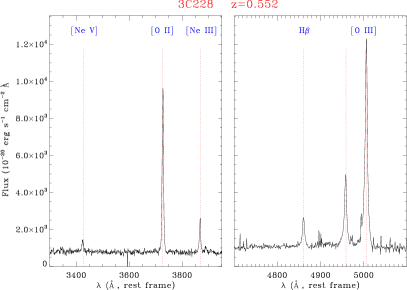
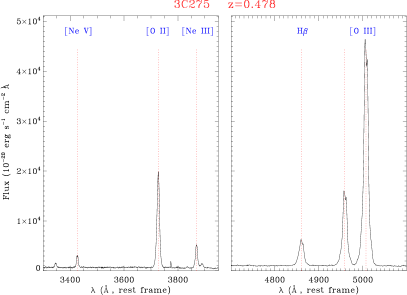
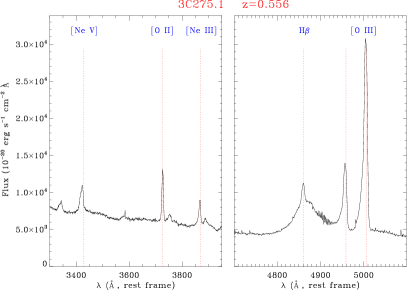
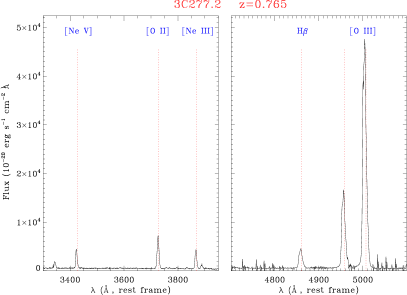
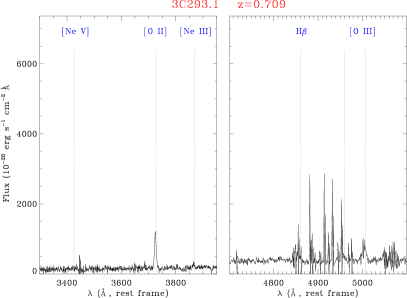
Appendix A Nuclear spectra.
We present the nuclear spectra of the 26 izRGs obtained from the MUSE observations, focusing on the spectral regions where the emission lines of interest are located.
Appendix B Red portion of the nuclear spectra.
We present the red portion of the nuclear spectra of the 26 izRGs obtained from the MUSE observations focusing on the H spectral region. The location of the six izRGs at the lowest redshift, whose spectra includes the [N II]+H complex, is shown in Fig. 6. The classification based on the standard DD is consistent with that derived from the blue-DDs.