VERTICO IV: Environmental Effects on the Gas Distribution and Star Formation Efficiency of Virgo Cluster Spirals
Abstract
We measure the molecular-to-atomic gas ratio, , and the star formation rate (SFR) per unit molecular gas mass, SFEmol, in 38 nearby galaxies selected from the Virgo Environment Traced in CO (VERTICO) survey. We stack ALMA 12CO(J=2-1) spectra coherently using HI velocities from the VIVA survey to detect faint CO emission out to galactocentric radii . We determine their scale-lengths for the molecular and stellar components and find a roughly 3:5 ratio between them compared to :1 in field galaxies, indicating that the CO emission is more centrally concentrated than the stars. We compute as a function of different physical quantities. While the spatially-resolved on average decreases with increasing radius, we find that the mean molecular-to-atomic gas ratio within the stellar effective radius , , shows a systematic increase with the level of HI, truncation and/or asymmetry (HI perturbation). Analysis of the molecular- and the atomic-to-stellar mass ratios within , and , shows that VERTICO galaxies have increasingly lower for larger levels of HIperturbation (compared to field galaxies matched in stellar mass), but no significant change in . We also measure a clear systematic decrease of the SFEmol within , SFE, with increasingly perturbed HI. Therefore, compared to galaxies from the field, VERTICO galaxies are more compact in CO emission in relation to their stellar distribution, but increasingly perturbed atomic gas increases their and decreases the efficiency with which their molecular gas forms stars.
1 Introduction
A major aim in modern astrophysics is to understand how the local physical conditions of the interstellar medium (ISM) that lead to the production of stars respond to environmental effects. That is, whether there are differences between galaxies residing in a low-density environment and those immersed in galaxy clusters.
Galaxies are known to not be evenly distributed in the Universe. For low/intermediate stellar masses, gas-rich galaxies are mainly found in low-density environments, suggesting a strong interplay between environment, gas cycle, and star-formation activity (e.g., Koribalski et al., 2004; Meyer et al., 2004). High-density environments also tend to preferentially host red galaxies (e.g., Oemler, 1974; Goto et al., 2003; Thomas et al., 2010). Numerical simulations and observational evidence have shown that galaxies lose the ability to accrete gas from the cosmic web when they fall into a more massive halo (e.g., Dressler, 1980; Dressler et al., 1997; Dekel & Birnboim, 2006; Cappellari et al., 2011; Behroozi et al., 2019; Wright et al., 2022), resulting in quenching of the star-formation activity once their original gas is depleted.
Galaxy clusters are the largest bound structures in the Universe, containing large number of galaxies tied by the cluster dark matter halos. Seminal studies have proposed several environmental mechanisms that may contribute to the quenching of star-formation. They range from strangulation/starvation (i.e., galaxies cease to accrete gas cosmologically, and they continue forming stars until their remaining disk gas is consumed; Larson et al., 1980; Balogh & Morris, 2000), ram pressure stripping (hereafter RPS, i.e. the removal of gas by ‘winds’ due to the hot intra cluster medium, ICM; Gunn & Gott, 1972), galaxy interactions (e.g., galaxy harassment; Moore et al., 1996; Boselli & Gavazzi, 2006; Smith et al., 2010), to the increase of gas stability through morphological quenching (hereafter MQ; Martig et al. 2009). However, the interplay between these different mechanisms and their relative contribution to changes in the gas content are still not precisely understood (e.g., Cortese et al., 2021).
Star-formation activity takes place in giant molecular clouds, GMCs (e.g., Sanders et al., 1985; Wong & Blitz, 2002; Kennicutt et al., 2007; Bigiel et al., 2008, 2011; Leroy et al., 2013). However, H2 reservoirs depend on the extended HI component (e.g., Verheijen & Sancisi, 2001), and the presence of atomic gas is thus important for sustaining the production of new stars over a long time scale. Observations reveal that the atomic gas can be strongly affected by high-density environments. Cluster galaxies typically contain less atomic gas than their field counterparts, and commonly show signs of truncation and perturbed HI morphologies (e.g., Haynes & Giovanelli, 1984; Chung et al., 2009; Yoon et al., 2017; Brown et al., 2017; Stevens & Brown, 2017; Watts et al., 2020a, b; Molnár et al., 2022). Although the molecular gas is closer to galaxy centers and more tightly bound than the HI (Davis et al., 2013), several studies show that the H2 is also susceptible to significant variations due to environmental effects (e.g., Fumagalli et al. 2009; Boselli et al. 2014; Lee et al. 2017; Lee & Chung 2018; Zabel et al. 2019; Lizée et al. 2021; Stevens et al. 2021; Brown et al. 2021; Zabel et al. 2022).
How the molecular gas is affected by environment, and how this impacts the star-formation activity in galaxy clusters, is a topic of current research. Several scenarios have been proposed; they span from molecular and atomic gas being disturbed and removed simultaneously, atomic gas being removed before the molecular gas, or even an enhancement in the efficiency of the atomic-to-molecular gas transition due to the compression of HI by ram pressure (e.g., Chung & Kim, 2014). Although using a small sample of galaxies with an heterogeneous set of molecular gas data, Boselli et al. (2014) find a mild statistically significant correlation between the H2 and HI deficiencies in Virgo galaxies from the Herschel Reference Survey (HRS; Boselli et al., 2010), supporting the hypothesis that they are simultaneously affected. Zabel et al. (2022) note that VERTICO galaxies with larger HI deficiencies (an indicator of how poor in HI individual galaxies are when compared to field galaxies of the same size and morphological type, Haynes & Giovanelli 1984; Warmels 1986; Cayatte et al. 1990; see also Cortese et al. 2021 for a detailed description) also have more compact and steeper H2 radial profiles. Although with significantly different physical properties than the Virgo cluster, Loni et al. (2021) find however a significant scatter in the global molecular-to-atomic ratios, , in galaxies selected from the Fornax cluster, which suggests that the effects of environmental mechanisms on the atomic-to-molecular gas transition may not be straightforward (e.g., Stevens et al., 2021).
In recent decades, a broad variety of studies on the physical conditions within local field galaxies have shown that, for the H2-dominated regions of galaxy disks, the star formation rate (SFR) per unit molecular gas mass, the star formation efficiency of the molecular gas, , does not vary strongly with radius (except for the galaxy centers; e.g., Schruba et al., 2010; Leroy et al., 2013; Villanueva et al., 2021). However, Koopmann & Kenney (2004) found an anticorrelation between the H central concentration parameter and the normalized massive star-formation rate (, where and are the H and the -band fluxes, respectively) in Virgo galaxies. Moreover, detailed studies of Virgo’s NGC 4654 galaxy by Chung & Kim (2014) show that, even though values in the north-west appear to be lower when compared to other regions with similar total gas surface density, both the atomic gas surface density, , and the SFEmol seem to be higher. They associate this effect with atomic gas being compressed, which consequently increases the molecular gas surface density, . Similar results are also found by Zabel et al. (2020), who note an enhancement of the efficiencies in low mass galaxies on their first infall into the Fornax cluster. They suggest that this is likely due gas compression by environmental effects (e.g., by RPS and tidal interactions). The relations between scale lengths might be therefore significantly different in cluster galaxies due to environmental effects. Chung et al. (2009) observed that in galaxies closer to the center of the Virgo cluster (and also in some galaxies at the outskirts), HI disks are much smaller than optical disks. Similar results are also found by Reynolds et al. (2022), who find HI disks smaller than optical disks in Hydra I cluster galaxies selected from the Widefield ASKAP L-band Legacy All-sky Blind Survey (WALLABY; Koribalski et al., 2020). However, it is less known how much the cluster environment might change the molecular gas distribution (e.g., Mok et al., 2017). Molecular gas is distributed closer to galaxy centers than HI and it is thus more tightly bound and more difficult to affect, and some removal mechanisms such as RPS may be considerably less effective on the denser molecular medium.
According to Krumholz et al. (2009), the HI-to-H2 transition takes place through gas condensation of the atomic gas when it reaches a critical surface density of M⊙ pc-2. Therefore, a plausible scenario is that RPS effects may be helping the HI to reach the critical column density. As result, the enhancement of the H2 production in Virgo galaxies may correspond to a more efficient HI-to-H2 transition. Several studies have reported observational evidence consistent with these ideas (e.g., Roediger et al., 2014; Cramer et al., 2020; Lizée et al., 2021). For instance, Lizée et al. (2021) note that NGC 4654 shows some strongly compressed atomic gas that exceeds . They also found a CO-to-H2 conversion ratio a factor higher than the Galactic value and SFEmol values around higher than the rest of the disk.
Galaxy surveys can be very helpful to understand the ensemble tendencies of the star-formation activity and how these depend on the physical conditions of the molecular gas (e.g., the HERA CO Line Extragalactic Survey, HERACLES, Leroy et al. 2008, 2013; the Herschel Reference Survey, HRS, Boselli et al. 2010; the James Clerk Maxwell Telescope Nearby Galaxies Legacy Survey, NGLS, Wilson et al. 2012; the CO Legacy Database for GALEX Arecibo SDSS Survey, COLD GASS, and the extended COLD GASS, xCOLD GASS, Saintonge et al. 2011, 2017). In this work, we determine radial length scales, mass ratios, and star formation efficiencies of molecular gas in the Virgo Environment Traced in CO survey (VERTICO; Brown et al., 2021), using ALMA Compact Array observations and ancillary data available for 38 galaxies with low inclinations. VERTICO is an ALMA Large Program designed to investigate the effect of the cluster environment on galaxies by mapping the star-forming molecular gas in 51 galaxies selected from the Virgo cluster. Since galaxy clusters are natural laboratories to test star-formation quenching processes due to environmental mechanisms, VERTICO gives us a unique opportunity to study not only their impact on molecular gas disturbances at sub-kiloparsec scales, but also to analyze how these processes affect the efficiency of the atomic-to-molecular gas transition and the star formation activity.
This paper is organized as follows: Section 2 presents the main features of the VERTICO survey and the sample selection. In Section 3 we explain the methods applied to analyze the data and the equations used to derive the physical quantities. Finally, in Section 4 we present our results and discussion, and Section 5 we summarize the main conclusions of this work.
2 DATA PRODUCTS
One of the main advantages of carrying out a systematic analysis on the VERTICO survey is the vast ancillary data gathered by studies of Virgo cluster galaxies. The VERTICO sample selection and data reduction are described in detail in Brown et al. (2021); here we summarize the main features.
2.1 The VERTICO Survey
We use molecular gas data from VERTICO111https://www.verticosurvey.com, which maps the CO(2-1) emission in 51 late-type spirals galaxies selected from the VIVA HI survey (Chung et al., 2009). The galaxies were observed with the ALMA Morita Array, including total power observations. Out of its 51 sources, 15 galaxies are taken from the ALMA archive (Cramer et al., 2020; Leroy et al., 2021a). VERTICO contains a broad diversity of galaxies experiencing different environmental effects, with stellar masses in the range , and specific star formation rates, sSFR SFR, of sSFR/yr. VERTICO cover a variety of star formation properties in Virgo cluster galaxies, including normal (SFRs similar to the global median), enhanced (galaxies above 3 times the global median), anemic (galaxies with significantly low SFRs), and truncated galaxies (sharp cutoff in the star-forming disk), based on the spatial distribution of H and -band emission (see § 2 in Koopmann & Kenney 2004 for a detailed description of these categories).
VERTICO encompasses spectroscopic observations of the transition of 12CO and its isotopologues (i.e., 13CO(2-1) and 18CO(2-1)), as well as the 1-mm continuum. The galaxies were mapped using Nyquist-sampled mosaicking; while total power (TP) plus 7-m arrays were required for 25 galaxies, the rest of the observations were performed with 7-m array only. The archival data and raw visibilities were processed using the Common Astronomy Applications Software package v. 5.6 (CASA; McMullin et al., 2007). The Compact Array data and the TP observations were combined using feathering and imaged with the PHANGS-ALMA Imaging Pipeline (v. 1.0; Leroy et al., 2021b).
For the analysis performed in this work, we use the CO(2–1) 9″ ( pc at Virgo cluster distance of 16.5 Mpc; Mei et al. 2007) datacubes with 10 km s-1 channel width. Since NGC 4321 has a native angular resolution poorer than 9″ (10″), we used CO(2-1) datacubes at 15″ ( kpc). When we compute the resolved molecular-to-atomic ratios (see § 3.2), we use the 15″ CO(2–1) datacubes, which have been matched to VIVA’s HI angular resolution. The CO datacubes have a characteristic rms noise of 15 mJy beam-1 at 5 km s-1 (see Brown et al. 2021 for more details).
2.2 Ancillary Data and Data Selection
To complement the 9″ CO(2–1) datacubes from VERTICO, we use the SFR surface density, , and stellar mass surface density, , derived from a combination of near UV and near/mid-infrared photometry. Specifically, we use the resolved star formation rate maps from GALEX and WISE photometry, which were derived by following the procedure laid out in Leroy et al. (2019). All images are convolved from their native resolution to a 9″ Gaussian beam with the Aniano et al. (2011) convolution kernels. All Gaia DR2 stars within the image area are masked. Image backgrounds are estimated and subtracted with the Astropy Background 2D function. SFR maps are constructed from a combination of GALEX NUV and WISE3 photometry as our obscured tracer in order to match the 9″ resolution which is not possible with WISE4 (see Appendix of Leroy et al. 2019 for more details). We apply a local WISE3-to-WISE4 colour correction to the WISE3 images by fitting a linear relationship between W3/W4 colour and galactocentric radius and then modify the WISE3 image on a pixel-by-pixel basis according to the galactocentric radius of each pixel and the expected W3/W4 ratio from the linear fit. For a more detailed description, see Jiménez-Donaire et al. (submitted). With GALEX NUV and colour-corrected WISE3 images for each galaxy, we then apply the NUV+WISE4 SFR calibration from Leroy et al. (2019) to derive spatially resolved SFR maps in units of M⊙ kpc-2 yr-1. All the pixels in the maps where the S/N of the NUV or the WISE3 imaging is below 3 are masked. Stellar mass maps are derived from WISE1 photometry. For each pixel, the procedure determines the local mass-to-light ratio (at 3.4m) using the WISE3 to WISE1 colour as an ‘sSFR-like’ proxy and following the calibrations given in the Appendix of Leroy et al. (2019). The WISE1 images are then combined with the derived mass-to-light ratios to produce resolved stellar mass maps in units of M⊙ pc-2. Both SFR and stellar maps at 9″ are derived by assuming a Kroupa initial mass function (IMF; Kroupa 2001). It would be interesting to verify that similar results are obtained using SFR estimators that respond on shorter timescales, such as H.
Optical inclination and position angles are obtained from fits to the Sloan Digital Sky Survey (SDSS; York et al., 2000; Alam et al., 2015) using -band photometry. In order to measure the atomic gas content and velocities, we use 21-cm moment-0 and moment-1 maps from the VLA Imaging survey of Virgo galaxies in Atomic gas (VIVA; Chung et al., 2009), which were re-imaged to resolution to match the resolution of VERTICO data (Brown et al., 2021). Finally, the isophotal radius, , is derived from the optical size of the major axis measured at 25 mag arcsec-2 in the -band, from the The Third Reference Catalogue of Bright Galaxies (RC3; de Vaucouleurs et al., 1991).
To reduce the beam-smearing effects when deriving the molecular gas profiles, we select galaxies with inclinations . Out of the 51 VERTICO galaxies, and rejecting the two nondetections of the survey (IC 3418 and VCC 1581; see Table 2 in Brown et al. 2021), we obtain a final subsample of 38 galaxies that fulfill the selection criteria.
3 Methods
3.1 Stacking of the CO Spectra

To investigate how the content (and associated quantities) changes as a function of radius, it is important to recover CO emission in the outermost parts of galaxies, which host the faintest CO emission. To achieve this, we perform a spectral stacking of the 12CO () emission line using the HI velocities to coherently align the spectra while integrating in rings. The CO spectral stacking recovers CO flux over a broad range of galactocentric radii, thus allowing us to test how both and SFEmol are affected by the environment from the inner- to the outermost parts of VERTICO galaxies.
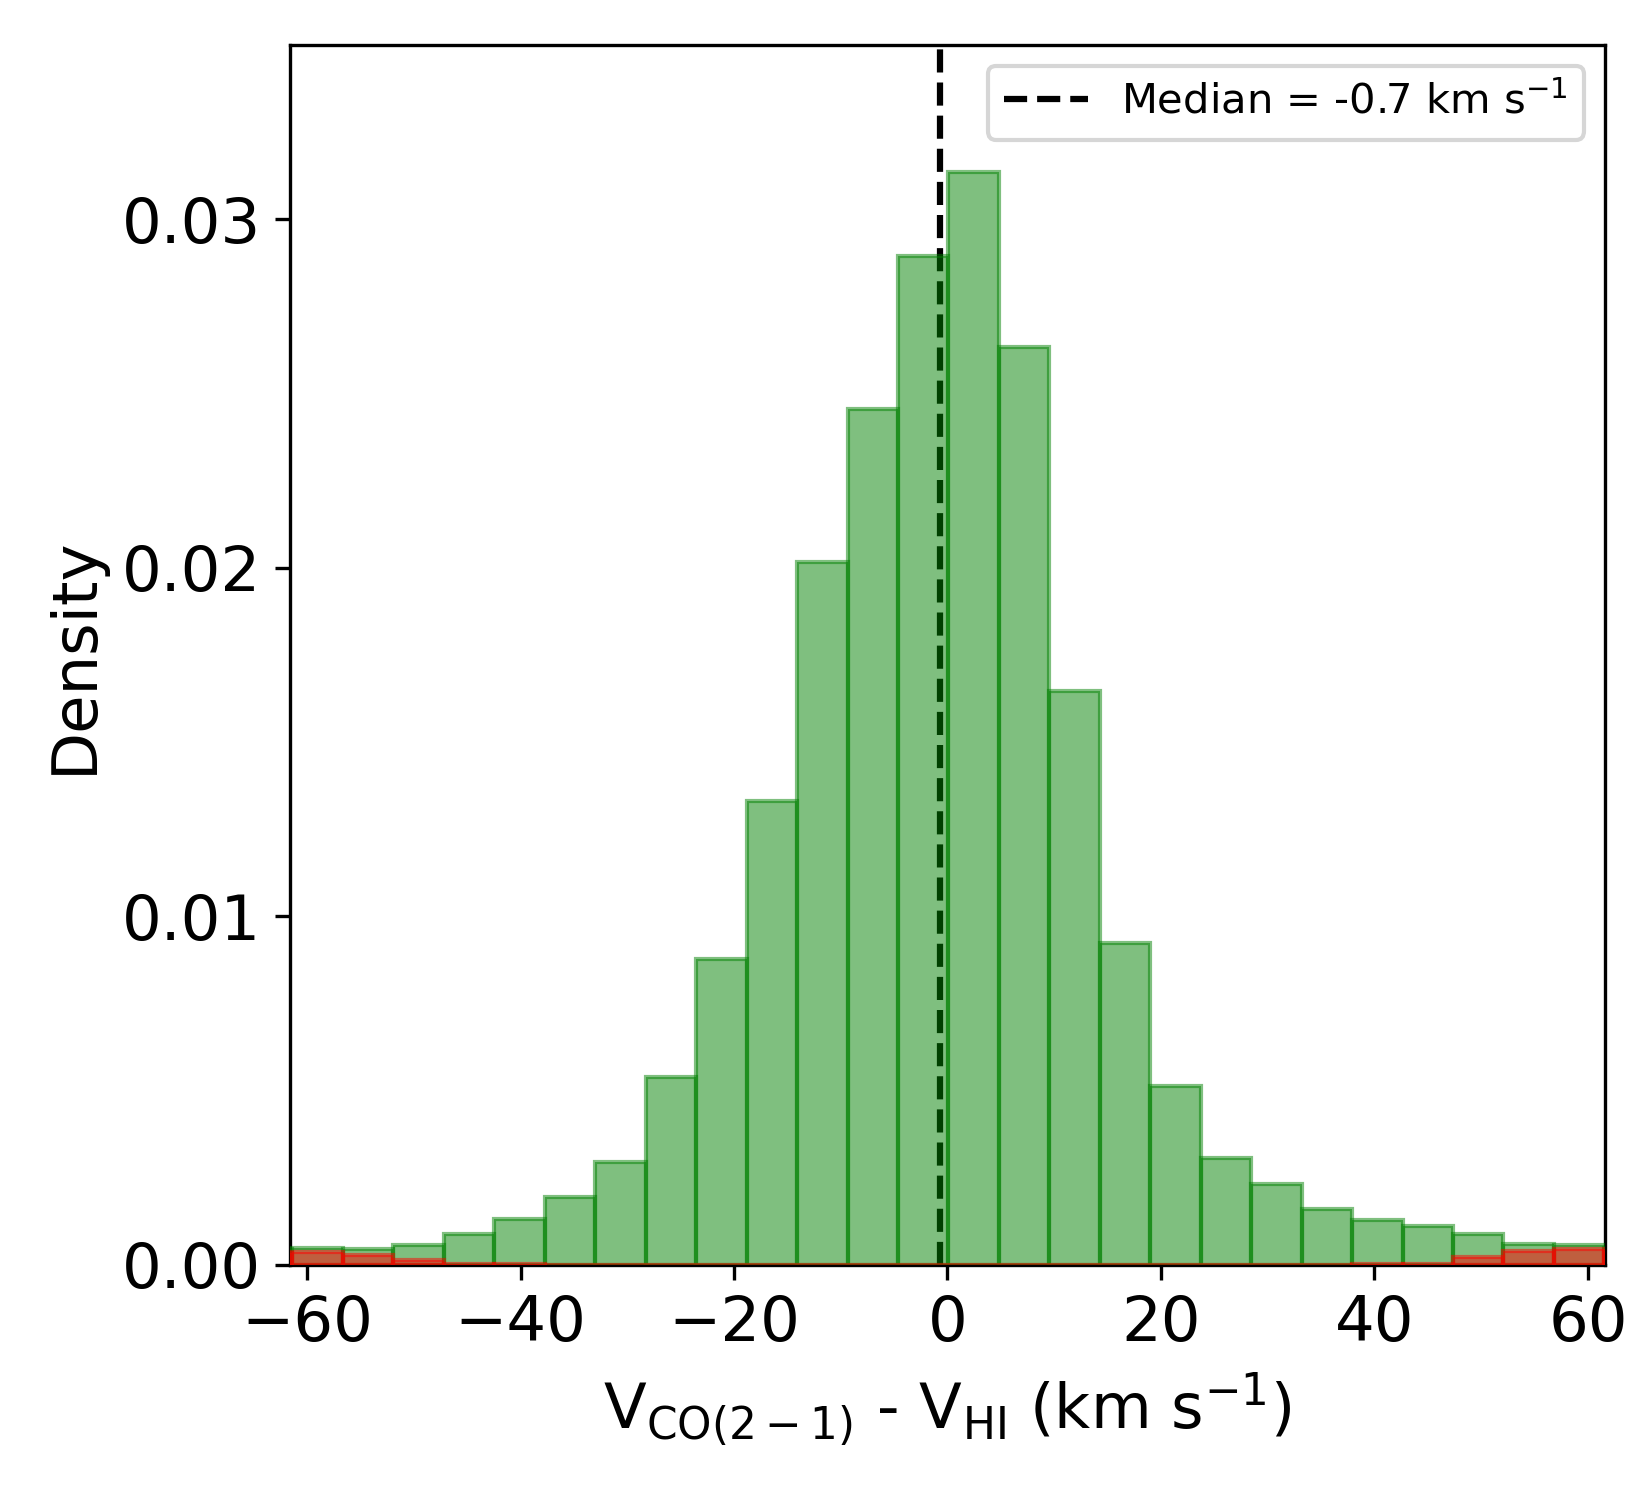
We perform the CO emission line stacking procedure following the methodology described by Villanueva et al. (2021) (see §3.1), which is based on the approach detailed in Schruba et al. (2011). The method relies on using the HI velocity data to define the velocity range for integrating CO emission. The key assumption of this method is that both the HI and CO velocities are similar at any galaxy location, which is consistent with the results shown by Levy et al. (2018) for star-forming galaxies selected from the Extragalactic Database for Galaxy Evolution (EDGE) and the Calar Alto Legacy Integral Field Area (CALIFA) surveys (The EDGE-CALIFA survey, Bolatto et al., 2017). Since this may not be the case for cluster galaxies due to environmental effects perturbing the HI and H2 in a distinct way, we test this by computing the differences between the CO(2–1) and HI velocities, , in spaxels within the 38 VERTICO galaxies included in this work. Figure 1 shows that typically the differences between the atomic gas and the CO velocities are almost always smaller than the size of the velocity integration window (discussed below). To make sure that we recover as much CO intensity as possible, we implement a “smart stacking”. We only take the stacked CO intensities in annuli where we have a strong HI signal (i.e., HI surface densities M⊙ pc-2, yielding reliable HI velocity measurements); otherwise, we take the unstacked CO intensities. Because of beam smearing in the HI, intensities in the innermost parts of the galaxies () can produce unreliable HI velocity estimates, we employ stacked CO intensities only in annuli where their SNR is larger than that of the unstacked data.
Since we are interested in radial variations of the galaxy properties of VERTICO galaxies, we stack in radial bins wide. In practice, galactocentric radius is usually a well-determined observable and it is covariant with other useful local parameters, which makes it a very useful ordinate (Schruba et al., 2011). As discussed in Villanueva et al. (2021) and later in this section, after shifting the CO spectra to match the HI velocity in each spaxel within a given annulus, we integrate over a spectral window designed to minimize missing CO flux to compute the CO (2–1) line emission intensity, . To define the integration window for the annuli, we use the third-order polynomial included in the top panel of Figure 2 in Villanueva et al. (2021). They analyze the variation of molecular velocity dispersion as a function of radius for a sample of galaxies, and found a velocity envelope that is characterized as a polynomial. We use the same relation here to define our integration window.
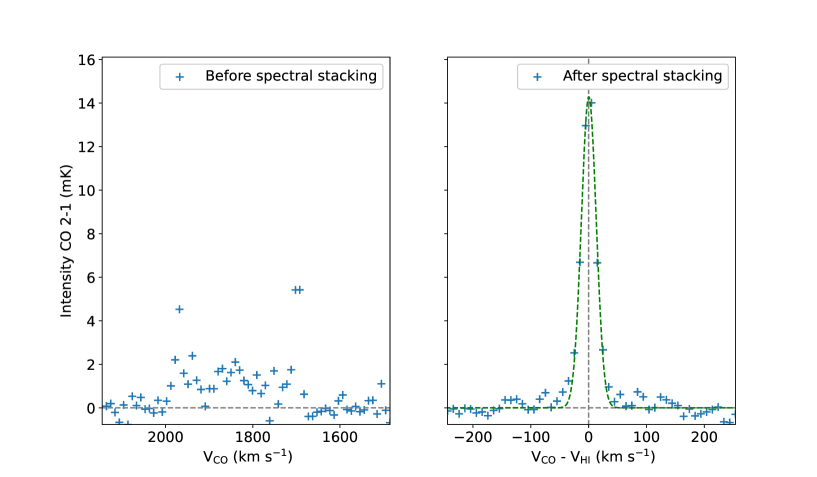
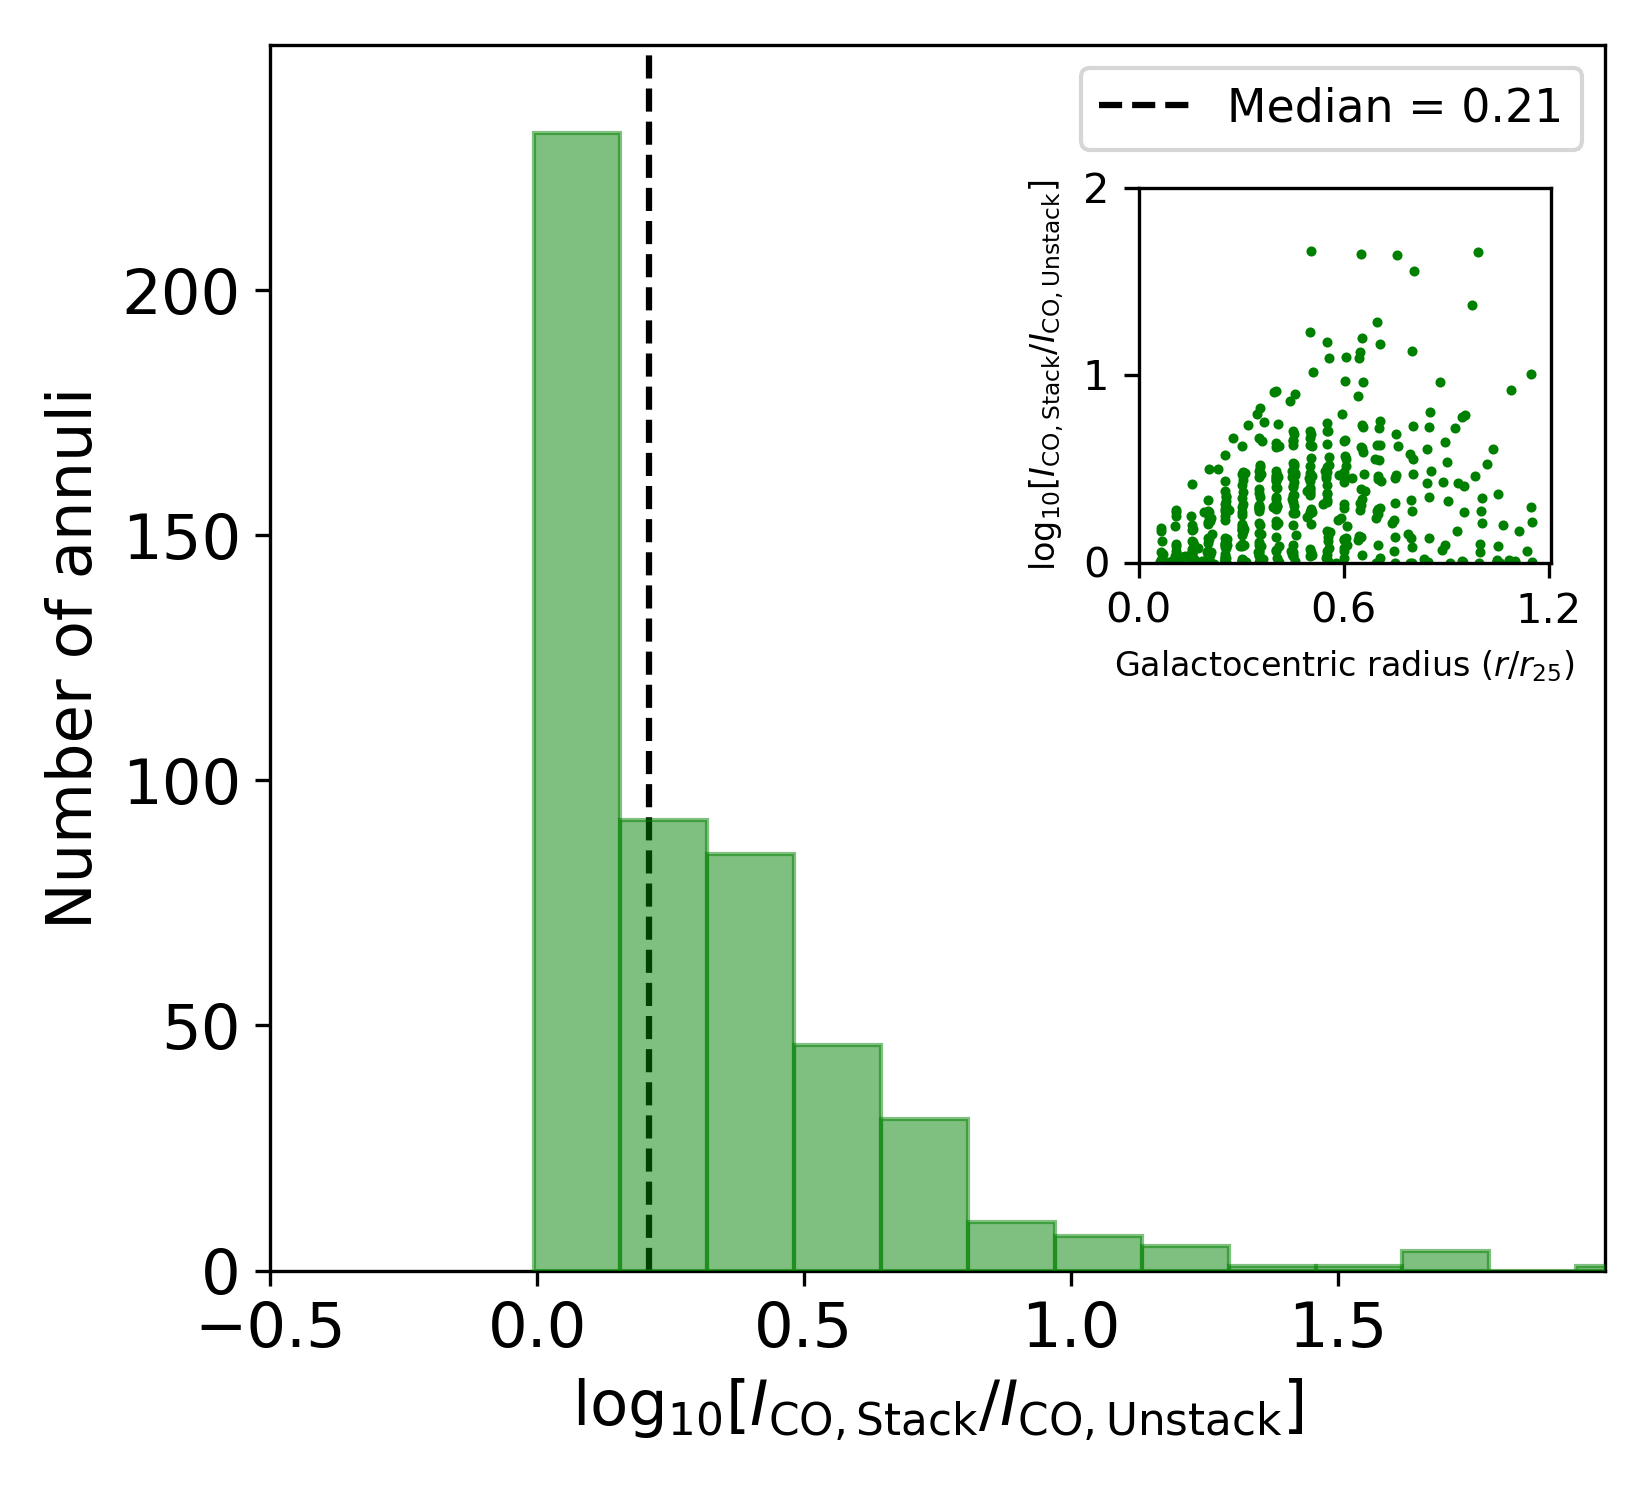
Figure 2 shows the usefulness of the stacking procedure in recovering the average CO(2–1) line emission. As an example, we show the average CO spectrum of NGC within an annulus that spans from 0.6 to 0.7. The left panel contains the average CO spectra within the given annulus using the observed velocity frame, while the right panel shows the average CO spectra after shifting by the observed HI velocity. This procedure allows us to co–add CO intensities coherently and minimize noise. Figure 2 also shows the best Gaussian fit for the averaged-stacked spectra (green-dashed line); as can be seen, the signal-to-noise ratio in the measurement of CO velocity-integrated intensity is lower and without performing the stacking procedure the CO line emission is not clearly detected. To quantify the improvement of the flux recovery, we compute the ratios between the final stacked and unstacked integrated CO(2–1) line intensity, , for each annulus. A histogram of the distribution of ratios is shown in Figure 3. We find a median ratio of ; on average, the intensity in an annulus is increased by nearly %. We emphasize that most of the annuli with significant enhancements have weak CO emission and are found at large galactocentric radii. Thus, while stacking does not result in a large increase in total CO flux from a galaxy, it does extend the range of radii over which CO is detected, and results in a more accurate (larger) measurement of flux at larger radii. To compute the integrated flux uncertainties, we take the RMS from the emission-free part of the stacked CO spectra. We adopt a clipping level of 3 in order to consider a valid detection. On average, we reach a characteristic rms noise of 0.1 mK at 10 km s-1 (in the range of rms mK), which corresponds to a sensitivity of 0.1 M⊙ pc-2 per 10 km s-1 channel. Since we are interested in comparing of the radial profiles of the molecular gas, atomic gas, stellar mass, and star formation rate, it is appropriate to average over the entire annulus rather than limiting the average to spaxels where emission is detected.
3.2 Basic Equations and Assumptions
The molecular gas surface density, , is derived from the integrated CO intensity, , by adopting a constant CO-to-H2 conversion factor, that is based on observations of the Milky Way; cm-2 (K km s-1)-1, or M⊙ for the CO(J=1–0) line (Walter et al. 2008), following the analysis by Brown et al. (2021). We also test how our results depend on the prescription that we adopt by using the CO-to-H2 conversion factor from Equation 31 in Bolatto et al. 2013:
| (1) |
in M⊙ , for M⊙ pc-2 and otherwise, and the metallicity normalized to the solar one, , where (Baumgartner & Mushotzky, 2006), is the average surface density of molecular gas in units of 100 M⊙ pc-2, and is the combined gas plus stellar surface density on kpc scales. Since we are interested in the global variations of the , we mainly focus our analysis on its dependence on , since variations in this have the dominant effect for the regions studied in our sample. Therefore, we adopt a constant solar metallicity (i.e., ). We use the following expression to obtain
| (2) |
which adopts the average VERTICO survey’s line luminosity ratio of obtained by Brown et al. (2021), and is the inclination of the galaxy. This equation takes into account the mass “correction” due to the cosmic abundance of helium.
The atomic gas surface density, , is computed from the integrated 21 cm line intensity taken from the VIVA survey (Chung et al., 2009), , by using the following equation (i.e., Leroy et al., 2008)
| (3) |
which includes both the inclination and a factor of 1.36 to account for the presence of helium.
Recent observational evidence has shown that molecular gas content and its distribution in the disk of cluster galaxies depends on the effect of the environment on the HI distribution (e.g., Chung & Kim, 2014; Boselli et al., 2014; Cortese et al., 2021; Zabel et al., 2022). In order to characterize the behavior of the molecular gas as a function of the cluster environmental effects on the atomic gas, we use the HI classification from Yoon et al. (2017) (hereafter HI-Class). The classification is designed to quantify the perturbation level of atomic radial profiles based on morpho-kinematic HI features and HI-deficiency (e.g., Haynes & Giovanelli 1984; Cortese et al. 2021) present in the VIVA survey. In total, 48 sources were selected by Yoon et al. (2017) to construct the classification, which are a good representation of Virgo galaxies undergoing various strengths of gas stripping. Note that this is different from classifying the galaxies in order of increasing HI deficiency, although more highly disturbed galaxies tend to be more HI deficient. According to Yoon et al. (2017), the 38 VERTICO galaxies analyzed in this work can be categorized into the following five classes (including the number of galaxies in each of them):
-
0.
Class 0 (11 galaxies): The HI profiles are symmetric, not truncated, and have extended and similar HIcontent compared to most normal field galaxies. These are therefore the cases showing no definite signs of gas stripping due to the ICM.
-
1.
Class I (7 galaxies): One-sided HI feature, such as a tail, and no truncation of the HI disk within the relatively symmetric stellar disk; range of HI deficiencies shown, but overall comparable to those of field galaxies.
-
2.
Class II (5 galaxies): A highly asymmetric HI disk, with one-sided gas tails, extraplanar gas, and/or HI disk truncation on at least one side of the stellar disk; quite deficient in HI with an average of only 17% of the typical HI mass of a field counterpart.
-
3.
Class III (9 galaxies): A symmetric, but severely truncated HI disk; extremely deficient in HI with an average of 4% of the HI mass of a field galaxy counterpart.
-
4.
Class IV (6 galaxies): A symmetric HI disk with marginal truncation within the radius of the stellar disk; lower HI surface density than the other subclasses; quite deficient in HI with on average 15% of the HI mass of a field galaxy counterpart.
A more quantitative description of these galaxy categories can be found in Yoon et al. (2017). Since a definition of the HI-Classes based on a single criterion is not trivial, we also complement this classification by categorizing these five HI-Classes in three broader groups as follows: i) Unperturbed galaxies (HI-Class 0); ii) asymmetric galaxies (HI-Classes I and II); and iii) symmetric-truncated galaxies (HI-Classes III and IV). These HI-Groups represent a powerful classification, which boost the statistics and provide a simpler analysis framework.
The spatially-resolved molecular-to-atomic gas ratio, , is calculated as
| (4) |
Similarly, we compute the spatially resolved molecular-to-stellar and the atomic-to-stellar ratios, and , respectively, where is the stellar surface density derived from the WISE band-1 data. To obtain the integrated values for these ratios (i.e. mass ratios), we integrate the surface densities for the molecular gas, atomic gas, and stars (assuming that they are distributed along a thin disk) to obtain the total masses as:
| (5) |
where is the effective radius for the stellar component (see §4.2 for more details), and mol, atom, . We then calculate the integrated ratios as the ratio of the masses. We compute the resolved SFR surface density per unit molecular gas surface density, i.e. the star formation efficiency of the molecular gas (SFEmol, in units of yr-1) for each annulus,
| (6) |
where is the resolved SFR surface density. We also obtain the integrated star formation efficiency of the molecular gas within , SFE, using , , and Equation 5, so
| (7) |
3.3 CO Radial Profiles
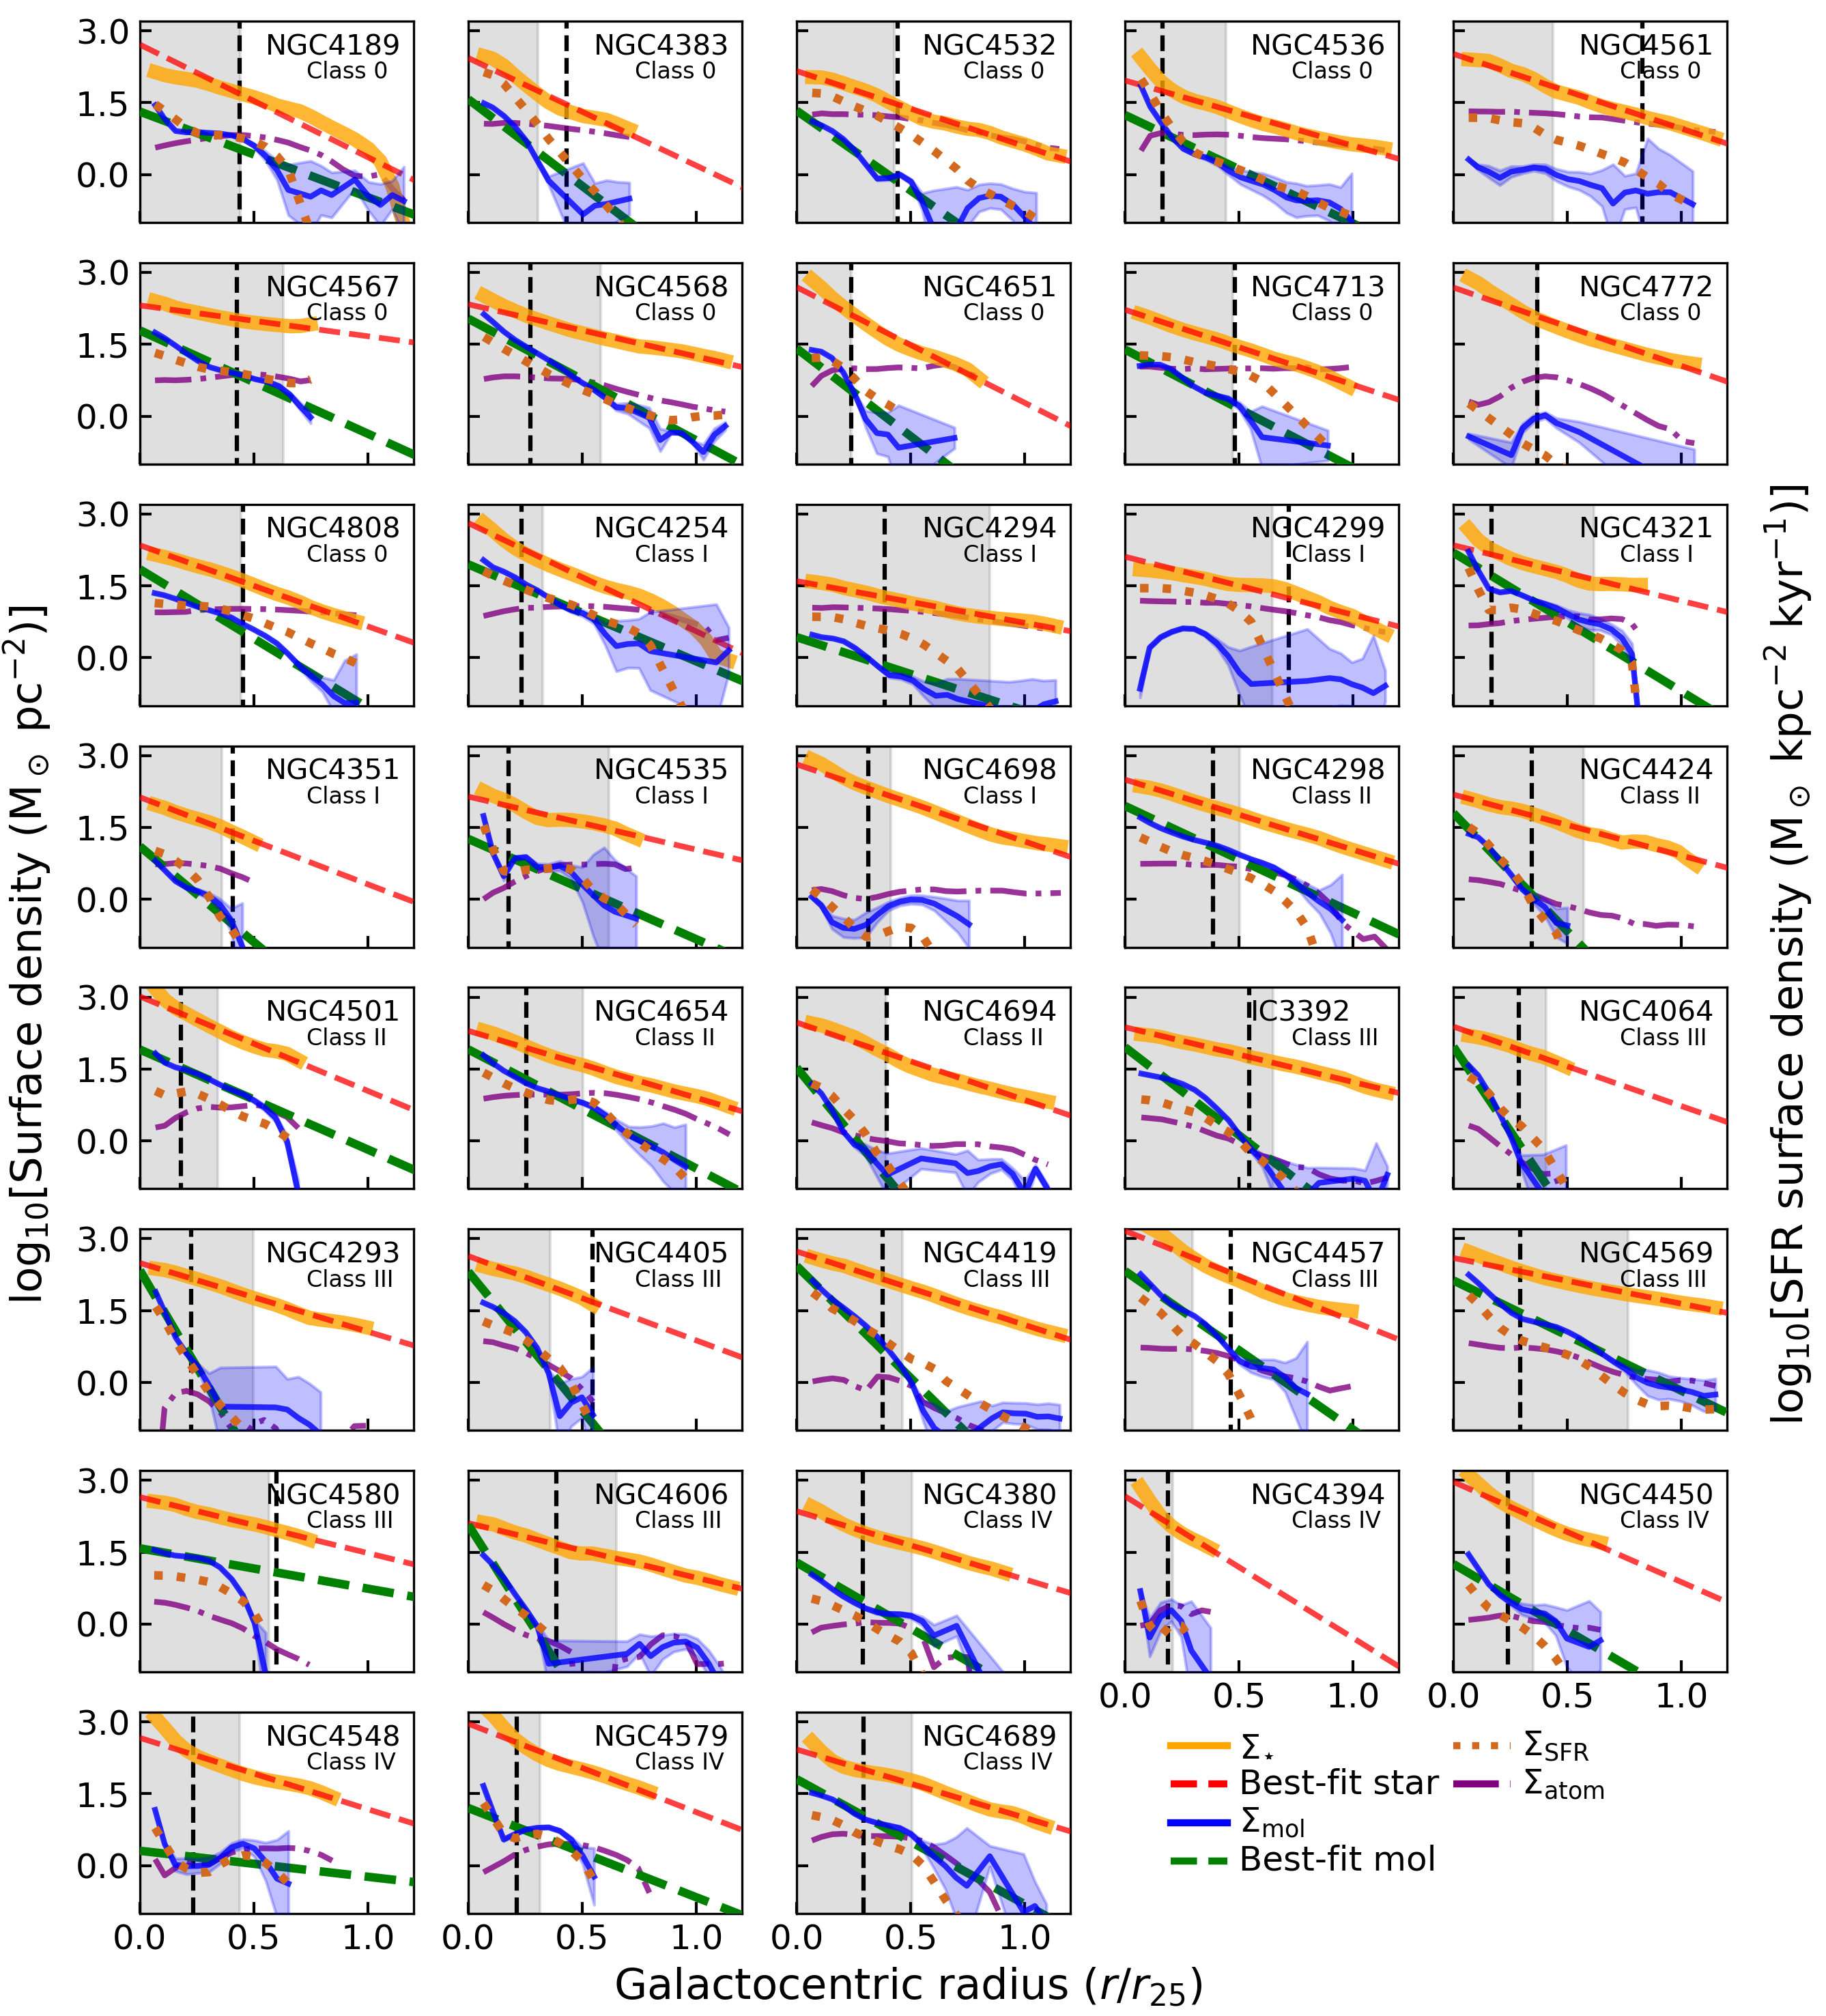
As discussed in §3.1, we derive the molecular gas radial profiles by measuring the averaged azimuthal CO surface density, after performing a spectral stacking, in elliptical annuli in the 9″ CO(2–1) datacubes. Although CO radial profiles for VERTICO galaxies are already presented in Brown et al. (2021) and Zabel et al. (2022) (both using the same methodology described in §4.3 of Brown et al. 2021), the CO spectral stacking expands the radial coverage and recovers faint CO emission especially in the outermost regions of most cases. Figure 4 shows the molecular gas radial profiles derived in this work (blue-solid line), and their uncertainties (blue-shaded areas) for the 38 VERTICO galaxies selected here. Although radial profiles in Brown et al. (2021) and used in Zabel et al. (2022) are not corrected for inclination, they agree fairly with those included in Figure 4 (particularly at ) when we multiply them by . Annuli are centered on the optical galaxy position and aligned with the major-axis position angle, taken from Table 1 in Brown et al. (2021). After summing the velocity-integrated CO line emission pixel intensities in an annulus, we divide the sum by the total number of pixels to obtain the average for the annulus. We then use Equation 2 to obtain the molecular gas surface density, .
Galaxies in Figure 4 are sorted by HI-Class. Although tends to be lower than for HI-Classes 0 and I (except for some galaxies with at ), we note that the molecular gas seems to extend at least up to (i.e., M⊙ pc-2; excluding NGC 4772, NGC 4299, and NGC 4698). Conversely, HI-Classes II-IV show clear signs of truncation in both molecular and atomic gas radial profiles (except for NGC 4298, NGC 4654, and NGC 4569), with at any galactocentric radius. Interestingly, we note a systematic correlation in the truncation between and radial profiles with increasing HI-Class.
To estimate how depends on the prescription, we compute the ratio between the variable and the constant CO-to-H2 conversion factors, . We find that ranges from to in the region within (with a median of ); for , we find that . Although these results show that depends on the adopted conversion factor, we note that has very small departures from for most of the annuli; consequently, the trends that we find in this work do not vary significantly due to the prescriptions for selected for this work. We emphasize however that our exploration of the effects of dependence is limited and it deserves a careful analysis in future VERTICO projects.
Except for the spectral stacking used for CO, we implement the same method (averaging over all pixels in an annulus) for the star-formation rate, atomic gas, and stars. The latter two are shown in Figure 4 by the purple-solid and orange-solid lines, respectively.
4 Results and Discussion
4.1 Scale Lengths and Environment
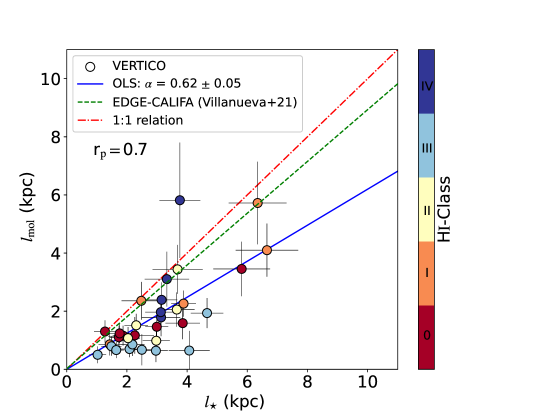
How do the relations between spatial distributions of the molecular gas and the stellar components depend on galaxy environment? Several studies have revealed the close relation between the spatial distribution of molecular gas and stars in galaxies selected from the field (e.g., Young et al., 1995; Regan et al., 2001). For instance, analyzing the molecular gas, , and stellar, , exponential scale lengths (the brightness of the disc has fallen off by a factor of , or , from the center) for spiral galaxies selected from HERACLES (Leroy et al., 2009), Leroy et al. (2008) showed a roughly 1:1 relation between them, with a best-fitting relation of . A larger recent survey of 68 galaxies from the EDGE-CALIFA survey which covers a broad variety of morphologies finds a similar relation, (Villanueva et al., 2021).
| Name | HI-Class | (kpc) | (kpc) | (kpc) | (kpc) | ||
|---|---|---|---|---|---|---|---|
| (1) | (2) | (3) | (4) | (5) | (6) | (7) | (8) |
| IC 3392 | III | 8.410.15 | 9.810.06 | 0.710.28 | 2.090.28 | 1.42 0.55 | 3.560.55 |
| NGC 4064 | III | 8.440.19 | 10.010.09 | 0.670.54 | 2.500.53 | 1.17 1.05 | 4.271.05 |
| NGC 4189 | 0 | 8.680.13 | 9.660.09 | 1.320.38 | 1.270.37 | 2.49 0.71 | 3.020.73 |
| NGC 4254 | I | 9.870.10 | 10.410.08 | 2.360.65 | 2.480.65 | 4.09 1.29 | 4.221.33 |
| NGC 4293 | III | 8.700.17 | 10.510.07 | 0.650.68 | 4.070.68 | 1.67 1.35 | 6.671.36 |
| NGC 4294 | I | 7.910.07 | 9.570.05 | 2.260.45 | 3.880.41 | 2.69 0.81 | 6.580.79 |
| NGC 4298 | II | 9.090.11 | 10.020.07 | 1.510.41 | 2.310.39 | 2.88 0.78 | 3.910.78 |
| NGC 4299 | I | 7.530.17 | 9.270.08 | … | … | 1.31 0.43 | 2.70.44 |
| NGC 4321 | I | 9.850.11 | 10.820.05 | 4.100.91 | 6.651.04 | 5.05 1.79 | 10.981.86 |
| NGC 4351 | I | 7.810.16 | 9.360.12 | 0.860.38 | 1.430.37 | 1.53 0.74 | 2.640.74 |
| NGC 4380 | IV | 8.580.11 | 10.170.07 | 2.390.60 | 3.150.52 | 3.54 1.08 | 5.221.04 |
| NGC 4383 | 0 | 8.420.14 | 9.580.07 | 1.130.37 | 1.740.36 | 1.34 0.71 | 2.120.71 |
| NGC 4394 | IV | 7.810.23 | 10.320.14 | … | … | 2.97 1.62 | 3.341.60 |
| NGC 4405 | III | 8.300.17 | 9.620.11 | 0.510.29 | 1.030.28 | 0.94 0.56 | 1.980.56 |
| NGC 4419 | III | 9.010.15 | 10.230.08 | 0.860.41 | 2.180.43 | 1.39 0.79 | 3.690.83 |
| NGC 4424 | II | 8.360.15 | 9.930.06 | 0.980.45 | 2.970.45 | 1.42 0.88 | 4.970.88 |
| NGC 4450 | IV | 8.650.11 | 10.690.07 | 1.790.64 | 3.130.64 | 2.24 1.27 | 4.421.27 |
| NGC 4457 | III | 9.020.13 | 10.360.08 | 0.790.32 | 1.490.33 | 1.26 0.65 | 1.920.65 |
| NGC 4501 | II | 9.690.12 | 10.990.08 | 3.440.84 | 3.680.83 | 4.78 1.67 | 5.691.67 |
| NGC 4532 | 0 | 8.290.08 | 9.510.07 | 1.160.34 | 1.870.34 | 2.04 0.68 | 2.890.68 |
| NGC 4535 | I | 9.460.13 | 10.580.06 | 5.721.42 | 6.340.96 | 6.14 2.05 | 10.481.76 |
| NGC 4536 | 0 | 9.350.11 | 10.350.06 | 3.450.94 | 5.810.94 | 2.57 1.84 | 8.091.85 |
| NGC 4548 | IV | 8.960.15 | 10.680.06 | 5.821.98 | 3.760.68 | 5.77 2.28 | 5.621.31 |
| NGC 4561 | 0 | 7.310.13 | 9.330.07 | … | … | 1.57 1.91 | 1.580.37 |
| NGC 4567 | 0 | 8.740.12 | 10.130.06 | 1.460.38 | 2.990.38 | 1.72 0.72 | 4.450.72 |
| NGC 4568 | 0 | 9.430.12 | 10.380.06 | 1.590.55 | 3.850.57 | 2.51 1.10 | 6.351.11 |
| NGC 4569 | III | 9.530.09 | 10.740.05 | 1.930.52 | 4.660.54 | 2.84 1.03 | 7.851.05 |
| NGC 4579 | IV | 9.310.14 | 10.890.07 | 3.120.94 | 3.330.74 | 4.43 1.55 | 4.461.43 |
| NGC 4580 | III | 8.580.15 | 9.940.07 | 0.660.27 | 1.650.25 | 1.410.51 | 2.840.51 |
| NGC 4606 | III | 8.200.14 | 9.850.06 | 0.640.39 | 2.960.44 | 1.15 0.78 | 5.060.79 |
| NGC 4651 | 0 | 8.770.16 | 10.270.11 | 1.170.63 | 2.260.64 | 2.12 1.26 | 2.991.26 |
| NGC 4654 | II | 9.330.10 | 10.230.07 | 2.060.59 | 3.660.59 | 3.71 1.18 | 5.921.19 |
| NGC 4689 | IV | 9.060.11 | 10.240.08 | 1.970.55 | 3.130.52 | 3.17 1.05 | 5.191.03 |
| NGC 4694 | II | 8.290.07 | 9.920.07 | 1.070.38 | 2.040.39 | 2.43 0.76 | 2.980.77 |
| NGC 4698 | I | 8.090.13 | 10.460.08 | … | … | 5.41 0.96 | 3.940.98 |
| NGC 4713 | 0 | 8.330.11 | 9.510.08 | 1.130.32 | 1.730.31 | 1.83 0.63 | 2.950.63 |
| NGC 4772 | 0 | 7.850.14 | 10.190.07 | … | … | 4.61 0.82 | 3.010.84 |
| NGC 4808 | 0 | 8.740.11 | 9.610.08 | 1.240.33 | 1.760.33 | 2.36 0.67 | 2.940.67 |
To characterize the distributions, we compute and using our molecular gas and stellar radial profiles. From the 38 galaxies with , we have selected VERTICO galaxies with and radial profiles well described by an exponential profile and with M⊙ pc-2 for all annuli within . These fits are shown by the green and red dashed lines in Figure 4. We have rejected annuli with kpc to avoid the central regions that may be susceptible to significant variations of (e.g., Sandstrom et al., 2013), or to breaks in the exponential scale lengths (particularly for stars) due to bulges (Regan et al., 2001). We obtain and for a subsample of 33 galaxies that fulfill the selection criteria mentioned above; the relation between them, colored by HI-Class, is shown in the left panel of Figure 5. We observe a fairly strong correlation between and (Pearson r; -value). The left panel of Figure 5 also contains the ordinary least-squares (OLS; blue solid line) bisector fit for weighted by the uncertainties for the and points. Columns (5) and (6) of Table 1 correspond to the and values, respectively, for the 33 galaxies included on this section. We find that (3:5 relation), much shallower than the almost 1:1 relation between and for (mostly) field EDGE-CALIFA galaxies (green-dashed line in left panel of Fig. 5). When we use a variable prescription of (Equation 1), we obtain , which is in agreement with the fixed . We note that while values for HI-Classes 0, I, and II tend to be similar to those for , they seem to concentrate significantly below the EDGE-CALIFA spirals trend for HI-Classes III and IV. This implies that the high-density environment of the Virgo Cluster has a measurable effect in compacting the spatial extension of the molecular gas.
Our results are consistent with studies performed in Virgo galaxies by Boselli et al. (2014), who analyze the relation between the CO-to-stellar (-band) isophotal diameter ratio, , and HI deficiency in galaxies selected from the Herschel Reference Survey (HRS; Boselli et al., 2010). They find a systematic decrease of with increasing HI deficiency, which suggests that environmental effects act on both the molecular gas and HI simultaneously, particularly constraining the H2 content to galaxy centers (see also Fig. 3 and Fig. 4 in Zabel et al. 2022 for similar results). This may be attributed to the outside-in ram pressure detected previously in Virgo galaxies, which can compress the atomic gas and increase the molecular gas production (e.g., NGC 4548, 4522, 4330; Vollmer et al., 1999, 2008, 2012b). This mechanism also could create a drag that causes gas to lose angular momentum and drift in. Mok et al. (2017) also find a similar result for galaxies selected from the James Clerk Maxwell Nearby Galaxies Legacy Survey (NGLS; Wilson et al. 2012). Using 12CO() data, they find steeper H2 radial profiles in Virgo galaxies than for their field counterparts.
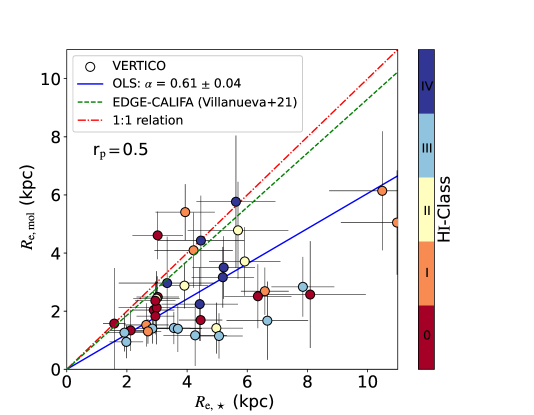
4.2 Effective Radii and Environment
Comparison of scale lengths requires both the molecular and stellar radial distributions to be well described by an exponential. Non-parametric methods can help evaluate whether the assumption of an exponential disk may affect the conclusions above. The right panel of Figure 5 shows the relation between the effective radius of the molecular gas, , and the stars, . These are the radii that enclose 50% of the total molecular gas and stellar mass, respectively, for the 38 VERTICO galaxies analyzed in this work. We determine the total mass of each by integrating the and radial profiles out to a distance of . The relation (Pearson r; -value) between and shows larger scatter than that between exponential scale lengths, but it nonetheless confirms the significant compactness of the molecular gas distribution compared to that of the stars. We also note that, in general, galaxies of higher HI-Class (particularly in HI-Class III) tend to have smaller and are more compact relative to their stellar distribution.
In summary, the analysis of the radial profiles shows that VERTICO galaxies () are approximately 30% smaller in CO relative to their stellar distributions than EDGE-CALIFA galaxies (; Villanueva et al. 2021). When we use a variable (Equation 1), we obtain , which agrees fairly well with the previous result. Similar results are found by Zabel et al. (2022), who show that VERTICO galaxies with larger HI deficiencies (i.e., upper HI-Classes) have steeper and less extended molecular gas radial profiles, suggesting that the processes behind the atomic gas removal are also producing more centrally concentrated molecular gas radial profiles.
4.3 , SFE, and Environment
In this section we test how local and global physical parameters affect both the molecular-to-atomic gas ratio and the star formation efficiency of the molecular gas.
To understand the effect of the environmental processes of the cluster on gas and star formation properties for VERTICO, we need a comparison sample, that represents galaxies in low-density environments. We compare with two such samples: 1) 64 galaxies selected from spatially resolved surveys of spiral galaxies with M– and morphologies spanning from Sa to Scd, EDGE-CALIFA survey; and 2) xGASS/xCOLD GASS (hereafter xGASS-CO; Saintonge et al., 2017; Catinella et al., 2018). For xGASS-CO we use the relations obtained in the analysis by Saintonge & Catinella (2022) for main sequence (MS) galaxies. Each of these comparison samples have limitations that need to be kept in mind. The EDGE-CALIFA selected galaxies are mostly far-IR detected and rich in molecular gas (hence actively star-forming), and only a handful of them have resolved HI observations. The xGASS-CO sample is the largest galaxy survey, but it is spatially unresolved.
We correct our calculations by the inclination of the galaxy (using a factor) to represent physical “face-on” deprojected surface densities (see §3.2). The EDGE-CALIFA spiral galaxies included here were selected to have (Villanueva et al., 2021).
4.3.1 vs Radius and Environment
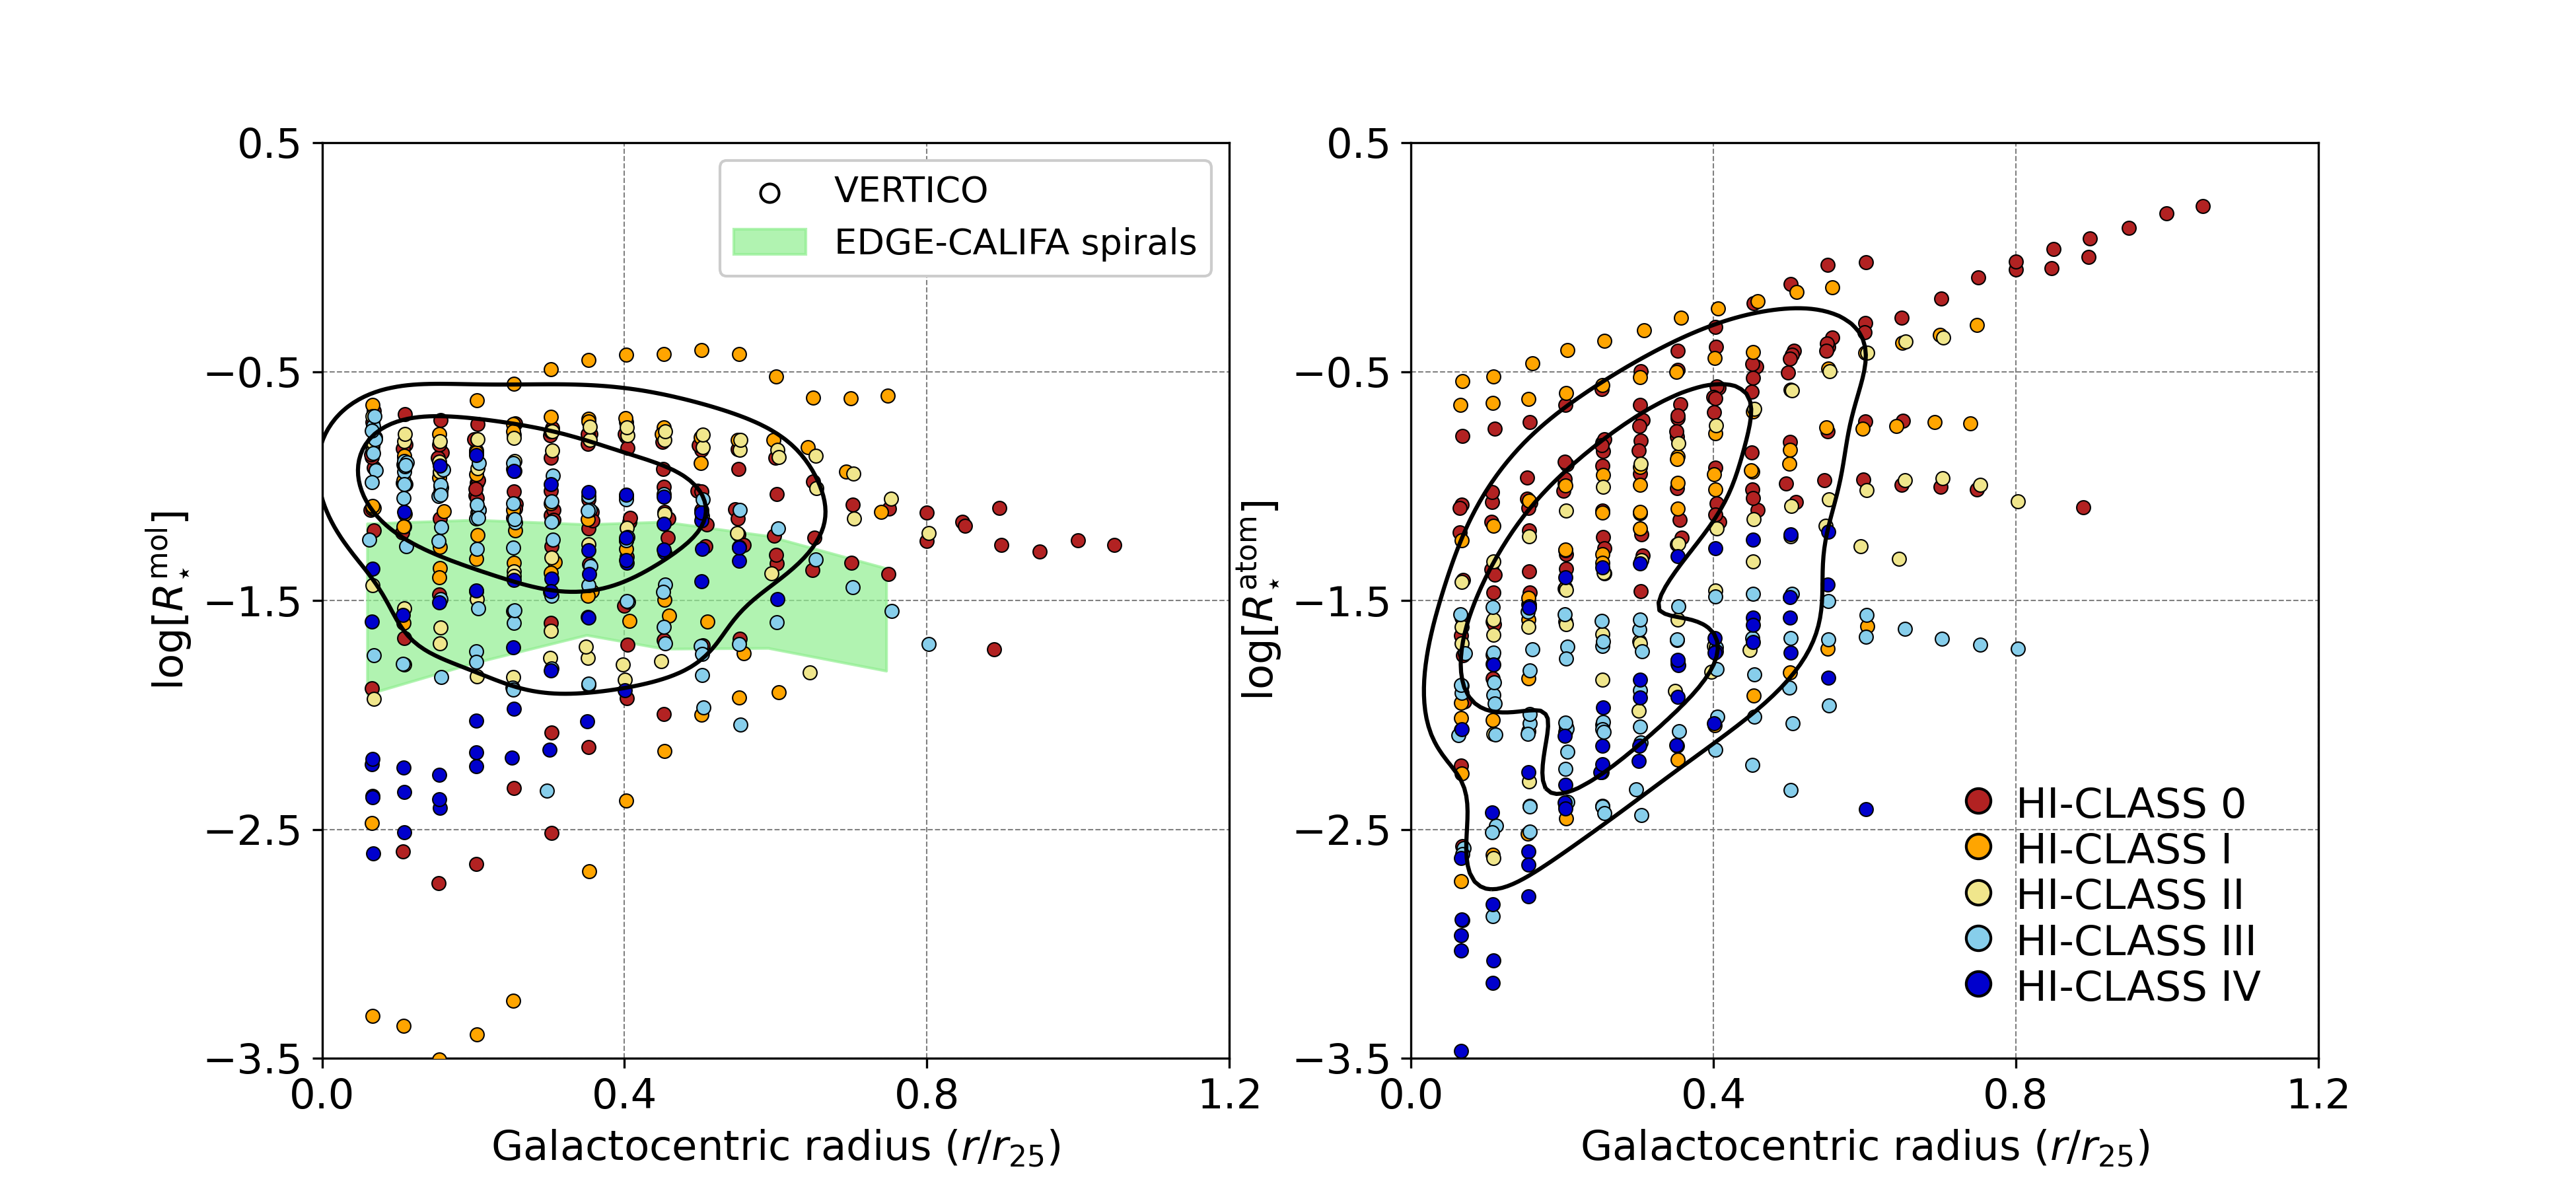
The left and right panels of Figure 6 show the spatially resolved molecular-to-stellar and atomic-to-stellar ratios, in logarithmic space, as a function of galactocentric radius and colored by HI-Class. Looking at the black contours, which enclose 66% and 33% of the points, we note that follows a constant trend with radius and it has similar values to those covered by EDGE-CALIFA spirals. We also note that most of the galaxies show a systematic inside-out increase in (Pearson r when considering all the points).
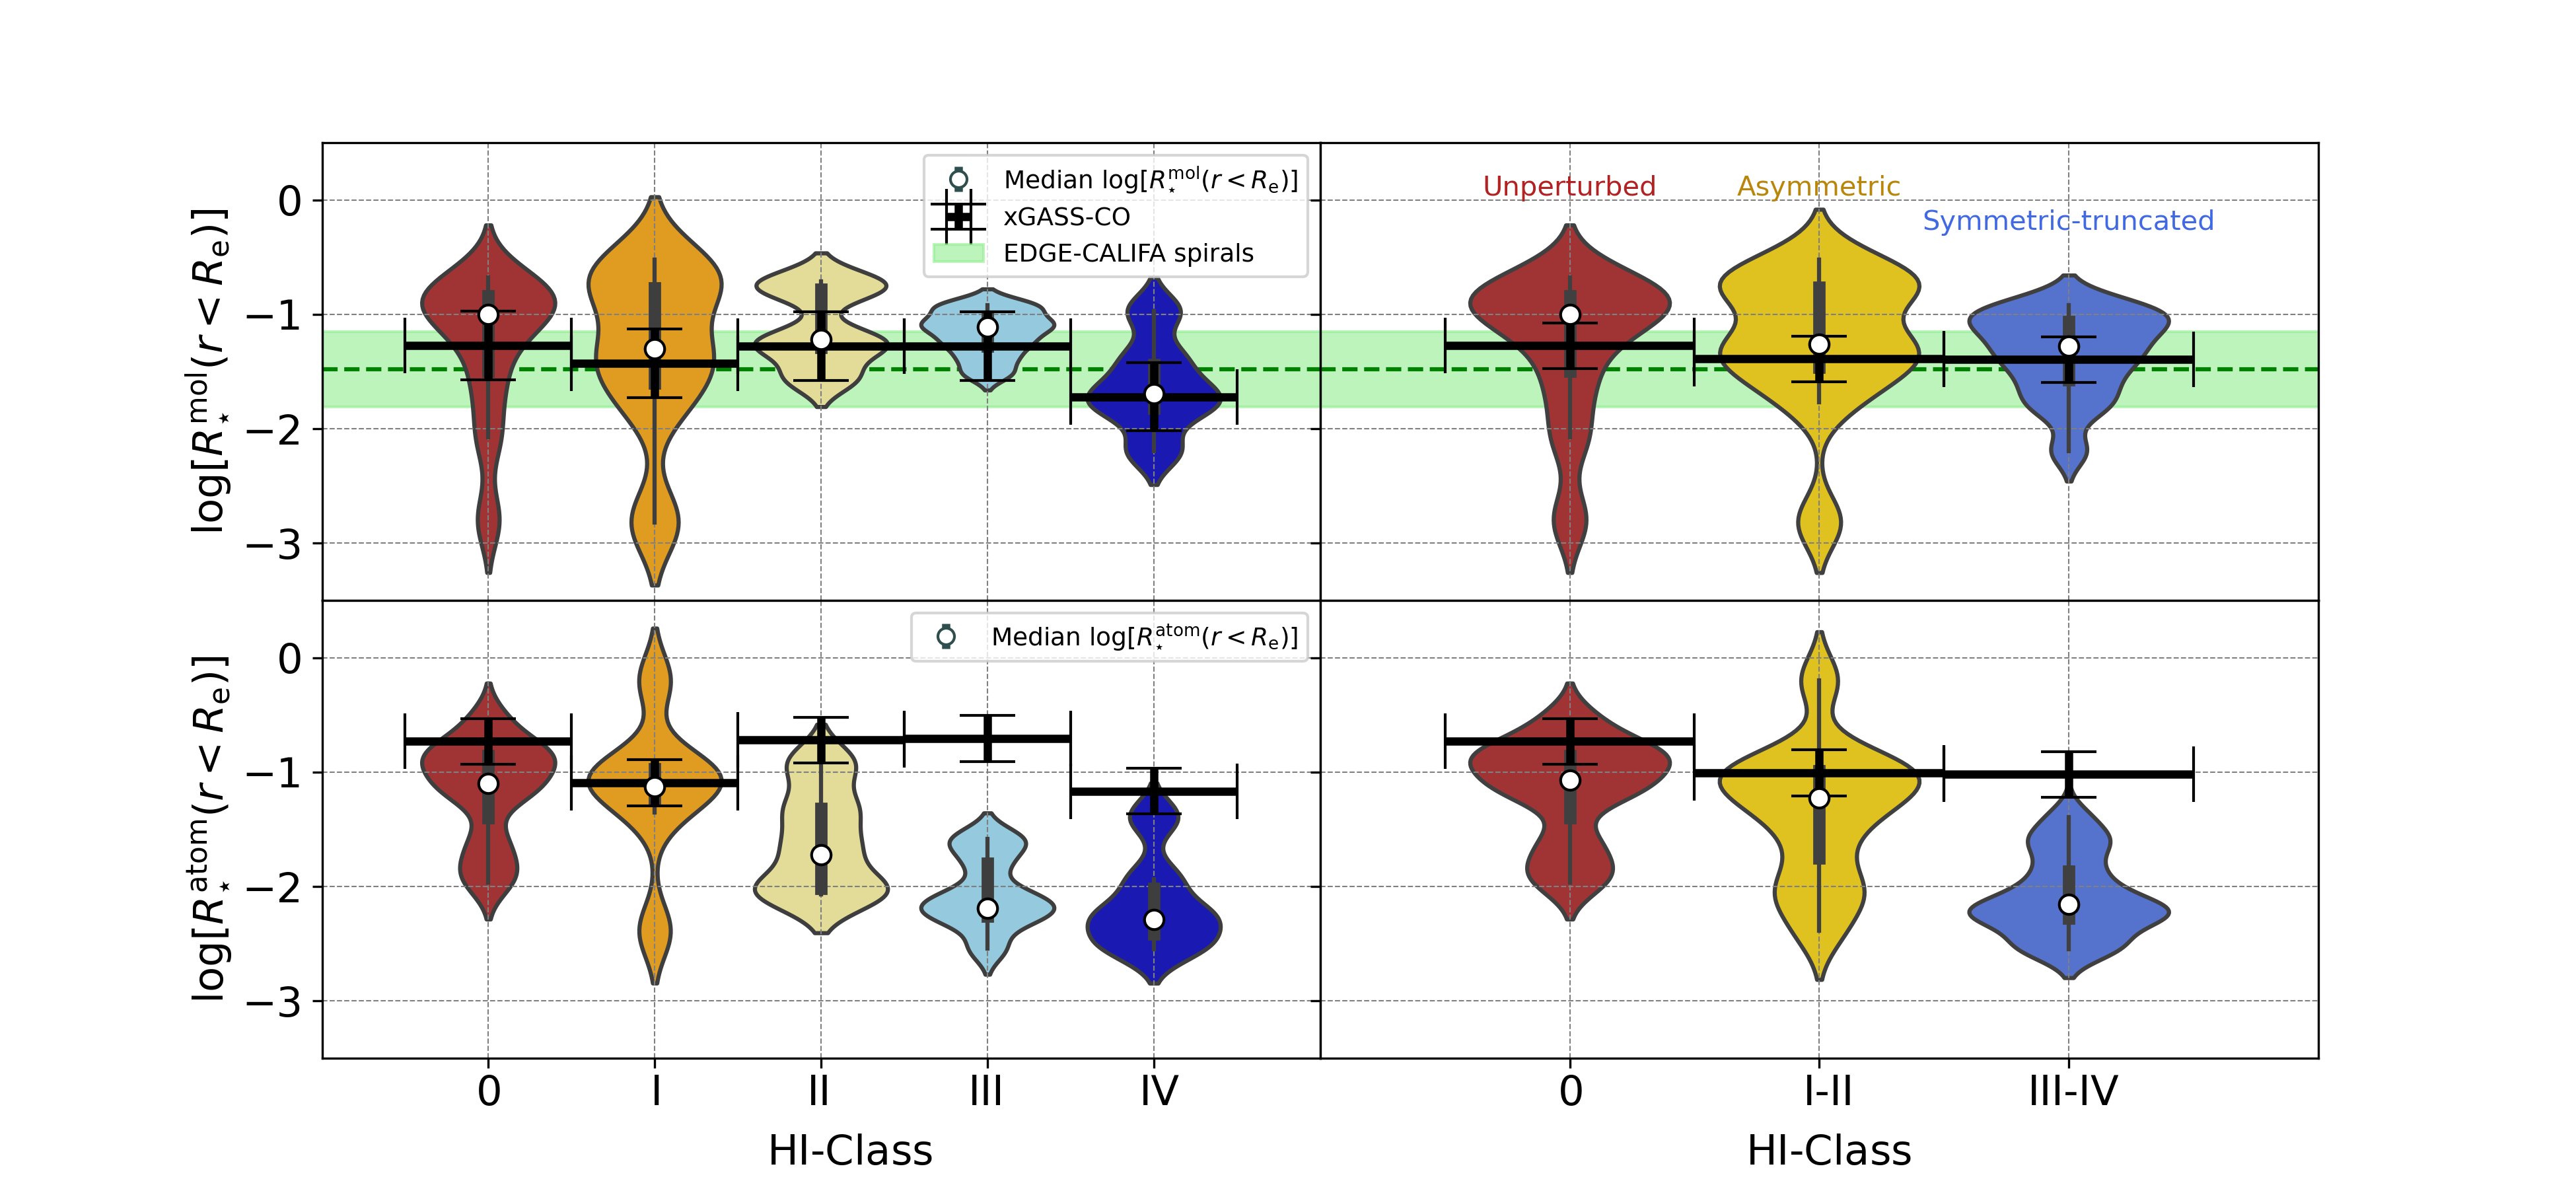
The top and bottom panels of Figure 7 show the molecular- and atomic-to-stellar mass ratios integrated out to , and , respectively, as a function of HI-Class. The upper panels show that the median values remain almost constant with HI-Class but with a possible small decrease for HI-Class IV galaxies. These values are in good agreement with those expected from the – relation for xGASS-CO galaxies (black crosses; Saintonge & Catinella 2022), and with EDGE-CALIFA spirals (green-shaded area). Interestingly, (bottom plots in Fig. 7) shows a systematic decrease from lower to upper HI-Classes. While HI-Classes 0 and I have atomic-to-stellar mass ratios with median values similar to that of xGASS-CO, HI-Classes II, III, and IV have significantly lower values.
We test how our results change when adopting a variable . Although values decrease dex when using (particularly at ), we note that the trend does not vary significantly compared to that for ; similarly, values are still within the ranges covered by xGASS-CO when using the two prescriptions. Despite there being a clear deficit in the integrated H i content of the H i-perturbed galaxies, our VERTICO data reveal that these galaxies do not exhibit an appreciable deficit in H2 mass.
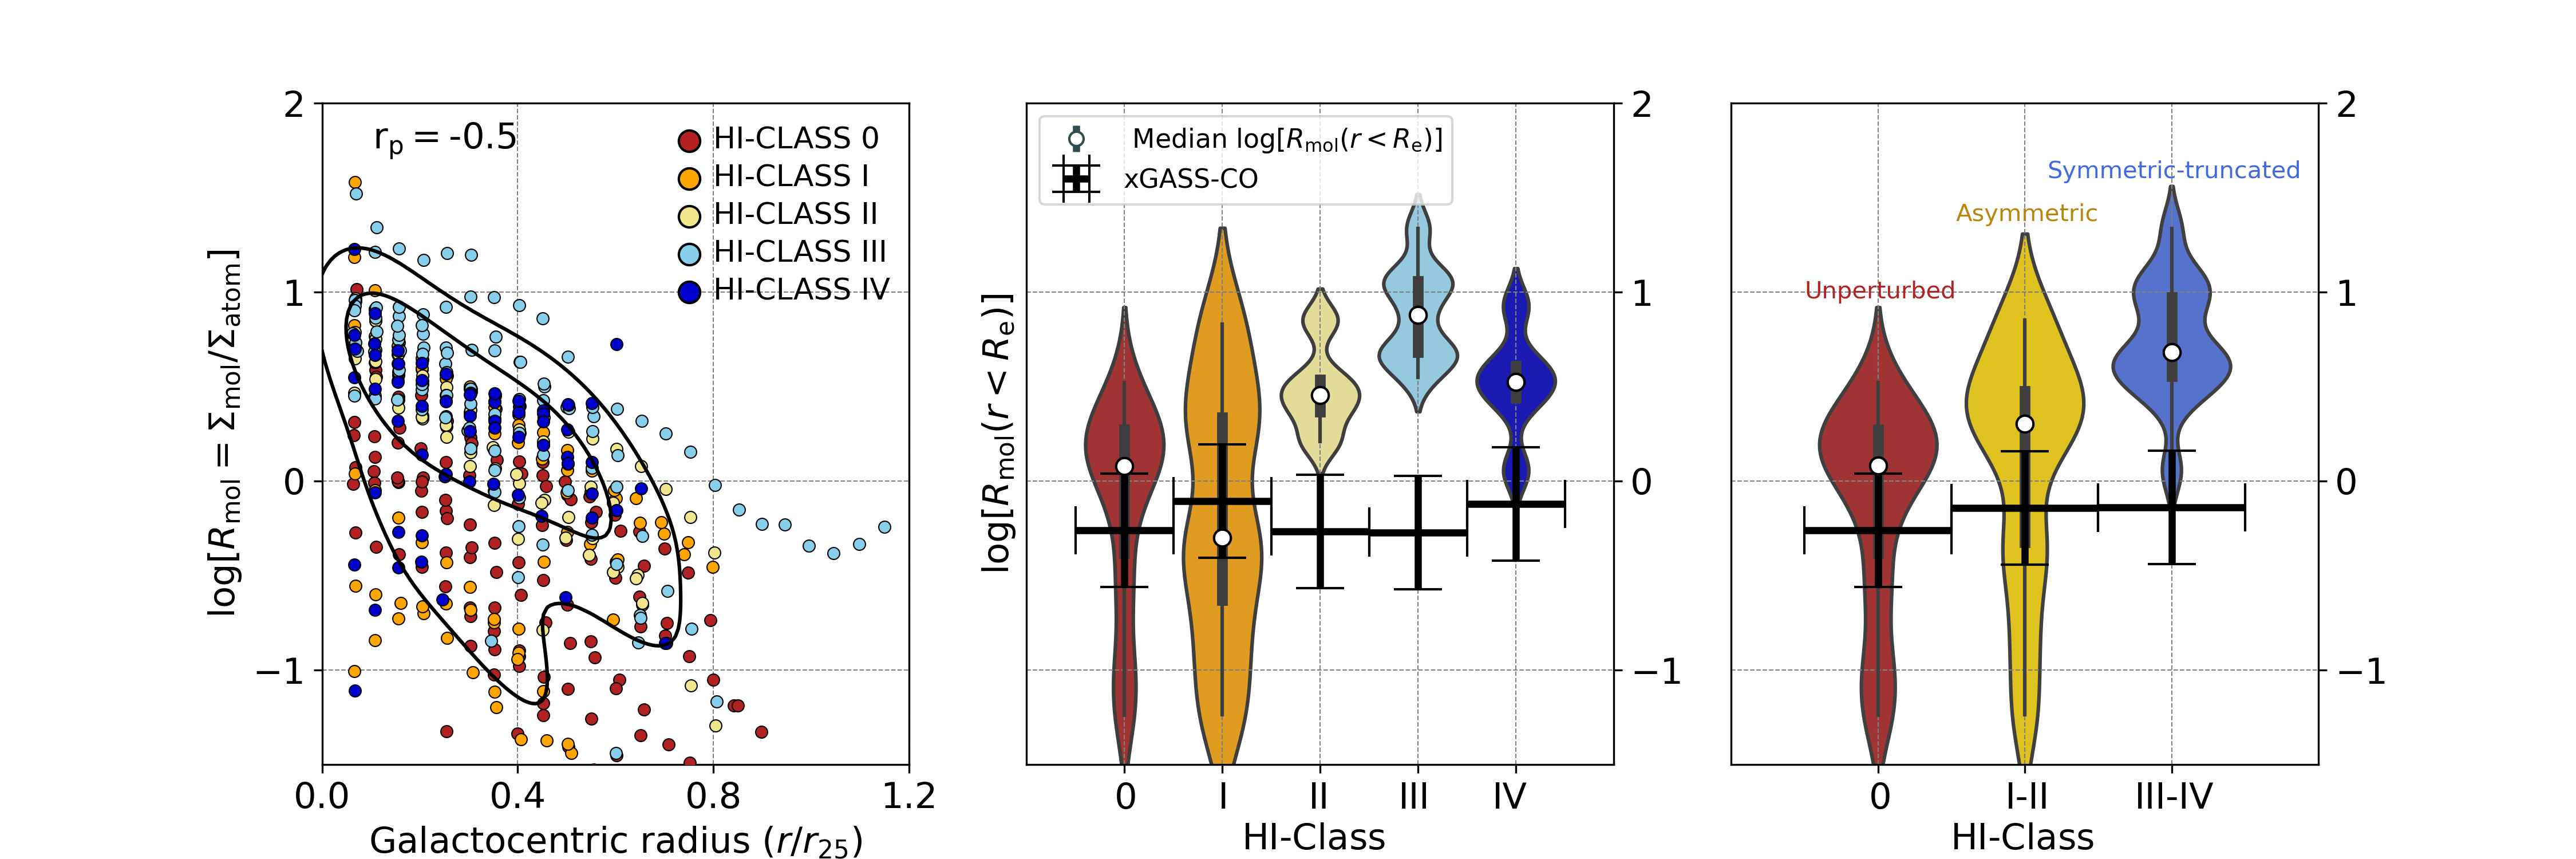
The left panel of Figure 8 shows the spatially resolved molecular-to-atomic ratio , in logarithmic space, as a function of galactocentric radius and colored by HI-Class. To compute , we use the radial profiles derived from the 15″ CO(2–1) datacubes to match VIVA’s HI angular resolution. In general, the figure shows a decreasing trend for with radius (Pearson r; -value). We note that values for HI-Classes II, III, and IV (yellow, light blue, and blue solid dots, respectively) are on average higher than for HI-Classes 0 and I (red and orange solid dots, respectively). Looking at Figure 4, we note that while lower HI-Classes have similar to what is expected for normal field galaxies (e.g., M⊙ pc-2; Leroy et al. 2008), upper HI-Classes show notably lower atomic surface densities. Since HI-Classes II, III, and IV are HI deficient (as mentioned previously for ), the enhancement of (at least within ) appears to be due mainly to their poor atomic gas content. The significant scatter in , particularly at , may be due to the strong environmental effects experienced by some VERTICO galaxies. We also compute the molecular-to-atomic gas mass ratio within , . The right panel of Figure 8 shows the relation between (in logarithmic space) and HI-Class. Although with a dip in HI-Classes II and IV galaxies, there is a large systematic increase of from lower to upper HI-Classes which becomes even more clear for the broader HI groups in the left panel of Fig. 8. As noted previously for , values decrease dex with at . Similarly, values also decrease when using the variable prescription. However, we still observe a clear systematic decrease of with radius, and values are still within the ranges covered by xGASS-CO MS galaxies. This is consistent with the definition of HI-Classes by Yoon et al. (2017) for VIVA galaxies, and it confirms that the increase in ratios is a result of the deficiency in HI.
These results can be summarized as follows:
-
1.
For unperturbed galaxies and with mild sign of HI- perturbation (e.g., HI-Classes 0 and I), and values are similar to those for xGASS-CO MS galaxies with similar stellar mass, and also have values comparable with the latter.
-
2.
Asymmetric galaxies in HI or partially symmetric-truncated (HI-Classes II and III) have values within the range covered by EDGE-CALIFA spirals and those expected from xGASS-CO relations. However, we note that values are up to dex lower than those for xGASS-CO MS galaxies. HI-Class II and III galaxies also have values significantly higher than those in stellar-mass matched xGASS-CO MS galaxies.
-
3.
HI-symmetric-truncated galaxies (i.e., HI-Class IV) galaxies show a possible decrease in compared with EDGE-CALIFA spirals, although still in good agreement with xGASS-CO MS galaxies. Similar to HI-Classes II and III, HI-Class IV has values drastically lower than the latter ( dex lower). HI-Class IV galaxies also show an increase in values compared to lower HI-Classes (although a small decrease compared to HI-Class III) and to those expected for xGASS-CO MS galaxies.
| Galaxy Class | log[] | log[] | log[] | log[SFR] | log[] | log[] | log[]xGC | log[]xGC |
|---|---|---|---|---|---|---|---|---|
| (1) | (2) | (3) | (4) | (5) | (6) | (7) | (8) | (9) |
| Class 0 | 9.660.38 | 8.590.56 | 9.290.29 | 0.580.72 | 8.460.22 | 9.310.46 | -1.28 | -0.54 |
| Class I | 10.410.61 | 8.070.92 | 9.210.36 | 0.321.61 | 9.010.27 | 9.550.39 | -1.61 | -1.14 |
| Class II | 10.020.43 | 9.040.51 | 8.690.46 | 0.130.21 | 8.790.20 | 9.380.48 | -1.27 | -0.73 |
| Class III | 10.010.34 | 8.420.35 | 7.630.44 | 0.270.47 | 8.780.23 | 9.380.47 | -1.27 | -0.72 |
| Class IV | 10.50.27 | 8.730.41 | 8.660.24 | 0.240.54 | 9.130.26 | 9.610.39 | -1.78 | -1.18 |
| EDGE-CALIFA | 10.570.45 | 9.450.47 | … | … | 9.160.26 | 9.640.39 | -1.89 | -1.21 |
These results suggest that even though environmental processes act on both the molecular and the atomic gas (at least within ), the latter is affected in a different manner than the former. Table 2, which includes a compilation of masses for all HI-Classes, indicates that VERTICO galaxies have lower compared to EDGE-CALIFA spirals (although the latter is slightly biased towards molecule-rich galaxies). VERTICO galaxies also seem to have lower values than those expected from the relation for main sequence xGASS-CO galaxies, although without significant variations with HI-Class or . We note that values for HI-Classes II, III, and IV are notably lower than for xGASS-CO. Similar results are found by Zabel et al. (2022), who do not observe a statistically significant correlation between H2 and HI deficiencies. They also note that VERTICO galaxies tend to be H2 deficient when compared to main sequence galaxies from xGASS-CO. These results suggest that even though environmental processes affect both the molecular and the atomic gas simultaneously, the level of HI perturbation in VERTICO galaxies does not necessarily modulate the molecular gas content. The large change in with environment (e.g., a factor of between HI-Classes 0 and III) also indicates that galaxy evolution simulations should factor this in if they want to trace HI/H2 phases in dense environments. Also, while values for HI-Class IV galaxies are on average the lowest, particularly at , their values show a significant decrease towards the centers. These results suggest that HI-Class IV galaxies could be tracing the population where the environment is starting to impact significantly the molecular gas content.
Although several environmental mechanisms could potentially explain the results previously shown, the most likely mechanism is ram pressure (at least in HI-Classes I-III). Out of the 38 VERTICO galaxies selected for this work, at least five of them are well studied cases of RPS: NGC 4501, NGC 4548, NGC 4569, NGC 4579, and NGC 4654 (e.g., Cayatte et al., 1994; Boselli et al., 2006; Vollmer et al., 2012a; Boselli et al., 2016; Lizée et al., 2021, see also Boselli et al. 2022 and references therein). In particular, Mok et al. (2017) report significantly higher values for Virgo galaxies than for field galaxies. They attribute this to environmental processes, either by inward flows of molecular gas, H2 not being as efficiently stripped as the atomic gas, and/or HI migration to the galaxy center where it can be more easily converted into H2. This is also supported by Moretti et al. (2020), who analyze four jellyfish galaxies from the GAs Stripping Phenomena survey with MUSE (GASP; Poggianti et al. 2017). They propose that gas compression caused by ram pressure can trigger the conversion of large amounts of HI into the molecular phase in the disk, which may imply that HI is just partially stripped. The results found by Zabel et al. (2022) also support this idea, and suggest that RPS in VERTICO galaxies could potentially drive outside-in gas migration and may contribute to produce steeper H2 radial profiles, as seen in Mok et al. (2017). However, thermal evaporation (Cowie & Songaila 1977; see also Cortese et al. 2021 for a detailed description) or starvation have also been proposed to explain the effects of the environment in galaxies with symmetric-truncated HI radial profiles (e.g., HI-Class IV galaxies; see also § 5.1 in Zabel et al. 2022). Observational and theoretical evidence has shown that thermal evaporation can complement the viscous stripping in removing the cold gas from the disk (e.g., Bureau & Carignan, 2002; Roediger & Hensler, 2005; Boselli & Gavazzi, 2006; Randall et al., 2008). Consequently, it can affect the entire gas disk (all at the same time), leading to marginally truncated (but symmetric) gas disks with low surface density. Thermal evaporation is, therefore, a good candidate to explain the offset in for HI-Class IV galaxies (middle panel of Fig. 8) when compared to lower HI-Classes.
4.3.2 SFE vs Radius and Environment
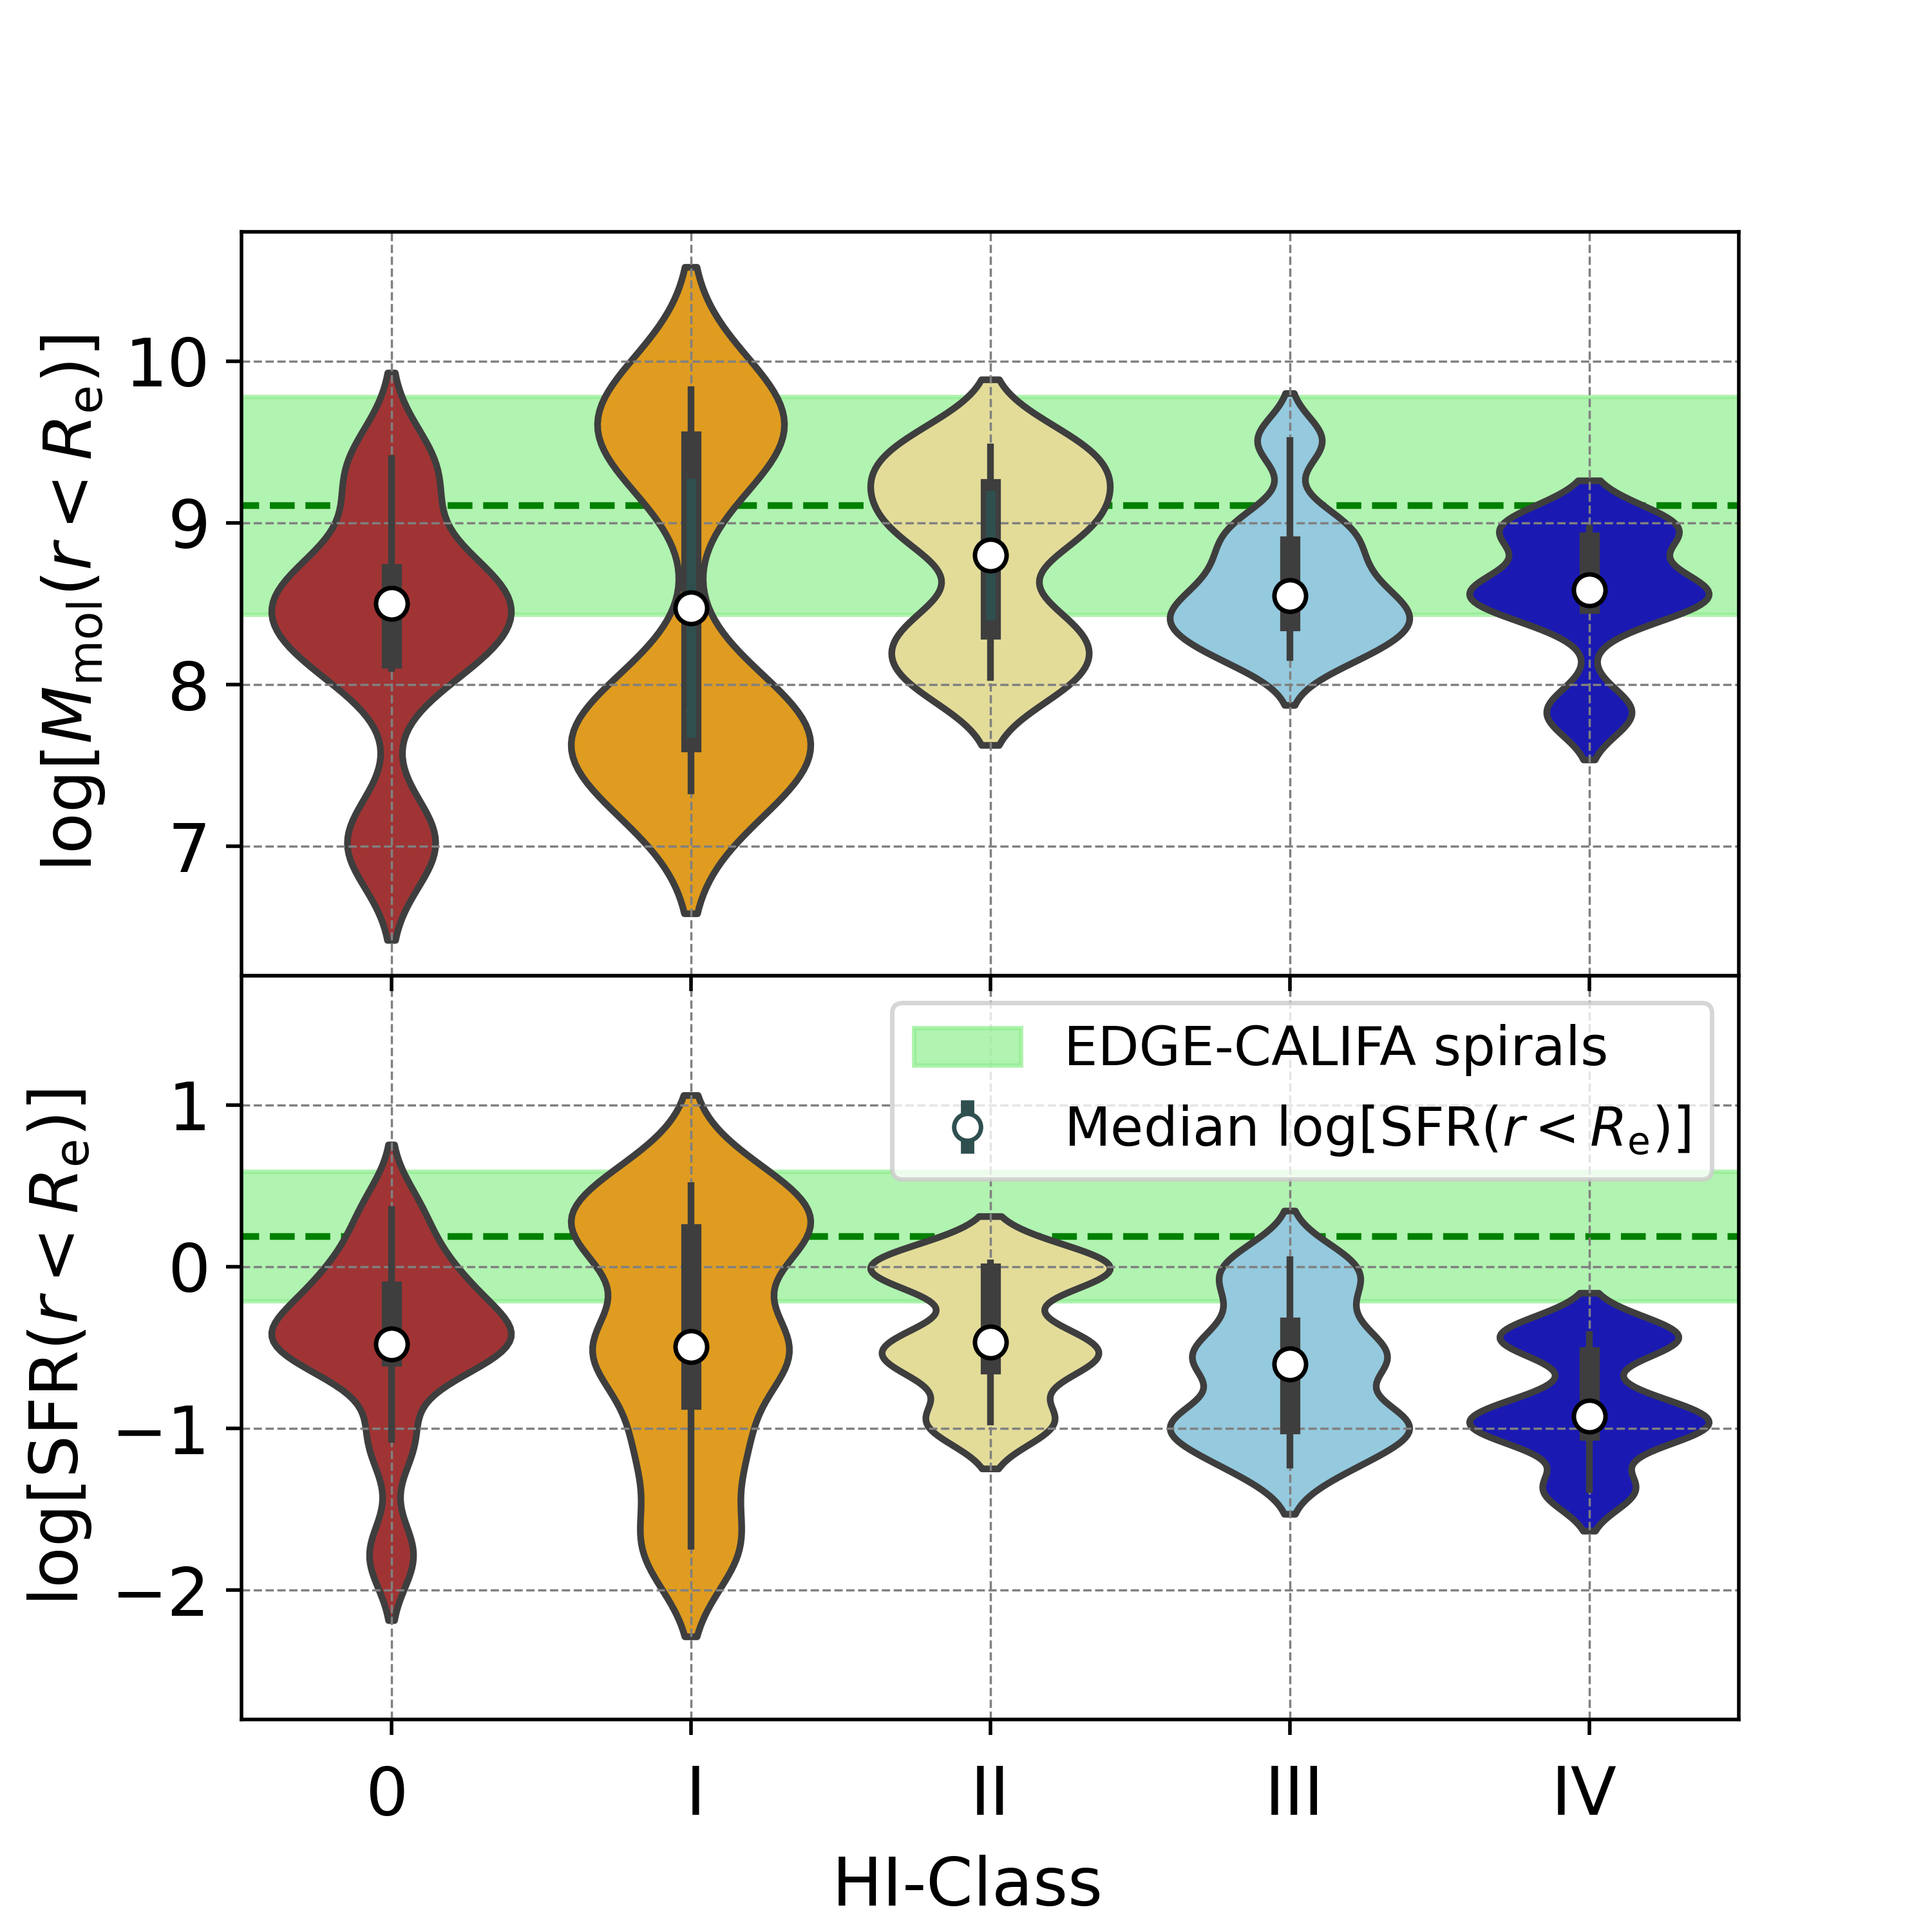
Figure 9 shows the molecular gas mass within , (top panel), and the star formation rate within , SFR (bottom panel), vs HI-Class. Note that remains almost constant with HI-Class; on average, values for VERTICO galaxies are similar to the mean for EDGE-CALIFA spirals. Although the mean SFR does not vary significantly for HI-Classes 0 and I, we note a systematic decrease of the SFR with increasing HI-Class for Classes III to IV. The results shown in Figure 9 are consistent with the expected difference in the total molecular gas masses and star formation rates between galaxies from VERTICO and EDGE-CALIFA surveys. While the former includes galaxies with lower s than xGASS-CO main sequence galaxies, as shown in Table 2, the latter encompasses actively star-forming galaxies and rich in molecular gas (see Bolatto et al. 2017 for more details of the sample selection), hence with higher molecular gas masses than main sequence galaxies.
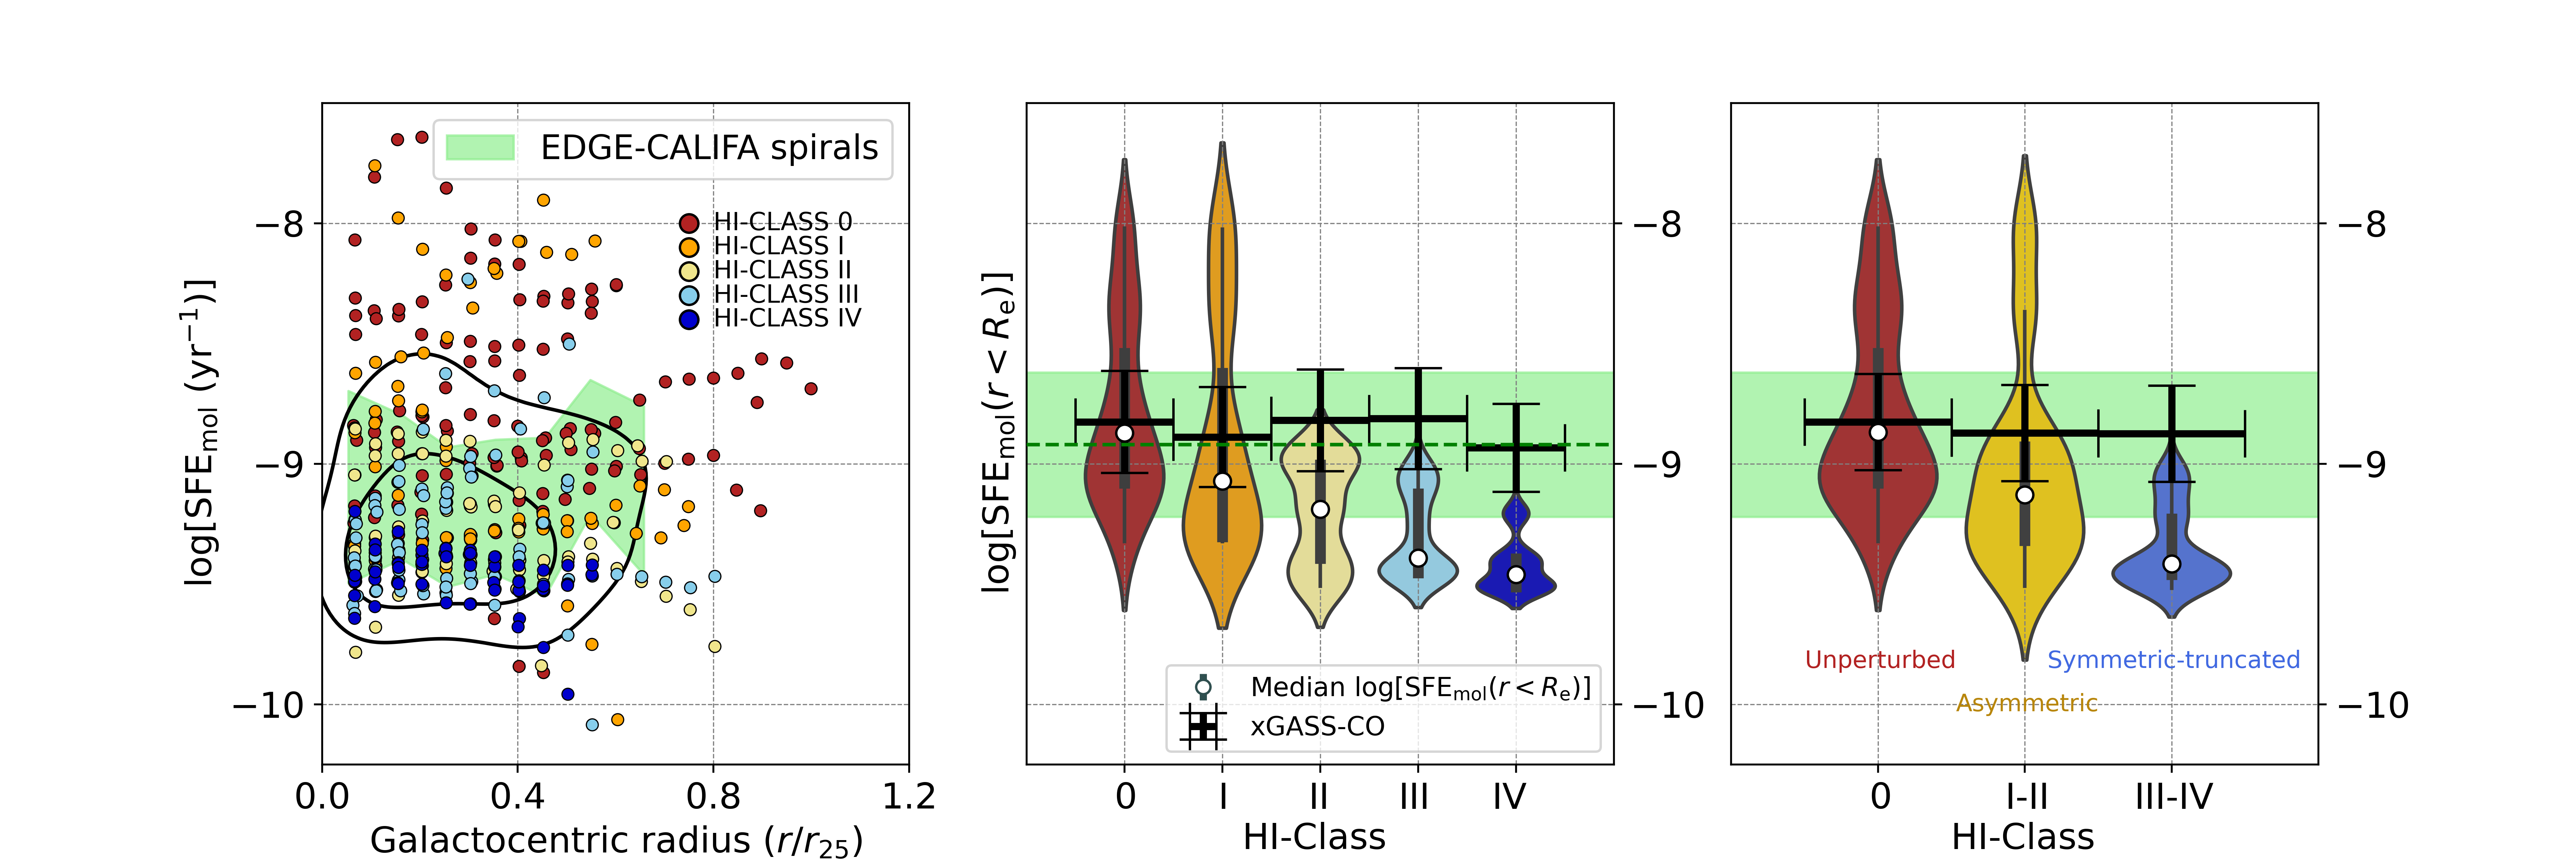
The left panel of Figure 10 shows the spatially resolved SFE as a function of galactocentric radius and colored by HI-Class. We do not observe a statistically significant correlation between the efficiencies and radius. We note that while higher HI-Classes have SFEmol significantly below to the almost constant values for EDGE-CALIFA spirals, lower HI-Classes tend to be in fair agreement with the latter and scattered to much larger values (likely due to variations in values within these HI-Classes; see Fig. 4). On average, lower HI-Classes tend to have higher SFEmol than upper HI-Classes for the range covered here. The middle and right panels of Figure 10 show the star formation efficiency of the molecular gas within , , as a function of HI-Class. We note a systematic decrease of SFE with HI-Class. Although SFE values are mostly within the range covered by the control samples for HI-Classes 0 and I, HI-Classes II–IV have notably lower efficiencies ( orders of magnitude, or times lower) than EDGE-CALIFA spirals (green shaded area) and xGASS-CO MS galaxies (black horizontal bars). We test how our efficiencies depend on the adopted prescription. Although SFEmol values increase by dex when using in the region within , the SFEmol trend does not vary significantly compared to that for . Likewise, SFE still shows a similar systematical decrease with HI-Class when adopting the two prescriptions. These results suggest that the systematic decrease of seen in Figure 10 is a consequence of changes to the star formation process caused by the source of the perturbations that affect the HI in the external regions of the disk.
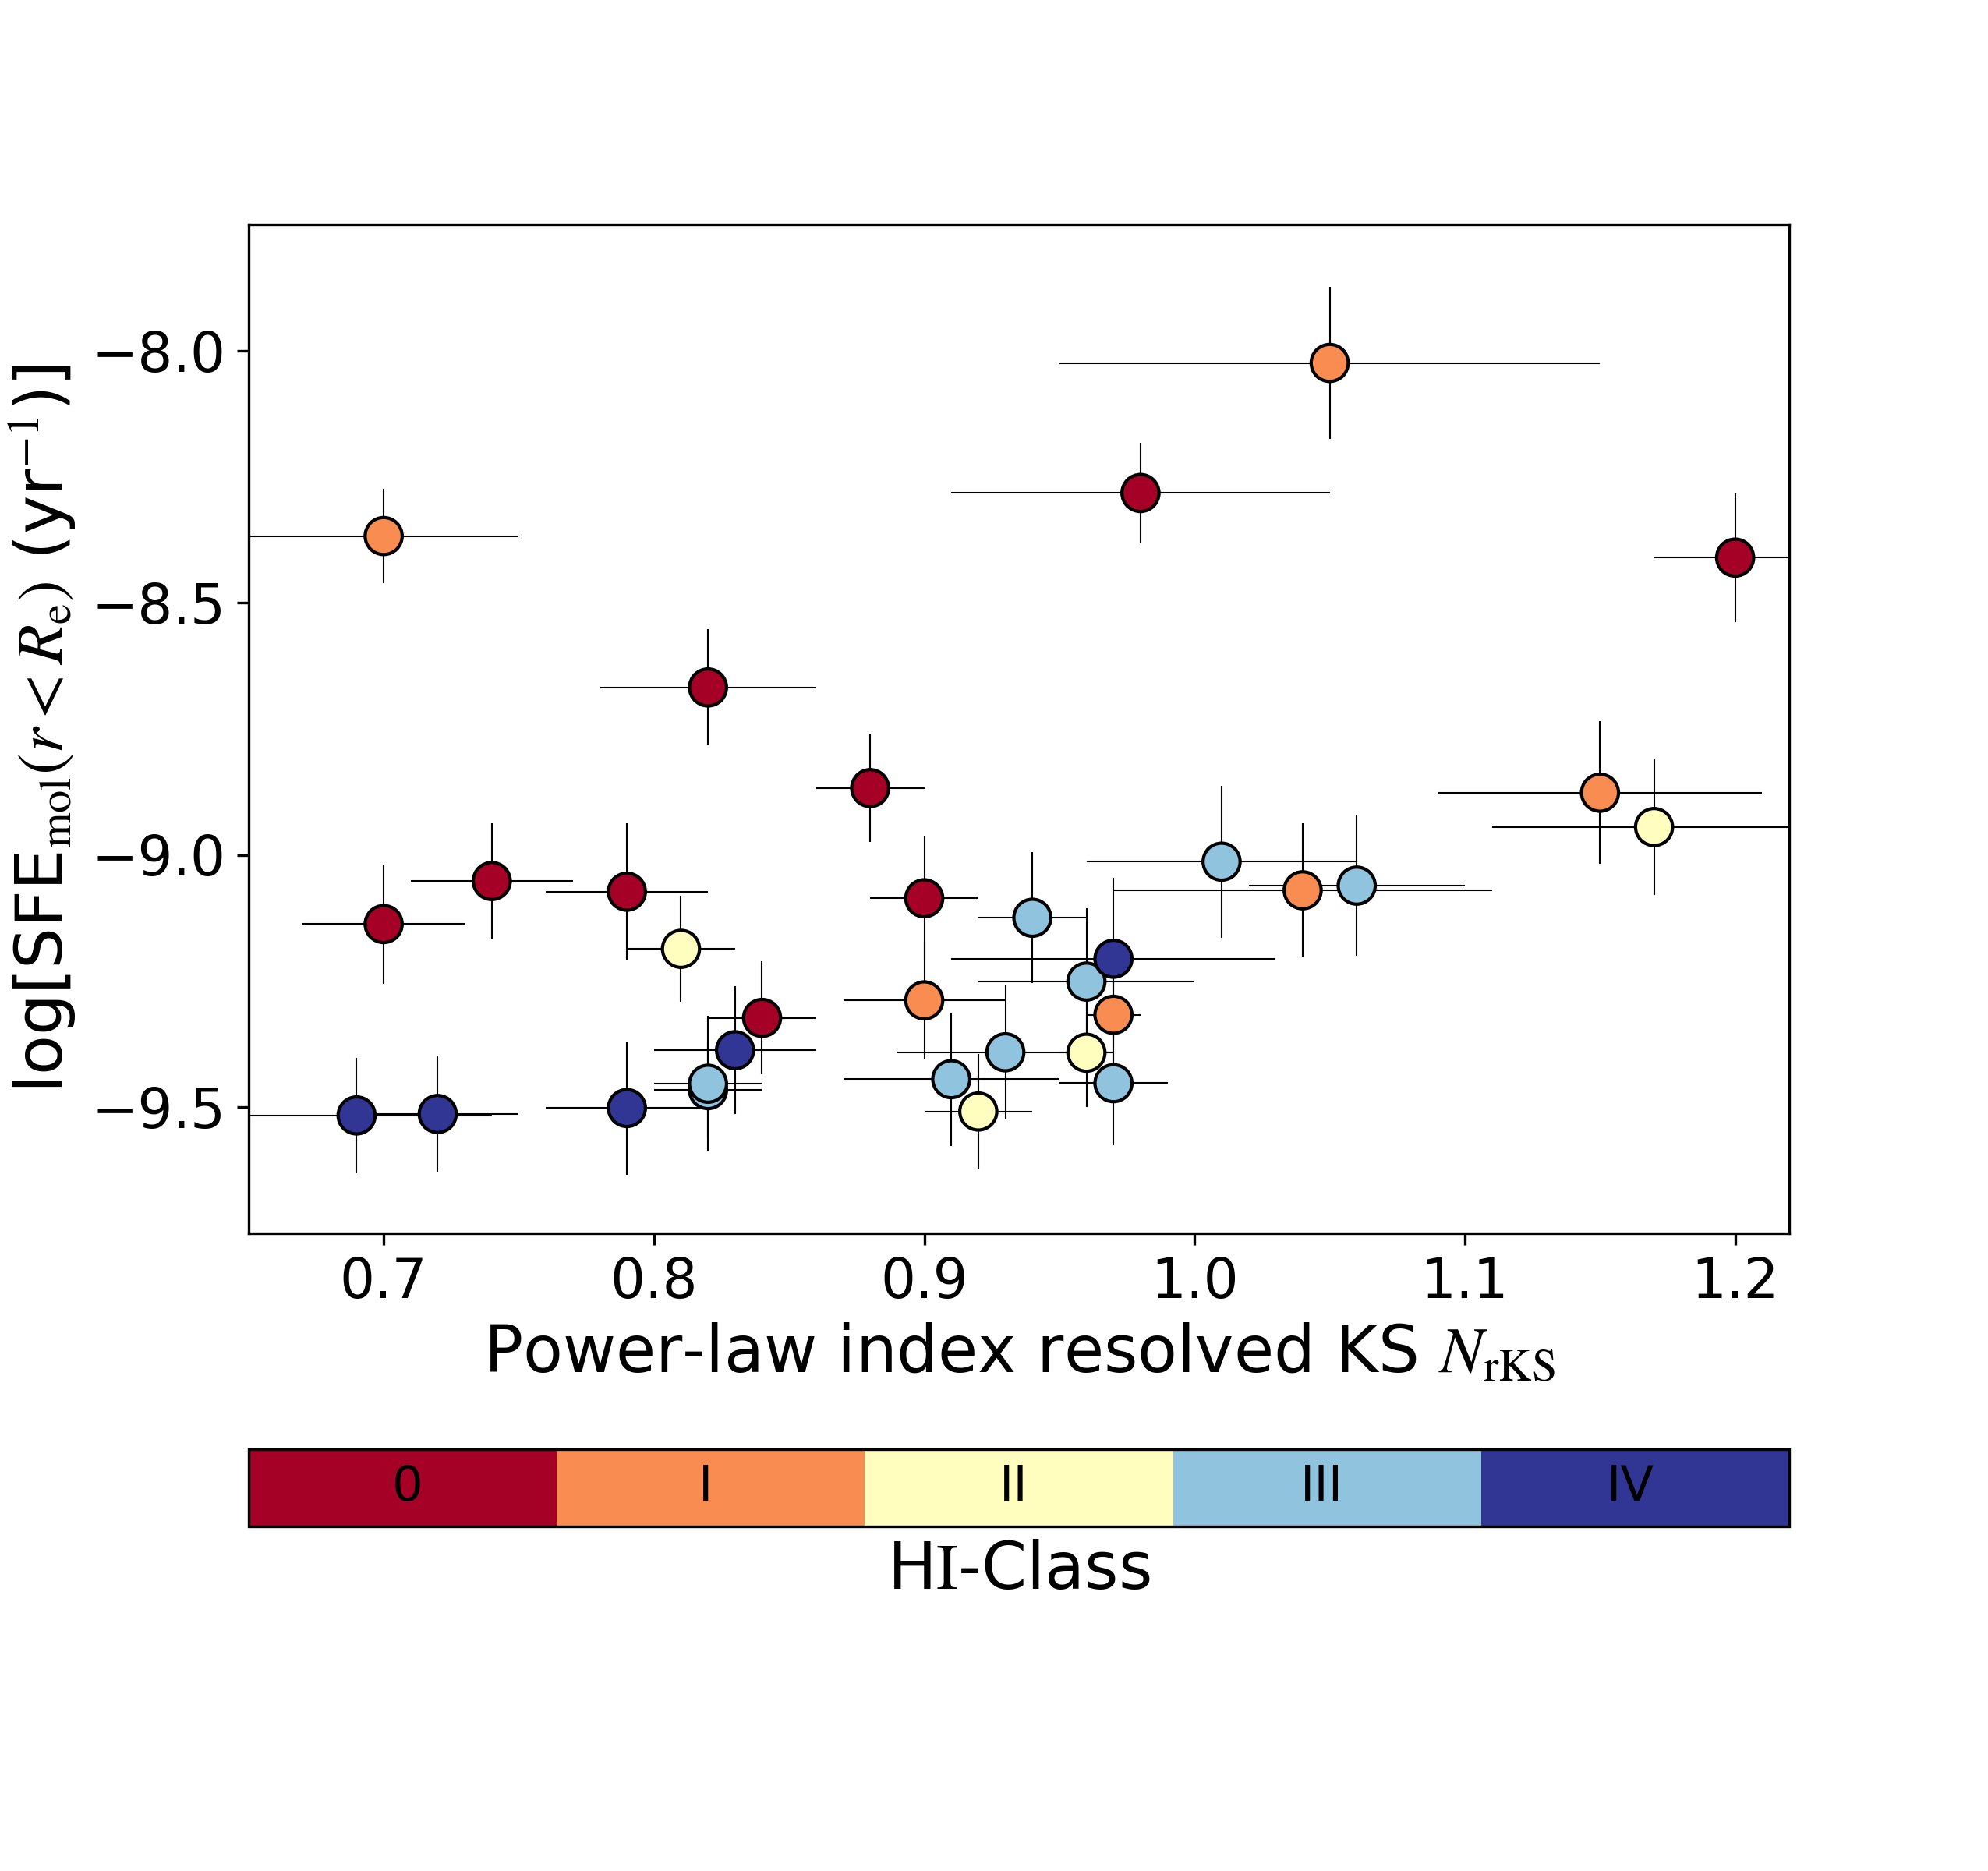
It is interesting to compare our results with other galaxy-scale indicators of the star formation efficiency in VERTICO galaxies. For instance, Jiménez-Donaire et al. (submitted) compute the best-fit power-law index of the resolved Kennicutt–Schmidt law, , based on the resolved scaling relations between and . Out of the 36 VERTICO galaxies with inclinations included in Jiménez-Donaire et al. (submitted), Figure 11 shows the SFE vs for 34 VERTICO galaxies for which they find values statistically significant. We do not find a significant correlation between and SFE. However, in observing the distributions of colored by HI-Class, we note that HI-Classes III and IV (blue circles) tend to group at both lower and than HI-Classes 0 and I (red circles), and vice versa. Since the resolved Kennicutt–Schmidt law index quantifies changes in the molecular gas efficiencies through and , lower efficiencies at the centers of HI-Classes II-IV reflect locally low ratios, which drive values below unity. Jiménez-Donaire et al. (submitted) also show that, on average, the distribution of in VERTICO galaxies peaks at lower values when compared to those for HERACLES (Leroy et al., 2013) and PHANGS Pessa et al. (2021). Our results are consistent with Jiménez-Donaire et al. (submitted), who suggest that their sub-linear values found in most of the VERTICO galaxies indicate a decrease in the efficiency of the molecular gas for regions with high and reflects the broad variety of physical conditions present in Virgo galaxies.
Our results show that VERTICO galaxies tend to be less efficient at converting molecular gas into stars when their atomic gas is strongly affected by environmental mechanisms, at least in the region within . Analyzing 98 galaxies selected from the JCMT NGL survey, Mok et al. (2016) show that Virgo galaxies have longer molecular gas depletion times, SFRSFE, when compared to group galaxies selected from a sample of 485 local galaxies included in Garcia (1993). They attribute this difference to a combination of environmental factors that increase the H2 production and a decrease in the SFR in the presence of large amounts of molecular gas, which may reflect heating processes in the cluster environment or differences in the turbulent pressure. Lee et al. (2017) find an increase in the CO surface brightness (an increase in ) in a region close to the galactic center subjected to intense ram pressure in the Virgo galaxy NGC 4402 (also confirmed by Cramer et al. 2020), which seems to be tied to bright FUV and H emission associated with intense star formation. Zabel et al. (2020) also observe an enhancement in the H2 star formation efficiencies, SFE, of Fornax cluster galaxies (particularly at low masses) for galaxies on first passage through the cluster. They suggest that these changes might be driven by environmental mechanisms (e.g., RPS or tidal interactions). Morokuma-Matsui et al. (2021) analyze the atomic and molecular gas properties of massive Virgo galaxies (), which are selected from the Extended Virgo Cluster Catalog (EVCC; Kim et al., 2014), within ( is the radius where the mean interior density is 200 times the critical density of the Universe). They find that Virgo galaxies have lower SFRs and higher SFESFR compared to field galaxies with offsets from the main sequence of the star-forming galaxies (MS). In addition, they note that Virgo galaxies have both lower gas fractions ( and ) and higher SFEs compared to field galaxies. Roberts et al. (2022) also find evidence of enhanced star formation on the leading side of four identified jellyfish galaxies selected from Perseus cluster using radio LOw Frequency ARray (LOFAR) continuum at 144 MHZ and H data. They find a positive correlation between H+[NII] surface brightness and the orientation angle of sources with respect to the stripped tail, which is consistent with gas compression (i.e., the increasing of the star production) induced by ram pressure along the interface between the ICM and the galaxy. Lee et al. (2022) analyze ALMA ACA 12CO(J=1-0) and HI data for 31 galaxies selected from the Group Evolution Multiwavelength Study survey (GEMS; Osmond & Ponman, 2004; Forbes et al., 2006), finding that some members with highly asymmetric morphologies in CO and HI images (e.g., driven by tidal interactions and RPS) have a significant decrease in both SFR (e.g., due to gas becoming stable against gravitational collapse), and gas fractions, suggesting a decrease of due to the suppression of the HI-to-H2 conversion. Numerical simulations have found that the star formation activity is generally amplified in galaxy centers by ram pressure (e.g., Tonnesen & Bryan, 2012; Bekki, 2014); particularly, some of them have shown that the star production can be boosted due to gas compression at the edges of the disks (e.g., Roediger et al., 2014; Boselli et al., 2021).
Since our integrated efficiencies are computed within , it is possible that the systematic decrease of SFE with HI-Class could be in part caused by morphological quenching, MQ, if most gas is driven into bulge-dominated galaxy centers. MQ (Martig et al. 2009) is able to produce a gravitational stabilization of the gas within the bulge region, preventing the fragmentation into bound star-forming clumps. Numerical simulations performed by Gensior et al. (2020) show that spheroids drive turbulence and increase the gas velocity dispersion, virial parameter, and turbulent gas pressure towards the galaxy centers, which are mostly dependent on the bulge mass (). They note that the more massive the bulges are, the higher the level of turbulence. Therefore, the stellar spheroid stabilizes the ISM of the host galaxy by increasing the shear velocity and the gas velocity dispersion, thus preventing the gravitational instability of the gas reservoirs and suppressing the fragmentation responsible for the disruption of the ISM by stellar feedback. MQ has been shown to potentially operate not only on early-type massive galaxies with a strong bulge component, but it can also work at any range (e.g., Catalán-Torrecilla et al., 2015, 2017). However, some studies (e.g., Cook et al., 2019, 2020) have noted that the regulation of the SFR in main sequence galaxies is more related to physical processes acting on the disk rather than the contribution from bulges.
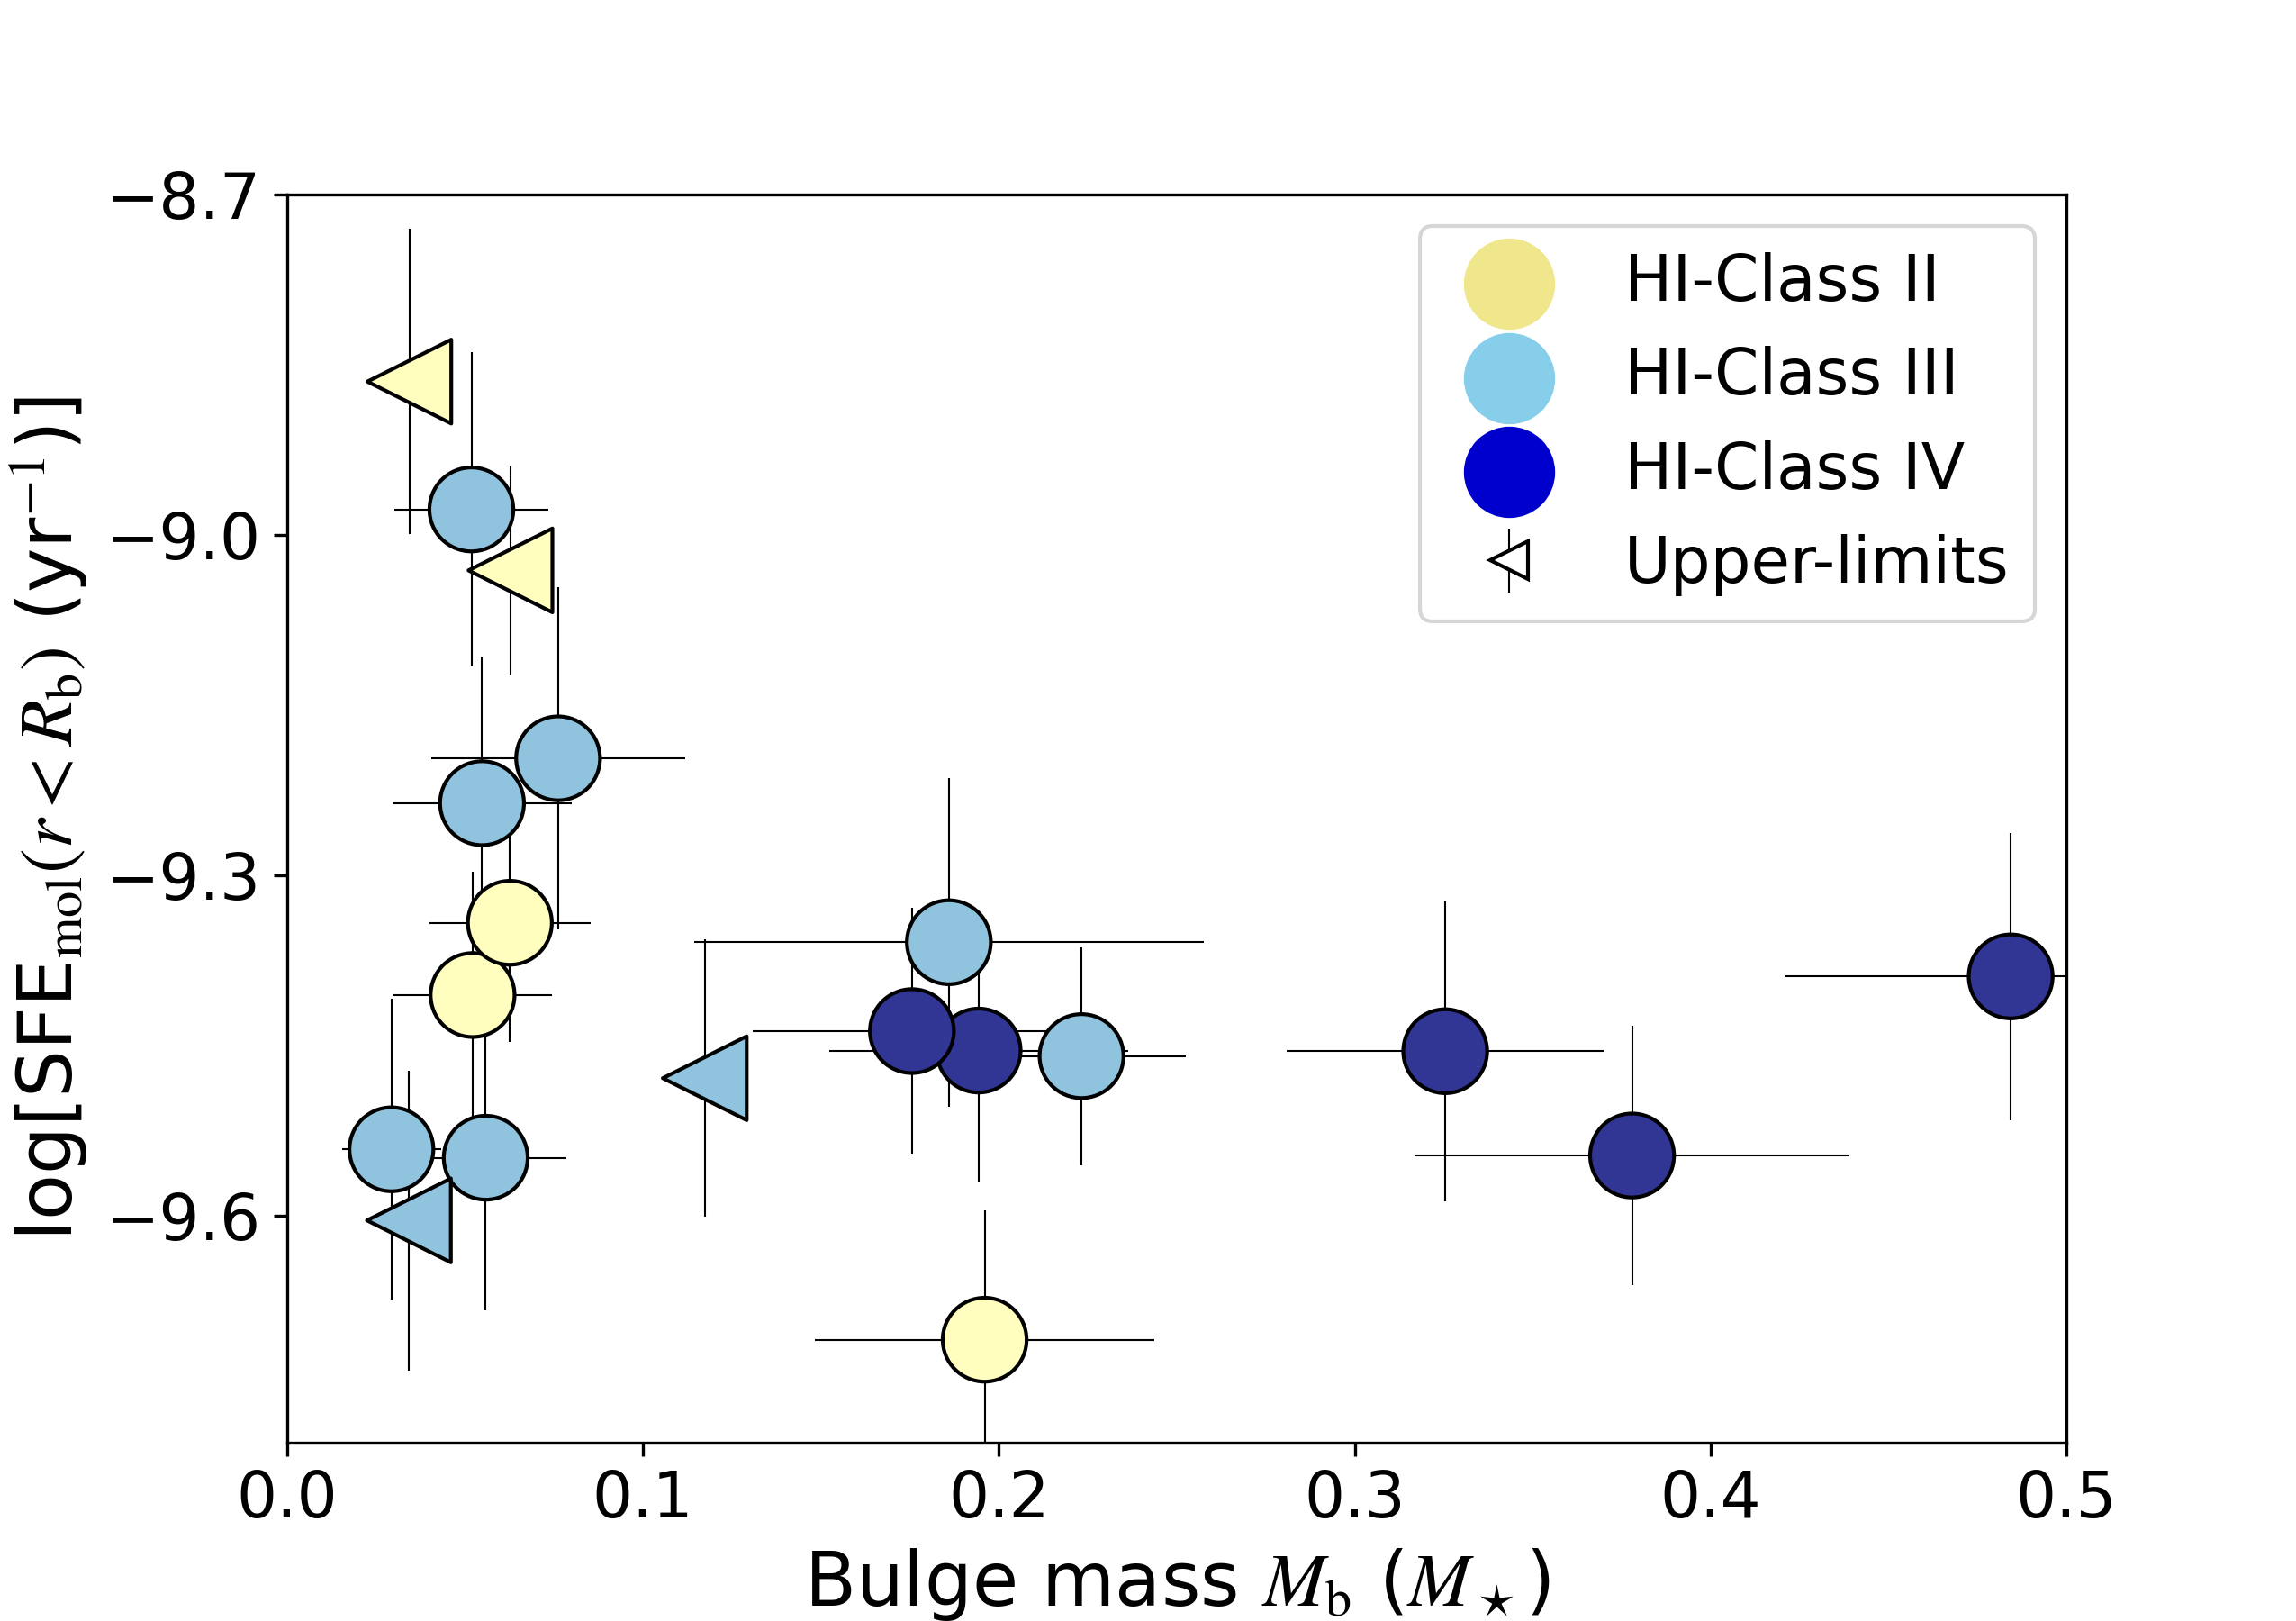
Figure 12 shows the star formation efficiency of the molecular mass within the radius of the bulge , SFE, vs bulge mass, , for HI-Classes II, III, and IV, since these are the HI-Classes with more central concentration of the molecular gas (see Fig. 5). We compute by visually inspecting the radial profiles (orange-solid line in Fig. 4) in the region within . Then we identify the where there is a break with respect to the stellar exponential profiles (red-dashed line in Fig. 4). We use this break to define . In cases where this break is not evident, we take (similar to the fiducial radius of kpc of the bulge adopted by Regan et al. 2001), which matches the physical resolution in VERTICO CO data at the Virgo cluster distance of Mpc (Mei et al. 2007), to compute a conservative upper-limit on (horizontal arrows). Finally, we integrate the radial profiles between and to obtain . As seen in Figure 12, we do not find a statistically significant anticorrelation between SFE and (Pearson ; -value). Since we are using a simple approach to compute , smaller are succeptible to be not reliable estimations (e.g., the “breaks” in could be due other circumnuclear structures). However, the figure suggests that VERTICO galaxies with more centrally concentrated molecular gas (specifically in the higher HI-Classes) tend to be less efficient at converting the H2 into stars when they host a more massive stellar bulge.
If the cluster environmental mechanisms act by pushing the molecular gas to central regions within the influence of the bulge, MQ is then a good candidate to explain the SFE decrease observed in higher HI-Classes via gas stabilization (at least in some VERTICO galaxies). Detailed studies of the molecular gas dynamics within the bulge region in Virgo galaxies are therefore important to establish the actual connection between the SFEmol, the HI-Class, and the gravitational stability of the gas.
5 Summary and conclusions
We present a study of the molecular-to-atomic gas ratio, the star formation efficiency, and their dependence on other physical parameters in 38 galaxies selected from the VERTICO survey. We analyze 12CO(=2–1) datacubes with angular resolution (except for the NGC 4321 datacube) at 10 km s-1 channel width, along with HI velocities extracted from VIVA survey. We implement spectral stacking of CO spectra to co-add them coherently by using HI velocities from the VIVA survey, and measure out to typical galactocentric radii of by coherently averaging (stacking) spectra in elliptical annuli using the HI velocity as a reference in each pixel. We use a constant Milky Way CO-to-H2 conversion factor prescription M⊙ (Walter et al. 2008), and a line Rayleigh-Jeans brightness temperature ratio of . Although the adoption of a variable has some impact on the molecular surface densities, it does not change the trends that we have found in this work. We warn that our exploration of the effects of dependence is limited and it deserves a more careful analysis in future VERTICO projects. We perform a systematic analysis to explore molecular disk sizes, molecular-to-atomic gas ratios, and the star formation efficiency of the molecular gas in VERTICO in comparison to field samples. Our main conclusions are as follows:
-
1.
We determine the molecular and stellar exponential disk scale lengths, and , respectively, by fitting an exponential function to the and radial profiles for 33 VERTICO galaxies (see Fig. 5). We find that (3:5 relation). When compared with the equivalent relation observed for galaxies selected from the field (e.g., EDGE-CALIFA survey; Villanueva et al. 2021), the CO emission in VERTICO galaxies is more centrally concentrated than the stellar surface density. Moreover, galaxies with a stronger degree of H i perturbation (as classified by Yoon et al., 2017) tentatively show more compact CO distributions (this is particularly true for HI-Class III galaxies).
-
2.
To test how the Virgo environment may be affecting the atomic-to-molecular gas transition, we compute molecular-to-stellar and atomic-to-stellar ratios as a function of galactocentric radius (left and middle panels of Fig. 6). To control for the effects of stellar mass when comparing to a field sample, we use the results obtained from xGASS-CO for stellar masses matched to each subsample in VERTICO that has been broken into Yoon et al. (2017) HI-Classes. While the molecular-to-stellar mass ratio integrated out to in VERTICO galaxies is completely consistent with the xGASS-CO sample, the atomic-to-stellar mass ratio integrated out to shows a systematic decrease with increasing HI-Class, reflecting the known significant HI deficiencies in the high HI-Classes (Yoon et al., 2017).
-
3.
The resolved molecular-to-atomic gas ratio, , decreases with increasing galactocentric radius (left panel of Fig. 8) for all HI-Classes, as expected in galaxies. However, we find a systematic increase in the molecular-to-atomic gas ratio integrated out to with increasing HI-Class (right panel of Fig. 8). Together with the previous point, these results suggest that although environmental processes act on the atomic and the molecular gas simultaneously, the atomic gas content is considerably more affected than the molecular gas content. Consequently, the morpho-kinematic HI features of VERTICO galaxies are not a good predictor for their molecular gas content.
-
4.
There is a dependency of the star formation efficiency of the molecular gas within on the morpho-kinematic HI features in VERTICO galaxies, but no strong systematic trends with galactocentric radius (Fig. 10). On average, VERTICO galaxies tend to be decreasingly efficient at converting their molecular gas into stars when their atomic gas is strongly perturbed by environmental effects. Although we do not find a statistically significant correlation between star formation efficiency within the bulge radius and the mass of the bulge we observe that galaxies with more centrally concentrated molecular gas tend to be less efficient at converting their H2 into stars when they host a more massive stellar bulge.
The general picture is that both the molecular and the atomic gas are affected by the Virgo environment, but in different manners (see also Cortese et al. 2021 and references therein). First, the mechanisms that remove HI in the cluster do not seem to significantly remove molecular gas. Instead, they appear to drive the molecular component toward the central regions, resulting in molecular disks with shorter scale lengths than their companion stellar disks. The removal of atomic gas results in galaxies that have high molecular-to-atomic ratios. However, these more centrally concentrated molecular regions with higher molecular-to-atomic ratios exhibit lower molecular star formation efficiencies than observed in field galaxies. A different (but also complementary) explanation is the removal of the molecular gas (e.g. by RPS acting preferentially in the more diffuse H2 that is not strongly tied to GMCs) in combination with a simultaneous phase transition from HI-to-H2 in the inner part of the galaxy triggered by the mechanisms that remove HI. The molecular gas removal also agrees with H2 observations in the tails of jellyfish galaxies (e.g., Moretti et al., 2020), which could otherwise be explained as a phase transition from HI-to-H2 in the tail itself.
Future projects may complement the 12CO(J=2-1) observations presented here with more accurate prescriptions (e.g., including metallicity indicators in Equation 1), the impact of the environment on the diffuse gas, or sub-kpc-scale CO observations within the bulge regions of high HI-Class galaxies. Also, detailed kinematic analyses are required to test the potential impact of environmental (or intrinsic) effects on the molecular gas stability, which may be decreasing the SFE in VERTICO galaxies.
6 acknowledgments
V. V. acknowledges support from the scholarship ANID-FULBRIGHT BIO 2016 - 56160020 and funding from NRAO Student Observing Support (SOS) - SOSPA7-014. A. D. B., S. V., and V. V., acknowledge partial support from NSF-AST2108140. T.B. acknowledges support from the National Research Council of Canada via the Plaskett Fellowship of the Dominion Astrophysical Observatory. A.R.H.S. gratefully acknowledges funding through the Jim Buckee Fellowship at ICRAR-UWA. T.A.D. acknowledges support from the UK Science and Technology Facilities Council through grants ST/S00033X/1 and ST/W000830/1. B. L. acknowledges the support from the Korea Astronomy and Space Science Institute grant funded by the Korea government (MSIT) (Project No. 2022-1- 840-05). L.C.P. acknowledges support from the Natural Sciences and Engineering Research Council of Canada. A.C. acknowledges support from the NRF (grant No. 2022R1A2C100298211 and 2022R1A6A1A03053472) by the Korean government. L.C. acknowledges support from the Australian Research Council Discovery Project and Future Fellowship funding schemes (DP210100337, FT180100066).
This paper makes use of the following ALMA data:
-
•
ADS/JAO.ALMA #2019.1.00763.L,
-
•
ADS/JAO.ALMA #2017.1.00886.L,
-
•
ADS/JAO.ALMA #2016.1.00912.S,
-
•
ADS/JAO.ALMA #2015.1.00956.S.
ALMA is a partnership of ESO (representing its member states), NSF (USA) and NINS (Japan), together with NRC (Canada), MOST and ASIAA (Taiwan), and KASI (Republic of Korea), in cooperation with the Republic of Chile. The Joint ALMA Observatory is operated by ESO, AUI/NRAO and NAOJ. In addition, publications from NA authors must include the standard NRAO acknowledgement: The National Radio Astronomy Observatory is a facility of the National Science Foundation operated under cooperative agreement by Associated Universities, Inc. Part of this work was conducted on the unceded territory of the Lekwungen and Coast Salish peoples. We acknowledge and respect the Songhees, Esquimalt, WSÁNEĆ and T’Sou-ke Nations whose historical relationships with the land continue to this day. Support for CARMA construction was derived from the Gordon and Betty Moore Foundation, the Kenneth T. and Eileen L. Norris Foundation, the James S. McDonnell Foundation, the Associates of the California Institute of Technology, the University of Chicago, the states of California, Illinois, and Maryland, and the NSF. CARMA development and operations were supported by the NSF under a cooperative agreement and by the CARMA partner universities. This research is based on observations collected at the Centro Astronómico Hispano-Alemán (CAHA) at Calar Alto, operated jointly by the Max-Planck Institut für Astronomie (MPA) and the Instituto de Astrofisica de Andalucia (CSIC).
This research has made use of the NASA/IPAC Extragalactic Database (NED), which is operated by the Jet Propulsion Laboratory, California Institute of Technology, under contract with the National Aeronautics and Space Administration.
Parts of this research were conducted by the Australian Research Council Centre of Excellence for All Sky Astrophysics in 3 Dimensions (ASTRO 3D), through project number CE170100013.
References
- Alam et al. (2015) Alam, S., Ho, S., Vargas-Magaña, M., & Schneider, D. P. 2015, MNRAS, 453, 1754, doi: 10.1093/mnras/stv1737
- Aniano et al. (2011) Aniano, G., Draine, B. T., Gordon, K. D., & Sandstrom, K. 2011, PASP, 123, 1218, doi: 10.1086/662219
- Astropy Collaboration et al. (2018) Astropy Collaboration, Price-Whelan, A. M., Sipőcz, B. M., et al. 2018, AJ, 156, 123, doi: 10.3847/1538-3881/aabc4f
- Balogh & Morris (2000) Balogh, M. L., & Morris, S. L. 2000, MNRAS, 318, 703, doi: 10.1046/j.1365-8711.2000.03826.x
- Baumgartner & Mushotzky (2006) Baumgartner, W. H., & Mushotzky, R. F. 2006, ApJ, 639, 929, doi: 10.1086/499619
- Behroozi et al. (2019) Behroozi, P., Wechsler, R. H., Hearin, A. P., & Conroy, C. 2019, MNRAS, 488, 3143, doi: 10.1093/mnras/stz1182
- Bekki (2014) Bekki, K. 2014, MNRAS, 438, 444, doi: 10.1093/mnras/stt2216
- Bigiel et al. (2008) Bigiel, F., Leroy, A., Walter, F., et al. 2008, AJ, 136, 2846, doi: 10.1088/0004-6256/136/6/2846
- Bigiel et al. (2011) Bigiel, F., Leroy, A. K., Walter, F., et al. 2011, ApJ, 730, L13, doi: 10.1088/2041-8205/730/2/L13
- Bolatto et al. (2013) Bolatto, A. D., Wolfire, M., & Leroy, A. K. 2013, ARA&A, 51, 207, doi: 10.1146/annurev-astro-082812-140944
- Bolatto et al. (2017) Bolatto, A. D., Wong, T., Utomo, D., et al. 2017, ApJ, 846, 159, doi: 10.3847/1538-4357/aa86aa
- Boselli et al. (2006) Boselli, A., Boissier, S., Cortese, L., et al. 2006, ApJ, 651, 811, doi: 10.1086/507766
- Boselli et al. (2010) Boselli, A., Ciesla, L., Buat, V., & et al. 2010, A&A, 518, L61, doi: 10.1051/0004-6361/201014534
- Boselli et al. (2014) Boselli, A., Cortese, L., Boquien, M., et al. 2014, A&A, 564, A67, doi: 10.1051/0004-6361/201322313
- Boselli et al. (2021) Boselli, A., Fossati, M., & Sun, M. 2021, arXiv e-prints, arXiv:2109.13614. https://arxiv.org/abs/2109.13614
- Boselli et al. (2022) —. 2022, A&A Rev., 30, 3, doi: 10.1007/s00159-022-00140-3
- Boselli & Gavazzi (2006) Boselli, A., & Gavazzi, G. 2006, PASP, 118, 517, doi: 10.1086/500691
- Boselli et al. (2016) Boselli, A., Cuillandre, J. C., Fossati, M., et al. 2016, A&A, 587, A68, doi: 10.1051/0004-6361/201527795
- Brown et al. (2017) Brown, T., Catinella, B., Cortese, L., et al. 2017, MNRAS, 466, 1275, doi: 10.1093/mnras/stw2991
- Brown et al. (2021) Brown, T., Wilson, C. D., Zabel, N., et al. 2021, ApJS, 257, 21, doi: 10.3847/1538-4365/ac28f5
- Bureau & Carignan (2002) Bureau, M., & Carignan, C. 2002, AJ, 123, 1316, doi: 10.1086/338899
- Cappellari et al. (2011) Cappellari, M., Emsellem, E., Krajnović, D., et al. 2011, MNRAS, 416, 1680, doi: 10.1111/j.1365-2966.2011.18600.x
- Catalán-Torrecilla et al. (2015) Catalán-Torrecilla, C., Gil de Paz, A., Castillo-Morales, A., et al. 2015, A&A, 584, A87, doi: 10.1051/0004-6361/201526023
- Catalán-Torrecilla et al. (2017) —. 2017, ApJ, 848, 87, doi: 10.3847/1538-4357/aa8a6d
- Catinella et al. (2018) Catinella, B., Saintonge, A., Janowiecki, S., et al. 2018, MNRAS, 476, 875, doi: 10.1093/mnras/sty089
- Cayatte et al. (1994) Cayatte, V., Kotanyi, C., Balkowski, C., & van Gorkom, J. H. 1994, AJ, 107, 1003, doi: 10.1086/116913
- Cayatte et al. (1990) Cayatte, V., van Gorkom, J. H., Balkowski, C., & Kotanyi, C. 1990, AJ, 100, 604, doi: 10.1086/115545
- Chen et al. (2020) Chen, H., Sun, M., Yagi, M., et al. 2020, MNRAS, 496, 4654, doi: 10.1093/mnras/staa1868
- Chung et al. (2009) Chung, A., van Gorkom, J. H., Kenney, J. D. P., Crowl, H., & Vollmer, B. 2009, AJ, 138, 1741, doi: 10.1088/0004-6256/138/6/1741
- Chung & Kim (2014) Chung, E. J., & Kim, S. 2014, PASJ, 66, 11, doi: 10.1093/pasj/pst011
- Cook et al. (2019) Cook, R. H. W., Cortese, L., Catinella, B., & Robotham, A. 2019, MNRAS, 490, 4060, doi: 10.1093/mnras/stz2789
- Cook et al. (2020) —. 2020, MNRAS, 493, 5596, doi: 10.1093/mnras/staa666
- Cortese et al. (2021) Cortese, L., Catinella, B., & Smith, R. 2021, PASA, 38, e035, doi: 10.1017/pasa.2021.18
- Cowie & Songaila (1977) Cowie, L. L., & Songaila, A. 1977, Nature, 266, 501, doi: 10.1038/266501a0
- Cramer et al. (2020) Cramer, W. J., Kenney, J. D. P., Cortes, J. R., et al. 2020, ApJ, 901, 95, doi: 10.3847/1538-4357/abaf54
- Davis et al. (2013) Davis, T. A., Alatalo, K., Bureau, M., et al. 2013, MNRAS, 429, 534, doi: 10.1093/mnras/sts353
- de Vaucouleurs et al. (1991) de Vaucouleurs, G., de Vaucouleurs, A., Corwin, Herold G., J., et al. 1991, Third Reference Catalogue of Bright Galaxies
- Dekel & Birnboim (2006) Dekel, A., & Birnboim, Y. 2006, MNRAS, 368, 2, doi: 10.1111/j.1365-2966.2006.10145.x
- Dressler (1980) Dressler, A. 1980, ApJ, 236, 351, doi: 10.1086/157753
- Dressler et al. (1997) Dressler, A., Oemler, Augustus, J., Couch, W. J., et al. 1997, ApJ, 490, 577, doi: 10.1086/304890
- Forbes et al. (2006) Forbes, D. A., Ponman, T., Pearce, F., et al. 2006, PASA, 23, 38, doi: 10.1071/AS06002
- Fumagalli et al. (2009) Fumagalli, M., Krumholz, M. R., Prochaska, J. X., Gavazzi, G., & Boselli, A. 2009, ApJ, 697, 1811, doi: 10.1088/0004-637X/697/2/1811
- Garcia (1993) Garcia, A. M. 1993, A&AS, 100, 47
- Gavazzi & Boselli (1999) Gavazzi, G., & Boselli, A. 1999, A&A, 343, 93. https://arxiv.org/abs/astro-ph/9811105
- Gensior et al. (2020) Gensior, J., Kruijssen, J. M. D., & Keller, B. W. 2020, MNRAS, 495, 199, doi: 10.1093/mnras/staa1184
- Goto et al. (2003) Goto, T., Yamauchi, C., Fujita, Y., et al. 2003, MNRAS, 346, 601, doi: 10.1046/j.1365-2966.2003.07114.x
- Gunn & Gott (1972) Gunn, J. E., & Gott, J. Richard, I. 1972, ApJ, 176, 1, doi: 10.1086/151605
- Harris et al. (2020) Harris, C. R., Millman, K. J., van der Walt, S. J., et al. 2020, Nature, 585, 357, doi: 10.1038/s41586-020-2649-2
- Haynes & Giovanelli (1984) Haynes, M. P., & Giovanelli, R. 1984, AJ, 89, 758, doi: 10.1086/113573
- Hunter (2007) Hunter, J. D. 2007, Computing in Science & Engineering, 9, 90, doi: 10.1109/MCSE.2007.55
- Kennicutt et al. (2007) Kennicutt, Robert C., J., Calzetti, D., Walter, F., et al. 2007, ApJ, 671, 333, doi: 10.1086/522300
- Kim et al. (2014) Kim, S., Rey, S.-C., Jerjen, H., et al. 2014, ApJS, 215, 22, doi: 10.1088/0067-0049/215/2/22
- Koopmann & Kenney (2004) Koopmann, R. A., & Kenney, J. D. P. 2004, ApJ, 613, 866, doi: 10.1086/423191
- Koribalski et al. (2004) Koribalski, B. S., Staveley-Smith, L., & Kilborn et al.., V. A. 2004, AJ, 128, 16, doi: 10.1086/421744
- Koribalski et al. (2020) Koribalski, B. S., Staveley-Smith, L., Westmeier, T., et al. 2020, Ap&SS, 365, 118, doi: 10.1007/s10509-020-03831-4
- Kroupa (2001) Kroupa, P. 2001, MNRAS, 322, 231, doi: 10.1046/j.1365-8711.2001.04022.x
- Krumholz et al. (2009) Krumholz, M. R., McKee, C. F., & Tumlinson, J. 2009, ApJ, 699, 850, doi: 10.1088/0004-637X/699/1/850
- Larson et al. (1980) Larson, R. B., Tinsley, B. M., & Caldwell, C. N. 1980, ApJ, 237, 692, doi: 10.1086/157917
- Lee & Chung (2018) Lee, B., & Chung, A. 2018, ApJ, 866, L10, doi: 10.3847/2041-8213/aae4d9
- Lee et al. (2017) Lee, B., Chung, A., Tonnesen, S., et al. 2017, MNRAS, 466, 1382, doi: 10.1093/mnras/stw3162
- Lee et al. (2022) Lee, B., Wang, J., Chung, A., et al. 2022, arXiv e-prints, arXiv:2204.06022. https://arxiv.org/abs/2204.06022
- Leroy et al. (2008) Leroy, A. K., Walter, F., Brinks, E., et al. 2008, AJ, 136, 2782, doi: 10.1088/0004-6256/136/6/2782
- Leroy et al. (2009) Leroy, A. K., Walter, F., Bigiel, F., et al. 2009, AJ, 137, 4670, doi: 10.1088/0004-6256/137/6/4670
- Leroy et al. (2013) Leroy, A. K., Walter, F., Sandstrom, K., et al. 2013, AJ, 146, 19, doi: 10.1088/0004-6256/146/2/19
- Leroy et al. (2019) Leroy, A. K., Sandstrom, K. M., Lang, D., et al. 2019, ApJS, 244, 24, doi: 10.3847/1538-4365/ab3925
- Leroy et al. (2021a) Leroy, A. K., Schinnerer, E., Hughes, A., et al. 2021a, arXiv e-prints, arXiv:2104.07739. https://arxiv.org/abs/2104.07739
- Leroy et al. (2021b) Leroy, A. K., Hughes, A., Liu, D., et al. 2021b, ApJS, 255, 19, doi: 10.3847/1538-4365/abec80
- Levy et al. (2018) Levy, R. C., Bolatto, A. D., Teuben, P., et al. 2018, ApJ, 860, 92, doi: 10.3847/1538-4357/aac2e5
- Lin et al. (2020) Lin, L., Ellison, S. L., Pan, H.-A., et al. 2020, ApJ, 903, 145, doi: 10.3847/1538-4357/abba3a
- Lizée et al. (2021) Lizée, T., Vollmer, B., Braine, J., & Nehlig, F. 2021, A&A, 645, A111, doi: 10.1051/0004-6361/202038910
- Loni et al. (2021) Loni, A., Serra, P., Kleiner, D., et al. 2021, A&A, 648, A31, doi: 10.1051/0004-6361/202039803
- Martig et al. (2009) Martig, M., Bournaud, F., Teyssier, R., & Dekel, A. 2009, ApJ, 707, 250, doi: 10.1088/0004-637X/707/1/250
- McMullin et al. (2007) McMullin, J. P., Waters, B., Schiebel, D., Young, W., & Golap, K. 2007, in Astronomical Society of the Pacific Conference Series, Vol. 376, Astronomical Data Analysis Software and Systems XVI, ed. R. A. Shaw, F. Hill, & D. J. Bell, 127
- Mei et al. (2007) Mei, S., Blakeslee, J. P., Côté, P., et al. 2007, ApJ, 655, 144, doi: 10.1086/509598
- Meyer et al. (2004) Meyer, M. J., Zwaan, M. A., & Webster et al.., R. L. 2004, MNRAS, 350, 1195, doi: 10.1111/j.1365-2966.2004.07710.x
- Mok et al. (2017) Mok, A., Wilson, C. D., Knapen, J. H., et al. 2017, MNRAS, 467, 4282, doi: 10.1093/mnras/stx345
- Mok et al. (2016) Mok, A., Wilson, C. D., Golding, J., et al. 2016, MNRAS, 456, 4384, doi: 10.1093/mnras/stv2958
- Molnár et al. (2022) Molnár, D. C., Serra, P., van der Hulst, T., et al. 2022, A&A, 659, A94, doi: 10.1051/0004-6361/202142614
- Moore et al. (1996) Moore, B., Katz, N., Lake, G., Dressler, A., & Oemler, A. 1996, Nature, 379, 613, doi: 10.1038/379613a0
- Moretti et al. (2020) Moretti, A., Paladino, R., Poggianti, B. M., et al. 2020, ApJ, 897, L30, doi: 10.3847/2041-8213/ab9f3b
- Morokuma-Matsui et al. (2021) Morokuma-Matsui, K., Kodama, T., Morokuma, T., et al. 2021, ApJ, 914, 145, doi: 10.3847/1538-4357/abedb6
- Oemler (1974) Oemler, Augustus, J. 1974, ApJ, 194, 1, doi: 10.1086/153216
- Osmond & Ponman (2004) Osmond, J. P. F., & Ponman, T. J. 2004, MNRAS, 350, 1511, doi: 10.1111/j.1365-2966.2004.07742.x
- Pedregosa et al. (2011) Pedregosa, F., Varoquaux, G., Gramfort, A., et al. 2011, Journal of Machine Learning Research, 12, 2825
- Pessa et al. (2021) Pessa, I., Schinnerer, E., Belfiore, F., et al. 2021, A&A, 650, A134, doi: 10.1051/0004-6361/202140733
- Poggianti et al. (2017) Poggianti, B. M., Moretti, A., Gullieuszik, M., et al. 2017, ApJ, 844, 48, doi: 10.3847/1538-4357/aa78ed
- Randall et al. (2008) Randall, S., Nulsen, P., Forman, W. R., et al. 2008, ApJ, 688, 208, doi: 10.1086/592324
- Regan et al. (2001) Regan, M. W., Thornley, M. D., Helfer, T. T., et al. 2001, ApJ, 561, 218, doi: 10.1086/323221
- Reynolds et al. (2022) Reynolds, T. N., Catinella, B., Cortese, L., et al. 2022, MNRAS, 510, 1716, doi: 10.1093/mnras/stab3522
- Roberts et al. (2022) Roberts, I. D., van Weeren, R. J., Timmerman, R., et al. 2022, A&A, 658, A44, doi: 10.1051/0004-6361/202142294
- Roediger et al. (2014) Roediger, E., Bruggen, M., Owers, M. S., Ebeling, H., & Sun, M. 2014, MNRAS, 443, L114, doi: 10.1093/mnrasl/slu087
- Roediger & Hensler (2005) Roediger, E., & Hensler, G. 2005, A&A, 433, 875, doi: 10.1051/0004-6361:20042131
- Saintonge & Catinella (2022) Saintonge, A., & Catinella, B. 2022, arXiv e-prints, arXiv:2202.00690. https://arxiv.org/abs/2202.00690
- Saintonge et al. (2011) Saintonge, A., Kauffmann, G., Wang, J., et al. 2011, MNRAS, 415, 61, doi: 10.1111/j.1365-2966.2011.18823.x
- Saintonge et al. (2017) Saintonge, A., Catinella, B., Tacconi, L. J., et al. 2017, ApJS, 233, 22, doi: 10.3847/1538-4365/aa97e0
- Sanders et al. (1985) Sanders, D. B., Scoville, N. Z., & Solomon, P. M. 1985, ApJ, 289, 373, doi: 10.1086/162897
- Sandstrom et al. (2013) Sandstrom, K. M., Leroy, A. K., Walter, F., et al. 2013, ApJ, 777, 5, doi: 10.1088/0004-637X/777/1/5
- Schröder et al. (2001) Schröder, A., Drinkwater, M. J., & Richter, O. G. 2001, A&A, 376, 98, doi: 10.1051/0004-6361:20010997
- Schruba et al. (2010) Schruba, A., Leroy, A. K., Walter, F., Sandstrom, K., & Rosolowsky, E. 2010, ApJ, 722, 1699, doi: 10.1088/0004-637X/722/2/1699
- Schruba et al. (2011) Schruba, A., Leroy, A. K., Walter, F., et al. 2011, AJ, 142, 37, doi: 10.1088/0004-6256/142/2/37
- Smith et al. (2010) Smith, R., Davies, J. I., & Nelson, A. H. 2010, MNRAS, 405, 1723, doi: 10.1111/j.1365-2966.2010.16545.x
- Solanes et al. (2001) Solanes, J. M., Manrique, A., García-Gómez, C., et al. 2001, ApJ, 548, 97, doi: 10.1086/318672
- Stevens & Brown (2017) Stevens, A. R. H., & Brown, T. 2017, MNRAS, 471, 447, doi: 10.1093/mnras/stx1596
- Stevens et al. (2021) Stevens, A. R. H., Lagos, C. d. P., Cortese, L., et al. 2021, MNRAS, 502, 3158, doi: 10.1093/mnras/staa3662
- Thomas et al. (2010) Thomas, D., Maraston, C., Schawinski, K., Sarzi, M., & Silk, J. 2010, MNRAS, 404, 1775, doi: 10.1111/j.1365-2966.2010.16427.x
- Tonnesen & Bryan (2012) Tonnesen, S., & Bryan, G. L. 2012, MNRAS, 422, 1609, doi: 10.1111/j.1365-2966.2012.20737.x
- Verheijen & Sancisi (2001) Verheijen, M. A. W., & Sancisi, R. 2001, A&A, 370, 765, doi: 10.1051/0004-6361:20010090
- Villanueva et al. (2021) Villanueva, V., Bolatto, A., Vogel, S., et al. 2021, ApJ, 923, 60, doi: 10.3847/1538-4357/ac2b29
- Virtanen et al. (2020) Virtanen, P., Gommers, R., Oliphant, T. E., et al. 2020, Nature Methods, 17, 261, doi: 10.1038/s41592-019-0686-2
- Vollmer et al. (2008) Vollmer, B., Braine, J., Pappalardo, C., & Hily-Blant, P. 2008, A&A, 491, 455, doi: 10.1051/0004-6361:200810432
- Vollmer et al. (1999) Vollmer, B., Cayatte, V., Boselli, A., Balkowski, C., & Duschl, W. J. 1999, A&A, 349, 411. https://arxiv.org/abs/astro-ph/9907351
- Vollmer et al. (2013) Vollmer, B., Soida, M., Beck, R., et al. 2013, A&A, 553, A116, doi: 10.1051/0004-6361/201321163
- Vollmer et al. (2012a) Vollmer, B., Wong, O. I., Braine, J., Chung, A., & Kenney, J. D. P. 2012a, A&A, 543, A33, doi: 10.1051/0004-6361/201118690
- Vollmer et al. (2012b) Vollmer, B., Soida, M., Braine, J., et al. 2012b, A&A, 537, A143, doi: 10.1051/0004-6361/201117680
- Walter et al. (2008) Walter, F., Brinks, E., de Blok, W. J. G., et al. 2008, AJ, 136, 2563, doi: 10.1088/0004-6256/136/6/2563
- Warmels (1986) Warmels, R. H. 1986, HI properties of spiral galaxies in the Virgo cluster
- Waskom (2021) Waskom, M. L. 2021, Journal of Open Source Software, 6, 3021, doi: 10.21105/joss.03021
- Watts et al. (2020a) Watts, A. B., Catinella, B., Cortese, L., & Power, C. 2020a, MNRAS, 492, 3672, doi: 10.1093/mnras/staa094
- Watts et al. (2020b) Watts, A. B., Power, C., Catinella, B., Cortese, L., & Stevens, A. R. H. 2020b, MNRAS, 499, 5205, doi: 10.1093/mnras/staa3200
- Wilson et al. (2012) Wilson, C. D., Warren, B. E., Israel, F. P., et al. 2012, MNRAS, 424, 3050, doi: 10.1111/j.1365-2966.2012.21453.x
- Wong & Blitz (2002) Wong, T., & Blitz, L. 2002, ApJ, 569, 157, doi: 10.1086/339287
- Wright et al. (2022) Wright, R. J., del P Lagos, C., Power, C., et al. 2022, MNRAS, doi: 10.1093/mnras/stac2042
- Yoon et al. (2017) Yoon, H., Chung, A., Smith, R., & Jaffé, Y. L. 2017, ApJ, 838, 81, doi: 10.3847/1538-4357/aa6579
- York et al. (2000) York, D. G., Adelman, J., Anderson, John E., J., et al. 2000, AJ, 120, 1579, doi: 10.1086/301513
- Young et al. (1995) Young, J. S., Xie, S., Tacconi, L., et al. 1995, ApJS, 98, 219, doi: 10.1086/192159
- Zabel et al. (2019) Zabel, N., Davis, T. A., Smith, M. W. L., et al. 2019, MNRAS, 483, 2251, doi: 10.1093/mnras/sty3234
- Zabel et al. (2020) Zabel, N., Davis, T. A., Sarzi, M., et al. 2020, MNRAS, 496, 2155, doi: 10.1093/mnras/staa1513
- Zabel et al. (2022) Zabel, N., Brown, T., Wilson, C. D., et al. 2022, ApJ, 933, 10, doi: 10.3847/1538-4357/ac6e68