NuSTAR observation of X-ray pulsar 1E 1145.1-6141.
Abstract
In this paper, we report on the hard X-ray observation of the X-ray pulsar 1E 1145.1-6141 performed with the Nuclear Spectroscopic Telescope Array mission (NuSTAR). The coherent pulsation of the source with a period of is detected. The source may be in the equilibrium phase, according to the most recent measurements of its pulse period. The pulse profile reveals a mild energy dependence and generally hints at a pencil-beam pattern. The pulse profile have evolved with time. The Pulse fraction is found to depend on energy with a fall in the value at . The NuSTAR spectra can be approximated by a composite model with two continuum components, a blackbody emission, cut-off powerlaw, and a discrete component in the form of gaussian to account for the emission line of iron. The estimated absorbed flux of the source is which corresponds to a luminosity of . Pulse phase-resolved spectroscopy were performed to understand the evolution of spectral parameters with pulse phase. The estimated blackbody radius is found to be consistent with the size of the theoretical prediction.
keywords:
accretion, accretion discs – stars:neutron – pulsars: individual: 1E 1145.1-6141 – X-rays: binaries1 Introduction
X-ray binaries (XRBs) can be categorized based on their observational and physical characteristics. XRBs can be divided into three categories based on the mass of the companion star in the binary: low mass X-ray binaries (LMXBs), intermediate-mass X-ray binaries (IMXBs), and high mass X-ray binaries (HMXBs). Accreting HMXBs are known to be among the brightest X-ray sources in our Galaxy (Nagase, 1989). In these systems of binary star, both a neutron star and a massive main-sequence star rotate around the common center of mass in a wide and eccentric orbit (Tauris & van den Heuvel 2006, ). The accretion of matter by a neutron star from the companion takes place through the capture of either stellar wind or Roche-lobe overflow. HMXBs with neutron star are categorized into Be/X-ray binaries and Supergiant X-ray binaries (Reig 2011, ). It is now known that majority of the HMXBs are Be/X-ray binaries in which the mass-donor consists of a non-supergiant B or O spectral type star (Reig 2011, ).
The Ariel 5 observations in late 1978 discovered two X-ray pulsations from the source 4U 1145-619 (also known as 2S 1145-61) (Lamb et al., 1980). Later on, Einstein Observatory resolved this problem by identifying the other source to be 1E 1145.1-6141. The source 1E 1145.1-6141 is only 15′ to the north of 2S 1145-619 (White et al., 1978; Lamb et al., 1980). These two X-ray pulsars in Centaurus with close identical spin periods are also referred to as twin pulsars. The source 2S 1145-619 is the 292 s transient X-ray pulsar which is at a distance of 1.5 kpc.
The X-ray pulsar 1E 1145.1-6141 falls under the class of Supergiant HMXB. The source is associated with the B2 Iae supergiant companion V830 Cen and has a pulsation of 297 s (Hutchings et al. (1981); Densham & Charles (1982)). The source is assumed to be at a distance of 8.5 1.5 kpc (Densham & Charles, 1982). With a typical X-ray flux of a few mcrab, or a luminosity of order , the pulsar appears persistent and steady. A low luminosity suggests that the pulsar is almost certainly accreting from the wind of V830 Cen and is incompatible with Roche lobe overflow. The supergiant X-ray pulsar 1E 1145.1-6141 has an eccentricity of 0.20 and an orbital period of 14.4 days (Ray & Chakrabarty, 2002). On a diagram, the system falls under the wind-fed supergiant XRBs (Corbet, 1986; Water & van Kerkwijk, 1989; Bildsten et al., 1997).
2 Observations and Data Reduction
2.1 NuSTAR
The data reduction for 1E 1145.1-6141 has been carried out using heasoft v6.29 and caldb version 1.0.2. NuSTAR operates in the energy range of (3-79) keV and is the first hard X-ray focusing telescope. It consists of two identical X-ray telescope modules equipped with independent mirror systems. Each of the telescopes has its own focal plane modules A and B referred to as fpma & fpmb consisting of a pixelated solid-state CdZnTe detector (Harrison et al. (2013)). The detector CdZnTe of fpma & fpmb provides spectral resolution of 400 eV (FWHM) at energy 10 keV. The presence of a unique multilayered coating of the grazing-incidence Wolter-I optics helps in providing X-ray imaging in the energy range (3-79) keV with an angular resolution of 18" (FWHM) & 58" (HPD). The data extraction and screening has been done using nustardas software v 0.4.9. The mission-specific nupipeline was run for filtering the unfiltered clean event files. Using xselect command and ds9111https://sites.google.com/cfa.harvard.edu/saoimageds9 application software, a circular region of 110" around the source center and of the same size away from the source were selected as the source and background region files respectively. The selected source and background regions were utilized for extracting the necessary light curves & spectra by imposing the mission-specific nuproducts. Next, light curves were corrected by subtracting the background contamination using ftool lcmath for both the instrument fpma & fpmb. barycentric corrections were done using ftool barycorr. The NuSTAR observation with observation ID 30501002002 (see Table 1) has been considered for performing the required temporal and spectral analysis of the system.
| Observatory | Date of observation | OBs ID | Exposure |
| (in ksec) | |||
| NuSTAR | 2019-07-23 | 30501002002 | 44.24 |
3 TIMING ANALYSIS
3.1 Pulse period estimation
The pulse period of the source was determined using the orbital corrected light curve from both the telescope modules fpma & fpmb in the wide energy range (3-79) keV with a default newbin time of 10 s. The orbital parameters for reducing the effect of orbital modulation were taken from the works of Ray & Chakrabarty (2002). Using the Fast Fourier Transform (FFT) technique by imposing the command powspec, we estimated the pulse period of the source. We further employed the epoch-folding technique (Davies, 1990; Larsson, 1996) by using ftool efsearch to estimate the precise pulsation of the source using the determined value of the period from FFT. This method is based on the maximization technique. Finally, the best period value is determined which is 296.653 0.021 s. The uncertainty in the measurements of pulsations was estimated using the method described in Boldin et al. (2013). For this, we generated 1000 simulated light curves & obtained the corresponding pulsations for each curve using the task efsearch. Finally, we computed the standard deviation & standard error and hence established the precise pulsation & the uncertainty involved in the measurement of the pulse period.
3.2 Energy-resolved Pulse Profiles
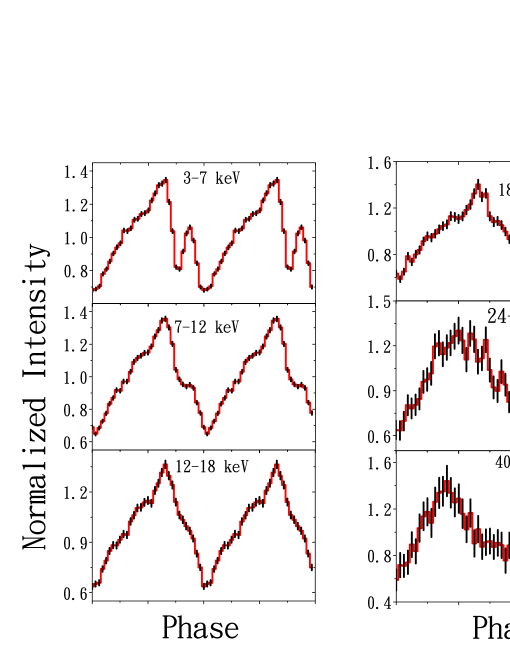
In order to analyze energy-resolved pulse profiles (see Figure 1), we constructed light curves for the several energy bands, viz. (3-7) keV, (7-12) keV, (12-18) keV, (18-24) keV, (24-40) keV, and (40-79) keV, by folding it at the determined value of the spin period. The pulse profile in the lowest energy band (3-7) keV is characterized by a broad single peak with an additional second peak in the phase interval 0.65-0.75. The second peak vanishes as the profile evolves with energy i.e the pulse profile transforms to triangular shape in the harder energy ranges. The peak emission component shifts towards lower phases as the profile evolves with energy.
3.3 Pulse Fraction
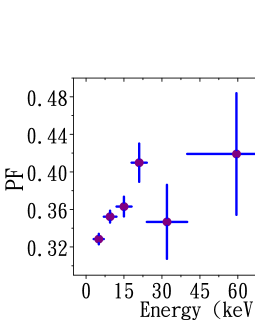
The variation of Pulse Fraction (PF) with energy is represented in Figure 2. PF is defined as where represents the maximum and minimum intensities of the pulse profile. The PF initially increases with energy upto 20 keV followed by a drop in the value near 32 keV and above, the PF again increases with energy.
4 SPECTRAL ANALYSIS
4.1 Phase-average spectroscopy
| Parameters | MODEL I | MODEL II | MODEL III | ||||||
|---|---|---|---|---|---|---|---|---|---|
| 1(fixed) | 1(fixed) | 1(fixed) | |||||||
| 0.988 | 0.988 | 0.986 | |||||||
| 4.99 | 4.57 | 1.20 (fixed) | |||||||
| COMPTT () (keV) | - | - | 1.12 | ||||||
| COMPTT (kT) (keV) | - | - | 9.98 | ||||||
| COMPTT () (keV) | - | - | 3.47 | ||||||
| 0.90 | 1.06 | - | |||||||
| (keV) | 17.04 | 6.16 | - | ||||||
| (keV) | - | 19.24 | - | ||||||
| (keV) | 2.61 | 3.13 | 3.47 | ||||||
| NORMkT | 0.106 | 0.045 | 0.083 | ||||||
| Fe line (keV) | 6.33 | 6.35 | 6.35 | ||||||
| (keV) | 0.28 | 0.19 | 0.28 | ||||||
| Flux() | 6.01 | 6.03 | 6.01 | ||||||
| 0.97 | 0.96 | 0.97 |
The source 1E 1145.1-6141’s X-ray spectra were fitted in the energy range of 3-79 keV. The data from NuSTAR were grouped using the spectral fitting tool grppha to ensure that there were at least 25 counts per spectral bin. The aforementioned energy range was used to perform the simultaneous spectral fitting of fpma & fpmb. A model CONSTANT was included to assure the normalisation factor between the two modules, fpma & fpmb. In the former instrument, the constant parameter was set to unity, whereas in the latter, we left it unset. The spectra’s fitting revealed that the constant factor corresponding to fpmb was . We introduced the TBABS component with the solar abundances from Wilms et al. (2000) in order to account for interstellar absorption, and we included the GAUSSIAN component in order to fit the emission lines of Fe. An additional BBODYRAD component was also required to approximate the spectra.
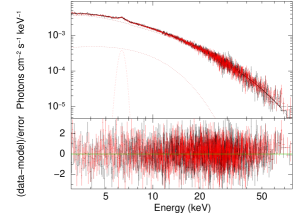
Several phenomenological models were applied to fit the spectra of the source. In order to approximate the spectra of the source, we have considered three model combinations constanttbabs(cutoffpl+bbodyrad+gaussian), constant tbabs (highecut powerlaw+bbodyrad+gaussian) & constant tbabs (comptt+bbodyrad+gaussian) as shown in Table 2. It was observed that the applied model combinations approximates the spectra very well. However, the neutral hydrogen column density () for the combination constant tbabs comptt were fixed at the Galactic value in the direction of the source 1.2 (HI4PI Collaboration et al., 2016). The unfolded energy spectrum for the model combination constant tbabs (cutoffpl+bbodyrad+gaussian) has been shown in Figure 3. Interestingly, it can be seen from Table 2 that the value of is relatively higher than the observed Galactic value for the two model combinations constant tbabs cutoffpl & constant powerlaw highecut. Using the command flux in xspec, we approximated the source absorbed flux, which we found to be and its associated luminosity to be assuming a distance of 8.5 1.5 kpc (Densham & Charles, 1982).
5 Phase-resolved spectroscopy
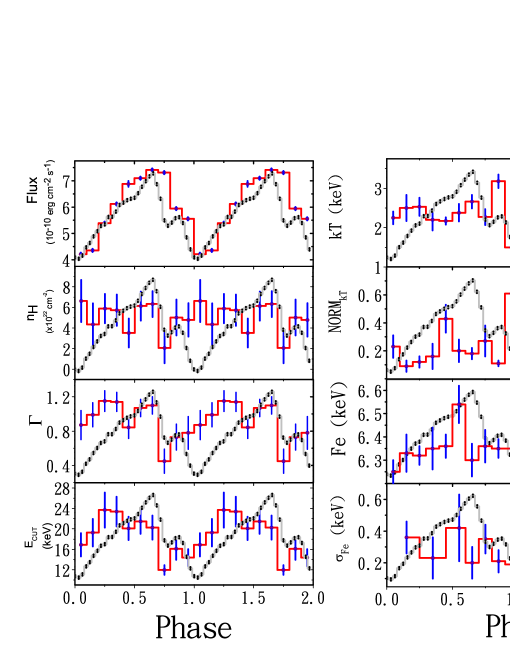
The phase-resolved spectroscopy was performed in an attempt to study the evolution of spectral parameters with the pulse phase of the pulsar. For this, the source pulse period was divided into ten equally distributed rotational phase bins. We then generated good time interval (gti) files based on the folding epoch and pulse period corresponding to each phase. By making use of GTI file we performed the task nuproducts for each phase and finally obtained the spectra files corresponding to ten pulse phases. We performed the analysis of all the ten phases in the energy range (3-79) keV with the model combination constanttbabs(cutoffpl+bbodyrad+gaussian) considered for average spectra. Figure 4 shows the evolution of the spectral parameters like Flux, , , , kT, , Fe line and Fe width with the rotational phase. The zero points of all spectral parameters are considered at flux minimum for a representaive purpose so that we can visualize the evolution of spectral parameters that is present with the (3-79) keV pulse profile superimposed in grey color in the background (see Figure 4). It is obvious from Figure 4 that the spectral parameters evolve with a large amplitude over the pulse phase. The observed flux of the source correlates very well with the (3-79) keV pulse profile. The flux of the source varied between 24 % and 30 % i.e (4.21-7.41) when compared with the average value. The photon-index () follows the main pulse profile with maximum value 1.15 in the phase interval 0.2-0.3 and minimum value 0.45 in the phase interval 0.7-0.8. The equivalent hydrogen column density () varied at all phases with a peak value of and a minimum value of in the phase intervals 0.7-0.8 and 0-0.1 respectively. The cutoff energy Though has no physical meaning, but it is related the strength of the magnetic field (Makishima et al., 1990). The variation of is seen to depend at all phases with a maximum value of 23.67 keV in the phase interval 0.2-0.3 and a minimum value of 12 keV in the phase interval 0.7-0.8. The blackbody temperature (kT) of the emitting region varied between (1.50-2.66) keV in the phase interval 0.6-0.7 and 0.9-1.0 respectively. The blackbody emitting region i.e the size of the emitting area is related to the norm of the BBODYRAD component and is found to vary between (0.05-0.15) km. The fluorescent line of iron varied between (6.25-6.54) keV while its equivalent width () varied between (0.19-0.42) keV. However, the width at some phases were kept freezed at the value corresponding to the average spectral fit.
6 Discussion and Conclusion
In the paper, the temporal and spectral properties of the source 1E 1145.1-6141 have been examined by taking the data observed by NuSTAR with observation ID 30501002002. Previous work of Ray & Chakrabarty (2002) on this source have shown the timing properties in detail, particularly, the orbital parameters. We detected the coherent pulsation of the source at 296.653 s. Past observations have reported the pulse period of the source as 296.572 ± 0.001 s and 296.695 ± 0.002 s (Ferrigno et al., 2009), thereby, indicating that the source is undergoing through a phase of spin equilibrium i.e. stable pulsar rotation.
The pulse profile of the source in (3-79) keV shown in grey color in the background (see Figure 4) is dominated by a broad single peak with an additional second peak at phase 0.7. The additional secondary peak in the continuum profile is considered to be the reminiscent of the notch between the maximum and minimum pulse as reported by Grebenev et al (1992) and Ray & Chakrabarty (2002). However, the additional emission component in the work of Ray & Chakrabarty (2002) lies in the initial phase while in our present work it has shifted towards the initial phase. The variations of pulse profile with energy is nominal with the peak emission shifting towards the initial phase as observed by Ferrigno et al. (2009).
It has been noted by Shaw et al. (2009) that pulse profile transforms from multi-peak at lower energy ranges to single-peak at higher energy ranges. Such features have been observed in many X-ray pulsars especially the bright ones like Her X-1, 4U 0115+63, 1A 0535+26 and V 0332+63. In particular, in the case of 1E 1145.1-6141, the additional emission component seen in the lowest energy range (3-7) keV disappears as the pulse profile evolves with energy and transforms into triangular shape in the higher energy ranges. The shape of the pulse profile is found to evolve with time when we compared that with the work of Ray & Chakrabarty (2002) that infers a change in the accretion geometry.
Critical luminosity is defined as the luminosity below which the source accretes with pencil-beam geometry (known as sub-critical regime) and above which the source accretes with fan-beam geometry (super-critical regime). A pulsar’s luminosity can affect the beaming pattern. Our timing analysis pulse profile suggest that the source may be accreting in the sub-critical domain. In the sub-critical regime, the beaming patttern is dominated by a pencil-beamed pattern where the accreted material penetrates the NS surface through collisions like nuclear (collisions with atmospheric proton) or coulomb (collisions with thermal electrons) ((Harding, 1994). The emission in the case of a pencil-beamed pattern escapes from the top of the column (Burnard, Aron & Klein, 1991). In super-critical regime, the accreted material slows down towards the surface of a NS due to a radiation dominated shock created in the accretion column. As a result, the high radiation pressure stops the accretion material at a distance above the surface of a NS which in turn leads to X-ray emissions in the form of fan-beam shaped pattern (Davidson, 1973).
The presence of an absorption feature in the source can be inferred indirectly from the temporal analysis of the PF change with energy. Some X-ray pulsars have shown these characteristics in the past (Tsygankov et al., 2007; Ferrigno et al., 2009; Lutovinov & Tsygankov, 2009; Tsygankov et al., 2010; Lutovinov et al., 2017). An overall non-monotonic increase with energy can be seen in the PF variation with energy. The PF first rises with energy up to about 20 keV, which is characteristic of X-ray pulsars (Lutovinov & Tsygankov, 2009). Above 20 keV, a PF decrease is seen at about 32 keV, followed by an increase in PF at higher energies. A clue as to whether cyclotron lines are present in the spectra is provided by the source 1E 1145.1-6141’s PF variation with energy. We sought confirmation as a result in both the average and the phase-resolved spectra. The source’s average spectra do not exhibit any overt absorption features, such as cyclotron resonant scattering features in the energy range (3-79) keV. This led us to constrain the magnetic field of the source as either weaker than or stronger than when we consider the lower or the upper limit of the NuSTAR energy range (3-79) keV. Interestingly, recent studies have found that in some X-ray pulsars like GRO J2058+42 (Molkov et al., 2019) and Swift J1808.4-1754 (Salganik et al., 2022), the CRSF feature although absent in the average continuum spectra, it is found to have feature phase-transient characteristic during the study of the pulse phase-resolved spectroscopy. In order to confirm the existence of the other absorption features, such as the cyclotron line or its higher harmonics, which may only be present at specific phase, we have used phase-resolved spectroscopy. However, we do not any such features using the model combinations used for average spectrum approximations.
The (3-79) keV spectrum was well approximated by an absorbed POWERLAW modified by a high energy CUTOFF, a phenomonological deconvolution, which are widely employed to model the spectra of accreting pulsars (e.g Coburn 2002 ). In addition, the spectrum requires BBODYRAD and GAUSSIAN component to arrive at best spectral fit. Other components in the form of COMPTT and HIGHECUT were examined in place of CUTOFFPL which too approximated the spectra very well. The average flux of the source in the energy range (3-79) keV is and its corresponding luminosity is assuming a distance of 8.5 1.5 kpc (Densham & Charles, 1982). Interestingly, it is observed that the best-fit value of for the two model components CUTOFFPL and COMPTT were 3-4 times higher than the Galactic value (1.2) in the direction of the source. The system may have a significant intrinsic absorption as one cause, or there may be some interstellar medium non-uniformities in the source’s direction that make detection on typical maps challenging due to their poor angular resolution constraints.
Once the gas particles, or accreted matter, enter the magnetosphere, they can only move along the magnetic field lines. This causes the accretion flow to move in the direction of the magnetic poles, indicating that the accretion of matter is concentrated only in the polar caps, a small area on the surface of the NS. The magnetic field lines now adopt a form of column-shaped or funnel-shaped surface known as accretion column with polar caps at the base. The blackbody radius or emission area can be understood as the column’s radius. A typical size of the polar caps lies between 0.1 and 0.001 (Meszaros, 1992) , where denotes the radius of the NS. Assuming a radius of 10 km for a NS, the polar cap radius in our case lies close to 1 km. Thus the theoretical size of the polar caps and the size of the emission area that we determined are in good accord with Meszaros (1992).
Data availability
The observational data used in this study can be accessed from the HEASARC data archive and is publicly available for carrying out research work.
7 Acknowledgement
This research work have used the NuSTAR data archived by the NASA High Energy Astrophysics Science Archive Research Center (HEASARC) online service maintained by the Goddard Space Flight Center. This work has made use of the NuSTAR Data Analysis Software (NuSTARDAS) jointly developed by the ASI Space Science Data Center (SSDC, Italy) and the California Institute of Technology (Caltech, USA). We would like to express our gratitude to the anonymous reviewer for their insights and recommendations, which helped to shape the work as it stands now.
References
- Bildsten et al. (1997) Bildsten, L., et al. 1997, ApJS, 113, 367
- Boldin et al. (2013) Boldin P. A., Tsygankov S. S., Lutovinov A. A., 2013, Astrophys. Let., 39,375
- Burnard, Aron & Klein (1991) Burnard D. J., Arons J., Klein R. I., 1991, ApJ, 367, 575
- (4) Coburn, W., Heindl, W. A., Rothschild, R. E., et al. 2002, ApJ, 580, 394
- Corbet (1986) Corbet, R. H. D. 1986, MNRAS, 220, 1047
- Davies (1990) Davies S. R., 1990, MNRAS, 244, 93
- Davidson (1973) Davidson K., 1973, Nature Phys. Sci., 246, 1
- Densham & Charles (1982) Densham, R. H., & Charles, P. A. 1982, MNRAS, 201, 171
- Ferrigno et al. (2009) Ferrigno C., Becker P. A., Segreto A., Mineo T., Santangelo A., 2009, A & A, 498, 825
- Grebenev et al (1992) Grebenev, S. A., Pavlinsk, M. N., & Syunyaev, R. A. 1992, Soviet Astronomy Letters, 18, 228
- (Harding (1994) Harding A. K., 1994, AIP Conf. Proc. Vol. 308, The evolution of X-ray binaries. Am. Inst. Phys., New York, p. 429
- Harrison et al. (2013) Harrison F.A. et al. 2013, ApJ, 770, 103
- Hutchings et al. (1981) Hutchings, J. B., Crampton, D., & Cowley, A. P. 1981, AJ, 86, 871
- HI4PI Collaboration et al. (2016) HI4PI Collaboration et al., 2016, A & A, 594, A116
- Lamb et al. (1980) Lamb, R. C., Markert, T. H., Hartman, R. C., Thompson, D. J., & Bignami, G. F. 1980, ApJ, 239, 651
- Larsson (1996) Larsson S., 1996, A & AS, 117, 197
- Lutovinov & Tsygankov (2009) Lutovinov A. A., Tsygankov S. S., 2009, Astronomy Letters, 35, 433
- Lutovinov et al. (2017) Lutovinov A. A., Tsygankov S. S., Postnov K. A., Krivonos R. A., Molkov S. V., Tomsick J. A., 2017, MNRAS, 466, 593
- Makishima et al. (1990) Makishima K. et al., 1990, ApJ, 365, L59
- Meszaros (1992) Meszaros P., 1992, in High-Energy Radiation from Magnetized Neutron Stars. Univ. Chicago Press, Chicago, p. 21
- Nagase (1989) Nagase F. 1989, PASJ, 41, 1
- Ray & Chakrabarty (2002) Paul S. Ray and Deepto Chakrabarty 2002 ApJ 581 1293
- (23) Reig P. 2011, Ap & SS, 332, 1
- Salganik et al. (2022) Salganik, A., Tsygankov, S.S., Lutovinov, A.A., Djupvik, A.A., Karasev, D.I. and Molkov, S.V., 2022. Discovery of a pulse-phase-transient cyclotron line in the X-ray pulsar Swift J1808. 4-1754 and identification of an optical companion. arXiv preprint arXiv:2205.12140.
- Molkov et al. (2019) Molkov et al 2019 ApJL 883 L11
- Shaw et al. (2009) Shaw S. E., Hill A. B., Kuulkers E., Brandt S., Chenevez J., Kretschmar P., 2009, MNRAS, 393, 419
- (27) Tauris T. M., van den Heuvel E. P. J. 2006, in Lewin W., Klis M. V. D., eds, Formation and Evolution of Compact Stellar X-Ray Sources, Cambridge University Press, Cambridge, UK, p. 623
- Tsygankov et al. (2007) Tsygankov S. S., Lutovinov A. A., Churazov E. M., Sunyaev R. A., 2007, Astronomy Letters, 33, 368
- Tsygankov et al. (2010) Tsygankov S. S., Lutovinov A. A., Serber A. V., 2010, MNRAS, 401, 1628
- Water & van Kerkwijk (1989) Waters, L. B. F. M., & van Kerkwijk, M. H. 1989, A & A, 223, 196
- White et al. (1978) White, N. E., Parkes, G. E., & Sanford, P. W. 1978, Nature, 274, 664
- Wilms et al. (2000) Wilms J., Allen A., McCray R., 2000, ApJ, 542, 914
- (33)
- (34)
- (35)
- (36)
- (37)
- (38)
- (39)
- (40)
- (41)
- (42)
- (43)
- (44)
- (45)
- (46)
- (47)
- (48)
- (49)
- (50)
- (51)
- (52)
- (53)
- (54)
- (55)
- (56)
- (57)
- (58)
- (59)
- (60)
- (61)
- (62)
- (63)
- (64)
- (65)
- (66)
- (67)
- (68)
- (69)
- (70)
- (71)
- (72)
- (73)
- (74)
- (75)
- (76)
- (77)
- (78)
- (79)
- (80)
- (81)
- (82)
- (83)
- (84)
- (85)
- (86)
- (87)
- (88)
- (89)
- (90)
- (91)
- (92)
- (93)
- (94)
- (95)