Carrier thermalization and zero-point bandgap renormalization in halide perovskites from the Urbach tails of the emission spectrum
Abstract
We develop techniques to study the temperature dependent localization, thermalization, and the effects of phonon scattering on the excitons in halide perovskites from the analysis of the emission spectra. The excitonic Urbach edge, when inferred from the low energy tails of the temperature dependent luminescence spectra, is shown to be sensitive to the electron distribution and thermalization. A method to observe the Urbach focus is devised for halide perovskites where the temperature dependence of the excitonic gap is anomalous. The value of the zero-point bandgap renormalization is inferred to be about 33 meV. This small value of the bandgap renormalization rules out the formation of small polarons and points to weak electron-phonon coupling. The experiments are performed on the nanosheets of the archetypal halide perovskite, CsPbBr3.
Halide perovskites [1, 2, 3, 4, 5, 6, 7, 8, 9] with ABX3 composition (A = Cs or CH3NH3, etc., B = Pb or Sn, and X = Cl, Br, or I) are direct gap semiconductors. Their physical properties are well-described by the standard band theory and the excitons in these systems are of the Mott-Wannier type, albeit with somewhat larger binding energy than GaAs or InP [10, 11]. Yet, while conventional semiconductors are sensitive to parts-per-million-level imperfections and require stringent clean-room and controlled growth conditions, Pb-based halide perovskites (HP) can be prepared via the solution route and still exhibit the excellent light emission characteristics at room temperature.[12, 13] Thus the HPs combine some of the most desirable characteristics of the inorganic (high mobility) and the organic semiconductors (simplicity of preparation). But beyond the observation of strong light emission at room temperature, one must also understand the effect of defects on nature of the carrier distribution and the role of phonon scattering for optimal materials and device design.[1, 9, 14, 15, 16]
In this Letter, we have extended the available techniques to examine the complete emission lineshape to uncover hitherto unutilized information regarding the carrier thermalization and the strength of electron-phonon interaction. In particular, we have tailored the Urbach edge [17, 18, 19, 20, 21, 22, 23] analysis so that the luminescence, rather than the absorption spectra, can be studied within this framework. We also reformulate the analysis to accommodate the anomalous increase of the bandgap with temperature in these materials[24] and demonstrate the full Urbach rule,[25, 26] including the Urbach focus, which we identify with the zero-temperature unrenormalized energy gap.[21, 22, 25, 26] Experiments are done on the archetypal halide perovskite, CsPbBr3, prepared in the form of two-dimensional nanosheets.[6, 7]
Figure 1 shows the K photoluminescence (PL) spectrum measured at the relatively high laser excitation power ( Wcm-2) where the features from the localized states are minimized. Apart from the prominent free exciton peak at eV, based on the two-dimensional correlation analysis, the feature at 2.275 eV is assigned to a bound exciton peak which evolves into the exponential Urbach tail of the free exciton emission (see Supplementary Material Figure S2).
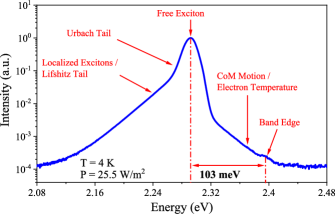
Finally, the Urbach tail itself continuously merges into other localized (the Lifshitz tail [27]) states with a stretched exponential form, extending to meV below the free exciton peak. On the high energy side, the band edge at eV yields the free exciton binding energy meV. Considering that the emission is sustained till room temperature, this value for the binding energy seems reasonable (see Supplementary Material).
We mainly focus on the low energy tail of the free exciton absorption line inferred from the PL emission spectrum. The region of interest is where the absorption coefficient is of its peak value and is characterized by the nearly universal Urbach rule, viz.,
| (1) |
is called the Urbach focus and is the value of the absorption coefficient at . The slope is also observed to have universal temperature dependence [18, 28]
| (2) |
Here is the characteristic phonon frequency and can be the weighted contributions of many modes and branches.[25]
In conventional insulators, the existence of a temperature-independent Urbach focus at energy is fundamentally dependent on the fact that the temperature dependent shift of the excitonic band edge (or indeed, any of the band structure critical points) is also well-approximated by the same equation[25]
| (3) |
This suggests that the Urbach slope and are both governed by the same exciton-phonon interactions, whose strengths would scale as the Bose distribution () that controls the phonon population; , with an added factor of one-half from the zero-point effects, since even at zero temperature, the atoms in a real crystal are dynamic entities with a zero point motion that contributes to the bandgap renormalization.[25, 26, 29]
The similarity of Equation 2 and 3 implies that the functional form of the Eq. 1 is invariant with respect to a transformation
| (4) |
if we also simultaneously redefine . The existence of the Urbach focus , the point where the band tails at different temperatures all meet, is thus the happy consequence of the fact that the temperature-dependent decrease of the energy gap and the temperature dependence of the Urbach slope are governed by the same phonon physics. Furthermore, due to the above mentioned factor of , the Urbach tails have remarkable manifestations of the zero-point effects of the electron-phonon interactions, much like the Lamb shift physics in the context of quantum electrodynamics.[25, 26] The Urbach focus denotes the value of unrenormalized energy gap, that is, the bandgap one would hypothetically measure if the electron-phonon interactions were switched off. is the zero-temperature broadening from the electric field of the electron-polar optical phonon vacuum.
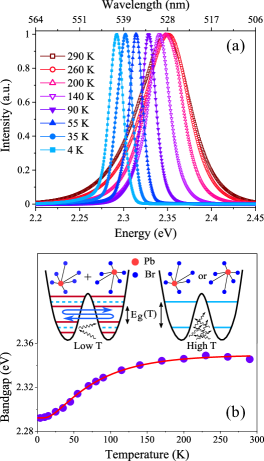
Figure 2 (a) shows the PL spectra at a few representative temperatures. This sigmoidal-shaped [Figure 2 (b)] anomalous blue-shift of the excitonic gap with temperature is characteristic of all the lead- and tin-containing halide-perovskites.[9] The primary cause for the change in the excitonic gap in these materials is not in the usual temperature-dependent thermal expansion and enhanced electron-phonon scattering, but rather a high-temperature local symmetry-breaking phenomenon (termed emphanisis) resulting from the lead atoms’ lone-pair stereochemistry.[30] Such a variation of temperature-dependent excitonic bandgap can be very well described by semi-empirical expression that is motivated by the physics of the dissipative tunneling of these Pb atoms within the perovskite cage.[24] The exciton gap may be fitted to the three-parameter formula[24]
| (5) |
Here, is the bandgap at high temperature, is the characteristic phonon temperature, and is the bandgap change due to emphanisis. Solid line in Figure 2 (b) shows the fit of Equation 5 to the experimental excitonic bandgap data in CsPbBr3, and the parameter values obtained by the fit are eV, meV, and K.
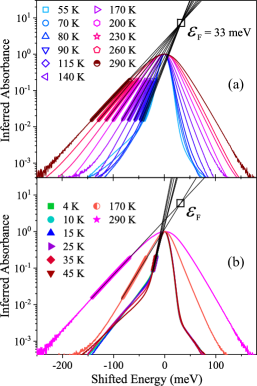
As the temperature dependence of the gap in these materials has an extraneous cause and Equation 3 is not valid, in Equation 1 would not be temperature independent and the Urbach rule would not be valid. The Urbach focus analysis[26] can still be salvaged nevertheless if we go back a step and correct for the emphanisis-induced bandgap shift by translating the peaks to zero energy using Equation 5. We have done this in Figure 3 by fitting straight lines to the inferred absorption data in the selected range ( of its peak value) and extrapolating them to get an estimate for , which is identified with the zero temperature bandgap renormalization.[25] The relatively small value (33 meV) of zero-point renormalization suggests that we have Mott-Wannier excitons with weak exciton-phonon coupling. Furthermore, the Urbach energy at any particular temperature is thus the inverse of the slope of the fitted straight line in Figure 3.
The PL and the absorption phenomena are proportional to the Einstein and coefficients and one may thus infer a relationship between PL and absorption measurements via the fundamental connection between the and .[31] The optical absorption measurement (in the limit of low excitation) can usually be considered to be the measurement of the imaginary component of the sample’s susceptibility that is itself proportional to the optical joint density of states. The PL spectrum may thus be written as the combination of the joint density of states and the carrier distribution function, viz.,
| (6) |
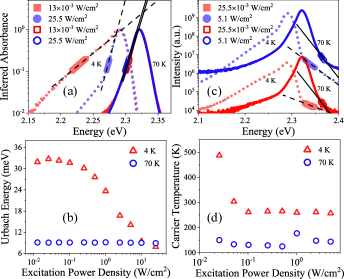
For the excitonic emission, where is the principal quantum number, is a (broadened) resonance line starting at that, on the high energy side, evolves with the density of hydrogenic states with finite center-of-mass momentum , merging with the closely spaced and higher bound states leading up to the gap. While optical transitions with are usually considered forbidden, note that small relaxations in the vicinity of are not quite ruled out on account of various scattering process, especially at higher temperatures. The emission between the bandedge and the free exciton peak is a region ( eV) attributed to such states. The exponential high energy tail is identified with the distribution function and it can be used to infer an approximate electron temperature by fitting the slope to , where is the Boltzmann constant and the inferred carrier temperature [see Figure 4 (d)] [32]. Due to the exponential nature of this high energy tail of the distribution function, the effect of the (polynomial) variation of the density of states with energy can be ignored.
Emission spectrum involves the carrier distribution. Since the total number of carriers participating in the emission process is many orders of magnitude smaller than number of states within the band, the emission spectrum is extremely sensitive to the disorder landscape. The localization of the excitons at these trapping sites prevents their spatial and spectral diffusion necessary for them to attain an equilibrium distribution. Even though the disorder-localized states may be a negligible fraction of the extended band states, these are selectively occupied by the photoexcited carriers, especially at low temperatures. The low temperature PL is largely representative of these localized states[33] and thus very sensitive to excitation power. An increased carrier density resulting from high excitation power would fill these low lying localized states and act to smoothen the potential energy landscape, thereby effectively reducing the disorder. The absorption spectrum, on the other hand, is overwhelmed by the much larger number of extended band states. At the lowest temperatures ( K), the emission spectrum therefore follows the density of the localized states where the excitons are first trapped. As the temperature is increased, partial thermalization may be accomplished. The low temperature PL spectra, therefore, show various anomalous features which yield direct information about the nature of disorder-induced potential energy landscape localizing the excitons. Above a certain temperature where the thermal energy gets larger than the characteristic trapping energy, we may expect better thermalization of the excitons and the emission spectrum may then be insensitive to the effects of disorder and be governed by the intrinsic exciton-phonon interaction physics. This is exactly what we observe.
In Figure 3 (a) and (b), we have plotted the inferred absorbance from the PL spectra at different temperatures. The peaks in each case have been arbitrarily scaled to unity, and the abscissa in each case has also been shifted to correct for the anomalous bandgap shift. Following the fit to the temperature dependence of the bandgap [Figure 2 (b)], the excitonic peaks now appear at the zero of energy. The low energy edge where the value of the absorbance is between and are identified as the Urbach tail regions. Figure 3 (a) shows the spectra around 55 K where we observe a systematic decrease in the slope with increasing temperature. We note that the Urbach rule is clearly established for the spectra above 55 K, viz., (i) we observe an exponential density of states, with (ii) a clearly discernable focus at about 33 meV. This value of is identified with the zero temperature bandgap renormalization.[25, 26] Finally, (iii) the temperature dependence of the Urbach slope itself obeys Equation 2, as can be seen in Figure 5 (a), with meV and meV. We also note from Figure 4 (a) and (b) that for temperatures around 70 K, the inferred is invariant over a large range of excitation power, indicating that intrinsic phonon-mediated physics is at play at these temperatures.
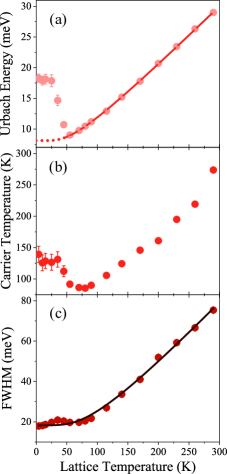
In Figure 5 (b), the carrier temperature is inferred by fitting the high energy tails[32, 23] of the free exciton emission peak to an exponential function. The fitting was accomplished by a linear fit to tail of emission spectrum plotted on the semi-log scale, viz., . The carrier temperature above 70 K nearly follow the lattice temperatures and the inferred carrier temperatures are largely insensitive to the excitation powers [Figure 4 (c) and (d)].
The temperature-dependent linewidth of the free exciton PL spectra depicted in Figure 5 (c). Note that the emission spectra at higher temperature are highly asymmetric [Fig 2 (a)] suggesting another lower energy peak. [4] To avoid any contribution from these low-energy states, we calculate the “FWHM” by doubling the high energy half-width-at-half-maximum of the free exciton peak. Note that the shape of the temperature dependence of this linewidth above 50 K closely resembles the temperature dependence of , indicating that the high temperature behaviour is determined by the scattering by optical phonons of similar characteristic energy.
More concretely, the temperature dependence of the FWHM can be phenomenologically described by the equation[34]
| (7) |
Here is the temperature-independent inhomogeneous broadening due to the scattering from imperfection and the scattering from zero-point phonons. The homogeneous broadening of the emission line is accounted for by considering[35]: (i) the anharmonic deformation, captured through acoustic phonons (ii) Fröhlich interactions, mediated by the longitudinal optical (LO) phonons. , , in the above equation are the free exciton-acoustic phonon coupling coefficient, exciton-LO phonon coupling strength, and the characteristic LO phonon energy respectively. The solid line in Figure 5 (c) shows the fit to experimental data with Equation 7. The estimated parameters are: 17 meV, 2.7 10-4 meVK-1, 48 meV, and 15.5 meV. The small value of suggests a minimal contribution of acoustic phonons to the spectral broadening, and the key role in the scattering process is performed by the LO phonons.[36] meV agrees well with meV was inferred from the temperature dependence of the Urbach slope in Fig. 5 (c).
The character of the emission spectrum above 70 K is thus unambiguously intrinsic and dominated by the exciton-phonon scattering. The spectral shape, including that of the low energy Urbach tail and the high energy tail (used to infer the carrier temperature), is invariant over a large range of excitation power.
We thus find that (apart from our inability to explain the pronounced asymmetry in the linsehape) the emission spectra at temperatures above 70 K are well-explained assuming excitonic emission from Mott-Wannier excitons under moderate disorder and weak exciton-phonon coupling. While the lineshape is largely invariant above 70 K, the behaviour of the PL spectra below 55 K shows localization anomalies. The Urbach slope, the carrier temperature, and the linewidth all consistently show the same non-monotonic behaviour that may be taken to be the signature of extrinsic effects resulting from defect-mediated localization. Due to the relatively smaller density of the localized states, we observe a strong excitation power-dependence of both the Urbach slope and the carrier temperature at low temperatures, with the excitation power dependence being the strongest at 4 K [Figure 4]. Based on these observations, we can associate a characteristic trap energy of meV (using K). We emphasize that these low temperature anomalies are also not unusual and have been systematically documented in the context of GaAs quantum wells and nitride semiconductors.[37]
In conclusion, we have established the Urbach rule for CsPbBr3 nanosheets, including the demonstration of the Urbach focus. The identification of the Urbach focus has allowed us to infer the zero-temperature bandgap renormalization due to the zero-point phonons’ contribution to the exciton-phonon interactions. The value of the renomalization energy at 33 meV is rather modest and rules out strong exciton-phonon interactions. Indeed, the excitons in this material seem to be of the Mott-Wannier type, much like those in materials like GaAs under conditions of weak-to-moderate disorder. They are trapped at low temperature and undergo a gradual localization-to-thermalization (LT) crossover.
See the Supplementary Material for sample synthesis and characterization, details about the PL measurements, importance of emission and absorption experiments in the lights of disorder landscape and Stokes shift, a discussion about whether Dow-Redfield or Toyozawa’s theory should be used to explain the electron-phonon coupling in our system, two-dimensional correlation analysis of the emission spectra, and determination of the exciton binding energy.
KM thanks Rupak Bhattacharya for many fruitful suggestions. AM thanks University Grants Commission, New Delhi, for his fellowship. BR thanks Council of Scientific and Industrial Research for his fellowship. SB thanks to the financial support from SERB under Sanction No. CRG/2020/000084 and STR/2021/000001. BB thanks Science and Engineering Research Board, Department of Science and Technology, Government of India, for the Core Research Grant (CRG/2018/003282).
References
- [1] T. Yamada, T. Handa, Y. Yamada, and Y. Kanemitsu, J. Phys. D: Appl. Phys. 54, 383001 (2021).
- [2] A. Dey, J. Ye, A. De, E. Debroye, S. K. Ha, E. Bladt, A. S. Kshirsagar, Z. Wang, J. Yin, Y. Wang, L. N. Quan, F. Yan, M. Gao, X. Li, J. Shamsi, T. Debnath, M. Cao, M. A. Scheel, S. Kumar, J. A. Steele, M. Gerhard, L. Chouhan, K. Xu, X.-G. Wu, Y. Li, Y. Zhang, A. Dutta, C. Han, I. Vincon, A. L. Rogach, A. Nag, A. Samanta, B. A. Korgel, C.-J. Shih, D. R. Gamelin, D. H. Son, H. Zeng, H. Zhong, H. Sun, H. V. Demir, I. G. Scheblykin, I. M.-Seró, J. K. Stolarczyk, J. Z. Zhang, J. Feldmann, J. Hofkens, J. M. Luther, J. P.-Prieto, L. Li, L. Manna, M. I. Bodnarchuk, M. V. Kovalenko, M. B. J. Roeffaers, N. Pradhan, O. F. Mohammed, O. M. Bakr, P. Yang, P. M.-Buschbaum, P. V. Kamat, Q. Bao, Q. Zhang, R. Krahne, R. E. Galian, S. D. Stranks, S. Bals, V. Biju, W. A. Tisdale, Y. Yan, R. L. Z. Hoye, and L. Polavarapu, ACS Nano 2021 15, 10775 (2021).
- [3] Y. Jiang, X. Wang, and A. Pan, Adv. Mater. 31, 1806671 (2019).
- [4] W. Tao, C. Zhang, Q. Zhou, Y. Zhao, and H. Zhu, Nat. Commun. 12, 1400 (2021).
- [5] B. Wu, H. Yuan, Q. Xu, J. A. Steele, D. Giovanni, P. Puech, J. Fu, Y. F. Ng, N. F. Jamaludin, A. Solanki, S. Mhaisalkar, N. Mathews, M. B.J. Roeffaers, M. Grätzel, J. Hofkens, and T. C. Sum, Nat. Commun. 10, 484 (2019)
- [6] X. Lao, W. Zhou, Y. Bao, X. Wang, Z. Yang, M. Wang and S. Xu, Nanoscale, 12, 7315, (2020).
- [7] X. Lao, Z. Yang, Z. Su, Z. Wang, H. Ye, M. Wang, X. Yaob, and S. Xu, Nanoscale 10, 9949 (2018).
- [8] K. Shibata, J. Yan, Y. Hazama, S. Chen, and H. Akiyama, J Phys. Chem. C 124, 18257–18263, (2020).
- [9] M. Sebastian, J. A. Peters, C. C. Stoumpos, J. Im, S. S. Kostina, Z. Liu, M. G. Kanatzidis, A. J. Freeman, and B. W. Wessels, Phys. Rev. B 92, 235210 (2015).
- [10] A. Miyata, A. Mitioglu, P. Plochocka, O. Portugall, J. T.-WeiWang, S. D. Stranks, H. J. Snaith, and R. J. Nicholas, Nature Phys. 11, 582–587 (2015).
- [11] Z. Yang, M. Wang, H. Qiu, X. Yao, X. Lao, S. Xu, Z. Lin, L. Sun, and J. Shao, Adv. Funct. Mater. 28, 1705908, (2018).
- [12] T. Umebayashi, K. Asai, T. Kondo, and A. Nakao, Phys. Rev. B 67, 155405 (2003).
- [13] J. Kang, and L.-W. Wang, J. Phys. Chem. Lett. 8, 489–493 (2017).
- [14] M. Ledinsky, T. Schönfeldová, J. Holovský, E. Aydin, Z. Hàjková, L. Landová, N. Neyková, A. Fejfar, and S. De Wolf, J. Phys. Chem. Lett. 10, 1368 (2019).
- [15] V. M. Caselli, Z. Wei, M. M. Ackermans, E. M. Hutter, B. Ehrler, and T. J. Savenije, ACS Energy Lett. 5, 3821 (2020).
- [16] J. Li, L. Gan, Z. Fang, H. He, and Z. Ye, J. Phys. Chem. Lett. 8, 6002 (2017).
- [17] A. Kost, H. C. Lee, Y. Zou, P. D. Dapkus, and E. Garmire, Appl. Phys. Lett. 54, 1356 (1989).
- [18] J. Dow, and D. Redfield, Phys. Rev. B 5, 594 (1972).
- [19] W. Schäfer, and M. Wegener, Semiconductor Optics and Transport Phenomena (Springer, Berlin, 2002), p. 341.
- [20] M. H. Cohen, M.-Y. Chou, E. N. Economou, S. John, and C. M. Soukoulis, IBM J. Res. Dev. 32, 82 (1988).
- [21] G. D. Cody, in Hydrogenated Amorphous Silicon, Semiconductors and Semimetals, edited by J. I. Pankove, Academic, New York, Vol. 21B, p. 11. (1984)
- [22] S. R. Johnson, and T. Tiedje, J. Appl. Phys. 78, 5609 (1995).
- [23] N. Falsini, G. Roini, A. Ristori, N. Calisi, F. Biccari, and A. Vinattieri, J. Appl. Phys. 131, 010902 (2022)
- [24] K. Mukhuti, S. Sinha, S. Sinha, and B. Bansal, Appl. Phys. Lett. 118, 162111 (2021)
- [25] B. Roy, K. Mukhuti, and Bhavtosh Bansal, J. Phys.: Condens. Matter 32, 10LT01 (2020)
- [26] R. Bhattacharya, R. Mondal, P. Khatua, A. Rudra, E. Kapon, S. Malzer, G. Döhler, B. Pal, and B. Bansal, Phys. Rev. Lett. 114, 047402 (2015).
- [27] J. M. Ziman, Models of Disorder, Cambridge University Press, Cambridge, U. K. (1979).
- [28] Y. Toyozawa, Optical Processes in Solids, Cambridge University Press, Cambridge, U. K. (2003).
- [29] G. Antonius, S. Poncé, E. Lantagne-Hurtubise, G. Auclair, X. Gonze, and M. Côté, Phys. Rev. B 92, 085137 (2015).
- [30] D. H. Fabini, G. Laurita, J. S. Bechtel, C. C. Stoumpos, H. A. Evans, A. G. Kontos, Y. S. Raptis, P. Falaras, A. V. der Ven, M. G. Kanatzidis, and R. Seshadri, J. Am. Chem. Soc. 138, 11820–11832 (2016).
- [31] R. Bhattacharya, B. Pal, and B. Bansal, Appl. Phys. Lett. 100, 222103 (2012).
- [32] G. Pettinari, A. Polimeni, and M. Capizzi, Springer-Verlag, Berlin (2012).
- [33] J. A. Peters, Z. Liu, O. Bulgin, Y. He, V. V. Klepov, M. C. De Siena, M. G. Kanatzidis, and B. W. Wessels, J. Phys. Chem. Lett. 12, 9301-9307 (2021)
- [34] J. Ramade , L. M. Andriambariarijaona, V. Steinmetz, N. Goubet, L. Legrand, T. Barisien, F. Bernardot, C. Testelin, E. Lhuillier, A. Bramati, and M. Chamarro, Appl. Phys. Lett. 112, 072104 (2018)
- [35] A. D. Wright, C. Verdi, R. L. Milot, G. E. Eperon, M. A. Pérez-Osorio, H. J. Snaith, F. Giustino, M. B. Johnston, and L. M. Herz, Nat. Commun. 7, 11755 (2016)
- [36] Z. Liu, Q. Shang, C. Li, L. Zhao, Y. Gao, Q. Li, J. Chen, S. Zhang, X. Liu, Y. Fu, and Q. Zhang, Appl. Phys. Lett. 114, 101902 (2019)
- [37] E. Runge, Solid State Physics, Academic, San Diego, Vol. 57, pp. 149–305 ( 2002),