capbtabboxtable[][\FBwidth]
Not All Errors Are Equal: Learning Text Generation Metrics using Stratified Error Synthesis
Abstract
Is it possible to build a general and automatic natural language generation (NLG) evaluation metric? Existing learned metrics either perform unsatisfactorily or are restricted to tasks where large human rating data is already available. We introduce SEScore, a model-based metric that is highly correlated with human judgements without requiring human annotation, by utilizing a novel, iterative error synthesis and severity scoring pipeline. This pipeline applies a series of plausible errors to raw text and assigns severity labels by simulating human judgements with entailment. We evaluate SEScore against existing metrics by comparing how their scores correlate with human ratings. SEScore outperforms all prior unsupervised metrics on multiple diverse NLG tasks including machine translation, image captioning, and WebNLG text generation. For WMT 20/21 En-De and Zh-En, SEScore improve the average Kendall correlation with human judgement from 0.154 to 0.195. SEScore even achieves comparable performance to the best supervised metric COMET, despite receiving no human-annotated training data. 111Code and data are available at https://github.com/xu1998hz/SEScore
1 Introduction
Text generation tasks such as translation and image captioning have seen considerable progress in the past few years Chen et al. (2015); Birch (2021). However, precisely and automatically evaluating generated text quality remains a challenge. Long-dominant n-gram-based evaluation techniques, such as BLEU Papineni et al. (2002) and ROUGE Lin (2004), are sensitive to surface-level lexical and syntactic variations, and have been repeatedly reported to not well correlate to human judgements Zhang* et al. (2020); Xu et al. (2021).
Multiple learned metrics have been proposed to better approximate human judgements. These metrics can be categorized into unsupervised and supervised methods based on whether human ratings are used. The former includes PRISM Thompson and Post (2020), BERTScore Zhang* et al. (2020), BARTScore Yuan et al. (2021), etc. The latter includes BLEURT Sellam et al. (2020), COMET Rei et al. (2020) etc.
Unsupervised learned metrics are particularly useful as task-specific human annotations of generated text can be expensive or impractical to gather at scale. While these metrics are applicable to a variety of NLG tasks Zhang* et al. (2020); Yuan et al. (2021), they tend to target a narrow set of aspects such as semantic coverage or faithfulness, and have limited applicability to other aspects, such as fluency and style, that matter to humans Freitag et al. (2021a); Saxon et al. (2021). While supervised metrics can address different attributes by modeling the conditional distribution of real human opinions, training data for quality assessment is often task- and domain-specific with limited generalizability.
We introduce SEScore, a general technique to produce nuanced reference-based metrics for automatic text generation evaluation without using human-annotated reference-candidate text pairs. Our method is motivated by the observation that a diverse set of distinct error types can co-occur in candidate texts, and that human evaluators do not view all errors as equally problematic Freitag et al. (2021a). To this end, we develop a stratified error synthesis procedure to construct (reference, candidate, score) triples from raw text. The candidates contain non-overlapping, plausible simulations of NLG model errors, iteratively applied to the input text. At each iteration, a severity scoring module isolates individual simulated errors, and assesses the human-perceived degradation in quality incurred. Our contributions are as follows: {itemize*}
SEScore, an approach to train automatic text evaluation metrics without human ratings;
A procedure to synthesize different types of errors in text at varying severity levels;
Experiments showing that SEScore is effective in a diverse set of NLG tasks including WMT 20/21, WebNLG, and image captioning, and outperforms all previous unsupervised learned metrics. It is even comparable to the best learned metric on WMT 20/21.
2 Related Work
Traditional n-gram matching based (Papineni et al., 2002; Banerjee and Lavie, 2005) and edit distance based approaches (Levenshtein, 1965; Snover et al., 2006) have proven to be limited in recognizing semantic similarity beyond the lexical level. Learned metrics Zhang* et al. (2020); Sellam et al. (2020); Yuan et al. (2021) have been proposed to align better with human judgements. We categorize these metrics as either unsupervised or supervised with respect to learning from human-annotated scores.
Unsupervised Metrics
attempt to extract features from large pretrained models. Embedding-based metrics (e.g. BERTScore Zhang* et al. (2020) and Moverscore Zhao et al. (2019)) create soft-alignments between reference and hypothesis in the embedding space. However, they are refined in the semantic coverage. Text generation-based metrics Yuan et al. (2021), use conditional probability of the generated sentence to evaluate faithfulness of the candidates. However, Freitag et al. (2021a) points out text generation evaluation can produce errors beyond semantic coverage or faithfulness (e.g. style and fluency errors), which results poor correlations to the human evaluations.
Supervised Metrics
attempt to learn through limited human-labelled severity annotations. Rei et al. (2020) trained COMET on a small set of domain-specific human ratings; this model has limited extensibility to teh general domain. BLEURT (Sellam et al., 2020) first pretrains on millions of synthetic data and then uses WMT testing data in fine-tuning the model. Unlike our fine-grained stratified error synthesis, the labels on the synthetic data are derived from prior metrics or other tasks, limiting the quality and precision of pretraining process.
3 The SEScore Approach
Given a reference text and a candidate , a metric is expected to output a score . Training such a metric model requires triples of reference-candidate-score’s. However, there are no large-scale human annotated triple data available in many tasks. We consider a general setup where large raw text corpus is available.
SEScore is trained from a pretrained language model (e.g. BERT) on synthetic triples generated from raw text. It synthesizes candidate sentences to mimic plausible errors by transforming raw input sentences multiple times. At each step, it inserts, deletes, or substitutes a random span of text. These errors are non-overlapping. It assesses the severity of the errors introduced in the transformation. This allows us to pretrain quality prediction models on corpora containing only raw text samples , enabling the use of learned quality prediction models in any text generation domain.
The process of generating from , stratified error synthesis, is so called for its incremental and multi-category nature; a stochastic perturbation function which randomly samples from a set of potential errors is recursively applied on (eq. 1) times to produce a sequence of perturbed sentences that interpolate between the raw text and the final synthetic sentence (§ 3.2).
| (1) |
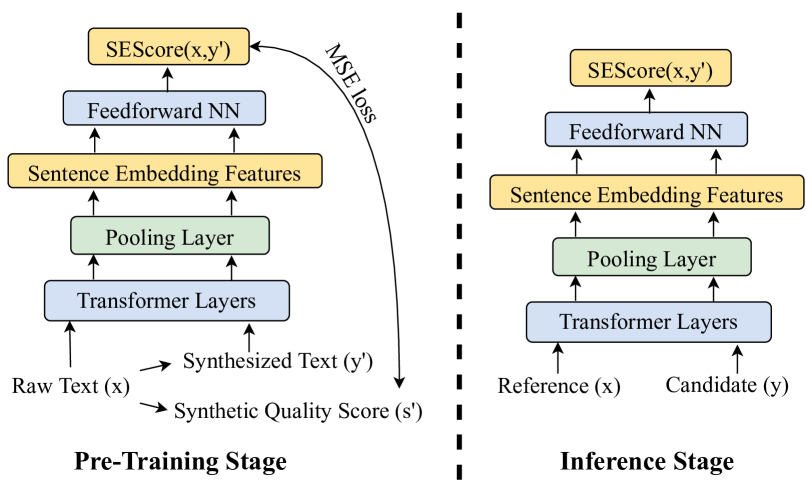
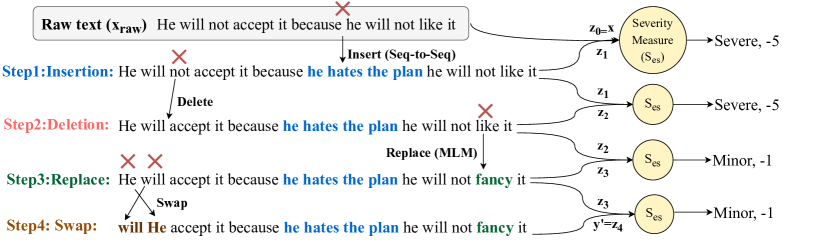
The stratum sentence sequence is then used to in the subsequent severity scoring step which uses a pairwise severity scoring function on consecutive pairs and cumulatively yield training labels (§ 3.3). A concrete example is illustrated in fig. 2. Finally, we train SEScore’s quality prediction model, ( fig. 1) using synthetic triples (§ 3.4).
| Category | MQM Description | Synthesis Procedure in SEScore | |
| Accuracy | Addition | Text includes information not present reference. | insertion using MLM or seq2seq generation |
| Omission | Text is missing content from the reference | Delete a random span of tokens | |
| Mistranslation | Text does not accurately represent the reference | Replace a random span using maksed or seq2seq generation | |
| Fluency | Punctuation | Incorrect punctuation (for locale or style) | Insertion & replacement using masked filling, and deletion |
| Spelling | Incorrect spelling or capitalization | Insertion, replacement, deletion, and Swap | |
| Grammar | Problems with grammar | Insertion, replacement, deletion, and Swap |
3.1 Background: Quality Measured by Errors
Our method is inspired by the multidimensional quality metrics (MQM) Mariana (2014); Freitag et al. (2021a). MQM is a human evaluation scheme for machine translation. It determines the quality of a translation text by manually labeling errors and their severity levels. Errors are categorized into multiple types such as accuracy and fluency. Each error type is associated with a severity level – a penalty of 5 for major error and 1 for minor error.
In table 1, we use two major error categories in MQM framework: accuracy and fluency, to classify and decide our perturbations in . There are two main motivations to simulate those errors from the table: 1) they are two major error categories in machine translations; 2) those errors are general and can be extensible to new domains. We use six techniques to simulate errors from the table 1: mask insertion/replacement with maksed language model (MLM)/seq-to-seq (seq-to-seq) language model, and N-gram word drop/swap.
3.2 Stratified Error Synthesis
Tuan et al. (2021) suggest that multiple errors could co-occur in one segment, so we construct each sentence with up to perturbations ( in experiments). At each iteration, we randomly draw one perturbation from the set of edit operations, (insertion, deletion, replacement, and swap, respectively).
Our technique is stratified so as to enable accurate evaluation of the severity at each step, and prevent subsequent errors from overwriting prior ones. To achieve this, we propose a novel stratified error synthesis algorithm. For an input sentence , with tokens, we initialize an array of length , with . Values indicate the number of tokens after the current token can be modified with the perturbation function, . Each will randomly select a start index from to to modify the text. We define an error synthesis table to keep track of the number of candidate tokens can be modified after index . will only be accepted if is greater than the span length of the perturbation. The implementation details of stratified error synthesis algorithm regarding to each edit operation is illustrated in Appendix A algorithm 1. All perturbations are recursively applied to the raw text , shown in eq. 1.
Synthesize Addition Error by Insertion ()
Given a start index, we add an additional phrase to the raw text in
two ways: a) using a MLM (e.g. BERT and RoBERTa), and b) using a seq-to-seq language model (e.g. mBART).
For the first approach, we insert a <mask> token at the given position of a sentence. Then, we use an MLM to fill the token based on its context.
We use top-k sampling (), to randomly select the filling token.
Our primary aim is to introduce semantically close sentences with all three fluency errors.
With the insertion of <mask>, we can further synthesize Addition errors.
For the second approach, we use a pre-trained seq-to-seq model (e.g. mBART) to generate a phrase given the context text, with variable length.
Synthesize Omission Error by Deletion ()
We delete a random span of tokens from a raw text sentence. The span is drawn uniformly within the token indices. The length of the span is drawn from a Poisson distribution (). Our primary aim is to mimic Omission error. However, depending on the specific words that it drops, this technique can further create Mistranslation and all Fluency errors.
Synthesize Phrasal Error by Replacement ()
Sometimes specific terms in a reference sentence are systematically misphrased in generated samples.
This is difficult to simulate.
Instead, we use either an MLM or a seq-to-seq model to replace a segment of tokens in the original text.
For the first approach, the replaced span is always a single token, which is first replaced with a <mask> token.
We then use an MLM to fill the blank similar to the insertion operation.
For the second approach, we use a denoising seq-to-seq model (e.g. mBART) to generate tokens for the mask tags.
We randomly choose the starting index of the span and draw the span length from a Poisson distribution ().
We use a denoising seq-to-seq model like mBART to synthesize fluent sentences with Addition and Mistranslation errors.
Synthesize Grammar and Other Errors by Swapping ()
We swap two random words within the span length in the sentence (). Our primary aim is to generate grammatically incorrect sentences with mismanagement of word orders, such as subject verb disagreement. It further introduces Spelling and Punctuation errors.
3.3 Assessing Severity Score
Following Freitag et al. (2021a), we consider an error severe if it alters the core meaning of the sentence. Prior study has suggested that sentence entailment is strongly correlated to semantic similarities Khobragade et al. (2019). To capture the change of semantic meaning, we define a bidirectional entailment relation such that, text entails and entails is equivalent to is semantically equivalent to . Therefore, for a given perturbation function on the sentence , we measure a bidirectional entailment likelihood of and . If after applying transformation on , remains bidirectional entailed to , we can assume that does not severely alter the semantic meaning of and therefore it is a minor error. We define the entailment likelihood, , as the probability of predicting entails . The math formulation is illustrated in eq. 2. Setting the threshold to be reaches the highest inter-rater agreement of severity measures using our validation dataset. Following Freitag et al. (2021a), we assign to severe error and to minor errors. Therefore, our range of score is . We evaluate severity at each perturbation of the sentence and cumulatively yield training label for the final synthesized sentence , .
| (2) |
3.4 Quality Prediction Model
In fig. 1, we fed both raw text (reference) and synthetic error sentence into a pre-trained language model (e.g. BERT or RoBERTa). The resulting word embeddings are average pooled to derive two sentence embeddings. Then we use the approach proposed by RUSE Shimanaka et al. (2018) to extract the two features: 1) Element-wise synthesized and reference sentence product. 2) Element-wise synthesized and reference sentence difference. Following the COMET Rei et al. (2020) implementation, the above features are concatenated into a single vector and fed into a feed-forward neural network regressor, .
However, the key distinction between our model and COMET is that we don’t use model source input during training or inference. Therefore our SEScore can generalize to other text generation tasks, without considering specific source data. The detailed architecture choice can be found in § 4.1.
4 Experiments
We conduct experiments on three tasks: machine translation, data-to-text and image captioning, to verify the utility and generalizability of SEScore. Specifically, we compare SEScore on WMT 2020 and 2021 test sets in English-to-German (En-De) and Chinese-to-English (Zh-En) with MQM labels Mariana (2014); Freitag et al. (2021a), which consists of expert-labeled scores. For data-to-text, we test SEScore on the WebNLG 2017 challenge Gardent et al. (2017a). For image captioning, we test SEScore on the COCO image captioning challenge 2015 Chen et al. (2015). We use Freitag et al. (2021a) annotated TED dataset as our development set to select the hyper-parameters in Error Synthesis Models and SEScore Metric Model. We comprehensively analyze each component of our pipeline and their contributions to the final results.
| Model Name | WMT20 (EnDe) | WMT21 (EnDe) | WMT20 (ZhEn) | WMT21 (ZhEn) | |||||
| Kendall | Pearson | Kendall | Pearson | Kendall | Pearson | Kendall | Pearson | ||
| With HL. | BLEURT | 0.229* | 0.476 | 0.052* | 0.383 | 0.218* | 0.531 | 0.078 | 0.423 |
| COMET(DA) | 0.283 | 0.633 | 0.103 | 0.650 | 0.256 | 0.628 | 0.114 | 0.452 | |
| W/o Human Labels | TER | -0.221* | 0.627* | -0.171* | -0.356 | -0.238* | -0.516* | -0.177* | -0.338 |
| BLEU | 0.112* | 0.322* | 0.010* | 0.358 | 0.120* | 0.562* | 0.030* | 0.330* | |
| ChrF | 0.163* | 0.333* | 0.030* | 0.326 | 0.151* | 0.534* | 0.042* | 0.296* | |
| BARTScore | - | - | - | - | 0.176* | 0.580 | 0.063* | 0.335* | |
| BERTScore | 0.166* | 0.260* | 0.063* | 0.322 | 0.228* | 0.549* | 0.092* | 0.362* | |
| PRISM | 0.208* | 0.219* | 0.068* | 0.198 | 0.240* | 0.505* | 0.101* | 0.352 | |
| SEScore | 0.273 | 0.706 | 0.139 | 0.629 | 0.261 | 0.684 | 0.108 | 0.501 | |
4.1 Pre-training setup
Synthetic Error Data
We use the WMT19 Barrault et al. (2019) training News Complimentary dataset Tiedemann (2012) as the raw pretraining data. It contains News articles across 16 different languages. We randomly sampled 120K sentences for English and 120K for German, then generated error synthetic sentences from them. To adopt to the text domain of WebNLG and Image captioning, we generate 30k and 40k error synthetic sentences from the text portion of the WebNLG Gardent et al. (2017b) and image captioning’s training data Chen et al. (2015). We use those data to train two separate checkpoints for WebNLG and image captioning evaluations. We discuss the effects of cross-domain evaluation in Appendix D.1.
Error Synthesis Models
We use four pretrained language models in the error synthesis process. First, we use an mBART model Liu et al. (2020) to generate a span of tokens for the <mask> positions for both insertion and replacement operations. Second, we use an XLM-RoBERTa model Conneau et al. (2020) to predict a token for <mask> using MLM’s objective for both single token insertion and single token replacement. Finally, we use RoBERTa models fine-tuned on MNLI and XNLI as our entailment classification model for English and German respectively. These two models are used to determine the bidirectional relations of a synthetic sentence and a raw text to measure the severity of the synthetic text. We set the synthesis hyperparameters , , , and . We generate all synthesized dataset on one RTX A6000 GPUs. It costs 0.5 hours to generate 10K sentences.
SEScore Metric Model.
To ensure the fair comparison and fully demonstrate the power of our pretraining data, SEScore uses the comparable model size compared to the COMET Rei et al. (2020). Specifically, we use XLM-RoBERTa Large as the backbone for our German metric model and RoBERTa Large for English metric model. We use Adam optimizer Kingma and Ba (2017) and set batch size, learning rate and dropout rate of 8, 3e-5 and 0.15 respectively. We use mean squared error to train the metric model. We select the best checkpoint based on the highest Kendall correlation on the TED validation. We include detailed training process and hyperparamters in the Appendix B.1.
4.2 Baseline Methods
For machine translation evaluation, we include three WMT baseline methods and five best performed learned metrics. They are (1) Ngram- and distance-based metrics (BLEU Papineni et al. (2002), ChrF Popović (2015) and TER Snover et al. (2006)); (2) learned metrics requiring human rating data (COMET Rei et al. (2020), BLEURT Sellam et al. (2020)); (3) learned metrics without human rating data (PRISM Thompson and Post (2020), BARTScore Yuan et al. (2021) and BERTScore Zhang* et al. (2020)). For WebNLG evaluation, we include the three baselines in prior work Gardent et al. (2017b): METEOR Banerjee and Lavie (2005), TER, BLEU, and two learned metrics MoverScore Zhao et al. (2019) and BERTScore. For image captioning, we include five baseline models in the COCO image captioning challenge 2015 Chen et al. (2015): BLEU, METEOR, ROGUE-L Lin (2004), CIDEr Vedantam et al. (2015) and CHrf. We further include BARTScore and BERTScore and one top-performing task-specific learned metric, LEIC Cui et al. (2018). For all the learned metrics with variants, we choose their checkpoints based on their paper recommendations. We discuss the details of the baseline model setups in the Appendix C.1.
4.3 Evaluation Procedure
Machine Translation Task
As WMT20’s standard practice Mathur et al. (2020), we compute the correlations of each evaluation metric to the segment- and system- level human scores, on WMT20 and WMT21, with MQM-based labels Freitag et al. (2021a). For the segment-level correlation, we adopt the Kendall correlation from WMT20 to evaluate the relative rankings between segments of the different systems. For the correlation of system-level scores, we average SEScore for all reference-candidate pairs of each machine translation system and estimate the absolute Pearson correlation to the system-level human judgement scores.
Data-to-Text Task
Following the WebNLG challenge Gardent et al. (2017b), we use Kendall correlation to evaluate the segment-level correlation. Each generated output is annotated by three aspects: semantics, grammar and fluency. Since our SEScore is the overall score of accuracy and fluency, we average three aspects of human ratings into one overall score and evaluate segment-level Kendall correlation of the SEScore to the overall human judgement score.
Image Captioning Task
Following Zhang* et al. (2020), we compute SEScore for all reference-candidate pairs of each image captioning system and average all the scores for each system to generate the system-level scores. We compute the system-level Pearson correlation with M3 system-level human judgement score in COCO image captioning challenge Chen et al. (2015). M3 human judgement measures the average correctness of the captions on a scale 1-5. The detailed task, data information and evaluation procedures are included in the Appendix C.2.
4.4 Results on Machine Translation
In table 2, we show our evaluation results on En-De and Zh-En in both WMT20 and WMT21.
English to German
We first contrast SEScore with three WMT baselines (BLEU, TER and Chrf). SEScore outperforms them significantly in both system-level Pearson and segment-level Kendall correlations. SEScore shows its superior performance over two recent unsupervised learned metrics (Bertscore and PRISM) leading by an average 8% and 7% segment-level Kendall correlation in two years’ testing sets. Compared to the supervised models, SEScore has around 4.4% improvement in the Kendall correlations at WMT20 and 8.8% at WMT21 against BLEURT. Most importantly, SEScore outperforms the SOTA supervised metric, COMET, by 3.6% in Kendall for WMT21 and 7.3% in system-level Pearson correlation.
Chinese to English
Similar to En-De, SEScore outperforms three WMT baseline models (BLEU, TER and Chrf) by the great margin in both system-level and segment-level correlations of two years’ testing sets. Compared to three strong unsupervised learned metrics, BERTScore, BARTScore and PRISM, SEScore can outperform them by 4.6% on average in Kendall correlation in WMT20 and average 2.3% in WMT21. Compared to the supervised models, we have 4.3% improvement in the Kendall correlations at WMT20 and 3% at WMT21 against BLEURT. This is significant as BLEURT is previously trained as an English-oriented metric with millions of synthetic data and 5 year’s human rating data (WMT15-19). Moreover, SEScore outperfoms the SOTA supervised COMET model for both segment-level and system-level correlation in WMT20. The remaining gaps of Kendall correlations to the COMET is within 1%.
Takeaways:
Machine translation results in En-De and Zh-En demonstrate SEScore’s superior performance to unsupervised metrics and competitive performance against supervised SOTA metrics.
4.5 Results on WebNLG Challenge
table 4 shows our segment-level Kendall correlation results for WebNLG Challenge. SEScore can outperform three baseline models (Meteor, TER and BLEU) significantly. When comparing to the learned metrics, SEScore outperforms BARTScore and MoverScore significantly by leading 8.2% and 3% improvements on Kendall correlations. Moreover, it improves the top-performing unsupervised metric, BERTScore, by 0.3%.
4.6 Results on Image Captioning Challenge
table 4 demonstrates our system-level Pearson correlation results for the COCO image captioning challenge. SEScore outperforms all task-agnostic and task-specific baseline metrics. The correctness metric in image captioning creates a challenge evaluation scenario, such that evaluating only on semantic coverage does not cover all model mistakes. Metrics including METEOR, BLEU, even BERTScore with pretrained word embeddings only yield weak or moderate correlations to the human judgements. SEScore further outperforms significantly to BERTScore with idf weights and BARTScore which covers faithfulness. Most importantly, SEScore outperforms two task-specific metcis, LEIC Cui et al. (2018) and CIDER Vedantam et al. (2015). by 6.1% and 1.8% Pearson correlations. This is a significant result, as LEIC is a trained metric that takes image as additional inputs, optimized on the COCO data distributions and CIDER is a consensus based evaluation purely used for image descriptions.
Takeaways: Results in § 4.5 and § 4.6 verify our prior assumptions that despite our synthesized error types are originated for Machine Translation tasks, they are useful and applicable to multiple domains and tasks. As benefited from the reference-only evaluation setup, our pretrained evaluation metric can correlate well to the human judgements in various text generation settings, e.g with or without requiring source data to be text.
| WebNLG | |
| Model Name | Kendall |
| METEOR | -0.388* |
| TER | -0.345* |
| BLEU | 0.289* |
| BARTScore | 0.317* |
| MoverScore | 0.369* |
| BERTScore | 0.396 |
| SEScore | 0.399 |
| COCO Image Captioning | |
| Model Name | Pearson |
| METEOR | 0.349* |
| CHrF | 0.442 |
| BERTScore | 0.459* |
| ROGUE-L | 0.589* |
| BLEU | 0.605 |
| BERTScore(Idf) | 0.644 |
| BARTScore | 0.688 |
| LEIC+ | 0.720 |
| CIDER+ | 0.763 |
| SEScore | 0.781 |
5 Quantitative Analysis
To validate the proposed SEScore training technique, we analyze the effects of data quantity, the stratified components, and synthetic error types. We include the cross-domain evaluation in the Appendix D.1. We include a detailed qualitative analysis of SEScore regarding to its robustness and limitations in Appendix E.
[] WMT20 (EnDe) WMT21 (EnDe) WMT20 (ZhEn) WMT21 (ZhEn) Stratified Components Kendall Pearson Kendall Pearson Kendall Pearson Kendall Pearson SEScore w/o synthesized error 0.129 0.204 0.004 0.457 0.180 0.569 0.044 0.364 SEScore w/o severity measures 0.249 0.549 0.103 0.608* 0.234 -0.058 0.097 0.278 SEScore 0.273 0.706* 0.139 0.629* 0.261 0.684* 0.108 0.501
5.1 Effects of the Stratified Components
To study the effects of each component, we include the SEScore w/o synthesized error 222We mean-pooled the word embeddings from pretrained models Conneau et al. (2020); Liu et al. (2019) to generate each sentence embedding and compute the cosine similarities of the sentence embeddings for evaluation. and SEScore with without severity measures 333we remove the severity scoring component in SEScore by assigning all errors to be minor, with score -1. The final score will be within 0 to -5. We use this new score labeling to pretrain a SEScore without severity measures.. In fig. 3, we demonstrate that SEScore without severity measures can still achieve the strong performance improvements over the base language model, leading average 11% and 5% in segment-level Kendall correlation at En-De and Zh-En, respectively. This result demonstrates that our incremental injection of synthetic errors can achieve high human correlations on the segment-level rankings, providing the first layer of our stratified process. However, without severity measures, SEScore can hardly determine system level ranking, indicating by weak system-level correlations in Zh-En. By adding the severity measures into our stratified pipeline, we observe a large system-level correlation improvements in both En-De and Zh-En. The segment-level Kendall correlation can be further improved by average 3% in En-De and 2% in Zh-En. This study demonstrates the effectiveness and importance of our stratified components in both segment-level and system-level correlations to human judgements.
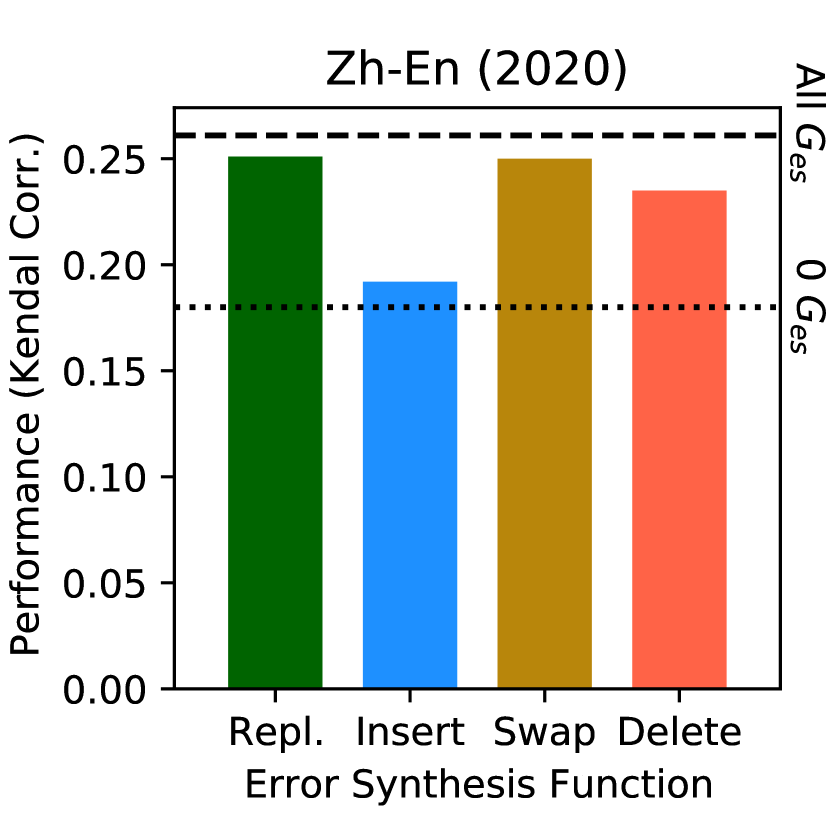
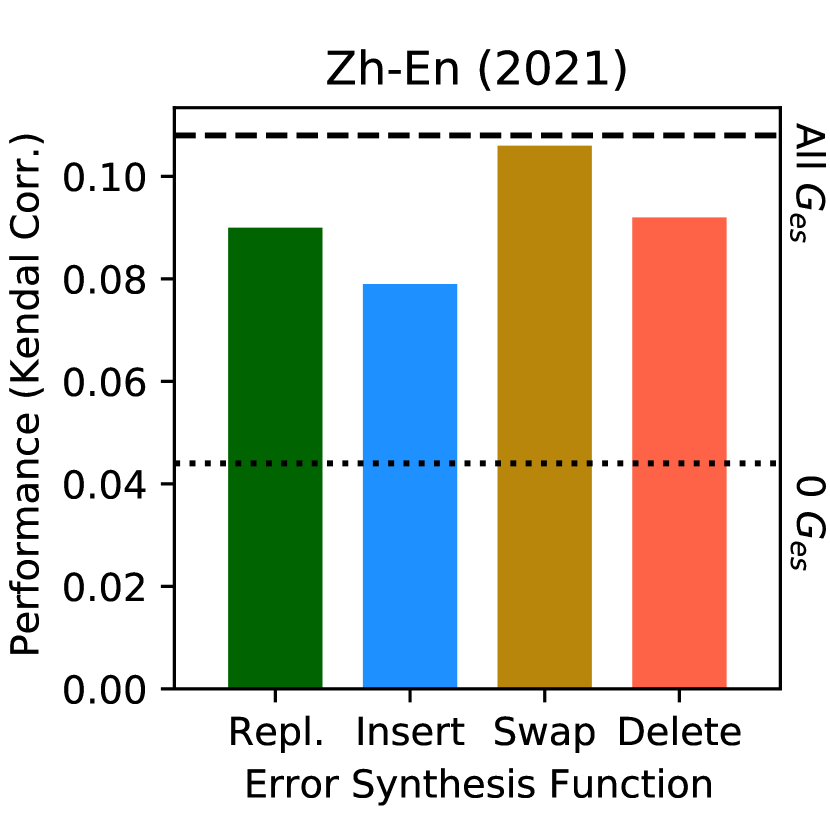
5.2 Effects of the Error Types
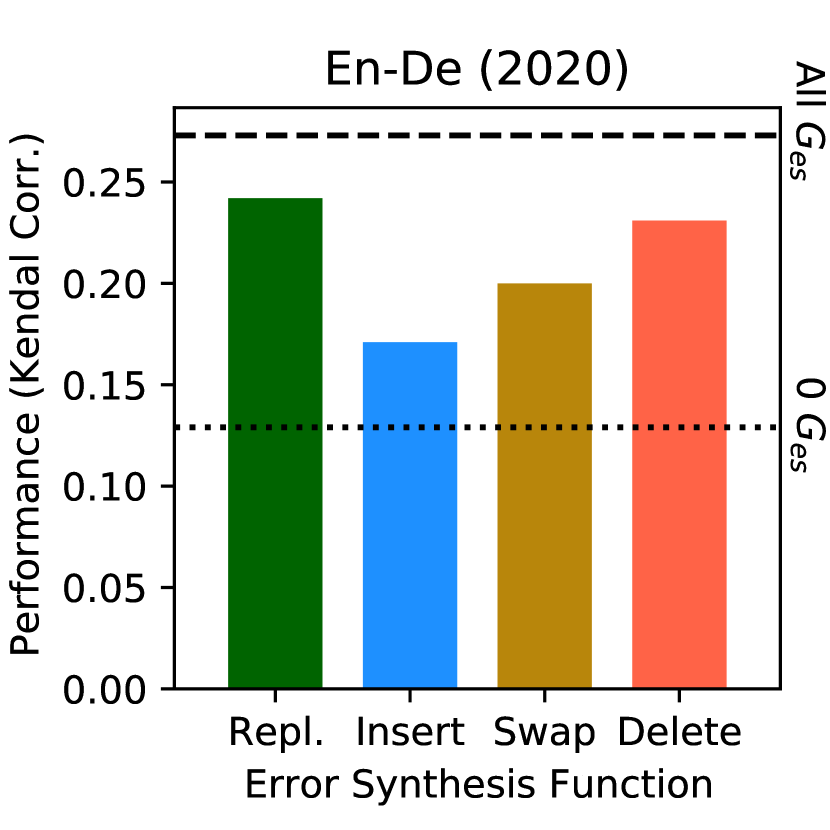
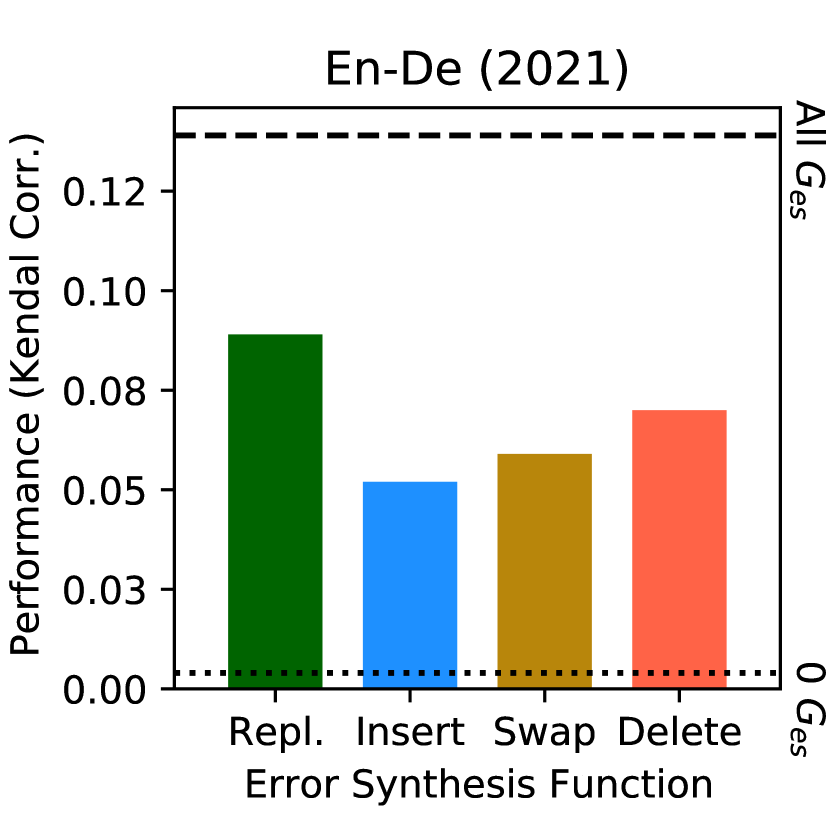
To understand each error type’s contribution to the final pretraining outcomes, we use each error synthesis function to generate separate synthesized data and use each data to train a SEScore. We benchmark SEScore’s performance with each error synthesis function in both years’ language directions. fig. 4 demonstrates that individual error synthesis function contributes to the pretrained metric differently in different language directions.
In fig. 4, from both En-De and Zh-En, we observe that all four error synthesis functions are effective as they bring up the base Kendall performance of at least 5% from En-De and at least 7% from Zh-En in both year’s testing sets. We observe that the Replace and Delete tasks are the two prominent error synthesis functions in both En-De and Zh-En. On the contrary, the insert operation has the relatively minor effects in both En-De and Zh-En. Our best assumption is that large pretrained language model tends to produce semantically close content when giving the full context of the sentence. Therefore, most of insert produced errors are relatively minor and are not able to simulate Addition error types under diverse severity levels. Lastly, we observe that the swap operation has different effects in different language directions. From Zh-En, the SEScore trained solely on Swap errors can achieve equal to or less than 1% Kendall correlations compared to the SEScore with four different operations. However, in En-De, the swap function only has moderate effects.
Takeaways: We demonstrate that all error synthetic functions can improve Kendall correlations to the human judgements. However, the effect of each error synthetic functions is related to the actual error distributions in each task. Aggregating all four error synthetic functions should be considered to achieve a general error distributions which is robust to different domains or tasks.
6 Conclusion
To conclude, we introduced SEScore, a reference-based metric for text generation evaluations. Without human labels, SEScore can outperform all unsupervised evaluation metrics and achieve competitive performance to the SOTA supervised approaches. We demonstrate that our stratified error synthesis approach makes model aware of individual errors with different severity levels, achieving high correlation to the human judgements.
7 Acknowledgements
This work was supported by the National Science Foundation award #2048122. The views expressed are those of the author and do not reflect the official policy or position of the US government. We thank the Robert N.Noyce Trust for their generous gift to the University of California via the Noyce initiative.
8 Ethics and Limitations
Our qualitative analysis in Appendix E highlights three main limitations in the SEScore framework. First, we observe that it is difficult for SEScore to detect punctuation errors. As they are not represented in the entailment data distributions. Second, SEScore disagrees with human judgements when human annotations contain uncertainties (e.g., high inter-rater disagreement on the severity of an error). Perhaps in these cases human opinions are too inherently subjective to model well in the first place. Regardless, SEScore is not likely to produce rankings exactly matching human annotators when human rating difference is less than 1. Lastly, SEScore disagrees more heavily with human annotators on the quality of long generated text passages. We assumed that this is due to our limited sentence embedding space while individual errors will be mitigated by the long sentence contexts. Most importantly, we observed that those three limitations are also commonly occurred in the three top-performing baseline metrics (BERTScore Zhang* et al. (2020), PRISM Thompson and Post (2020) and COMET Rei et al. (2020)), motivating more future works to investigate on those issues. We demonstrate SEScore’s superior performance over other baselines. However, SEScore can not be used to replace human judgements. We will support two frameworks of SEScore: SEScore with and without severity measures. SEScore with severity measures can support up to 100 languages that XLM-Roberta pretrained on. SEScore with severity measures currently supports 15 languages: English, French, Spanish, German, Greek, Bulgarian, Russian, Turkish, Arabic, Vietnamese, Thai, Chinese, Hindi, Swahili and Urdu. All code and synthesized data samples will be publicly released following deanonymization.
References
- Banerjee and Lavie (2005) Satanjeev Banerjee and Alon Lavie. 2005. METEOR: An automatic metric for MT evaluation with improved correlation with human judgments. In Proceedings of the ACL Workshop on Intrinsic and Extrinsic Evaluation Measures for Machine Translation and/or Summarization, pages 65–72, Ann Arbor, Michigan. Association for Computational Linguistics.
- Barrault et al. (2019) Loïc Barrault, Ondřej Bojar, Marta R. Costa-jussà, Christian Federmann, Mark Fishel, Yvette Graham, Barry Haddow, Matthias Huck, Philipp Koehn, Shervin Malmasi, Christof Monz, Mathias Müller, Santanu Pal, Matt Post, and Marcos Zampieri. 2019. Findings of the 2019 conference on machine translation (WMT19). In Proceedings of the Fourth Conference on Machine Translation (Volume 2: Shared Task Papers, Day 1), pages 1–61, Florence, Italy. Association for Computational Linguistics.
- Birch (2021) Alexandra Birch. 2021. Neural machine translation 2020, by philipp koehn, cambridge, cambridge university press, isbn 978-1-108-49732-9, pages 393. Natural Language Engineering, 27(3):377 – 378.
- Bird et al. (2009) Steven Bird, Ewan Klein, and Edward Loper. 2009. Natural language processing with Python: analyzing text with the natural language toolkit. " O’Reilly Media, Inc.".
- Chen et al. (2015) Xinlei Chen, Hao Fang, Tsung-Yi Lin, Ramakrishna Vedantam, Saurabh Gupta, Piotr Dollár, and C. Lawrence Zitnick. 2015. Microsoft coco captions: Data collection and evaluation server. ArXiv, abs/1504.00325.
- Conneau et al. (2020) Alexis Conneau, Kartikay Khandelwal, Naman Goyal, Vishrav Chaudhary, Guillaume Wenzek, Francisco Guzmán, Edouard Grave, Myle Ott, Luke Zettlemoyer, and Veselin Stoyanov. 2020. Unsupervised cross-lingual representation learning at scale.
- Cui et al. (2018) Yin Cui, Guandao Yang, Andreas Veit, Xun Huang, and Serge Belongie. 2018. Learning to evaluate image captioning.
- Freitag et al. (2021a) Markus Freitag, George Foster, David Grangier, Viresh Ratnakar, Qijun Tan, and Wolfgang Macherey. 2021a. Experts, errors, and context: A large-scale study of human evaluation for machine translation.
- Freitag et al. (2021b) Markus Freitag, Ricardo Rei, Nitika Mathur, Chi kiu Lo, Craig Stewart, George Foster, Alon Lavie, and Ondrej Bojar. 2021b. Results of the wmt21 metrics shared task: Evaluating metrics with expert-based human evaluations on ted and news domain. In Proceedings of the Sixth Conference on Machine Translation, pages 733–774, Online.
- Gardent et al. (2017a) Claire Gardent, Anastasia Shimorina, Shashi Narayan, and Laura Perez-Beltrachini. 2017a. Creating training corpora for nlg micro-planners. In Proceedings of the 55th Annual Meeting of the Association for Computational Linguistics (Volume 1: Long Papers), pages 179–188. Association for Computational Linguistics.
- Gardent et al. (2017b) Claire Gardent, Anastasia Shimorina, Shashi Narayan, and Laura Perez-Beltrachini. 2017b. The WebNLG challenge: Generating text from RDF data. In Proceedings of the 10th International Conference on Natural Language Generation, pages 124–133, Santiago de Compostela, Spain. Association for Computational Linguistics.
- Khobragade et al. (2019) Rakesh Khobragade, Heaven Patel, Anand Namdev, Anish Mishra, and Pushpak Bhattacharyya. 2019. Machine translation evaluation using bi-directional entailment.
- Kingma and Ba (2017) Diederik P. Kingma and Jimmy Ba. 2017. Adam: A method for stochastic optimization.
- Levenshtein (1965) Vladimir I. Levenshtein. 1965. Binary codes capable of correcting deletions, insertions, and reversals. Soviet physics. Doklady, 10:707–710.
- Lin (2004) Chin-Yew Lin. 2004. ROUGE: A package for automatic evaluation of summaries. In Text Summarization Branches Out, pages 74–81, Barcelona, Spain. Association for Computational Linguistics.
- Liu et al. (2020) Yinhan Liu, Jiatao Gu, Naman Goyal, Xian Li, Sergey Edunov, Marjan Ghazvininejad, Mike Lewis, and Luke Zettlemoyer. 2020. Multilingual denoising pre-training for neural machine translation.
- Liu et al. (2019) Yinhan Liu, Myle Ott, Naman Goyal, Jingfei Du, Mandar Joshi, Danqi Chen, Omer Levy, Mike Lewis, Luke Zettlemoyer, and Veselin Stoyanov. 2019. Roberta: A robustly optimized bert pretraining approach. ArXiv, abs/1907.11692.
- Mariana (2014) Valerie Ruth Mariana. 2014. The multidimensional quality metric (mqm) framework: A new framework for translation quality assessment.
- Mathur et al. (2020) Nitika Mathur, Johnny Wei, Markus Freitag, Qingsong Ma, and Ondřej Bojar. 2020. Results of the WMT20 metrics shared task. In Proceedings of the Fifth Conference on Machine Translation, pages 688–725, Online. Association for Computational Linguistics.
- Papineni et al. (2002) Kishore Papineni, Salim Roukos, Todd Ward, and Wei-Jing Zhu. 2002. Bleu: a method for automatic evaluation of machine translation. In Proceedings of the 40th annual meeting of the Association for Computational Linguistics.
- Popović (2015) Maja Popović. 2015. chrF: character n-gram F-score for automatic MT evaluation. In Proceedings of the Tenth Workshop on Statistical Machine Translation, pages 392–395, Lisbon, Portugal. Association for Computational Linguistics.
- Rei et al. (2020) Ricardo Rei, Craig Stewart, Ana C Farinha, and Alon Lavie. 2020. COMET: A neural framework for MT evaluation. In Proceedings of the 2020 Conference on Empirical Methods in Natural Language Processing (EMNLP), pages 2685–2702, Online. Association for Computational Linguistics.
- Sai et al. (2021) Ananya B. Sai, Tanay Dixit, Dev Yashpal Sheth, Sreyas Mohan, and Mitesh M. Khapra. 2021. Perturbation checklists for evaluating nlg evaluation metrics. In Proceedings of the Conference on Empirical Methods in Natural Language Processing (EMNLP).
- Saxon et al. (2021) Michael Saxon, Sharon Levy, Xinyi Wang, Alon Albalak, and William Yang Wang. 2021. Modeling disclosive transparency in NLP application descriptions. In Proceedings of the 2021 Conference on Empirical Methods in Natural Language Processing, pages 2023–2037, Online and Punta Cana, Dominican Republic. Association for Computational Linguistics.
- Sellam et al. (2020) Thibault Sellam, Dipanjan Das, and Ankur P Parikh. 2020. Bleurt: Learning robust metrics for text generation. In Proceedings of ACL.
- Shimanaka et al. (2018) Hiroki Shimanaka, Tomoyuki Kajiwara, and Mamoru Komachi. 2018. RUSE: Regressor using sentence embeddings for automatic machine translation evaluation. In Proceedings of the Third Conference on Machine Translation: Shared Task Papers, pages 751–758, Belgium, Brussels. Association for Computational Linguistics.
- Snover et al. (2006) Matthew Snover, Bonnie Dorr, Rich Schwartz, Linnea Micciulla, and John Makhoul. 2006. A study of translation edit rate with targeted human annotation. In Proceedings of the 7th Conference of the Association for Machine Translation in the Americas: Technical Papers, pages 223–231, Cambridge, Massachusetts, USA. Association for Machine Translation in the Americas.
- Thompson and Post (2020) Brian Thompson and Matt Post. 2020. Automatic machine translation evaluation in many languages via zero-shot paraphrasing. In Proceedings of the 2020 Conference on Empirical Methods in Natural Language Processing (EMNLP), Online. Association for Computational Linguistics.
- Tiedemann (2012) Jörg Tiedemann. 2012. Parallel data, tools and interfaces in opus. In Proceedings of the Eight International Conference on Language Resources and Evaluation (LREC’12), Istanbul, Turkey. European Language Resources Association (ELRA).
- Tuan et al. (2021) Yi-Lin Tuan, Ahmed El-Kishky, Adithya Renduchintala, Vishrav Chaudhary, Francisco Guzmán, and Lucia Specia. 2021. Quality estimation without human-labeled data. In Proceedings of the 16th Conference of the European Chapter of the Association for Computational Linguistics: Main Volume, pages 619–625.
- Vedantam et al. (2015) Ramakrishna Vedantam, C. Lawrence Zitnick, and Devi Parikh. 2015. Cider: Consensus-based image description evaluation.
- Xu et al. (2021) Wenda Xu, Michael Saxon, Misha Sra, and William Yang Wang. 2021. Self-supervised knowledge assimilation for expert-layman text style transfer.
- Yuan et al. (2021) Weizhe Yuan, Graham Neubig, and Pengfei Liu. 2021. Bartscore: Evaluating generated text as text generation. ArXiv, abs/2106.11520.
- Zhang* et al. (2020) Tianyi Zhang*, Varsha Kishore*, Felix Wu*, Kilian Q. Weinberger, and Yoav Artzi. 2020. Bertscore: Evaluating text generation with bert. In International Conference on Learning Representations.
- Zhao et al. (2019) Wei Zhao, Maxime Peyrard, Fei Liu, Yang Gao, Christian M. Meyer, and Steffen Eger. 2019. Moverscore: Text generation evaluating with contextualized embeddings and earth mover distance. In Proceedings of the 2019 Conference on Empirical Methods in Natural Language Processing, Hong Kong, China. Association for Computational Linguistics.
Appendix A Algorithm Details
Appendix B Implementation Details of the Pretraining Pipeline
This section provides the implementation details for both error synthesis models and SEScore metric model.
B.1 SEScore Metric Model
The feed-forward hidden dimensions are 2048 and 1024. We use tanh as our activation function. The training process takes 1, 3, 2 and 1 epoches for machine translation Zh-En, machine translation En-De, WebNLG and image captioning, respectively.
Appendix C Experiments-Supplementary Material
C.1 Details about the Baseline Models
For all model variants, we choose each model based on two criteria: their paper recommendations and comparable model size to SEScore.
For BERTScore Zhang* et al. (2020), we follow its model recommendation by using roberta-large for English texts and bert-base-multilingual-cased for German texts. For all BERTScore in the paper, we report their F1 scores. For BLEURT Sellam et al. (2020), we use BLEURT-Large (Max token 128, 24 layers and 1024 hidden units, comparable size to SEScore) for English texts and BLEURT-20-D12 for German texts. For COMET Rei et al. (2020), we choose their best checkpoint wmt20-comet-da (exactly the same model size to SEScore) to evaluate its performance. We use bart-large-cnn to evaluate BARTScore Yuan et al. (2021)’s performance. We NLTK Bird et al. (2009) library to implement BLEU Papineni et al. (2002), METEOR Banerjee and Lavie (2005), CHrF Popović (2015) and ROUGE-L Lin (2004). We report LEIC Cui et al. (2018) and CIDEr Vedantam et al. (2015)’s performance through prior study Cui et al. (2018).
C.2 Details about the Evaluation Procedures and Test Data Information
Machine Translation Task
We use WMT20 and WMT21 Freitag et al. (2021b) ’s testing sets (Newtest2020 and Newtest2021), with mqm-based expert labels, as our main evaluation corpus. WMT20 (Chinese English) contains 2000 segments across 155 documents and WMT (English German) contains 1418 segments across 130 documents, respectively. WMT21 (Chinese English) contains 1948 segments and WMT21 (English German) contains 1002 segments, respectively. There are two types of human judgement scores: Segment-level and System-level scores. Segment-level human judgement score assigns a single score to each reference-candidate pair. System-level human judgement score assigns a single score to each system based on all {reference, system output} pairs. We follow the WMT20’s standard practice to evaluate metric performance using both system-level and segment-level correlation.
For system-level evaluation, we average SEScore for all reference-candidate pairs of each machine translation system and estimate the absolute Pearson correlation to the System-level human judgement scores. Freitag et al. (2021b) annotated top 10, 10, 17 and 15 top performing systems of En-De and Zh-En in Newtest2020 and En-De and Zh-En in Newtest2021, respectively.
For segment-level evaluation, we adopt the Kendall correlation from WMT20 Mathur et al. (2020) to evaluate the relative rankings between segments of the different systems (See Eqn 3). Following the prior study’s suggestion Freitag et al. (2021a), we use the absolute threshold between two segment scores to determine the relative rankings of both En-De and Zh-En. To prepare all the relative ranking pairs for Kendall correlation, we removed all the pairs which have the exactly same annotations and cleaned erroneous texts. In the end, we have 76,087 pairs from Zh-En and 54405 pairs from En-De in Newtest2020 and 38758 pairs from En-De and 52498 pairs from Zh-En in Newtest2021.
The Kendall’s Tau-like formulation is defined as following:
| (3) |
where Concordant indicates the number of the correct predictions in the pairwise ranking and Discordant indicates the number of the misrankings.
Data-to-Text Task
The WebNLG dataset Gardent et al. (2017b) consists a set of data extracted from DBpedia and requires systems to map entities (e.g., buildings, cities, artiests) to text. We use 9 submissions for WebNLG challenge. Each system generates 223 outputs. In total, we have 4,677 output sentences. Following the WebNLG challenge Gardent et al. (2017b), we use Kendall correlation to evaluate the relative rankings between segments of the different systems. From combinations of rankings and data cleaning, we obtain 7725 relative ranking pairs. Each generated output is evaluated by three aspects: semantics, grammar and fluency. Since our SEScore is the overall score of accuracy and fluency, we average three aspects of human ratings into one overall score and evaluate segment-level Kendall correlation of the SEScore to the overall human judgement score. The Kendall ’s formulation is shown in Eqn 3.
Image Captioning Task
COCO 2015 Captioning Challenge Chen et al. (2015) consists of the human judgements from the 11 submission entries 444There are 15 submission entries in the COCO 2015 Captioning Challenge Chen et al. (2015). However, 3 entries did not submit their validation outputs and 2 systems have the identical validation outputs. Therefore, we use the submissions from the 11 entries. Following the prior study Cui et al. (2018); Zhang* et al. (2020), we perform our experiments on the COCO validation set, as we do not have access to COCO test set where human judgements were performed. Using the findings of the prior works Cui et al. (2018); Zhang* et al. (2020), we argue that the human judgements on the validation set are sufficiently close to the ones on the testing set.
Appendix D Quantitative Analysis
D.1 Effects of the Cross Domain Evaluation
As domain shifts have been repeatedly reported by the previous studies Sellam et al. (2020); Yuan et al. (2021), we conduct experiments to study SEScore before and after domain adaptation in WebNLG and image captioning. In Table 5, due to the close data distribution and error types in WebNLG and machine translation, we find that SEScore pretrained on machine translation error synthetic data can achieve strong cross-domain performance in WebNLG and competitive to in-domain pretrained variant. However, when larger domain difference presents between machine translation and image captioning, domain adaptation plays a major role by leading metric from no correlation of cross-domain performance to high correlation to human judgements. This finding suggests that our domain adaptation strategy is effective in adapting synthetic error sentences into different domains cross several NLG tasks. This technique can provide major benefits in training a powerful learned metrics in narrowed domain, e.g low resource language of machine translation.
[] Task WebNLG () COCO () Cross-domain Performance 0.396 -0.0428 In-domain Pretraining 0.399 0.781
Appendix E Qualitative Analysis
We study the outputs of three best performing baseline models (BERTScore, PRISM, COMET) and SEScore on WMT20 Chinese-to-English. Ideally, the rankings produced by the automatic evaluation metrics should be similar to the rankings assigned by the human score.
E.1 Robustness Analysis
Table 7 shows examples where SEScore disagree largely to the baseline models (BERTScore and PRISM) about the pairwise rankings. We observe that SEScore is effective on distinguishing pairs, which are differed on only one minor error, demonstrated at case No.1 in Table 7, BERTScore is extremely vulnerable in such cases, since BERTScore’s approach relies largely on the overall semantic coverages of the word embeddings. Minor mistake, like inappropriate use of "subscribers" is hard to reflect to in its overall score. We observe the similar shortcomings in PRISM and COMET. We investigate the robustness of the word order for all automatic evaluation metrics (Case No.2). Similar to the previous findings Sai et al. (2021), BERTScore suffers greatly when word order is shuffled and fails to capture the shifts in semantic meanings. All PRISM, COMET and SEScore are able to give the correct rankings. Case No.3 and No.4 demonstrate the metrics’ capabilities in distinguishing the severe and minor errors. For example, in "Worse" sentence of case No.3, although "Chinese citizens are becoming more and more convenient to apply for visas " shares a lot word coverage to the reference, it completely alters the sentence meaning. According to the MQM-based human evaluation criteria Freitag et al. (2021a), this is a severe error and should be labeled as -5. However, due to their evaluation criteria, both PRISM and BERTScore are incapable in distinguishing such differences. In this analysis, we demonstrate qualitatively that SEScore’s superior performance over unsupervised top-performing metrics (BERTScore and PRISM) and comparative performance to the SOTA supervised metric COMET. Moreover, SEScore demonstrates its better score alignments to the human judgements against other metrics. Its scores are directly interpretable under MQM expert-based human evaluation framework Freitag et al. (2021a).
E.2 Limitations
Table 8 shows examples where SEScore disagrees with human judgements about the pairwise rankings. We observe that SEScore find it difficult to detect punctuation errors. For example, SEScore fails to correctly rank No.1 where "Worse" example’s punctuation has higher severity error. Second, SEScore disagrees with human judgements when human labels contains uncertainties (Human annotators do not have the agreements on the severity measures), indicating by No.2 and No.3. With the close severity differences (<1 human rating difference), SEScore is not likely to produce rankings exactly matching human annotators. Lastly, for the long text generation with more than 100 words (No.4), we observe that SEScore fails to produce correct rankings or align to the human judgements. We assumed that this is due to our limited sentence embedding space while individual errors will be mitigated by its long sentence contexts. Moreover, we observed that those three limitations are also commonly occurred in the three top-performing baseline metrics (BERTScore, PRISM and COMET), motivating more future works to investigate on those issues.
BERT- SEScore No. Reference Model Outputs Category Score PRISM COMET (Ours) Human 1 However, Boston Dynamics pointed out that Spot has now entered mass production, and most of its subscribers were construction and energy companies. However, Boston Dynamics Technology pointed out that Spot has entered the stage of mass production, and most of the buyers are construction and energy operators. Better 0.960 -1.410 0.282 -4.435 -4.333 1 However, Boston Power Technology pointed out that Spot has now entered the stage of mass production, and most of the subscribers are construction and energy companies. Worse 0.964 -0.975 0.695 -5.934 -6.000 2 said the person mentioned above. The above-mentioned person said. Better 0.901 -1.345 0.308 -2.112 -2.000 2 The person mentionedThe above said. Worse 0.922 -2.921 -0.650 -5.287 -5.333 3 In addition to visa-free and visa-on-arrival arrangements, it is becoming more convenient for Chinese citizens to apply for visas, and the procedures are becoming simpler. In addition to visa exemption, landing visavisa and other arrangements, it is more and more convenient for Chinese citizens to apply for visas and the procedures are more and more simplified. Better 0.939 -1.213 0.808 -1.827 -1.733 3 In addition to visa-free and visa-on-arrival arrangements, Chinese citizens are becoming more and more convenient to apply for visas, and their procedures are becoming more and more simplified. Worse 0.976 -0.675 0.576 -6.301 -6.667 4 The mobile phone client highlights the artificial intelligence voice function, adapts to the trend of mobile transmission, and provides users with the carry-on “the Story of China” players. The mobile app features AI speech recognition in accordance with the trend of mobile communication and provides users with a portable "China Story" player. Better 0.921 -2.590 0.910 -0.046 -1.700 4 Mobile phone clients highlight the voice function of artificial intelligence, adapt to the trend of mobile communication, and provide users with portable "China Good Story" players. Worse 0.938 -1.513 0.646 -5.004 -5.700 Table 7: Example sentences in 4 relative ranking pairs assigned by BERTScore(F1), PRISM, COMET, SEScore and Human. We use “Better" and “Wose" to indicate the model outputs with higher and lower human ratings, respectively. We include all metric outputs and human labels on the right side of the Table. Our SEScore shows its strong correlation to the human judgements while unsupervised baseline models disagree with human ratings significantly. We bold the metric results which produce the correct pairwise rankings. We also underline the error spans in each model output.
BERT- SEScore No. Reference Model Outputs Category Score PRISM COMET (Ours) Human 1 The Asian Future section includes three Chinese films There are 3 Chinese-language films in the “Asian Future” unit. Better 0.912 -2.636 0.434 -3.120 -0.033 1 “Future of Asia” unit includes three Chinese films. Worse 0.922 -2.201 0.134 -2.996 -2.433 2 In order to prevent the risk of farmers losing land, various methods are adopted such as preferred stock, rent before stock, and repurchasing. In order to prevent the risk of farmers losing their land, in practice, methods such as preferred shares, first lease and then share repurchase have been produced. Better 0.950 -1.961 0.586 -3.912 -5.033 2 In order to prevent the risk of farmers losing their land, in practice, methods such as preferred stock, first lease, second share, and repurchase have emerged. Worse 0.955 -1.797 0.652 -3.178 -5.667 3 Self-driving development in China will become more competitive. China’s self-driving development competition may become more intense. Better 0.933 -2.370 0.714 -1.635 -1.000 3 The competition in China’s self-driving development may become more intense. Worse 0.937 -2.130 0.756 -1.228 -1.667 4 To celebrate the 70th Anniversary of the Founding of the People’s Republic of China and the 20th Anniversary of the Establishment of the Macao Special Administrative Region, the IAM will organize a special event of public guided visit on the subject of at the Food Information Station on the first floor of Youhan Hawker Building every Wednesday … (144 more words) To celebrate the 70th anniversary of the founding of the People ’ s Republic of China and the 20th anniversary of the establishment of the Macao Special Administrative Region, the Urban Services Department will conduct a special food safety public guided tour at the Food Information Station on the first floor of the Youhan Hawker Building from October to December at 3: 30 pm on Wednesdays …(113 more words) Better 0.920 -2.386 0.300 -3.799 -15.40 4 To celebrate the seventieth anniversary of the founding of the People’s Republic of China and the twentieth anniversary of the founding of the Macao Special Administrative Region, the Municipal Department will, from October to December, at 3: 30 p.m. every Wednesday …(130 more words) Worse 0.925 -2.360 0.316 -3.617 -25.00 Table 8: Example sentences in 4 relative ranking pairs assigned by BERTScore(F1), PRISM, COMET, SEScore and Human. We use “Better" and “Wose" to indicate the model outputs with higher and lower human ratings, respectively. We include all metric outputs and human labels on the right side of the Table. This table demonstrates some examples where SEScore and human judgement disagree about the ranking. We bold the metric results which produce the correct pairwise rankings. We also underline the error spans in each model output.