Revisiting GeV-scale annihilating dark matter with the AMS-02 positron fraction
Abstract
Antimatter cosmic-rays are used to probe new phenomena in physics, including dark matter annihilation. We use the cosmic-ray positron fraction spectrum by the Alpha Magnetic Spectrometer, to search for such an annihilation signal in the Galaxy. We focus on dark matter with mass between 5 and 120 GeV, producing high-energy electrons and positrons. In these cosmic-ray energies the interplay of multiple astrophysical sources and phenomena, makes this search highly sensitive to the underlying astrophysical background assumptions. We use a vast public library of astrophysical models for the cosmic-ray positron fraction background, to derive robust upper limits on the dark matter’s annihilation cross section for a number of annihilation channels. This library accounts for different types of cosmic-ray sources and uncertainties on their distribution in space and time. Also, it accounts for uncertainties on those sources’ output, their injected into the interstellar medium cosmic-ray spectra and for uncertainties on cosmic-ray propagation. For any given dark matter particle mass and annihilation channel, upper limits on the annihilation cross section are given by bands that stretch a full order of magnitude in its value. Our work provides weaker limits compared to earlier results, that are however robust to all the relevant astrophysical uncertainties. Between 5 and 15 GeV, we find indications for a possible excess flux of cosmic-ray electrons and positrons. That excess is found for most, but not all of our astrophysical background parameter space, and its significance can vary appreciably. Further scrutiny is necessary to improve the understanding of these lower energy cosmic rays. Finally, we note that even if an excess signal is found in these energies, the current background uncertainties do not allow us to accurately deduce its underlying particle properties.
I Introduction
Dark matter has been observed in a variety of astrophysical systems through its gravitational impact, in scales from as small as dwarf galaxies to as large as colliding galaxy clusters Simon and Geha (2007); Simon (2019); Willman et al. (2005a, b); Salucci (2019); Catena and Ullio (2010); Iocco et al. (2011); Pato et al. (2015); Bovy and Tremaine (2012); Allen et al. (2011); Desjacques et al. (2018); Clowe et al. (2006); Brownstein and Moffat (2007). In addition, through detailed measurements of the cosmic microwave background (CMB), we know that dark matter accounts for about of the critical density in the universe, corresponding to about of its matter Aubourg et al. (2015); Carlstrom et al. (2002); Cooke et al. (2018); Aghanim et al. (2020); Schöneberg et al. (2019). Furthermore, accurate measurements probing Big Bang nucleosynthesis, the evolution of structures in the universe, observations on the mass distribution of different gravitationally collapsed structures and observations of the Layman-alpha forest, set a strong preference for what is referred to as “cold dark matter” Iocco et al. (2009); Pospelov and Pradler (2010); Cyburt et al. (2016); Cooke et al. (2018); Cuoco et al. (2004); White and Frenk (1991); Tollerud et al. (2008); Busca et al. (2013); Aubourg et al. (2015); Kravtsov and Borgani (2012); Mantz et al. (2010); Desjacques et al. (2018); Hernquist et al. (1996); Garzilli et al. (2021). However, the nature of dark matter remains a puzzle, with its mass ranging from eV to as large as Kobzarev et al. (1966); Carr and Hawking (1974); Meszaros (1974); Carr (1975); Weinberg (1978); Wilczek (1978); Preskill et al. (1983); Dine and Fischler (1983); Abbott and Sikivie (1983); Berezhiani et al. (1996); Svrcek and Witten (2006); Strassler (2006); Hooper and Zurek (2008); Arkani-Hamed and Weiner (2008); Hall et al. (2010); Feng (2010); Graham et al. (2015); Bertone and Hooper (2018); Hochberg et al. (2014, 2015); Drewes et al. (2017); Kahn et al. (2017); Bird et al. (2016); Carr et al. (2016); Battaglieri et al. (2017).
One class of dark matter candidates includes weakly interacting massive particles (WIMPs), that were thermally produced in the early universe through approximately electroweak scale interactions with Standard Model particles and a mass very approximately of GeV - TeV Feng (2010); Steigman et al. (2012); Bertone and Hooper (2018); Roszkowski et al. (2018); Griest and Kamionkowski (1990). In this paper, we focus on the lower end of that mass range, probing dark matter with mass from 5 GeV and up to 120 GeV. For such dark matter particles we constrain the annihilation cross section they may have to leptons and to bottom quarks. Bottom quarks would be the prominent annihilation product for dark matter in that mass range, if dark matter couples to the Higgs boson Gunion et al. (2000). These dark matter masses are interesting to search for, also because excesses in gamma-rays Goodenough and Hooper (2009); Vitale and Morselli (2009); Hooper and Goodenough (2011); Hooper and Linden (2011); Gordon and Macias (2013); Daylan et al. (2016); Calore et al. (2015a, b); Abazajian et al. (2014); Ajello et al. (2016); Di Mauro (2021); Cholis et al. (2022) and in cosmic-ray antiprotons Cuoco et al. (2016); Cui et al. (2017); Cholis et al. (2019); Cuoco et al. (2019) have been claimed to be compatible with WIMPs in that mass range. We use the most recent measurements of the cosmic-ray positron fraction, i.e. the ratio of the positron flux over the electron plus positron flux, versus those particle’s energy; made by the Alpha Magnetic Spectrometer (AMS-02) onboard the International Space Station Aguilar et al. (2021, 2019a).
Over the last decades antimatter cosmic-ray measurements have been used to probe possible dark matter signals Bergstrom et al. (1999); Hooper et al. (2004); Profumo and Ullio (2004); Bringmann and Salati (2007); Pato et al. (2010). Such cosmic rays are produced from rare inelastic collisions between cosmic-ray nuclei with the interstellar medium (ISM) gas and are commonly referred to as secondary cosmic rays. Primary cosmic rays are instead accelerated in supernova remnant (SNR) environments. A hypothetical dark matter particle in the GeV-TeV mass scale annihilating (or decaying) and producing among other byproducts antimatter cosmic rays, may give a detectable additional flux in measurements of such particles. This is the focus of this work. Dark matter particles producing cosmic-ray positrons could cause a feature in the positron flux and positron fraction. The qualities of such a feature, depend on the dark matter particle’s mass, annihilation cross section and channel, i.e. the fist generation of Standard Model particles produced from the annihilation event. Dark matter originated features may be as small as a localized in energy, to give a few bump on the positron fraction, or as wide in energy and large in amplitude as the entire rising above 5 GeV positron fraction spectrum.
Inversely, using the AMS-02 positron fraction’s relatively smooth spectrum, one can set upper limits on the annihilation cross section of dark matter particles. That is done for a range of masses and a variety of annihilation channels Bergstrom et al. (2013); Ibarra et al. (2014); John and Linden (2021). This is the main aim of this paper.
The origin of the rising above 5 GeV positron fraction spectrum that was first measured by the Payload for Antimatter Matter Exploration and Light-nuclei Astrophysics (PAMELA) satellite Adriani et al. (2009, 2013), then confirmed by the Fermi-LAT Ackermann et al. (2012) and further measured with an unprecedented accuracy by AMS-02 Accardo et al. (2014); Aguilar et al. (2019b, 2021), has been a subject of great interest. One explanation for the additional positron flux, is relatively close-by “young” and “middle-aged” Milky Way pulsars that during their pulsar wind nebula (PWN) phase converted an appreciable fraction () of their rotational energy into high-energy cosmic-ray electrons () and positrons () Harding and Ramaty (1987); Atoyan et al. (1995); Aharonian et al. (1995); Hooper et al. (2009); Yuksel et al. (2009); Profumo (2011); Malyshev et al. (2009); Kawanaka et al. (2010); Grasso et al. (2009); Heyl et al. (2010); Linden and Profumo (2013); Cholis and Hooper (2013); Yuan et al. (2015); Yin et al. (2013); Cholis et al. (2018a); Evoli et al. (2021); Manconi et al. (2021); Orusa et al. (2021); Cholis and Krommydas (2022a). Another explanation is Milky Way SNRs, that in their first kyr produced and accelerated secondary cosmic rays including positrons Blasi (2009); Mertsch and Sarkar (2009); Ahlers et al. (2009); Blasi and Serpico (2009); Kawanaka et al. (2011); Fujita et al. (2009); Di Mauro et al. (2014); Kohri et al. (2016); Mertsch (2018) (see however Cholis and Hooper (2014); Mertsch and Sarkar (2014); Cholis et al. (2017); Tomassetti and Oliva (2017)). Furthermore, detailed modifications on the distribution of cosmic-ray sources and the propagation of cosmic rays through the ISM Gaggero et al. (2013); Cowsik et al. (2014); Gaggero et al. (2014) and annihilating or decaying dark matter models have been explored to explain the positron fraction measurement Bergstrom et al. (2008); Cirelli and Strumia (2008); Cholis et al. (2009a); Cirelli et al. (2009); Nelson and Spitzer (2010); Arkani-Hamed et al. (2009); Cholis et al. (2009b, c); Harnik and Kribs (2009); Fox and Poppitz (2009); Pospelov and Ritz (2009); March-Russell and West (2009); Chang and Goodenough (2011); Cholis and Hooper (2013); Dienes et al. (2013); Finkbeiner and Weiner (2007); Kopp (2013); Dev et al. (2014); Klasen et al. (2015); Yuan and Feng (2018); Sun and Dai (2021). We assume in this work that the overall rise of the positron fraction, shown with its AMS-02 measurement in Fig. 1, is not caused by dark matter, but instead from a more conventional source; a population of Milky Way pulsars.
Pulsars are localized sources of cosmic-ray electrons and positrons. Due to their rapid spin-down, pulsars convert their initial rotational energy into cosmic-ray and subsequently release those into the ISM in a comparatively short amount of time111The time required for most cosmic-ray produced around the PWN environments to be released into the ISM, is at least an order of magnitude smaller than the propagation time required for these cosmic rays to reach our detectors Malyshev et al. (2009). The only exception would be a very close ( pc) pulsar (see however Evoli et al. (2018)).. That makes pulsars cosmic-ray sources approximately localized both in space and time. High-energy lose rapidly their energy through synchrotron radiation and inverse Compton scattering as they interact with the ISM and before reaching us. That results in an upper energy cut-off, on the spectra from individual pulsars Profumo (2011); Malyshev et al. (2009); Grasso et al. (2009). In turn, a population of pulsars that could collectively explain the rising positron fraction spectrum, could also give spectral features at the higher energies where the number of contributing pulsars is reduced to the point of individual sources dominating narrow parts of that spectrum Malyshev et al. (2009); Grasso et al. (2009); Cholis et al. (2018a); Cholis and Krommydas (2022a). Such features can then be searched for as in Cholis et al. (2018b). Similar arguments can be made for PWNe. However, their expected higher energy cut-offs are less sharp by comparison Mertsch (2018). We use modeled populations of Milky Way pulsars produced in our earlier work of Cholis and Krommydas (2022a). In Ref. Cholis and Krommydas (2022a), a library of publicly available pulsar population models was created that is in agreement with the cosmic-ray flux spectral measurements from AMS-02 Aguilar et al. (2019a, 2021), the CALorimetric Electron Telescope (CALET) Adriani et al. (2018) and the DArk Matter Particle Explorer (DAMPE) telescope Ambrosi et al. (2017a), as well as the AMS-02 positron fraction spectrum Aguilar et al. (2019b). As the pulsar’s contribution to the positron fraction spectrum is not perfectly smooth and with uncertainties, we use a library of models instead of just one generic parameterization. As we will show, we derive more conservative and more realistic limits on the dark matter annihilation cross section.
In Section II, we discuss the general methodology of our approach, including the observations that we use, the astrophysical background modeling of the positron fraction and the statistical treatment followed in fitting the data. We also create mock positron fraction data to answer the question on the robustness of the positron fraction measurement as a means to study the particle properties of dark matter. Then in Section III, we present the results of searching for a possible dark matter signal in the positron fraction. We find that the limits on the annihilation cross section are not well defined. That is due to the underlying astrophysical background uncertainties. The annihilation cross section limits have a width that is at least one order of magnitude in the mas range of 5 to 120 GeV that we study. In addition, we find indications for a possible excess of 5-15 GeV in cosmic-ray energy . That excess while compatible with a WIMP-scale dark matter signal, has a significance that varies with the astrophysical background modeling and is not claimed to be a robust one. Further scrutiny will be required as cosmic-ray physics in that energy range improve with future observations. Moreover, in Section III, we perform our mock positron fraction analysis. We find that if dark matter contributes to the positron fraction spectrum at the few percent level within an range spanning several AMS-02 energy bins, such an excess signal can not be absorbed by the astrophysical background uncertainties. However, identifying the exact particle properties of the dark matter particle responsible for that excess is a a more model-dependent inquiry. Finally, in Section IV, we give our conclusions and discuss connections to other types of dark matter searches as well as future prospects.
II Methodology
In this section, we describe the energy range of the AMS-02 positron fraction () measurement used in this analysis. We also explain how we construct our background astrophysical models, which are fitted to the AMS-02 positron fraction. We then describe the statistical analysis performed to set upper limits on dark matter particles annihilating, giving a contribution to the positron fraction. Finally, we construct positron fraction mock data based on the AMS-02 sensitivity to test whether a dark matter signal would be detectable; and how accurately we would be able to determine the dark matter mass, annihilation channel and cross section by our analysis.
We use astrophysical realizations created within Ref. Cholis and Krommydas (2022a), as a base to construct our background models for the positron fraction. We take the and fluxes calculated from these realizations and add a dark matter contribution. Using these fluxes we perform fits, where we search for a potential dark matter component to the positron fraction and compute the 95% confidence level upper limits on the dark matter annihilation cross section as a function of mass. These fits are performed using a library of astrophysical/background realizations.
II.1 Cosmic-ray data
We use the recently published AMS-02 positron fraction measurement from Aguilar et al. (2021, 2019a) taken between May 2011 and November 2017. In Ref. Cholis and Krommydas (2022a), we found that the positron fraction spectrum sets stronger constraints on sources of cosmic-ray positrons, compared to the cosmic-ray positron flux spectrum. This is due to its smaller errors. Some systematic errors cancel when calculating cosmic-ray fractions versus cosmic-ray fluxes. We ignore the positron fraction measurement below 5 GeV, as that energy range is strongly affected by solar modulation and any dark matter annihilation signal from an approximately thermal relic would be hidden within the solar modulation modeling uncertainties. Given that there is no publicly released covariance matrix by the AMS-02 collaboration on that measurement, we treat the different energy bins as uncorrelated and add the systematic and statistical errors in quadrature.
II.2 Modeling the background to the dark matter contribution on the positron fraction
In this work, as signal we refer to a potential annihilating dark matter contribution on the positron fraction spectrum. As background we refer to all other astrophysical sources contributing to the positron fraction. Our modeling of the astrophysical background is based on Ref. Cholis and Krommydas (2022a). These astrophysical realizations contain fluxes from primary sources i.e. supernova remnants, secondary produced from inelastic collisions of primary cosmic ray nuclei with the ISM gas and from Milky Way pulsars. The main goal of Ref. Cholis and Krommydas (2022a), was to study the properties of Milky Way pulsars. Thus, a large number of astrophysical realizations was created. Those realizations accounted for a sequence of astrophysical uncertainties, as the stochastic nature of the neutron stars’ birth in time and location, the stochasticity in the initial spin-down power of pulsars and their subsequent time evolution. Also Ref. Cholis and Krommydas (2022a), studied the fraction of pulsar spin-down power into cosmic-ray and how these injected cosmic rays propagate in the ISM and the Heliosphere.
In this work we start with the astrophysical/background realizations from Ref. Cholis and Krommydas (2022a) that were shown to be in good agreement with the AMS-02 positron fraction Aguilar et al. (2021, 2019a), the flux Aguilar et al. (2021, 2019a), the total flux Aguilar et al. (2021, 2019b), and also the total fluxes from DAMPE Ambrosi et al. (2017b) and CALET Adriani et al. (2018). The quality of the fit is heavily impacted by the lowest energies of the positron fraction where the errors are the smallest. Adding a dark matter flux component that contributes at these low energies can drastically affect the quality of the fit. Thus, we include in our analysis astrophysical/background realizations from Ref. Cholis and Krommydas (2022a) that have a in the positron fraction. This results in a total of 1020 astrophysical/background simulations, to account for all the background uncertainties. Some of those realizations in combination with a dark matter component may end up giving a much better quality of fit to the AMS-02 data and can explain the observations at energies where there is no contribution from dark matter.
For the dark matter contribution, we assume a local dark matter density of Bovy and Tremaine (2012); Salucci et al. (2010); Catena and Ullio (2010); Pato et al. (2015), set at 8.5 kiloparsec (kpc) from the galactic center. We take the dark matter halo in the Galaxy to follow an Navarro-Frenk-White (NFW) profile Navarro et al. (1996), with a characteristic radius of 20 kpc. We consider four simplified dark matter annihilation channels. These are: , , and . The annihilation cross section is set to be free in our analysis. We focus on low dark matter masses between 5 and 50 GeV for the and the channels, between 5 and 80 GeV for the channel and between 10 and 120 GeV for the one.
We calculate the injected production spectra from these dark matter annihilations using PPPC4DMIDCirelli et al. (2011) and calculate the final and spectra at the location of the Sun using GALPROP v54 https://galprop.stanford.edu/ ; Strong and Moskalenko (1998). The dark matter spectra are propagated through the ISM using the same 12 alternative propagation models as those defined in Table II of Ref. Cholis and Krommydas (2022a). Every time that we test for a potential dark matter signal in the AMS-02 data, we make sure that the hypothetical dark matter flux, is evaluated under the same propagation conditions as its relevant astrophysical background. The 12 ISM models account for different choices on the thickness of the zone within which cosmic rays diffuse before escaping the Milky Way, how that diffusion depends on the cosmic-ray energy and finally for the energy losses of the cosmic-ray within the local volume of the Milky Way. This combination of ISM models encompasses the relevant astrophysical uncertainties within from the Sun Trotta et al. (2011); Pato et al. (2010); Cholis et al. (2022). For more details we refer the reader to Section II.E of Ref. Cholis and Krommydas (2022a). In each astrophysical background, we add a dark matter contribution by choosing a specific annihilation channel and a specific mass and construct our final astrophysical+dark matter model. Given the different choices for the particle dark matter properties, we simulate 64 different combinations of annihilation channel and mass for each of the 1020 astrophysical backgrounds (65280 fits in total). The annihilation cross-section is left as a free parameter to be set by the fit to the data. These final ISM and spectra include the contribution of primary cosmic rays, secondary cosmic rays, cosmic rays from pulsars and from dark matter annihilations. We also propagate each of the ISM cosmic-ray spectra to the location of the Earth and account for solar modulation. That is done following the prescription of Cholis et al. (2016), where the modeling of the time, charge and energy-dependence of solar modulation is accounted for by two fitting parameters, set within a range suggested by Cholis et al. (2020); Cholis and McKinnon (2022). That same procedure was followed in Ref. Cholis and Krommydas (2022a). The associated Bartels’ Rotation numbers -relevant for the modeling of solar modulation effects- for the data-taking era are 2426-2514.
II.3 Statistical analysis
When we fit the astrophysical/background models to the AMS-02 positron fraction we have seven parameters. These account for the cosmic-ray primary flux, the secondary flux and the pulsar flux normalizations. We include two parameters to allow for a spectral softening/hardening of the cosmic-ray primary and secondary spectra; and two more for the solar modulation modeling. Once adding the dark matter component we have an additional (eighth) parameter, that is directly proportional to the fitted annihilation cross section. For a given astrophysical background, once adding a potential dark matter component in the fitting procedure, we allowed the other seven parameters to be free within of their best-fit value achieved in the background only fit. In Appendix A we give the full parameter space tested in our astrophysical dark matter models and its subsequent minimization procedure.
We perform a minimization; and use a combination of SciPy’s Virtanen et al. (2020) least_squares routine from the optimize module and iminuit Dembinski and et al. (2020); James and Roos (1975). We found that the fastest minimization is achieved by performing a few minimization steps with the least_squares routine with high tolerance and finishing the minimization with iminuit.
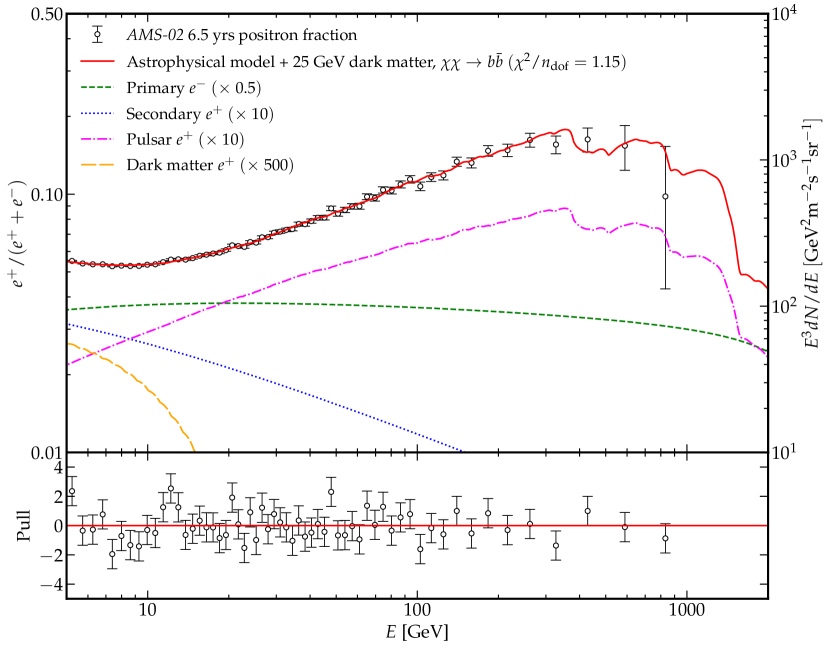
In Fig. 1, we show the fit to the positron fraction for one of our background models with a dark matter component included. For the dark matter we have taken, and the annihilation channel to be . One can see all the relevant contributions from primary , secondary , pulsar , and originating from dark matter. The background only hypothesis gave for this model a ; while after including dark matter we got a . is the number of degrees of freedom. The pull of the fit, which is is also shown at the bottom of the figure.
The dark matter mass range that we study in this work, contributes at the lower energies and has no effect on the higher energies where the spectrum is dominated by the local pulsar population. Also, other than the annihilation channel, the dark matter component cannot produce sharp peaks in the positron fraction that could explain features like the one we identified in Ref. Cholis and Krommydas (2022a) and studied in Ref. Cholis and Krommydas (2022b) at . We find that statement to be true for every astrophysical/background model.
In order to derive upper limits on the dark matter annihilation cross section, presented as , we use a likelihood ratio test. The null hypothesis is that there is no dark matter contribution and we just have the astrophysical background, i.e. seven fitting parameters with . The alternative hypothesis is that there is some contribution from dark matter annihilation with annihilation cross section (times velocity, thermally averaged) , i.e. eight fitting parameters. We rely on Wilks’ theorem Wilks (1938), and use the statistic (= difference), with the likelihood ratio of the null (background only) hypothesis over the alternative dark matter + background hypothesis. This is distributed according to a -distribution with degrees of freedom, where is the difference of fitting parameters between the two hypotheses models. In our case, we have . However, that would give a naive estimate of the p-value since the null hypothesis corresponds to the case , i.e. it lies on a boundary of our parameter space. This problem can be overcome by using Chernoff’s theorem Chernoff (1954). The follows a distribution (half chi-square distribution) with one degree of freedom Conrad (2015). This means that the p-value is reduced by half compared to the naive estimate.
Following the standard convention in the literature, we can deduce 95% upper limits on for each astrophysical background at a fixed annihilation channel and dark matter mass. This is done by scanning over , computing the profile and finding at which value of we have . This corresponds to the 95% upper limit of a half chi-square distribution with one degree of freedom. Because we have multiple masses, we essentially have a 2D grid of masses and cross sections where we compute the profile and draw the contour where the increased by 2.71 from . At each point of the grid the rest of the background nuisance parameters are optimized such that the is minimum. This contour is the 95% upper limit on the dark matter annihilation cross section as a function of the mass. This can be done for each annihilation channel and for each pulsar background, resulting in each background giving a different upper limit. We report the combination of those upper limits.
II.4 Mock data
In this paper, we produce mock data of the AMS-02 positron fraction. We do that to test whether a dark matter contribution in the positron fraction would be detectable and with its properties (mass, annihilation cross section and channel) correctly identified. We produce these mock data by taking existing backgrounds and adding a flux component from dark matter of specific mass, annihilation channel and cross section. We then calculate the positron fraction spectra that the AMS-02 would observe. These mock spectra include only statistical errors. We treat these mock spectra as we treated the AMS-02 measurement and scan them with our background+dark matter models to see if we can recover the original mass, annihilation channel and cross section. By keeping only the statistical errors we are optimistic on the ability of the positron fraction measurement to help us probe the properties of a dark matter signal.
For the mock positron fraction spectra we use two annihilation channels: and ; and test four dark matter mass and annihilation cross section combinations. For the channel we have,
-
(a)
and ,
-
(b)
and ,
-
(c)
and ,
-
(d)
and .
For the channel we have,
-
(a)
and ,
-
(b)
and ,
-
(c)
and ,
-
(d)
and .
We use two astrophysical backgrounds to create these mock data, one for each channel. These two backgrounds are in agreement with the AMS-02 flux, positron fraction and total flux measurements, and also with the DAMPE and CALET total flux measurements.
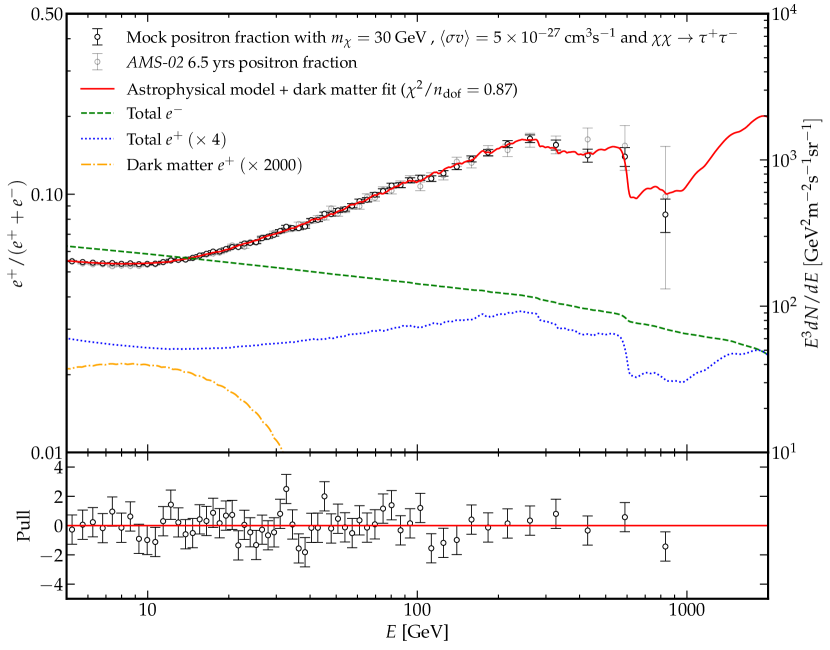
In Fig. 2, we show an example of such a mock positron fraction where there is a contribution from 30 GeV dark matter particles annihilating to with an cross section of . We also show a fit to that mock positron fraction by one of our models and the original AMS-02 data with a fainter color for comparison to the mock ones. The errors of the mock positron fraction are much smaller as we only consider statistical uncertainties.
Once a mock positron fraction spectrum that includes a dark matter component is created, we test our ability to deduce the particle dark matter properties. We scan the mock positron fraction spectra, by testing the combination of 100 backgrounds (including the backgrounds used to create them) with all the 64 combinations for the dark matter annihilation channel and mass used.
III Results
III.1 Upper limits on the dark matter annihilation cross-section
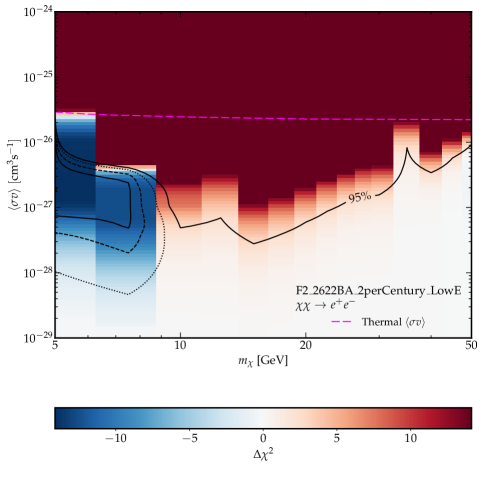
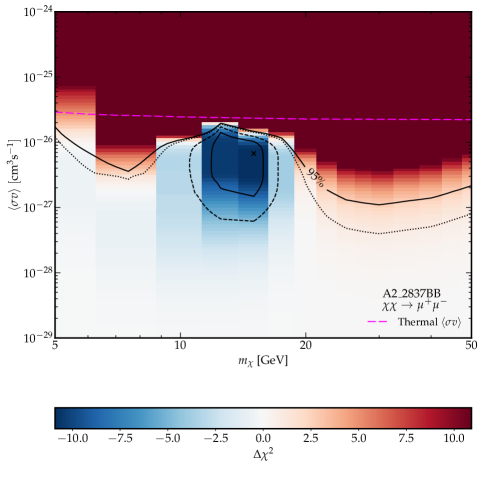
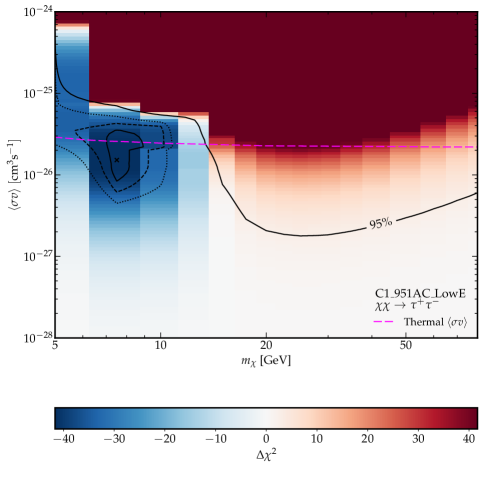

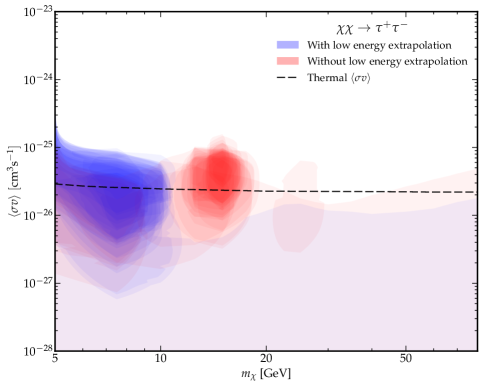
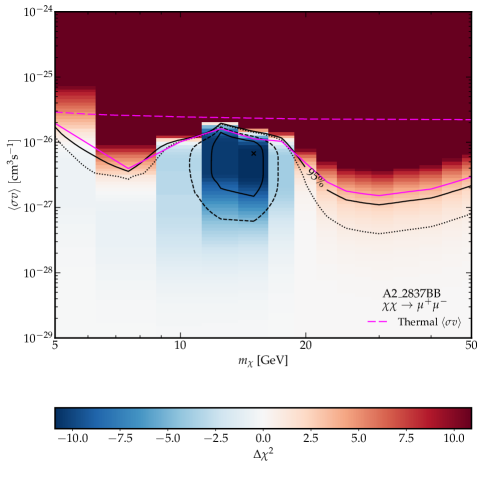
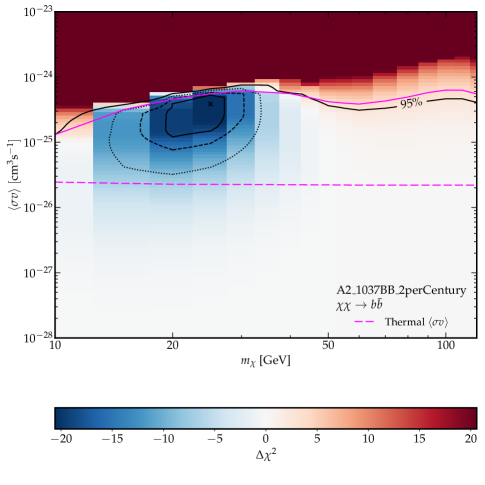
For a given astrophysical background and after fixing the annihilation channel and dark matter mass , we can calculate a unique limit of the dark matter annihilation cross section. In this work we show results for the annihilation cross section times the relative dark matter particles’ velocity (thermally averaged). In Fig. 3, we show for the versus parameter space the quality of fits as “heatmaps”, for the four annihilation channels that we study. In each case these are evaluated by fixing the astrophysical background to be one out of the 1020 that we use as a basis to account for astrophysical modeling uncertainties. As we have explained in section II.3, we allow for eight fitting parameters. In these heatmaps the is evaluated from the case of no dark matter annihilation (i.e. ). Points with negative , (given in different shades of blue) represent dark matter assumptions for which we get a better fit to the positron fraction than without a dark matter contribution. Instead, points with positive , (given in different shades of red) represent dark matter assumptions that are statistically excluded by the positron fraction data. Our discretized parameter space shows the grid points that we used to probe the versus parameter space.
As can be seen from Fig. 3, for each channel and for the specific astrophysical backgrounds shown, there is a strong preference for a dark matter contribution to the positron fraction. This is shown by the dark blue ranges around which we evaluate the best fit and parameter point and the 1, 2 and 3 signal significance contours. We also show the 95 upper limit on as a function of (in the solid black lines)222These upper upper limit lines are only exact at the centers of our mass ”bins”. It shouldn’t be worrying that the line goes over areas of negative (blue) since the algorithm tries to interpolate in the mass range between our mass ”bins”.. However, what is shown in Fig. 3 represents only the results coming from one background for each of the four channels. We find that both the 95 upper limits and the excess contours depend on the exact astrophysical background used. That statement is true for all channels studied and for a wide range of masses.
We discuss first the impact that alternative astrophysical background assumptions have on the upper limits to the dark matter cross section. By exploring the parameter space we have found that models with similar assumptions for the combination of energy losses and diffusion end up giving similar upper limits and excess regions in each annihilation channel and type of background (low-energy extrapolated or not). That is especially true for the energy losses in agreement with Bergstrom et al. (2013). Changing the assumptions on the ISM energy loss rate, does not dramatically change the shape of the dark matter spectra in the energy ranges that we fit 333For masses GeV and for propagated of energy up to 5 GeV, the spectral shapes of the dark matter fluxes studied here change very little by varying the ISM conditions. At energies lower than GeV, lower energy losses make the dark matter spectrum at Earth harder. Given that we focus on relatively light dark matter, alternative choices on the ISM energy losses have little impact in the spectral shape (excluding the normalization) of the dark matter originated fluxes.. However, it does affect the amplitude of these fluxes for a given mass, cross section and channel. Lower energy losses allow for the observed of dark matter origin to be sourced from a wider volume of the local Milky Way. Thus, the dark matter flux that reaches us is higher when we assume lower energy losses; setting in turn tighter limits on the allowed dark matter annihilation cross section. Lower ISM energy loss rates enhance in amplitude the background astrophysical flux components as well. Yet, that enhancement in those fluxes’ amplitude is absorbed in our analysis as part of the uncertainty in the efficiency of the underlying background sources, i.e the assumptions on the SNRs, pulsars and the ISM gas density. Thus changing the energy-loss rate assumptions has a residual effect only on the annihilation cross section limits. Instead, the assumptions about how fast cosmic rays diffuse have a much smaller impact on the final dark matter limits. Similarly, the assumptions of the galactic scale-height have a very small effect on the cross section upper limits. For a given dark matter model’s propagated spectrum, the lower the observed energy is, the larger the volume of origin of those within the Milky Way. For the dark matter masses we focus here, different choices on the diffusion coefficient, diffusion index and scale height affect mostly the propagated spectra at energies below GeV, that we do not fit due to the large solar modulation modeling uncertainties. The effects of different diffusion assumptions on the background fluxes are important if one fixes all other modeling assumptions; but once marginalizing over the rest of those assumptions, the diffusion has a small effect on how much room there is for an additional dark matter flux component.
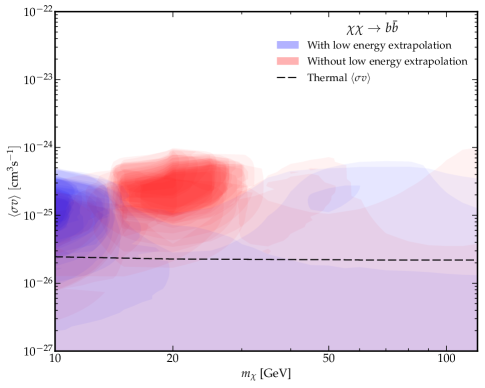
Having created heatmaps as those of Fig. 3, testing the variety of alternative astrophysical assumptions we concluded that instead of using the entire library of 1020 astrophysical background assumptions we can reduce our analysis to a sample of 60 astrophysical background models for each annihilation channel (there is some overlap between channels). All of these 60 backgrounds are within from a after including dark matter at their best fit point. Combining different upper limit lines from different backgrounds for the same channel, we construct upper limit bands. In Fig. 4, we show these upper limit bands for our four annihilation channels evaluated from our 60 astrophysical background models per dark matter channel.
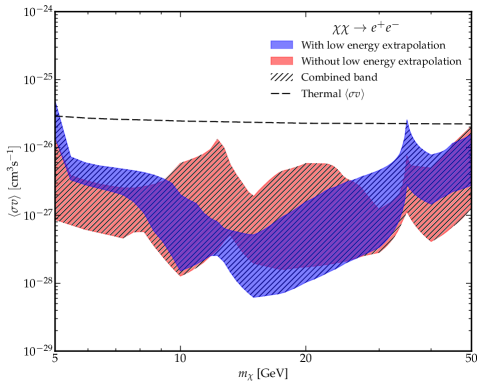
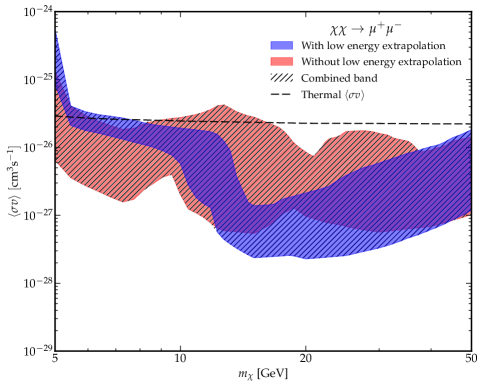
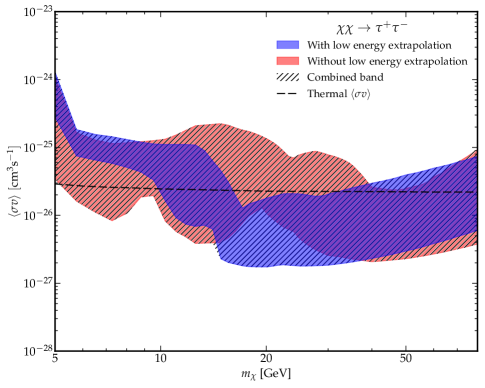
The 60 background models include the probed range of local energy losses, the alternative choices for the Milky Way’s local diffusion properties, as well as alternative assumptions for the pulsars’ flux component at energies of GeV. The energy-loss assumptions affect mostly the fluxes of the dark matter component at energies close to the dark matter mass . As the leptonic channels give dark matter fluxes to that are harder in spectrum than the primary and secondary astrophysical components, the dark matter component becomes most important in relevant terms at energies close to . As we explained earlier, alternative choices for energy losses (and to a smaller extend diffusion) affect that energy range where for a given mass and annihilation channel the dark matter flux becomes most relevant. The alternative choices on the pulsars’ flux component at energies of GeV are relevant here for the dark matter masses that we study. At GeV many old and distant pulsars contribute and as a result their contribution depends on a larger number of assumptions than the contribution of local and younger pulsars at higher energies. We represent that by breaking our results in Fig. 4, into models “with low-energy extrapolation” and models “without low-energy extrapolation”. The low-energy extrapolation backgrounds give a higher flux from distant and older pulsars. The cosmic-ray measurements from AMS-02, CALET and DAMPE probe best the pulsars’ contribution at high energies. Thus, using a range of assumptions that result in a wider range of predictions on the more uncertain low-energy astrophysical background, is the conservative way to set limits on annihilating dark matter particles with mass of 5-50 GeV. In the 60 backgrounds we make sure to include 30 of the best-fit models from Ref Cholis and Krommydas (2022a), where the full parameter space of local Milky Way properties was probed and models for which after adding the dark matter component we get high quality fits to the data.
In Fig. 4, there is a rough order in the values of the annihilation cross section limits. Our fits show that there is preference for a higher when we use as our channel, followed by , followed by and then . That is to be expected as the annihilation channels to more massive Standard Model particles give fluxes that span a wider range and have less prominent spectral features. This makes the dark matter fluxes easier to conceal within the background fluxes and their modeling uncertainty.
Another result, is that for the three leptonic channels the backgrounds with the low-energy extrapolated pulsars’ flux prefer smaller dark matter masses of the order of 5-10 GeV, while the backgrounds without the low-energy extrapolation generally prefer higher masses. Following, we explain first the lower masses results. Backgrounds with low-energy extrapolation have a higher flux originating from pulsars at energies GeV 444We write at GeV, instead of GeV, as the low energy extrapolation that we use for the modeled pulsar flux starts at energies anywhere between 10 and 30 GeV depending on modeling assumptions.. In our multi-dimensional parameter space minimization, when pulsars predict a higher flux at low energies, the positron fraction is fitted better by a higher flux from dark matter as well. That counter intuitive statement is due to the large impact the first few positron fraction data points (at 5-10 GeV) have on the fit. We remind that the positron fraction error bars at those energies are the smallest (see Fig. 1). At those low energies, the secondary positrons provide a prominent flux component. The secondary cosmic-ray modeling assumptions together with those on solar modulation dominate the fit between 5 and 10 GeV. Changing the pulsars’ flux assumptions at energies bellow GeV impacts the secondary positrons and electrons spectra in the entire energy range of the observed positron fraction. The impact of this on the dark matter limits is shown in Fig. 4. Backgrounds with a higher pulsar flux prediction at low energies result also in more room for a localized in energy dark matter signal. Again the "with low-energy extrapolation" backgrounds, predict a higher flux from pulsars at energies O(10) GeV to the "without low-energy extrapolation". For the leptonic channels, that give flux that peaks in a small energy range as is especially the case with the and channels the low energy extrapolation backgrounds usually give weaker limits. We note that for the channel, the situation is different as the dark matter flux spans a wide energy range.
The cosmic-ray positron fraction has three spectral features around 12, 21 and 48 GeV that were identified to be prominent in Refs. Cholis and Krommydas (2022a) and Cholis and Krommydas (2022b). For the channel, the lower two in energy features have an effect on our limits. This annihilation channel gives a dark matter flux with a sharp break at energy . For the backgrounds without the low-energy extrapolation we see three mass regions at GeV, at GeV and at where the limits are weaker. Dark matter particles with mass of 10-12 GeV, give cosmic-ray with energies lower than 12 GeV. Thus, their limits are not directly affected by the 12 GeV positron fraction feature. The weakest limits for that mass range are created by backgrounds with enhanced local ISM energy losses. The weak limits for the mass region of GeV are associated to the 12 GeV feature of the positron fraction measurement and are derived from ISM backgrounds with conventional local ISM energy losses. The weaker limits at GeV, are associated to the 21 GeV feature on the positron fraction. Both the blue and red shaded regions find weaker limits for GeV, as around 20 GeV in cosmic-ray energy their background predictions are similar.
For the annihilation channel to , the upper limit bands show two mass ranges where the limits become weak, at 10-15 GeV and at GeV. Again, the first mass range is not affected by the presence of the positron fraction spectral features. The weakest limits for the 10-15 mass range come from ISM models of increased local energy losses and for the "without low-energy extrapolation" background assumption. The weaker limits for GeV, originate from the 12 GeV feature. The 21 GeV feature has an effect on the highest-end of the shown mass range
For the annihilation channel to , the upper limit bands become weak, in the wide mass range of 10-40 GeV. This is similar to what was described for the channel. However, what was two mass ranges for the has merged into one. The , has a dark matter spectrum less localized in energy than the .
For the channel, the limits for backgrounds without the low-energy extrapolation to the pulsars’ component are almost always weaker for masses GeV. As we said the channel gives a cosmic-ray flux that spans a wide range. Thus, a suppressed background positron flux allows for weaker constraints on the dark matter contribution to the positron fraction. For the channel and for mass of 50-120 GeV, the limits are roughly the same for the backgrounds with or without the low-energy extrapolation. For these higher masses the dark matter originated flux is prominent above the energy range where the extrapolation is used.
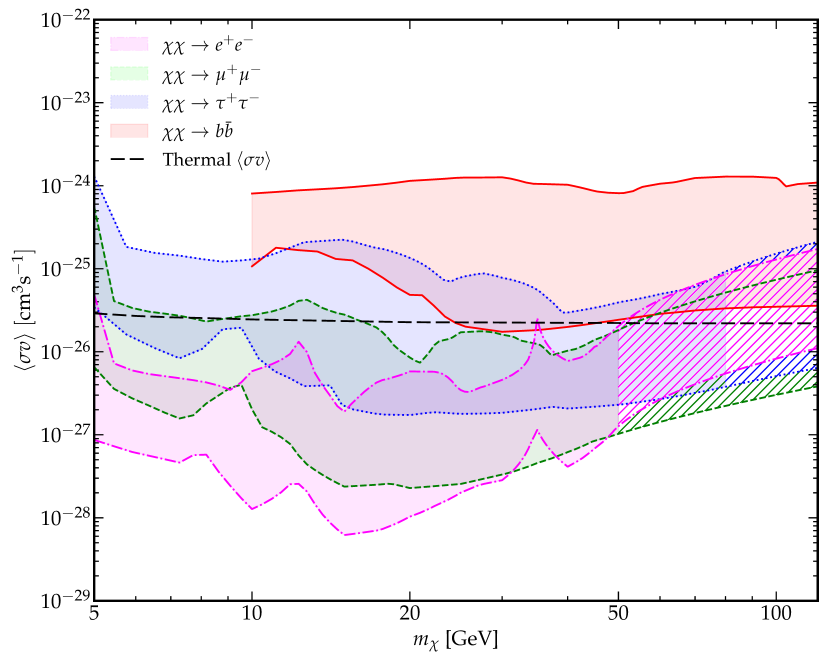
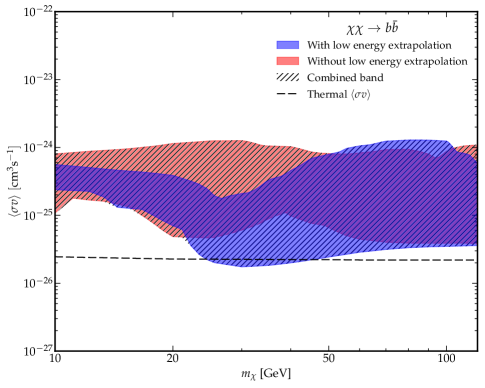
In each one of the plots of Fig. 4 we also have the combined band with and without low energy extrapolation as a hatched region. In Fig. 5, we show the four combined upper limit bands, one for each of our annihilation channels where we have also extrapolated those bands up to 120 GeV where necessary. We claim at this point that the upper limits on from the cosmic-ray positron fraction, are much more uncertain than previously claimed. Due to the uncertainties in the astrophysical backgrounds including the pulsar component, there isn’t a well defined upper limit line. Instead, we present upper limit bands evaluated from a collection of viable astrophysical backgrounds, that each gives a different upper limit line. Our bands at certain masses can span up to two orders of magnitude in the constrained parameter , as e.g. for with GeV.
III.2 A possible excess flux of low cosmic-ray energy positrons.
As we show in Fig. 3, for the specific background astrophysical model used, we can find combinations of dark matter mass, annihilation cross section and channel, where there is a significant statistical preference for an additional dark matter component. In that example, the fit to the positron fraction improves by a of up to 40. The most statistically significant result comes from a with GeV and . Such a dark matter particle, has similar properties to those required to explain the galactic center excess in gamma rays Goodenough and Hooper (2009); Vitale and Morselli (2009); Hooper and Goodenough (2011); Hooper and Linden (2011); Gordon and Macias (2013); Daylan et al. (2016); Calore et al. (2015a, b); Abazajian et al. (2014); Ajello et al. (2016); Di Mauro (2021); Cholis et al. (2022).
In this subsection, we further pursue this indication of a possible dark matter component. We test whether this is a result of just a specific combination of astrophysical background assumptions, or a result that stands to further scrutiny once we allow for a wide range of astrophysical backgrounds. We use the set of 60 astrophysical background models with all the seven astrophysical nuisance parameters plus the one related to the dark matter annihilation cross section as we described in section II.3.
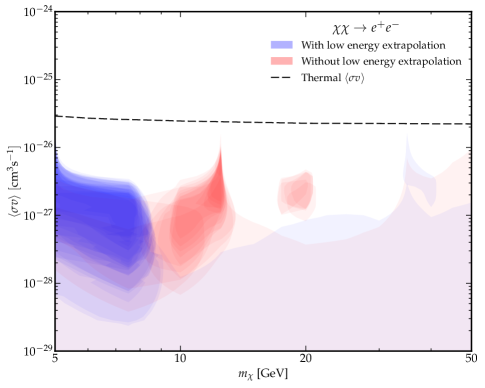
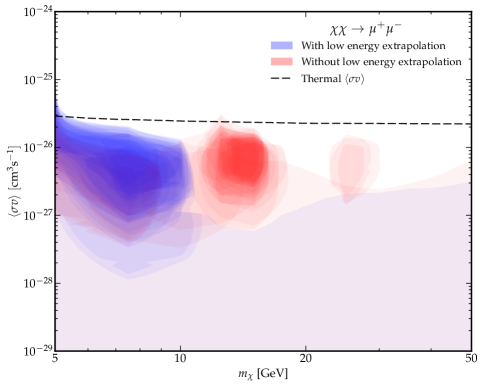
In Fig. 6, we show in a similar manner to Fig. 4, the excess contour regions for our four dark matter annihilation channels. There are 60 overlaid contour regions in each plot. These excess regions are in agreement with our upper limit bands. The respective upper limits like the ones presented in Fig. 3 for a specific background, get weaker when the excess contours suggest a high annihilation cross section. Some isolated islands in the cross section versus mass space are also observed. These are created by very few background models and are typically of minor statistical significance. In fact, we find that for some of the backgrounds used, while there still is some improvement by adding a dark matter component, that is a small one. In particular, for 2 out of the 60 background models, by adding dark matter annihilating to , or , or leptons the improvement in is less than 6. That results in open contours depicted by light red or blue regions extending to effectively zero annihilation cross sections. For dark matter particles annihilating to , there are 6 out of the 60 backgrounds where that is the case. This shows that this “excess” is not always statistically significant. However, we note that for most of the tested backgrounds there is some excess flux compatible to that coming from locally annihilating dark matter. As we will explain in detail in the following subsection III.3, even if indeed this is a dark matter signal, deducing its particle properties is highly challenging. Also, we note that some of the parameter space suggested by the excess is excluded by limits from the cosmic microwave background, gamma rays and antiprotons Aghanim et al. (2020); Albert et al. (2017); Cholis et al. (2019).
We can not claim and do not claim any robust excess flux between 5 and 15 GeV on the positron fraction spectrum. We just note that we used background models that always agree with higher energy observations from AMS-02, CALET and DAMPE, and that half of the 60 astrophysical background models give (without a dark matter component) a good quality fit of to the positron fraction from 5 GeV to 1 TeV. Yet, a excess for the low energy cosmic-ray flux is found for the great majority of these background models. We also find a tendency for background models with high local energy losses, of , to reduce the significance for that excess component. Further understanding of the astrophysical, nuclear and particle physics uncertainties at the 1-20 GeV cosmic-ray energy range is needed to more accurately model the primary and secondary production of cosmic rays, as well as constrain better their propagation properties through the ISM and the heliosphere. Finally, having a full knowledge of the correlated errors on the positron fraction measurement will be of great benefit to elucidate the AMS-02 observations. In the absence of such a published result by the AMS-02 collaboration, we leave this issue of a possible “excess” flux an open question.
III.3 Ability to detect dark matter in the AMS-02 positron fraction measurement
In this section if the AMS-02 positron fraction measurement can be used to probe the properties of a dark matter component in it. As we describe in section II.4, we use eight combinations of dark matter mass, annihilation cross section and channel to create mock positron fraction measurements. These mock positron fraction measurements take also into account the flux predictions from one specific background per annihilation channel. These two backgrounds were selected to provide a good fit to the AMS-02, CALET and DAMPE cosmic-ray lepton measurements (see Ref. Cholis and Krommydas (2022a)).
We test these mock observations by searching for a dark matter signal. We first want to test if by adding an excess signal of dark matter origin we can at the very least identify its presence, i.e. the presence of an additional term that doesn’t come from cosmic-ray primaries, secondaries or the main population of local pulsars. That doesn’t exclude that an excess flux in low-energy positrons can still be of a more conventional astrophysical origin as e.g. a collection of very powerful, nearly simultaneous but old supernova remnants giving a high flux of in that range Mertsch (2018), or a similar collection of very (and atypically) powerful pulsars, or from cosmic-ray activity in the center of the Milky Way Cholis and Krommydas (2022b). As a second level question, we want to see if assuming that excess term is of dark matter origin, whether we can identify its specific particle physics properties (mass, annihilation channel and cross section).
We fit each one out of the eight mock data by being agnostic to both the background and the dark matter signal. We test all combinations of 100 backgrounds and all dark matter channels and masses (64 in total). Thus we perform such fits. We check whether the combinations of background dark matter channels and masses that were used to create the mock data are statistically significant against the other combinations. We remind the reader that the annihilation cross section is let to be free in our fitting procedure. We find that the astrophysical background is easily identifiable i.e. we can find which one out of the 100 backgrounds was used to create the mock positron fraction. We also find that we can at the very least identify the presence of an additional term contributing to the positron fraction, i.e a nonzero annihilation cross section. When fitting to mock data that originated from a particular astrophysical background, all the good fits found are combinations of that background some dark matter contribution. However, the properties of that dark matter component are not easily identifiable. As the astrophysical background dominates the positron measurement in the entire energy range it is possible to pick out the underlying background model used to create the mock data. That is not the case with the dark matter component that affects the measurement only in a narrow energy range.
The dark matter annihilation channel is very challenging to identify. After scanning our mock data, we find that there is no statistical significance for models that are built with the original dark matter annihilation channel over the other three channels. Among the best fits to each mock data, the fit doesn’t give any preference between different annihilation channels. Even if a dark matter signal is present within cosmic-ray , we cannot identify the annihilation channel that produces that signal. For that reason, we perform an additional test where we fix the dark matter annihilation channel to the one used to create each of our mock data.
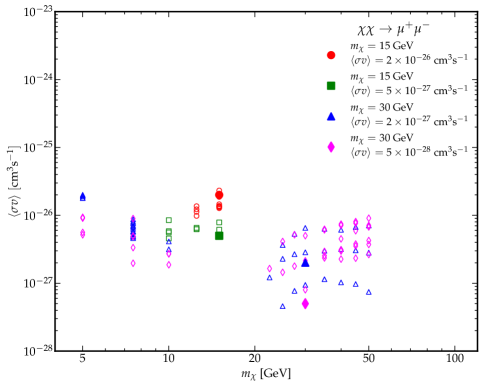
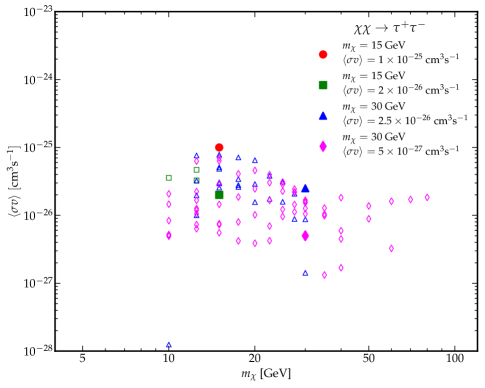
In Fig. 7, we show the results of scanning our mock data with only the channels that were used to create them. On the left we show the results for the mock data and on the right the results for the mock data. For each one of these eight cases we test a combination of 100 backgrounds 17 masses. The maximum number of empty markers that could exist for each type is 1700. Those that appear in the plots are the ones within of a , which means . If small clusters of similar empty markers (best fit points) form around the same filled markers (original mock data parameters), then this points to our ability to correctly identify the dark matter properties using the positron fraction. We stress that for these results, we are not being agnostic about the annihilation channel. To know the annihilation channel further input would be required.
For the case (left), the results depend on the mass of the dark matter particle. When the mock data contain a signal with (red circles and green squares), we can identify the properties of this signal relatively well. Our fits give masses and cross sections very close to the original ones. However, when the mock data contain a signal with (blue triangles and magenta diamonds), the signal becomes unidentifiable. Our fits give masses that span between 5 and 50 GeV which is our entire tested mass range. Also, the cross section is very uncertain, spanning more than one order of magnitude around the original value. For the GeV case, we used a smaller annihilation cross section to create the mock data. The presence of such dark matter doesn’t deform the positron fraction spectrum significantly and our fitting procedure can adjust all the other astrophysical background parameters to fit the mock positron fraction very well. That is why for the more massive cases, the dark matter signal becomes unidentifiable. For the GeV mock data, we picked the lower annihilation cross sections to , compared to the GeV, as the relevant limits presented in Fig. 4, are stronger for the 30 GeV mass.
For the case (right), it is much harder to identify the dark matter properties even when the mass is 15 GeV. When the cross sections that we decided to use to produce the mock data, deforms the positron fraction too much in the lowest energies where the error bars are the smallest. Our fits cannot adjust the astrophysical background parameters enough to fit this deformation. The end result is that for (red circles), no fits survive within , while for (green squares), only 3 fits are within . These 3 fits however fall around the original mass and the cross section that was used to create the mock data so our signal is identifiable within some uncertainty. When , the results are similar to the case and the mass and annihilation cross section of the dark matter particle are completely unidentifiable for the same reasons.
IV Discussion and Conclusions
In this paper we have used the most recent positron fraction measurement from AMS-02 to set upper limits on dark matter annihilation cross sections for masses of 5-120 GeV. Most of the electrons and positrons observed by AMS-02 do not originate from dark matter. Our astrophysical background modeling relies heavily on our previous work of Ref. Cholis and Krommydas (2022a). The astrophysical backgrounds produced in that work are in agreement with a wide range of cosmic-ray measurements such as the positron fraction, the positron flux and the electron plus positron flux.
Our background models account for cosmic-ray primary electrons and uncertainties in their injection amplitude and spectrum, cosmic-ray secondary electrons and positrons and equivalent uncertainties in their injection amplitude and spectrum. They also include the contribution of Milky Way pulsars that come with a sequence of uncertainties. Those uncertainties are related to the stochastic nature of their (neutron star) birth, distribution in space, initial spin-down power and the injected into the ISM cosmic-ray electron/positron fluxes. Pulsars also have a relatively uncertain time evolution as they spin down and also poorly determined efficiency in converting their rotational energy into cosmic-ray electrons and positrons. All these uncertainties are accounted for in our background simulations. Finally, we test a sequence of alternative modeling assumptions on how cosmic-ray electrons and positrons propagate through the ISM and the heliosphere, before reaching the AMS-02 detector. In these background models we added a contribution from annihilating dark matter.
We study four different annihilation channels. These are , , and . We use a discretized grid of dark matter masses and test them over our large sample of astrophysical backgrounds. In our analysis the annihilation cross section, in units of is treated as a free parameter. We derive upper limits on as a function of for each annihilation channel which are summarized in Fig. 5.
We find that that each valid astrophysical background that explains the AMS-02 data well, gives different upper limits on . Therefore, we claim that the correct upper limits are not lines but bands spanning roughly one order of magnitude for each annihilation channel. We also find that the limits become stronger or weaker depending on the dark matter particle mass, and that this, in the channel, has to do with low energy spectral features in the positron fraction. To a weaker extend a similar trait exists for the and channels. Instead, the limits derived for the case are fairly insensitive to the existence of low energy features in the positron fraction spectrum. We believe that a better understanding of the secondary production of cosmic rays in our Galaxy and solar modulation will help us to further refine these dark matter upper limits and reduce the widths of the presented bands.
Furthermore, we note that in the great majority of the astrophysical backgrounds that we use which are compatible with the observations by AMS-02, CALET and DAMPE, we still find preference for an additional cosmic-ray component. That component of 5-15 GeV is compatible with a dark matter contribution. However, its statistical significance varies between backgrounds and in a small fraction among them the preference for dark matter becomes negligible. We do not think that “excess” to be robust due to astrophysical background modeling uncertainties. The AMS-02 error bars at the the low-end of the energy range that we use are of the order of 0.5 %. That is why the presence of a dark matter flux that contributes at the few percent level to the positron fraction can have a significant impact while fitting to the data. With future cosmic-ray measurements as for instance AMS-02 or an even more sensitive future cosmic-ray detector Schael et al. (2019), we will be able to reduce these uncertainties and further scrutinize the positron fraction at that energy range.
Additionally, we created mock data of the AMS-02 positron fraction to check whether we could detect a dark matter signal contributing to its spectrum and also identify that signals’ particle physics properties. We find that if dark matter contributes approximately 2-3 of the positron fraction in at least a few low-energy bins, we would be able to recognize the presence of some additional term in the AMS-02 data. However, determining the annihilation channel of such a signal is very challenging. If in such an analysis we allow for knowledge of the underlying annihilation channel, then for certain masses it is possible to accurately identify the dark matter properties of our injected mock dark matter signal.
We find that for dark matter annihilating to , for masses GeV and cross sections , we can identify the properties of mock signals within some statistical uncertainty. For larger dark matter masses, the properties of the mock signals to become more challenging. For dark matter annihilating to , we find that for masses GeV and cross sections of the order of , it is difficult to fit to the mock data with our models. For larger masses, the situation is similar to the case where the properties of the dark matter signal are very uncertain.
We have made publicly available our dark matter fluxes in their pre-fitted format for the entire set. These files can be found at https://zenodo.org/record/7178634. Our astrophysical background models of Ref. Cholis and Krommydas (2022a), are instead available at https://zenodo.org/record/5659004.
Acknowledgements.
We thank Dan Hooper for useful discussions and Tim Linden and Isabelle John for comments on the manuscript. We also acknowledge the use of GALPROP https://galprop.stanford.edu/ ; Strong and Moskalenko (1998) and the Python Van Rossum and Drake (2009) modules, numpy Harris et al. (2020), SciPy Virtanen et al. (2020), pandas pandas development team (2020); Wes McKinney (2010), matplotlib Hunter (2007), Jupyter Kluyver et al. (2016), and iminuit Dembinski and et al. (2020); James and Roos (1975). IC acknowledges support from the Michigan Space Grant Consortium, NASA Grant No. 80NSSC20M0124. IC acknowledges that this material is based upon work supported by the U.S. Department of Energy, Office of Science, Office of High Energy Physics, under Award No. DE-SC0022352.Appendix A Summary of the full parameter space
| Parameter | Range |
|---|---|
| Galactic halo height, | 3.0, 5.5, 5.7, 6.0 |
| Energy loss rate, | 2.97, 5.05, 8.02 |
| Diffusion coefficient, | 33.7, 51.3, 92.1, 140.2 |
| Diffusion spectral index, | 0.33, 0.40, 0.43, 0.50 |
| Pulsar braking index, | 2.5, 2.75, 3.0, 3.25, 3.5 |
| Pulsar characteristic spin-down timescale, | 0.6, …, 33 |
| Pulsar initial spin-down power cutoff, | 38.0, …, 39.3 |
| Pulsar initial spin-down power mean, | 0.1, …, 0.6 |
| Pulsar initial spin-down power standard deviation, | 0.25, …, 0.75 |
| Pulsar cosmic-ray injection spectral index, | uniform distribution [1.4,1.9], [1.6,1.7], [1.3,1.5] |
| Pulsar mean efficiency and of in pairs | , , |
| Prim. flux normalization, from reference value (see Ref. Cholis and Krommydas (2022a)) | - |
| Sec. flux normalization, from reference value (see Ref. Cholis and Krommydas (2022a)) | - |
| Pulsar flux normalization, | such that |
| Prim. flux spectral index modifier, from reference value (Ref. Cholis and Krommydas (2022a)) | - |
| Sec. flux spectral index modifier, from reference value (Ref. Cholis and Krommydas (2022a)) | - |
| Solar modulation parameter, | - |
| Solar modulation parameter, | - |
| Dark matter flux normalization, | - |
In this appendix we present briefly the parameter space that we test with our astrophysical background models and provide the ranges that the nuisance parameters are allowed to take. This parameter space can be seen in Table 1. The last eight parameters in this Table are free fitting parameters that are optimized while fitting our simulations while the rest of the parameters are fixed and each astrophysical background model has a unique set of pulsar parameters. Not all combinations of astrophysical parameters are allowed based on various observations from pulsars or cosmic rays. For more details on the properties of the constructed astrophysical backgrounds and the parameters describing them, please refer to sections II and III of Ref. Cholis and Krommydas (2022a). The last eight parameters are presented as ranges while the rest are discreet sets separated by commas.
Appendix B Different statistical procedure


In this appendix, we explore a different statistical method for setting upper limits to the dark matter annihilation cross section. In our main analysis, we used a test statistic that tests the presence of a dark matter signal against the null hypothesis of purely conventional astrophysical sources to set our upper limits, i.e. , which lies at the boundary of our parameter space. For this, we made use of Wilks’ Wilks (1938) and Chernoff’s Chernoff (1954) theorems. We will now discuss a slightly different approach that as we show gives similar upper limits. Our combined upper limit bands are roughly the same between the two methods.
Alternatively to the main text, we can use the test statistic,
| (1) |
which is equal to a difference. With we denote all the nuisance parameters of the astrophysical background, while with hats we denote the parameters that maximize the likelihood function. According to Wilks’ theorem, this test statistic follows a -distribution with 1 degree of freedom since now we do not have a hypothesis that lies on the boundary of our parameter space.
Following the standard convention in literature, we can deduce a 95% upper limit on the parameter , by the following procedure. For a fixed annihilation channel and dark matter mass, we find the parameters and that maximize the likelihood function, and then increase until the test statistic reaches the value 3.84. Within that procedure, are the values of the astrophysical nuisance parameters that maximize the likelihood for a given value of . This method of profile likelihood is also called the MINOS method in high energy physics.
The upper limits with this method appear to be similar to the ones created with the method of our main analysis for almost every background. For that reason we include Fig. 8, where we also show the upper limits with this method for the backgrounds of Fig. 3. From this figure, we can see that the upper limits set by this slightly different statistical methodology that doesn’t rely on Chernoff’s theorem are similar to the ones of our main analysis. That is true for every background that we use to construct our upper limit bands. Therefore we claim that the final combined bands of Fig. 5 are robust to both astrophysical background uncertainties and also to the statistical treatment of the positron fraction measurement.
References
- Simon and Geha (2007) Joshua D. Simon and Marla Geha, “The Kinematics of the Ultra-faint Milky Way Satellites: Solving the Missing Satellite Problem,” Astrophys. J. 670, 313–331 (2007), arXiv:0706.0516 [astro-ph] .
- Simon (2019) Joshua D. Simon, “The Faintest Dwarf Galaxies,” Annu. Rev. Astron. Astrophys. 57, 375–415 (2019), arXiv:1901.05465 [astro-ph.GA] .
- Willman et al. (2005a) Beth Willman, Julianne J. Dalcanton, David Martinez-Delgado, Andrew A. West, Michael R. Blanton, David W. Hogg, J. C. Barentine, Howard J. Brewington, Michael Harvanek, S. J. Kleinman, Jurek Krzesinski, Dan Long, Jr. Neilsen, Eric H., Atsuko Nitta, and Stephanie A. Snedden, “A New Milky Way Dwarf Galaxy in Ursa Major,” Astrophys. J. Lett. 626, L85–L88 (2005a), arXiv:astro-ph/0503552 [astro-ph] .
- Willman et al. (2005b) Beth Willman, Michael R. Blanton, Andrew A. West, Julianne J. Dalcanton, David W. Hogg, Donald P. Schneider, Nicholas Wherry, Brian Yanny, and Jon Brinkmann, “A New Milky Way Companion: Unusual Globular Cluster or Extreme Dwarf Satellite?” Astron. J. 129, 2692–2700 (2005b), arXiv:astro-ph/0410416 [astro-ph] .
- Salucci (2019) Paolo Salucci, “The distribution of dark matter in galaxies,” Astron. Astrophys. Rev. 27, 2 (2019), arXiv:1811.08843 [astro-ph.GA] .
- Catena and Ullio (2010) Riccardo Catena and Piero Ullio, “A novel determination of the local dark matter density,” JCAP 08, 004 (2010), arXiv:0907.0018 [astro-ph.CO] .
- Iocco et al. (2011) Fabio Iocco, Miguel Pato, Gianfranco Bertone, and Philippe Jetzer, “Dark Matter distribution in the Milky Way: microlensing and dynamical constraints,” JCAP 11, 029 (2011), arXiv:1107.5810 [astro-ph.GA] .
- Pato et al. (2015) Miguel Pato, Fabio Iocco, and Gianfranco Bertone, “Dynamical constraints on the dark matter distribution in the Milky Way,” JCAP 12, 001 (2015), arXiv:1504.06324 [astro-ph.GA] .
- Bovy and Tremaine (2012) Jo Bovy and Scott Tremaine, “On the local dark matter density,” Astrophys. J. 756, 89 (2012), arXiv:1205.4033 [astro-ph.GA] .
- Allen et al. (2011) Steven W. Allen, August E. Evrard, and Adam B. Mantz, “Cosmological Parameters from Observations of Galaxy Clusters,” Annu. Rev. Astron. Astrophys. 49, 409–470 (2011), arXiv:1103.4829 [astro-ph.CO] .
- Desjacques et al. (2018) Vincent Desjacques, Donghui Jeong, and Fabian Schmidt, “Large-scale galaxy bias,” Physics Reports 733, 1–193 (2018), arXiv:1611.09787 [astro-ph.CO] .
- Clowe et al. (2006) Douglas Clowe, Marusa Bradac, Anthony H. Gonzalez, Maxim Markevitch, Scott W. Randall, Christine Jones, and Dennis Zaritsky, “A direct empirical proof of the existence of dark matter,” Astrophys. J. Lett. 648, L109–L113 (2006), arXiv:astro-ph/0608407 .
- Brownstein and Moffat (2007) J. R. Brownstein and J. W. Moffat, “The Bullet Cluster 1E0657-558 evidence shows Modified Gravity in the absence of Dark Matter,” Mon. Not. Roy. Astron. Soc. 382, 29–47 (2007), arXiv:astro-ph/0702146 .
- Aubourg et al. (2015) Éric Aubourg et al., “Cosmological implications of baryon acoustic oscillation measurements,” Phys. Rev. D 92, 123516 (2015), arXiv:1411.1074 [astro-ph.CO] .
- Carlstrom et al. (2002) John E. Carlstrom, Gilbert P. Holder, and Erik D. Reese, “Cosmology with the Sunyaev-Zel’dovich Effect,” Annu. Rev. Astron. Astrophys. 40, 643–680 (2002), arXiv:astro-ph/0208192 [astro-ph] .
- Cooke et al. (2018) Ryan J. Cooke, Max Pettini, and Charles C. Steidel, “One Percent Determination of the Primordial Deuterium Abundance,” Astrophys. J. 855, 102 (2018), arXiv:1710.11129 [astro-ph.CO] .
- Aghanim et al. (2020) N. Aghanim et al. (Planck), “Planck 2018 results. VI. Cosmological parameters,” Astron. Astrophys. 641, A6 (2020), [Erratum: Astron.Astrophys. 652, C4 (2021)], arXiv:1807.06209 [astro-ph.CO] .
- Schöneberg et al. (2019) Nils Schöneberg, Julien Lesgourgues, and Deanna C. Hooper, “The BAO+BBN take on the Hubble tension,” JCAP 10, 029 (2019), arXiv:1907.11594 [astro-ph.CO] .
- Iocco et al. (2009) Fabio Iocco, Gianpiero Mangano, Gennaro Miele, Ofelia Pisanti, and Pasquale D. Serpico, “Primordial Nucleosynthesis: from precision cosmology to fundamental physics,” Phys. Rept. 472, 1–76 (2009), arXiv:0809.0631 [astro-ph] .
- Pospelov and Pradler (2010) Maxim Pospelov and Josef Pradler, “Big Bang Nucleosynthesis as a Probe of New Physics,” Ann. Rev. Nucl. Part. Sci. 60, 539–568 (2010), arXiv:1011.1054 [hep-ph] .
- Cyburt et al. (2016) Richard H. Cyburt, Brian D. Fields, Keith A. Olive, and Tsung-Han Yeh, “Big Bang Nucleosynthesis: 2015,” Rev. Mod. Phys. 88, 015004 (2016), arXiv:1505.01076 [astro-ph.CO] .
- Cuoco et al. (2004) A. Cuoco, F. Iocco, G. Mangano, G. Miele, Ofelia Pisanti, and P. D. Serpico, “Present status of primordial nucleosynthesis after WMAP: results from a new BBN code,” Int. J. Mod. Phys. A 19, 4431–4454 (2004), arXiv:astro-ph/0307213 .
- White and Frenk (1991) Simon D. M. White and Carlos S. Frenk, “Galaxy Formation through Hierarchical Clustering,” Astrophys. J. 379, 52 (1991).
- Tollerud et al. (2008) Erik J. Tollerud, James S. Bullock, Louis E. Strigari, and Beth Willman, “Hundreds of Milky Way Satellites? Luminosity Bias in the Satellite Luminosity Function,” Astrophys. J. 688, 277–289 (2008), arXiv:0806.4381 [astro-ph] .
- Busca et al. (2013) Nicolas G. Busca et al., “Baryon Acoustic Oscillations in the Ly- forest of BOSS quasars,” Astron. Astrophys. 552, A96 (2013), arXiv:1211.2616 [astro-ph.CO] .
- Kravtsov and Borgani (2012) Andrey V. Kravtsov and Stefano Borgani, “Formation of Galaxy Clusters,” Annu. Rev. Astron. Astrophys. 50, 353–409 (2012), arXiv:1205.5556 [astro-ph.CO] .
- Mantz et al. (2010) A. Mantz, S. W. Allen, D. Rapetti, and H. Ebeling, “The observed growth of massive galaxy clusters - I. Statistical methods and cosmological constraints,” Mon. Not. R. Astron. Soc. 406, 1759–1772 (2010), arXiv:0909.3098 [astro-ph.CO] .
- Hernquist et al. (1996) Lars Hernquist, Neal Katz, David H. Weinberg, and Jordi Miralda-Escudé, “The Lyman-Alpha Forest in the Cold Dark Matter Model,” Astrophys. J. Lett. 457, L51 (1996), arXiv:astro-ph/9509105 [astro-ph] .
- Garzilli et al. (2021) Antonella Garzilli, Andrii Magalich, Oleg Ruchayskiy, and Alexey Boyarsky, “How to constrain warm dark matter with the Lyman- forest,” Mon. Not. Roy. Astron. Soc. 502, 2356–2363 (2021), arXiv:1912.09397 [astro-ph.CO] .
- Kobzarev et al. (1966) I. Yu. Kobzarev, L. B. Okun, and I. Ya. Pomeranchuk, “On the possibility of experimental observation of mirror particles,” Sov. J. Nucl. Phys. 3, 837–841 (1966).
- Carr and Hawking (1974) Bernard J. Carr and S. W. Hawking, “Black holes in the early Universe,” Mon. Not. Roy. Astron. Soc. 168, 399–415 (1974).
- Meszaros (1974) P. Meszaros, “The behaviour of point masses in an expanding cosmological substratum,” Astron. Astrophys. 37, 225–228 (1974).
- Carr (1975) B. J. Carr, “The primordial black hole mass spectrum.” Astrophys. J. 201, 1–19 (1975).
- Weinberg (1978) Steven Weinberg, “A New Light Boson?” Phys. Rev. Lett. 40, 223–226 (1978).
- Wilczek (1978) Frank Wilczek, “Problem of Strong and Invariance in the Presence of Instantons,” Phys. Rev. Lett. 40, 279–282 (1978).
- Preskill et al. (1983) John Preskill, Mark B. Wise, and Frank Wilczek, “Cosmology of the invisible axion,” Physics Letters B 120, 127–132 (1983).
- Dine and Fischler (1983) Michael Dine and Willy Fischler, “The Not So Harmless Axion,” Phys. Lett. B 120, 137–141 (1983).
- Abbott and Sikivie (1983) L. F. Abbott and P. Sikivie, “A Cosmological Bound on the Invisible Axion,” Phys. Lett. B 120, 133–136 (1983).
- Berezhiani et al. (1996) Z. G. Berezhiani, A. D. Dolgov, and R. N. Mohapatra, “Asymmetric inflationary reheating and the nature of mirror universe,” Phys. Lett. B 375, 26–36 (1996), arXiv:hep-ph/9511221 .
- Svrcek and Witten (2006) Peter Svrcek and Edward Witten, “Axions In String Theory,” JHEP 06, 051 (2006), arXiv:hep-th/0605206 .
- Strassler (2006) Matthew J. Strassler, “Possible effects of a hidden valley on supersymmetric phenomenology,” (2006), arXiv:hep-ph/0607160 .
- Hooper and Zurek (2008) Dan Hooper and Kathryn M. Zurek, “A Natural Supersymmetric Model with MeV Dark Matter,” Phys. Rev. D 77, 087302 (2008), arXiv:0801.3686 [hep-ph] .
- Arkani-Hamed and Weiner (2008) Nima Arkani-Hamed and Neal Weiner, “LHC Signals for a SuperUnified Theory of Dark Matter,” JHEP 12, 104 (2008), arXiv:0810.0714 [hep-ph] .
- Hall et al. (2010) Lawrence J. Hall, Karsten Jedamzik, John March-Russell, and Stephen M. West, “Freeze-In Production of FIMP Dark Matter,” JHEP 03, 080 (2010), arXiv:0911.1120 [hep-ph] .
- Feng (2010) Jonathan L. Feng, “Dark Matter Candidates from Particle Physics and Methods of Detection,” Ann. Rev. Astron. Astrophys. 48, 495–545 (2010), arXiv:1003.0904 [astro-ph.CO] .
- Graham et al. (2015) Peter W. Graham, David E. Kaplan, and Surjeet Rajendran, “Cosmological Relaxation of the Electroweak Scale,” Phys. Rev. Lett. 115, 221801 (2015), arXiv:1504.07551 [hep-ph] .
- Bertone and Hooper (2018) Gianfranco Bertone and Dan Hooper, “History of dark matter,” Rev. Mod. Phys. 90, 045002 (2018), arXiv:1605.04909 [astro-ph.CO] .
- Hochberg et al. (2014) Yonit Hochberg, Eric Kuflik, Tomer Volansky, and Jay G. Wacker, “Mechanism for Thermal Relic Dark Matter of Strongly Interacting Massive Particles,” Phys. Rev. Lett. 113, 171301 (2014), arXiv:1402.5143 [hep-ph] .
- Hochberg et al. (2015) Yonit Hochberg, Eric Kuflik, Hitoshi Murayama, Tomer Volansky, and Jay G. Wacker, “Model for Thermal Relic Dark Matter of Strongly Interacting Massive Particles,” Phys. Rev. Lett. 115, 021301 (2015), arXiv:1411.3727 [hep-ph] .
- Drewes et al. (2017) M. Drewes et al., “A White Paper on keV Sterile Neutrino Dark Matter,” JCAP 01, 025 (2017), arXiv:1602.04816 [hep-ph] .
- Kahn et al. (2017) Yonatan Kahn, Gordan Krnjaic, Siddharth Mishra-Sharma, and Tim M. P. Tait, “Light Weakly Coupled Axial Forces: Models, Constraints, and Projections,” JHEP 05, 002 (2017), arXiv:1609.09072 [hep-ph] .
- Bird et al. (2016) Simeon Bird, Ilias Cholis, Julian B. Muñoz, Yacine Ali-Haïmoud, Marc Kamionkowski, Ely D. Kovetz, Alvise Raccanelli, and Adam G. Riess, “Did LIGO detect dark matter?” Phys. Rev. Lett. 116, 201301 (2016), arXiv:1603.00464 [astro-ph.CO] .
- Carr et al. (2016) Bernard Carr, Florian Kuhnel, and Marit Sandstad, “Primordial Black Holes as Dark Matter,” Phys. Rev. D 94, 083504 (2016), arXiv:1607.06077 [astro-ph.CO] .
- Battaglieri et al. (2017) Marco Battaglieri et al., “US Cosmic Visions: New Ideas in Dark Matter 2017: Community Report,” in U.S. Cosmic Visions: New Ideas in Dark Matter (2017) arXiv:1707.04591 [hep-ph] .
- Steigman et al. (2012) Gary Steigman, Basudeb Dasgupta, and John F. Beacom, “Precise Relic WIMP Abundance and its Impact on Searches for Dark Matter Annihilation,” Phys. Rev. D 86, 023506 (2012), arXiv:1204.3622 [hep-ph] .
- Roszkowski et al. (2018) Leszek Roszkowski, Enrico Maria Sessolo, and Sebastian Trojanowski, “WIMP dark matter candidates and searches—current status and future prospects,” Rept. Prog. Phys. 81, 066201 (2018), arXiv:1707.06277 [hep-ph] .
- Griest and Kamionkowski (1990) Kim Griest and Marc Kamionkowski, “Unitarity Limits on the Mass and Radius of Dark Matter Particles,” Phys. Rev. Lett. 64, 615 (1990).
- Gunion et al. (2000) John F. Gunion, Howard E. Haber, Gordon L. Kane, and Sally Dawson, The Higgs Hunter’s Guide, Vol. 80 (2000).
- Goodenough and Hooper (2009) Lisa Goodenough and Dan Hooper, “Possible Evidence For Dark Matter Annihilation In The Inner Milky Way From The Fermi Gamma Ray Space Telescope,” (2009), arXiv:0910.2998 [hep-ph] .
- Vitale and Morselli (2009) Vincenzo Vitale and Aldo Morselli (Fermi-LAT), “Indirect Search for Dark Matter from the center of the Milky Way with the Fermi-Large Area Telescope,” in 2009 Fermi Symposium (2009) arXiv:0912.3828 [astro-ph.HE] .
- Hooper and Goodenough (2011) Dan Hooper and Lisa Goodenough, “Dark Matter Annihilation in The Galactic Center As Seen by the Fermi Gamma Ray Space Telescope,” Phys. Lett. B 697, 412–428 (2011), arXiv:1010.2752 [hep-ph] .
- Hooper and Linden (2011) Dan Hooper and Tim Linden, “On The Origin Of The Gamma Rays From The Galactic Center,” Phys. Rev. D 84, 123005 (2011), arXiv:1110.0006 [astro-ph.HE] .
- Gordon and Macias (2013) Chris Gordon and Oscar Macias, “Dark Matter and Pulsar Model Constraints from Galactic Center Fermi-LAT Gamma Ray Observations,” Phys. Rev. D 88, 083521 (2013), [Erratum: Phys.Rev.D 89, 049901 (2014)], arXiv:1306.5725 [astro-ph.HE] .
- Daylan et al. (2016) Tansu Daylan, Douglas P. Finkbeiner, Dan Hooper, Tim Linden, Stephen K. N. Portillo, Nicholas L. Rodd, and Tracy R. Slatyer, “The characterization of the gamma-ray signal from the central Milky Way: A case for annihilating dark matter,” Phys. Dark Univ. 12, 1–23 (2016), arXiv:1402.6703 [astro-ph.HE] .
- Calore et al. (2015a) Francesca Calore, Ilias Cholis, and Christoph Weniger, “Background Model Systematics for the Fermi GeV Excess,” JCAP 03, 038 (2015a), arXiv:1409.0042 [astro-ph.CO] .
- Calore et al. (2015b) Francesca Calore, Ilias Cholis, Christopher McCabe, and Christoph Weniger, “A Tale of Tails: Dark Matter Interpretations of the Fermi GeV Excess in Light of Background Model Systematics,” Phys. Rev. D 91, 063003 (2015b), arXiv:1411.4647 [hep-ph] .
- Abazajian et al. (2014) Kevork N. Abazajian, Nicolas Canac, Shunsaku Horiuchi, and Manoj Kaplinghat, “Astrophysical and Dark Matter Interpretations of Extended Gamma-Ray Emission from the Galactic Center,” Phys. Rev. D 90, 023526 (2014), arXiv:1402.4090 [astro-ph.HE] .
- Ajello et al. (2016) M. Ajello et al. (Fermi-LAT), “Fermi-LAT Observations of High-Energy -Ray Emission Toward the Galactic Center,” Astrophys. J. 819, 44 (2016), arXiv:1511.02938 [astro-ph.HE] .
- Di Mauro (2021) Mattia Di Mauro, “Characteristics of the Galactic Center excess measured with 11 years of -LAT data,” Phys. Rev. D 103, 063029 (2021), arXiv:2101.04694 [astro-ph.HE] .
- Cholis et al. (2022) Ilias Cholis, Yi-Ming Zhong, Samuel D. McDermott, and Joseph P. Surdutovich, “Return of the templates: Revisiting the Galactic Center excess with multimessenger observations,” Phys. Rev. D 105, 103023 (2022), arXiv:2112.09706 [astro-ph.HE] .
- Cuoco et al. (2016) Alessandro Cuoco, Michael Krämer, and Michael Korsmeier, “Novel dark matter constraints from antiprotons in the light of AMS-02,” (2016), arXiv:1610.03071 [astro-ph.HE] .
- Cui et al. (2017) Ming-Yang Cui, Qiang Yuan, Yue-Lin Sming Tsai, and Yi-Zhong Fan, “Possible dark matter annihilation signal in the AMS-02 antiproton data,” Phys. Rev. Lett. 118, 191101 (2017), arXiv:1610.03840 [astro-ph.HE] .
- Cholis et al. (2019) Ilias Cholis, Tim Linden, and Dan Hooper, “A Robust Excess in the Cosmic-Ray Antiproton Spectrum: Implications for Annihilating Dark Matter,” Phys. Rev. D 99, 103026 (2019), arXiv:1903.02549 [astro-ph.HE] .
- Cuoco et al. (2019) Alessandro Cuoco, Jan Heisig, Lukas Klamt, Michael Korsmeier, and Michael Krämer, “Scrutinizing the evidence for dark matter in cosmic-ray antiprotons,” Phys. Rev. D 99, 103014 (2019), arXiv:1903.01472 [astro-ph.HE] .
- Aguilar et al. (2021) M. Aguilar et al. (AMS), “The Alpha Magnetic Spectrometer (AMS) on the international space station: Part II — Results from the first seven years,” Phys. Rept. 894, 1–116 (2021).
- Aguilar et al. (2019a) M. Aguilar et al. (AMS), “Towards Understanding the Origin of Cosmic-Ray Positrons,” Phys. Rev. Lett. 122, 041102 (2019a).
- Bergstrom et al. (1999) Lars Bergstrom, Joakim Edsjo, and Piero Ullio, “Cosmic anti-protons as a probe for supersymmetric dark matter?” Astrophys. J. 526, 215–235 (1999), arXiv:astro-ph/9902012 [astro-ph] .
- Hooper et al. (2004) Dan Hooper, James E. Taylor, and Joseph Silk, “Can supersymmetry naturally explain the positron excess?” Phys. Rev. D69, 103509 (2004), arXiv:hep-ph/0312076 [hep-ph] .
- Profumo and Ullio (2004) Stefano Profumo and Piero Ullio, “The Role of antimatter searches in the hunt for supersymmetric dark matter,” JCAP 0407, 006 (2004), arXiv:hep-ph/0406018 [hep-ph] .
- Bringmann and Salati (2007) Torsten Bringmann and Pierre Salati, “The galactic antiproton spectrum at high energies: Background expectation vs. exotic contributions,” Phys. Rev. D75, 083006 (2007), arXiv:astro-ph/0612514 [astro-ph] .
- Pato et al. (2010) Miguel Pato, Dan Hooper, and Melanie Simet, “Pinpointing Cosmic Ray Propagation With The AMS-02 Experiment,” JCAP 1006, 022 (2010), arXiv:1002.3341 [astro-ph.HE] .
- Bergstrom et al. (2013) Lars Bergstrom, Torsten Bringmann, Ilias Cholis, Dan Hooper, and Christoph Weniger, “New limits on dark matter annihilation from AMS cosmic ray positron data,” Phys.Rev.Lett. 111, 171101 (2013), arXiv:1306.3983 [astro-ph.HE] .
- Ibarra et al. (2014) Alejandro Ibarra, Anna S. Lamperstorfer, and Joseph Silk, “Dark matter annihilations and decays after the AMS-02 positron measurements,” Phys. Rev. D 89, 063539 (2014), arXiv:1309.2570 [hep-ph] .
- John and Linden (2021) Isabelle John and Tim Linden, “Cosmic-ray positrons strongly constrain leptophilic dark matter,” JCAP 12, 007 (2021), arXiv:2107.10261 [astro-ph.HE] .
- Adriani et al. (2009) O. Adriani et al., “An anomalous positron abundance in cosmic rays with energies 1.5-100GeV,” Nature (London) 458, 607–609 (2009), arXiv:0810.4995 [astro-ph] .
- Adriani et al. (2013) O. Adriani et al. (PAMELA), “Cosmic-Ray Positron Energy Spectrum Measured by PAMELA,” Phys. Rev. Lett. 111, 081102 (2013), arXiv:1308.0133 [astro-ph.HE] .
- Ackermann et al. (2012) M. Ackermann et al., “Measurement of Separate Cosmic-Ray Electron and Positron Spectra with the Fermi Large Area Telescope,” Phys. Rev. Lett. 108, 011103 (2012), arXiv:1109.0521 [astro-ph.HE] .
- Accardo et al. (2014) L. Accardo et al. (AMS), “High Statistics Measurement of the Positron Fraction in Primary Cosmic Rays of 0.5–500 GeV with the Alpha Magnetic Spectrometer on the International Space Station,” Phys. Rev. Lett. 113, 121101 (2014).
- Aguilar et al. (2019b) M. Aguilar et al. (AMS), “Towards Understanding the Origin of Cosmic-Ray Electrons,” Phys. Rev. Lett. 122, 101101 (2019b).
- Harding and Ramaty (1987) A. K. Harding and R. Ramaty, “The Pulsar Contribution to Galactic Cosmic Ray Positrons,” International Cosmic Ray Conference 2, 92 (1987).
- Atoyan et al. (1995) A. M. Atoyan, F. A. Aharonian, and H. J. Völk, “Electrons and positrons in the galactic cosmic rays,” Phys. Rev. D 52, 3265–3275 (1995).
- Aharonian et al. (1995) F. A. Aharonian, A. M. Atoyan, and H. J. Voelk, “High energy electrons and positrons in cosmic rays as an indicator of the existence of a nearby cosmic tevatron,” Astron. Astrophys. 294, L41–L44 (1995).
- Hooper et al. (2009) Dan Hooper, Pasquale Blasi, and Pasquale Dario Serpico, “Pulsars as the Sources of High Energy Cosmic Ray Positrons,” JCAP 0901, 025 (2009), arXiv:0810.1527 [astro-ph] .
- Yuksel et al. (2009) Hasan Yuksel, Matthew D. Kistler, and Todor Stanev, “TeV Gamma Rays from Geminga and the Origin of the GeV Positron Excess,” Phys. Rev. Lett. 103, 051101 (2009), arXiv:0810.2784 [astro-ph] .
- Profumo (2011) Stefano Profumo, “Dissecting cosmic-ray electron-positron data with Occam’s Razor: the role of known Pulsars,” Central Eur. J. Phys. 10, 1–31 (2011), arXiv:0812.4457 [astro-ph] .
- Malyshev et al. (2009) Dmitry Malyshev, Ilias Cholis, and Joseph Gelfand, “Pulsars versus Dark Matter Interpretation of ATIC/PAMELA,” Phys. Rev. D80, 063005 (2009), arXiv:0903.1310 [astro-ph.HE] .
- Kawanaka et al. (2010) Norita Kawanaka, Kunihito Ioka, and Mihoko M. Nojiri, “Cosmic-Ray Electron Excess from Pulsars is Spiky or Smooth?: Continuous and Multiple Electron/Positron injections,” Astrophys. J. 710, 958–963 (2010), arXiv:0903.3782 [astro-ph.HE] .
- Grasso et al. (2009) D. Grasso et al. (Fermi-LAT), “On possible interpretations of the high energy electron-positron spectrum measured by the Fermi Large Area Telescope,” Astropart. Phys. 32, 140–151 (2009), arXiv:0905.0636 [astro-ph.HE] .
- Heyl et al. (2010) Jeremy S. Heyl, Ramandeep Gill, and Lars Hernquist, “Cosmic rays from pulsars and magnetars,” Mon. Not. R. Astron. Soc. 406, L25–L29 (2010), arXiv:1005.1003 [astro-ph.HE] .
- Linden and Profumo (2013) Tim Linden and Stefano Profumo, “Probing the Pulsar Origin of the Anomalous Positron Fraction with AMS-02 and Atmospheric Cherenkov Telescopes,” Astrophys.J. 772, 18 (2013), arXiv:1304.1791 [astro-ph.HE] .
- Cholis and Hooper (2013) Ilias Cholis and Dan Hooper, “Dark Matter and Pulsar Origins of the Rising Cosmic Ray Positron Fraction in Light of New Data From AMS,” Phys. Rev. D88, 023013 (2013), arXiv:1304.1840 [astro-ph.HE] .
- Yuan et al. (2015) Q. Yuan et al., “Implications of the AMS-02 positron fraction in cosmic rays,” Astropart. Phys. 60, 1–12 (2015), arXiv:1304.1482 [astro-ph.HE] .
- Yin et al. (2013) Peng-Fei Yin, Zhao-Huan Yu, Qiang Yuan, and Xiao-Jun Bi, “Pulsar interpretation for the AMS-02 result,” Phys. Rev. D88, 023001 (2013), arXiv:1304.4128 [astro-ph.HE] .
- Cholis et al. (2018a) Ilias Cholis, Tanvi Karwal, and Marc Kamionkowski, “Studying the Milky Way pulsar population with cosmic-ray leptons,” Phys. Rev. D 98, 063008 (2018a), arXiv:1807.05230 [astro-ph.HE] .
- Evoli et al. (2021) Carmelo Evoli, Elena Amato, Pasquale Blasi, and Roberto Aloisio, “Galactic factories of cosmic-ray electrons and positrons,” Phys. Rev. D 103, 083010 (2021), arXiv:2010.11955 [astro-ph.HE] .
- Manconi et al. (2021) Silvia Manconi, Mattia Di Mauro, and Fiorenza Donato, “Detection of a -ray halo around Geminga with the -LAT and implications for the positron flux,” PoS ICRC2019, 580 (2021).
- Orusa et al. (2021) Luca Orusa, Silvia Manconi, Fiorenza Donato, and Mattia Di Mauro, “Constraining positron emission from pulsar populations with AMS-02 data,” (2021), arXiv:2107.06300 [astro-ph.HE] .
- Cholis and Krommydas (2022a) Ilias Cholis and Iason Krommydas, “Utilizing cosmic-ray positron and electron observations to probe the averaged properties of Milky Way pulsars,” Phys. Rev. D 105, 023015 (2022a), arXiv:2111.05864 [astro-ph.HE] .
- Blasi (2009) Pasquale Blasi, “The origin of the positron excess in cosmic rays,” Phys. Rev. Lett. 103, 051104 (2009), arXiv:0903.2794 [astro-ph.HE] .
- Mertsch and Sarkar (2009) Philipp Mertsch and Subir Sarkar, “Testing astrophysical models for the PAMELA positron excess with cosmic ray nuclei,” Phys. Rev. Lett. 103, 081104 (2009), arXiv:0905.3152 [astro-ph.HE] .
- Ahlers et al. (2009) Markus Ahlers, Philipp Mertsch, and Subir Sarkar, “On cosmic ray acceleration in supernova remnants and the FERMI/PAMELA data,” Phys. Rev. D80, 123017 (2009), arXiv:0909.4060 [astro-ph.HE] .
- Blasi and Serpico (2009) Pasquale Blasi and Pasquale D. Serpico, “High-energy antiprotons from old supernova remnants,” Phys.Rev.Lett. 103, 081103 (2009), arXiv:0904.0871 [astro-ph.HE] .
- Kawanaka et al. (2011) Norita Kawanaka, Kunihito Ioka, Yutaka Ohira, and Kazumi Kashiyama, “TeV Electron Spectrum for Probing Cosmic-Ray Escape from a Supernova Remnant,” Astrophys. J. 729, 93 (2011), arXiv:1009.1142 [astro-ph.HE] .
- Fujita et al. (2009) Yutaka Fujita, Kazunori Kohri, Ryo Yamazaki, and Kunihito Ioka, “Is the PAMELA anomaly caused by the supernova explosions near the Earth?” Phys. Rev. D80, 063003 (2009), arXiv:0903.5298 [astro-ph.HE] .
- Di Mauro et al. (2014) M. Di Mauro, F. Donato, N. Fornengo, R. Lineros, and A. Vittino, “Interpretation of AMS-02 electrons and positrons data,” JCAP 1404, 006 (2014), arXiv:1402.0321 [astro-ph.HE] .
- Kohri et al. (2016) Kazunori Kohri, Kunihito Ioka, Yutaka Fujita, and Ryo Yamazaki, “Can we explain AMS-02 antiproton and positron excesses simultaneously by nearby supernovae without pulsars or dark matter?” PTEP 2016, 021E01 (2016), arXiv:1505.01236 [astro-ph.HE] .
- Mertsch (2018) Philipp Mertsch, “Stochastic cosmic ray sources and the TeV break in the all-electron spectrum,” JCAP 11, 045 (2018), arXiv:1809.05104 [astro-ph.HE] .
- Cholis and Hooper (2014) Ilias Cholis and Dan Hooper, “Constraining the origin of the rising cosmic ray positron fraction with the boron-to-carbon ratio,” Phys. Rev. D89, 043013 (2014), arXiv:1312.2952 [astro-ph.HE] .
- Mertsch and Sarkar (2014) Philipp Mertsch and Subir Sarkar, “AMS-02 data confront acceleration of cosmic ray secondaries in nearby sources,” Phys. Rev. D90, 061301 (2014), arXiv:1402.0855 [astro-ph.HE] .
- Cholis et al. (2017) Ilias Cholis, Dan Hooper, and Tim Linden, “Possible Evidence for the Stochastic Acceleration of Secondary Antiprotons by Supernova Remnants,” Phys. Rev. D95, 123007 (2017), arXiv:1701.04406 [astro-ph.HE] .
- Tomassetti and Oliva (2017) Nicola Tomassetti and Alberto Oliva, “Production and acceleration of antinuclei in supernova shockwaves,” Astrophys. J. 844, L26 (2017), arXiv:1707.06915 [astro-ph.HE] .
- Gaggero et al. (2013) Daniele Gaggero, Luca Maccione, Giuseppe Di Bernardo, Carmelo Evoli, and Dario Grasso, “Three-Dimensional Model of Cosmic-Ray Lepton Propagation Reproduces Data from the Alpha Magnetic Spectrometer on the International Space Station,” Phys. Rev. Lett. 111, 021102 (2013), arXiv:1304.6718 [astro-ph.HE] .
- Cowsik et al. (2014) R. Cowsik, B. Burch, and T. Madziwa-Nussinov, “The origin of the spectral intensities of cosmic-ray positrons,” Astrophys. J. 786, 124 (2014), arXiv:1305.1242 [astro-ph.HE] .
- Gaggero et al. (2014) Daniele Gaggero, Luca Maccione, Dario Grasso, Giuseppe Di Bernardo, and Carmelo Evoli, “PAMELA and AMS-02 and spectra are reproduced by three-dimensional cosmic-ray modeling,” Phys. Rev. D 89, 083007 (2014), arXiv:1311.5575 [astro-ph.HE] .
- Bergstrom et al. (2008) Lars Bergstrom, Torsten Bringmann, and Joakim Edsjo, “New Positron Spectral Features from Supersymmetric Dark Matter - a Way to Explain the PAMELA Data?” Phys. Rev. D78, 103520 (2008), arXiv:0808.3725 [astro-ph] .
- Cirelli and Strumia (2008) Marco Cirelli and Alessandro Strumia, “Minimal Dark Matter predictions and the PAMELA positron excess,” Proceedings, 7th International Workshop on the Identification of Dark Matter (IDM 2008): Stockholm, Sweden, August 18-22, 2008, PoS IDM2008, 089 (2008), arXiv:0808.3867 [astro-ph] .
- Cholis et al. (2009a) Ilias Cholis, Lisa Goodenough, Dan Hooper, Melanie Simet, and Neal Weiner, “High Energy Positrons From Annihilating Dark Matter,” Phys. Rev. D80, 123511 (2009a), arXiv:0809.1683 [hep-ph] .
- Cirelli et al. (2009) Marco Cirelli, Mario Kadastik, Martti Raidal, and Alessandro Strumia, “Model-independent implications of the e+-, anti-proton cosmic ray spectra on properties of Dark Matter,” Nucl. Phys. B813, 1–21 (2009), [Addendum: Nucl. Phys.B873,530(2013)], arXiv:0809.2409 [hep-ph] .
- Nelson and Spitzer (2010) Ann E. Nelson and Christopher Spitzer, “Slightly Non-Minimal Dark Matter in PAMELA and ATIC,” JHEP 10, 066 (2010), arXiv:0810.5167 [hep-ph] .
- Arkani-Hamed et al. (2009) Nima Arkani-Hamed, Douglas P. Finkbeiner, Tracy R. Slatyer, and Neal Weiner, “A Theory of Dark Matter,” Phys. Rev. D79, 015014 (2009), arXiv:0810.0713 [hep-ph] .
- Cholis et al. (2009b) Ilias Cholis, Douglas P. Finkbeiner, Lisa Goodenough, and Neal Weiner, “The PAMELA Positron Excess from Annihilations into a Light Boson,” JCAP 0912, 007 (2009b), arXiv:0810.5344 [astro-ph] .
- Cholis et al. (2009c) Ilias Cholis, Gregory Dobler, Douglas P. Finkbeiner, Lisa Goodenough, and Neal Weiner, “The Case for a 700+ GeV WIMP: Cosmic Ray Spectra from ATIC and PAMELA,” Phys. Rev. D80, 123518 (2009c), arXiv:0811.3641 [astro-ph] .
- Harnik and Kribs (2009) Roni Harnik and Graham D. Kribs, “An Effective Theory of Dirac Dark Matter,” Phys. Rev. D79, 095007 (2009), arXiv:0810.5557 [hep-ph] .
- Fox and Poppitz (2009) Patrick J. Fox and Erich Poppitz, “Leptophilic Dark Matter,” Phys. Rev. D79, 083528 (2009), arXiv:0811.0399 [hep-ph] .
- Pospelov and Ritz (2009) Maxim Pospelov and Adam Ritz, “Astrophysical Signatures of Secluded Dark Matter,” Phys. Lett. B671, 391–397 (2009), arXiv:0810.1502 [hep-ph] .
- March-Russell and West (2009) John David March-Russell and Stephen Mathew West, “WIMPonium and Boost Factors for Indirect Dark Matter Detection,” Phys. Lett. B676, 133–139 (2009), arXiv:0812.0559 [astro-ph] .
- Chang and Goodenough (2011) Spencer Chang and Lisa Goodenough, “Charge Asymmetric Cosmic Ray Signals From Dark Matter Decay,” Phys. Rev. D84, 023524 (2011), arXiv:1105.3976 [hep-ph] .
- Dienes et al. (2013) Keith R. Dienes, Jason Kumar, and Brooks Thomas, “Dynamical Dark Matter and the positron excess in light of AMS results,” Phys. Rev. D88, 103509 (2013), arXiv:1306.2959 [hep-ph] .
- Finkbeiner and Weiner (2007) Douglas P. Finkbeiner and Neal Weiner, “Exciting Dark Matter and the INTEGRAL/SPI 511 keV signal,” Phys. Rev. D76, 083519 (2007), arXiv:astro-ph/0702587 [astro-ph] .
- Kopp (2013) Joachim Kopp, “Constraints on dark matter annihilation from AMS-02 results,” Phys. Rev. D88, 076013 (2013), arXiv:1304.1184 [hep-ph] .
- Dev et al. (2014) P. S. Bhupal Dev, Dilip Kumar Ghosh, Nobuchika Okada, and Ipsita Saha, “Neutrino Mass and Dark Matter in light of recent AMS-02 results,” Phys. Rev. D89, 095001 (2014), arXiv:1307.6204 [hep-ph] .
- Klasen et al. (2015) Michael Klasen, Martin Pohl, and Günter Sigl, “Indirect and direct search for dark matter,” Prog. Part. Nucl. Phys. 85, 1–32 (2015), arXiv:1507.03800 [hep-ph] .
- Yuan and Feng (2018) Qiang Yuan and Lei Feng, “Dark Matter Particle Explorer observations of high-energy cosmic ray electrons plus positrons and their physical implications,” Sci. China Phys. Mech. Astron. 61, 101002 (2018), arXiv:1807.11638 [astro-ph.HE] .
- Sun and Dai (2021) Xudong Sun and Ben-Zhong Dai, “Dark matter annihilation into leptons through gravity portals,” JHEP 04, 108 (2021), arXiv:2008.02994 [hep-ph] .
- Evoli et al. (2018) Carmelo Evoli, Tim Linden, and Giovanni Morlino, “Self-generated cosmic-ray confinement in TeV halos: Implications for TeV -ray emission and the positron excess,” Phys. Rev. D 98, 063017 (2018), arXiv:1807.09263 [astro-ph.HE] .
- Cholis et al. (2018b) Ilias Cholis, Tanvi Karwal, and Marc Kamionkowski, “Features in the Spectrum of Cosmic-Ray Positrons from Pulsars,” Phys. Rev. D 97, 123011 (2018b), arXiv:1712.00011 [astro-ph.HE] .
- Adriani et al. (2018) O. Adriani et al., “Extended Measurement of the Cosmic-Ray Electron and Positron Spectrum from 11 GeV to 4.8 TeV with the Calorimetric Electron Telescope on the International Space Station,” Phys. Rev. Lett. 120, 261102 (2018), arXiv:1806.09728 [astro-ph.HE] .
- Ambrosi et al. (2017a) G. Ambrosi et al. (DAMPE), “Direct detection of a break in the teraelectronvolt cosmic-ray spectrum of electrons and positrons,” Nature 552, 63–66 (2017a), arXiv:1711.10981 [astro-ph.HE] .
- Ambrosi et al. (2017b) G. Ambrosi et al. (DAMPE), “Direct detection of a break in the teraelectronvolt cosmic-ray spectrum of electrons and positrons,” (2017b), 10.1038/nature24475, arXiv:1711.10981 [astro-ph.HE] .
- Salucci et al. (2010) P. Salucci, F. Nesti, G. Gentile, and C. F. Martins, “The dark matter density at the Sun’s location,” Astron. Astrophys. 523, A83 (2010), arXiv:1003.3101 [astro-ph.GA] .
- Navarro et al. (1996) Julio F. Navarro, Carlos S. Frenk, and Simon D. M. White, “The Structure of cold dark matter halos,” Astrophys. J. 462, 563–575 (1996), arXiv:astro-ph/9508025 .
- Cirelli et al. (2011) Marco Cirelli, Gennaro Corcella, Andi Hektor, Gert Hutsi, Mario Kadastik, et al., “PPPC 4 DM ID: A Poor Particle Physicist Cookbook for Dark Matter Indirect Detection,” JCAP 1103, 051 (2011), 57 pages with many figures and tables. v2: several discussions and references added, some figures improved, matches version published on JCAP. v3: a few typos corrected and some references updated. All results are available at http://www.marcocirelli.net/PPPC4DMID.html, arXiv:1012.4515 [hep-ph] . %%CITATION = ARXIV:1012.4515;%%
- (153) https://galprop.stanford.edu/, .
- Strong and Moskalenko (1998) A. W. Strong and I. V. Moskalenko, “Propagation of cosmic-ray nucleons in the Galaxy,” Astrophys. J. 509, 212–228 (1998), arXiv:astro-ph/9807150 . %%CITATION = ASTRO-PH/9807150;%%
- Trotta et al. (2011) R. Trotta, G. Johannesson, I. V. Moskalenko, T. A. Porter, R. Ruiz de Austri, and A. W. Strong, “Constraints on cosmic-ray propagation models from a global Bayesian analysis,” Astrophys. J. 729, 106 (2011), arXiv:1011.0037 [astro-ph.HE] .
- Cholis et al. (2016) Ilias Cholis, Dan Hooper, and Tim Linden, “A Predictive Analytic Model for the Solar Modulation of Cosmic Rays,” Phys. Rev. D93, 043016 (2016), arXiv:1511.01507 [astro-ph.SR] .
- Cholis et al. (2020) Ilias Cholis, Dan Hooper, and Tim Linden, “Constraining the Charge-Sign and Rigidity-Dependence of Solar Modulation,” (2020), arXiv:2007.00669 [astro-ph.HE] .
- Cholis and McKinnon (2022) Ilias Cholis and Ian McKinnon, “Constraining the Charge-, Time- and Rigidity-Dependence of Cosmic-Ray Solar Modulation with AMS-02 Observations during Solar Cycle 24,” (2022), arXiv:2207.12447 [astro-ph.SR] .
- Virtanen et al. (2020) P. Virtanen et al., “SciPy 1.0: Fundamental Algorithms for Scientific Computing in Python,” Nature Methods 17, 261–272 (2020).
- Dembinski and et al. (2020) Hans Dembinski and Piti Ongmongkolkul et al., “scikit-hep/iminuit,” (2020), 10.5281/zenodo.3949207.
- James and Roos (1975) F. James and M. Roos, “Minuit: A System for Function Minimization and Analysis of the Parameter Errors and Correlations,” Comput. Phys. Commun. 10, 343–367 (1975).
- Cholis and Krommydas (2022b) Ilias Cholis and Iason Krommydas, “Possible counterpart signal of the Fermi bubbles at the cosmic-ray positrons,” (2022b), arXiv:2208.07880 [astro-ph.HE] .
- Wilks (1938) S. S. Wilks, “The Large-Sample Distribution of the Likelihood Ratio for Testing Composite Hypotheses,” The Annals of Mathematical Statistics 9, 60 – 62 (1938).
- Chernoff (1954) Herman Chernoff, “On the Distribution of the Likelihood Ratio,” The Annals of Mathematical Statistics 25, 573 – 578 (1954).
- Conrad (2015) Jan Conrad, “Statistical Issues in Astrophysical Searches for Particle Dark Matter,” Astropart. Phys. 62, 165–177 (2015), arXiv:1407.6617 [astro-ph.CO] .
- Albert et al. (2017) A. Albert et al. (Fermi-LAT, DES), “Searching for Dark Matter Annihilation in Recently Discovered Milky Way Satellites with Fermi-LAT,” Astrophys. J. 834, 110 (2017), arXiv:1611.03184 [astro-ph.HE] .
- Schael et al. (2019) S. Schael et al., “AMS-100: The next generation magnetic spectrometer in space – An international science platform for physics and astrophysics at Lagrange point 2,” Nucl. Instrum. Meth. A 944, 162561 (2019), arXiv:1907.04168 [astro-ph.IM] .
- Van Rossum and Drake (2009) Guido Van Rossum and Fred L. Drake, Python 3 Reference Manual (CreateSpace, Scotts Valley, CA, 2009).
- Harris et al. (2020) Charles R. Harris et al., “Array programming with NumPy,” Nature 585, 357–362 (2020).
- pandas development team (2020) The pandas development team, “pandas-dev/pandas: Pandas,” (2020), 10.5281/zenodo.3509134.
- Wes McKinney (2010) Wes McKinney, “Data Structures for Statistical Computing in Python,” in Proceedings of the 9th Python in Science Conference, edited by Stéfan van der Walt and Jarrod Millman (2010) pp. 56 – 61.
- Hunter (2007) J. D. Hunter, “Matplotlib: A 2d graphics environment,” Computing in Science & Engineering 9, 90–95 (2007).
- Kluyver et al. (2016) Thomas Kluyver et al., “Jupyter notebooks – a publishing format for reproducible computational workflows,” (IOS Press, 2016) pp. 87 – 90.