Distinct polytropic behavior of plasma during ICME-HSS Interaction
Abstract
Interplanetary Coronal Mass Ejections (ICMEs) and High Speed Streams (HSSs) are noteworthy drivers of disturbance of interplanetary space. Interaction between them can cause several phenomena, such as; generation of waves, enhanced geo-effectiveness, particle acceleration, etc. However, how does thermodynamic properties vary during the ICME-HSS interaction remain an open problem. In this study, we investigated the polytropic behavior of plasma during an ICME-HSS interaction observed by STEREO and Wind spacecraft. We find that the ICME observed by the STEREO-A has polytropic index , i.e., exhibiting isothermal process. Moreover, Wind spacecraft observed the HSS region, non-interacting ICME, and ICME-HSS interaction region. During each regions we found =1.8, =0.7, and =2.5, respectively. It implies that the HSS region exhibits a nearly adiabatic behaviour, ICME region is closely isothermal, and the ICME-HSS interaction region exhibits super-adiabatic behaviour. The insufficient expansion of the ICME due to the interaction with HSS triggers the system for heating and cooling mechanisms which dependent on the degrees of freedom of plasma components.
Keywords Interplanetary Coronal Mass Ejection High Speed Stream Heating Cooling of Plasma
1 Introduction
Thermodynamic studies include the investigation of relationship between heat, work, temperature, and energy. Studies of polytropic processes in plasmas, offer a novel way to investigate the plasma thermodynamics through the relationships between its macroscopic bulk parameters. Polytropic processes are quasi-stable processes in which the specific heat remains constant. For a plasma (an ideal gas case) it is defined as (Livadiotis, 2019b; Nicolaou et al., 2014; Nicolaou et al., 2020);
| (1) |
where, is thermal pressure , is plasma density , and is the polytropic index. is also defined in terms of specific heats (c = , Q is heat, T is temperature, and and are specific heat at constant pressure and volume respectively) (Newbury et al., 1997). We can determine the polytropic index through correlations of the plasma moments and we can use it to study the plasma thermodynamics. The different values of describe several thermodynamic processes of a system, e.g., an isothermal process (), an isobaric process (), an isochoric process (), and so on (Livadiotis & McComas, 2012; Nicolaou et al., 2014). Note that is different from the well known quantity i.e. and are specific heat at constant pressure and volume, respectively. The value of = is found only in the spacial case (adiabatic case), in which there is no heat tranfrer (c= =0). Different studies investigated the polytropic index for different astrophysical domains, e.g. galaxy cluster () and galaxy supercluster () (Markevitch et al., 1998; Ettori et al., 2000), solar corona () (Van Doorsselaere et al., 2011; Prasad et al., 2018), () of upper chromosphere Houston et al. (2018), hot flare loop (Wang et al., 2015), solar flare (Garcia, 2001; Wang et al., 2015), solar wind () (Totten et al., 1995; Newbury et al., 1997; Livadiotis & Desai, 2016; Nicolaou & Livadiotis, 2019), bow-shock ( 1.85) and 1.67 for earth’s plasma sheet (Tatrallyay et al., 1984; Zhu, 1990), e.t.c. nterplanetary Coronal Mass Ejections (ICMEs) are observed to have a polytropic index ranging from 1.1 to 1.3, depending on where they are observed (Liu et al., 2006; Osherovich et al., 1993). Recently, Mishra & Wang (2018) proposed that the polytropic index of a CME decreases from 1.87 close to the Sun, to 1.3 at 1 au i.e., decreases as CME propagates in interplanetary space.
ICMEs are magnetised plasma eruptions from the outer atmosphere of sun famously known as corona and observed in the heliosphere using in-situ measurements (Zurbuchen & Richardson, 2006; Kilpua et al., 2017). These structures cause major disturbances in the heliosphere. The other structures which majorly contributes in the heliospheric disturbance are Stream Interaction Regions (SIRs) and Co-rotating Interaction Regions (CIRs). An ICME has three distinct parts i.e. forward propagating shock, sheath, and the orderly magnetised flux rope which remain magnetically connected to the Sun (Burlaga, 1988; Zurbuchen & Richardson, 2006). Moreover, as an ICME propagates in the heliosphere it interacts with the surrounding solar wind and occasionally with SIRs and/or CIRs. Some times it interacts with the fast solar wind known as High Speed Stream (HSS). Such an interaction causes change in the ICME plasma speed, density, pressure, magnetic field, and its structure (Winslow et al., 2016). When ICME interacts with HSS it faces several major effects such as kink or deformation (Manchester IV et al., 2004), erosion due to magnetic reconnection (Dasso et al., 2006), deflection from its usual trajectory (Manchester IV et al., 2005; Wang et al., 2014, 2016), rotation through different axes, etc. Nieves-Chinchilla et al. (2012) used multi-spacecraft observations to study the signifficant reoriantaion of an ICME due to its interaction with solar wind. It is interesting to know the thermodynamic behavior of ICME in regimes with HSS interactions.
It is important to note that the change in ICME plasma properties or structures when interacting with a HSS or SIR/CIR, depends on the whether ICME is hitted from the back or from the front, e.g., either the HSS or SIR/CIR overcome the ICME, or the ICME overcomes the HSS or SIR/CIR, respectively. Generally in ICME–HSS interaction events, researchers often focused on HSSs catching up a CME. Such interaction causes huge compression of the ICME from behind, hence deformation (He et al., 2018; Heinemann et al., 2019). Some times, these interactions cause enhancement in turbulence within the ICME sheath region (Kilpua et al., 2017). The ICME-HSS, ICME-CIR, ICME-SIR, and ICME-ICME interaction causes several physical processes such as; charge particle acceleration (Richardson et al., 2003; Zhuang et al., 2020; Lugaz et al., 2017; Gopalswamy, 2012; Morosan et al., 2020), generation of Alféven waves (Raghav & Kule, 2018a; Raghav et al., 2018; Raghav & Kule, 2018b; Raghav & Kule, ), extremely intense geo-effectiveness (Shaikh et al., 2019; Scolini et al., 2020; Raghav et al., 2018), etc.
Recently, Lugaz et al. (2022) investigated an ICME observed on February 23 2021 by the Solar TErrestrial RElations Observatory (STEREO)-A and Wind spacecrafts (separated longitudinally by ) using in-situ and remote-sensing measurements. They claimed that STEREO observed only ICME signatures whereas Wind spacecraft detected an ICME-HSS interaction. The in-situ observations from STEREO-A and Wind allow us to examine the polytropic behavior of ICME plasma at different locations in space. Whereas the inhomogeneity in the interaction with HSS help us to probe the different thermodynamical process in a single ICME, e.g. a non-interacting ICME at STEREO-A and the HSS interacting with an ICME at Wind. This observation gives us a great opportunity to study such a dynamic interaction and its consequences to the plasma thermodynamics, using the polytropic process approach.
2 Data and Methods
We have used in situ data from STEREO-A and Wind spacecraft to study interplanetary parameters and the polytropic behaviour of an ICME-HSS interaction. The Solar Wind Experiment (SWE; Ogilvie et al. (1995)) instrument on board the Wind spacecraft measures plasma bulk properties, such as proton speed , proton number density , and proton temperature , while the Magnetic Field Investigation (MFI; Lepping et al. (1995)) instrument measures the magnetic field. In STEREO PLasma And Supra-Thermal Ion Composition (PLASTIC) (Galvin et al., 2008) instrument gives solar wind parameter where the magnetometer gives the magnetic field components similar to Wind. For polytropic index analysis we used thermal pressure() and . By taking the natural logarithm of Eq. 1, we get
| (2) |
We then perform a linear fitting to vs . The slope of the fitted line, is the polytropic index . The y-intersection gives the constant of the equation, i.e.,. First, we calculated the polytropic index of the magnetic cloud as observed by STEREO-A. We then used the Wind observations to determine a for the following regions : i) HSS observed on 20 - 23 February 2021, ii) Magnetic cloud observed on 24 February 2021, and iii) Magnetic cloud region merged in HSS at the later half of 24 February, 2021, respectively (See figure 5 of Lugaz et al. (2022)).
3 Observations and Results
We have performed detail analysis of ICME-HSS interaction event discussed by the Lugaz et al. (2022) using multi-spacecraft data. The multi-spacecraft observation of ICME is confirmed by the catalogue given by Möstl et al. (2022). The boundaries of different regions are taken from the above articles.
3.1 STEREO-A
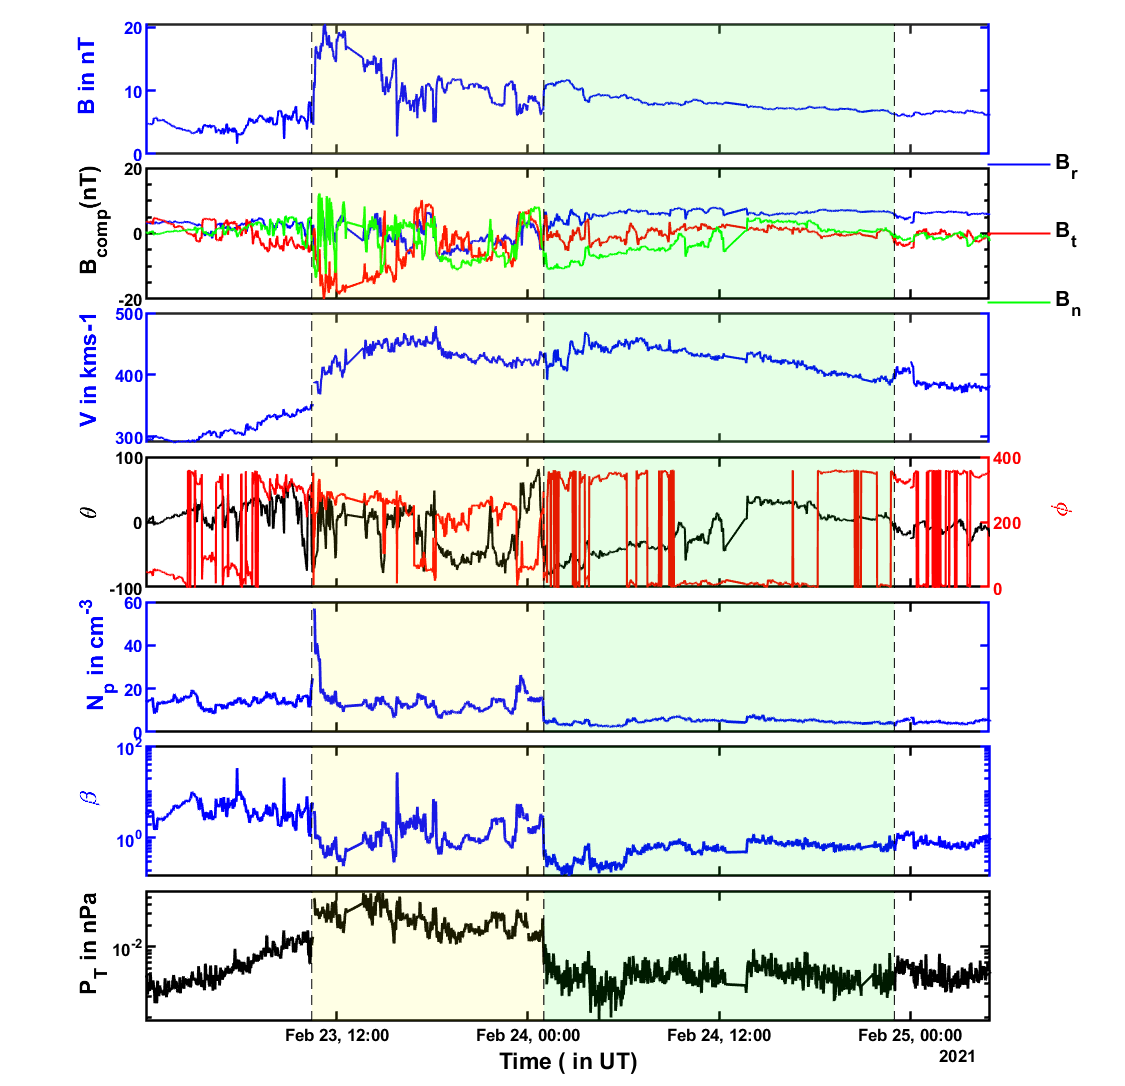
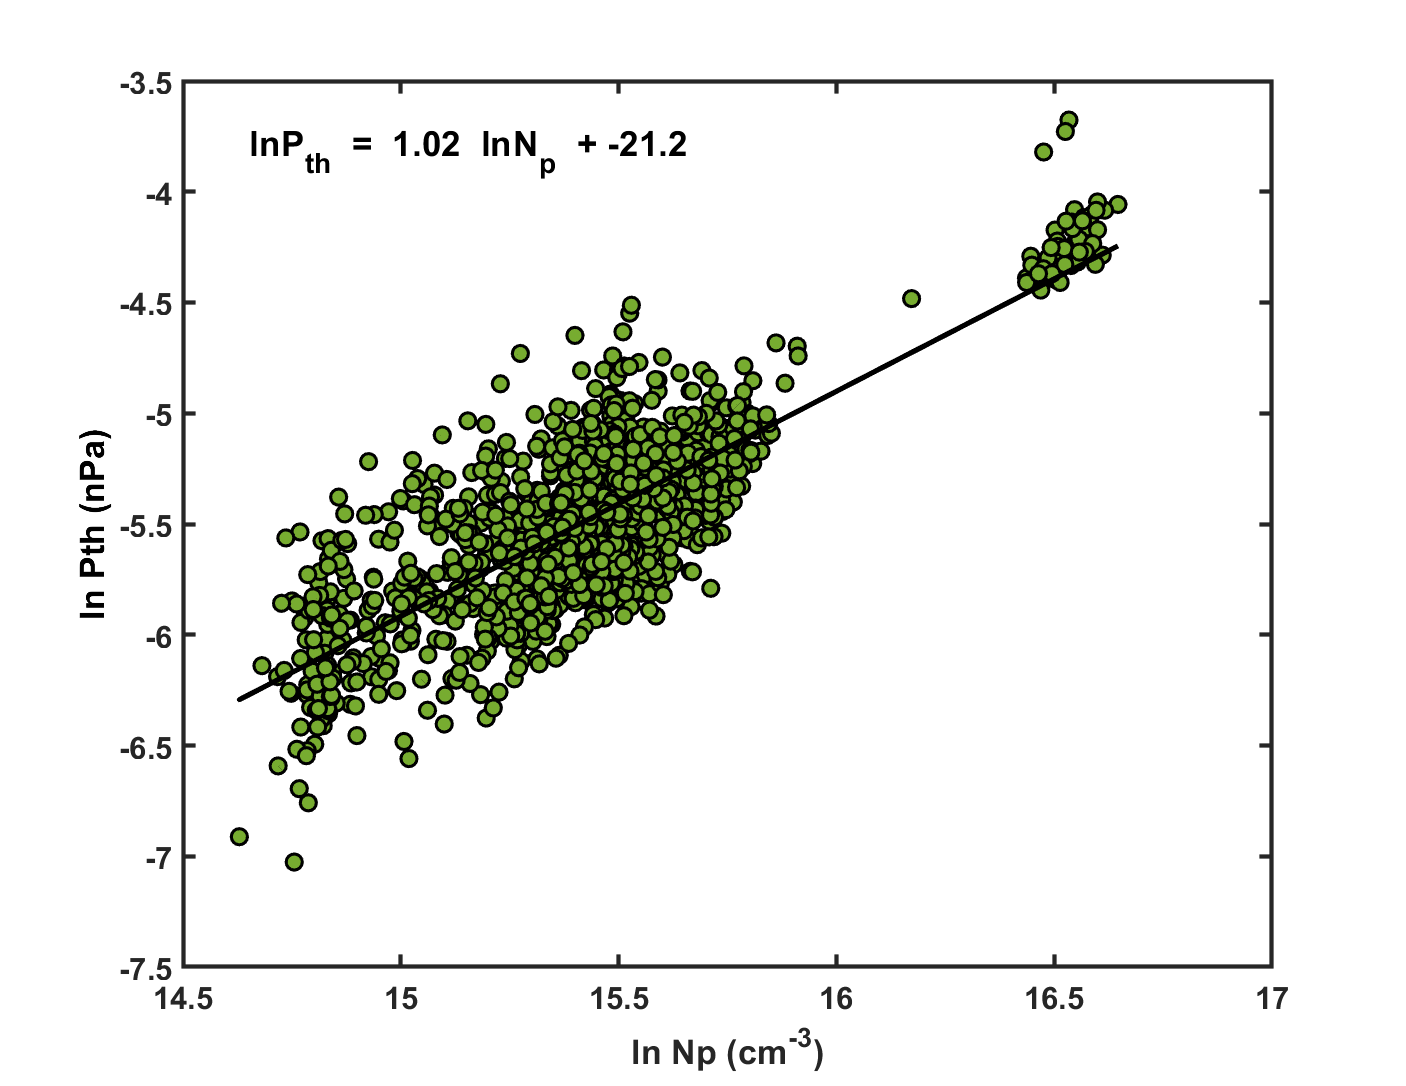
Figure 1 (a) shows the plasma parameters observed at STEREO-A during ICME transit on 23-24 February, 2021. The sudden rise in Interplanetary Magnetic Field (IMF), proton velocity () and proton number density () shows signature of shock (first vertical dash line) on 23rd February at 10.34 UT. The sheath region (yellow shaded region) is observed from shock onset to the start of magnetic cloud at 01.00 UT on 24th February. The low plasma beta, low proton number density, and the rotation in IMF vectors indicates the signature of magnetic cloud (MC; see the green shaded region) starting at 01.00 UT on 24th February and ends on 24th February at 23:00 UT. During MC transit the magnetic field was steady and almost entirely radial (Lugaz et al., 2022). Figure 1(d) shows variations of ln(Pth) as a function of ln(Np) for the MC interval. In the same panel we show the linear fitting of Eq. 2 to the data. We observed that the = 1.0 during MC transit. It implies that MC observed by the STEREO-A shows isothermal property.
3.2 Wind
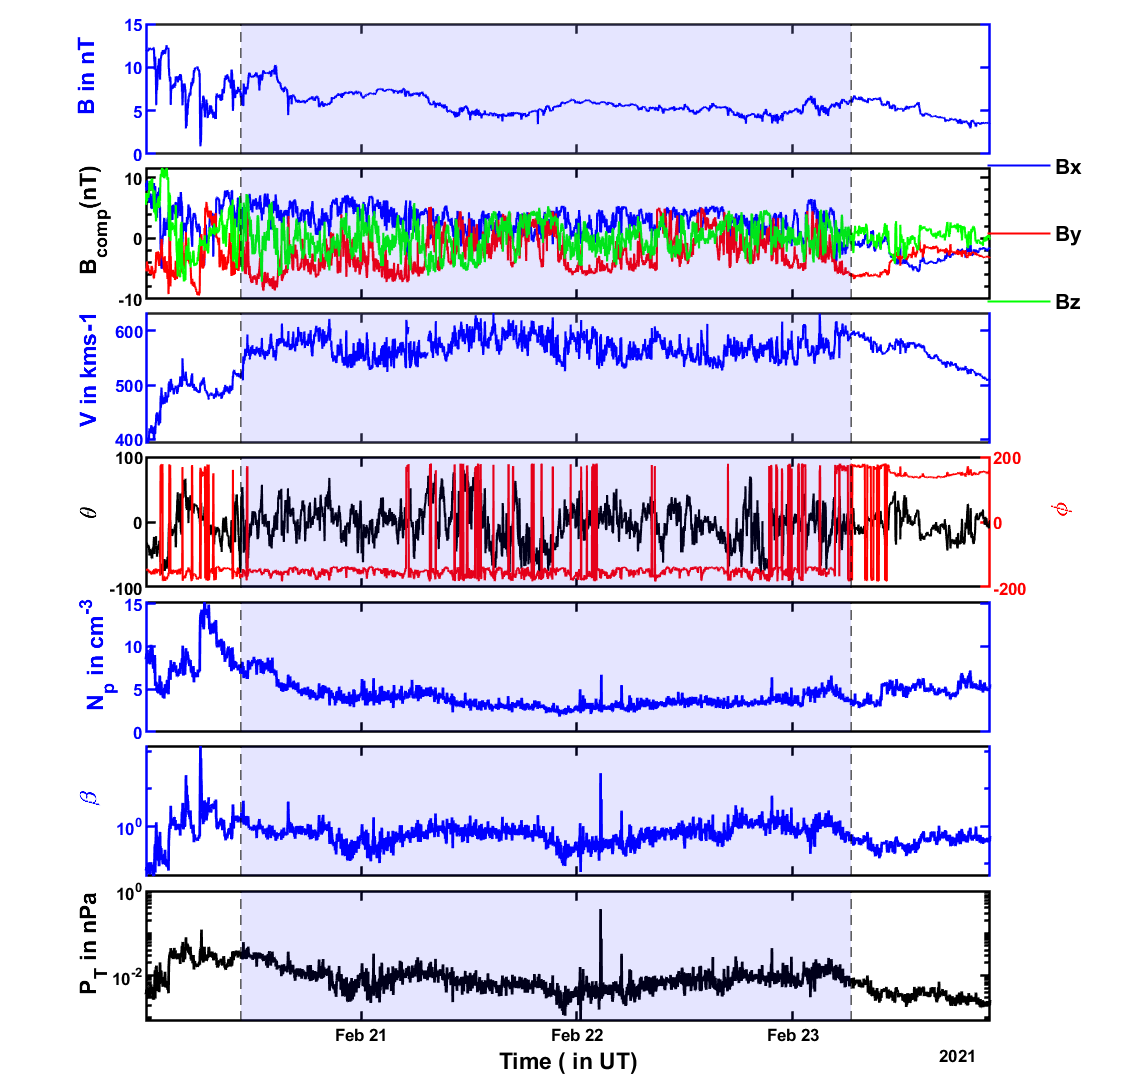
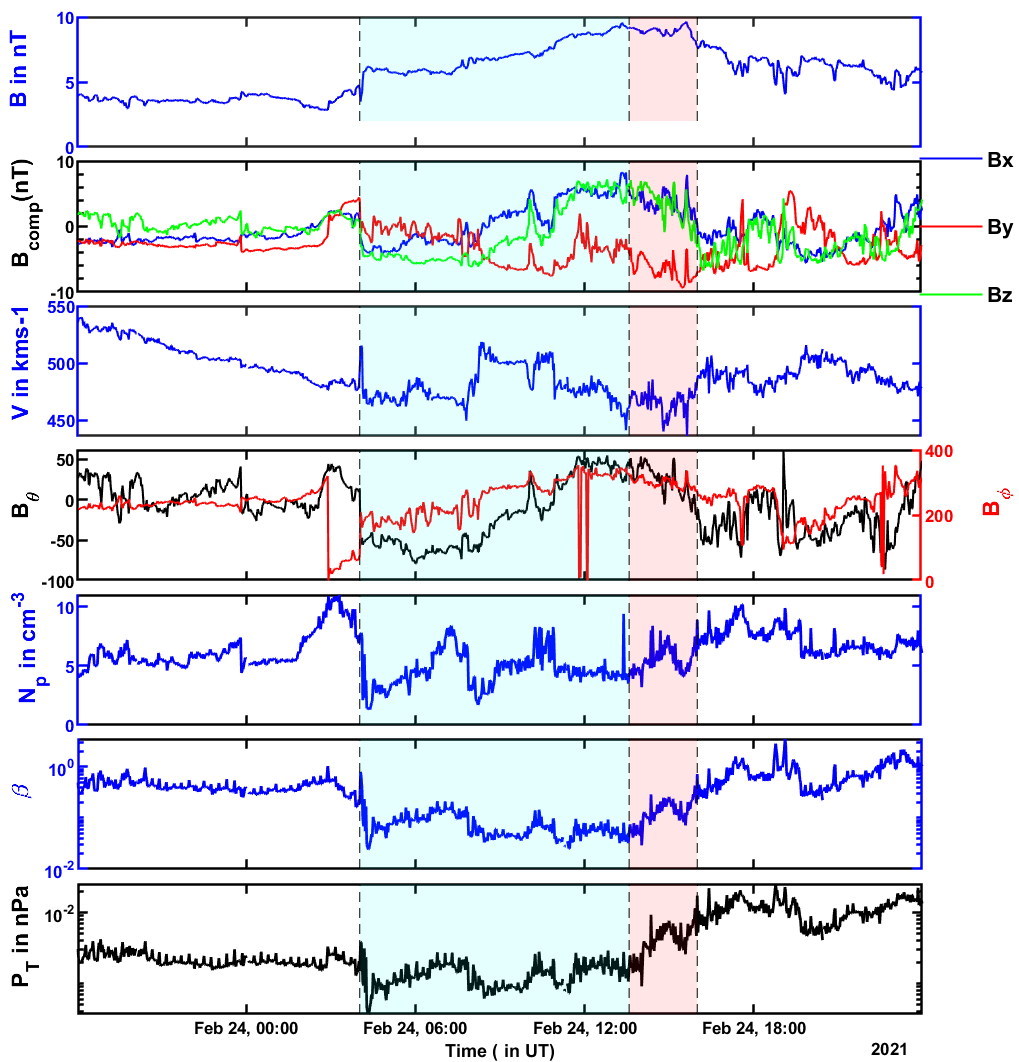
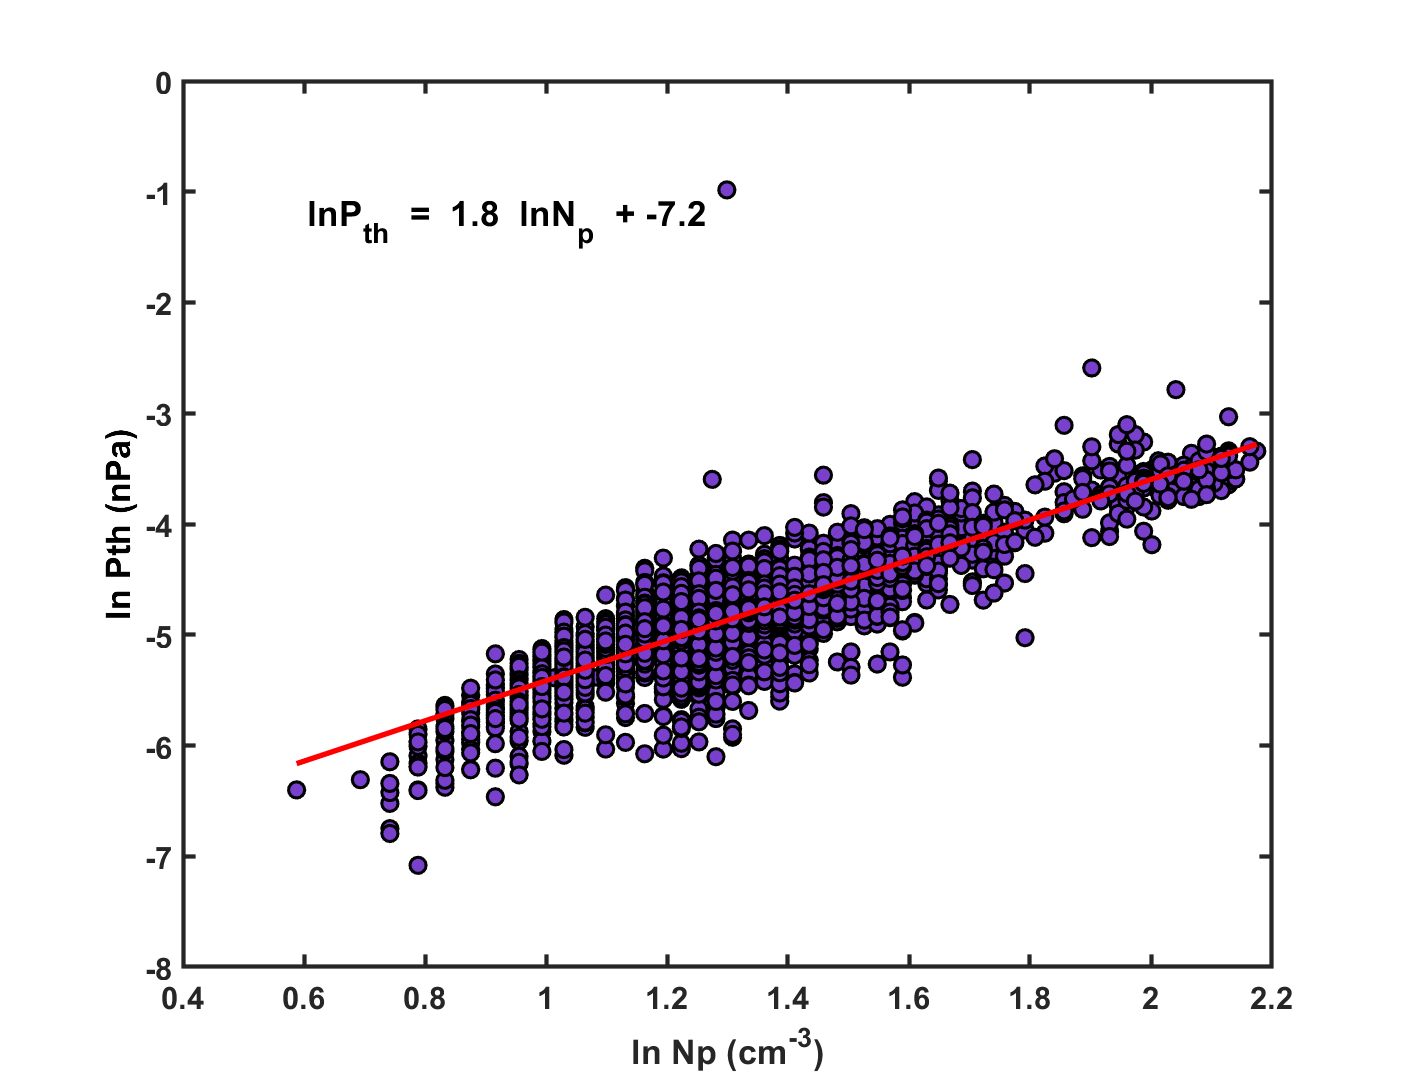
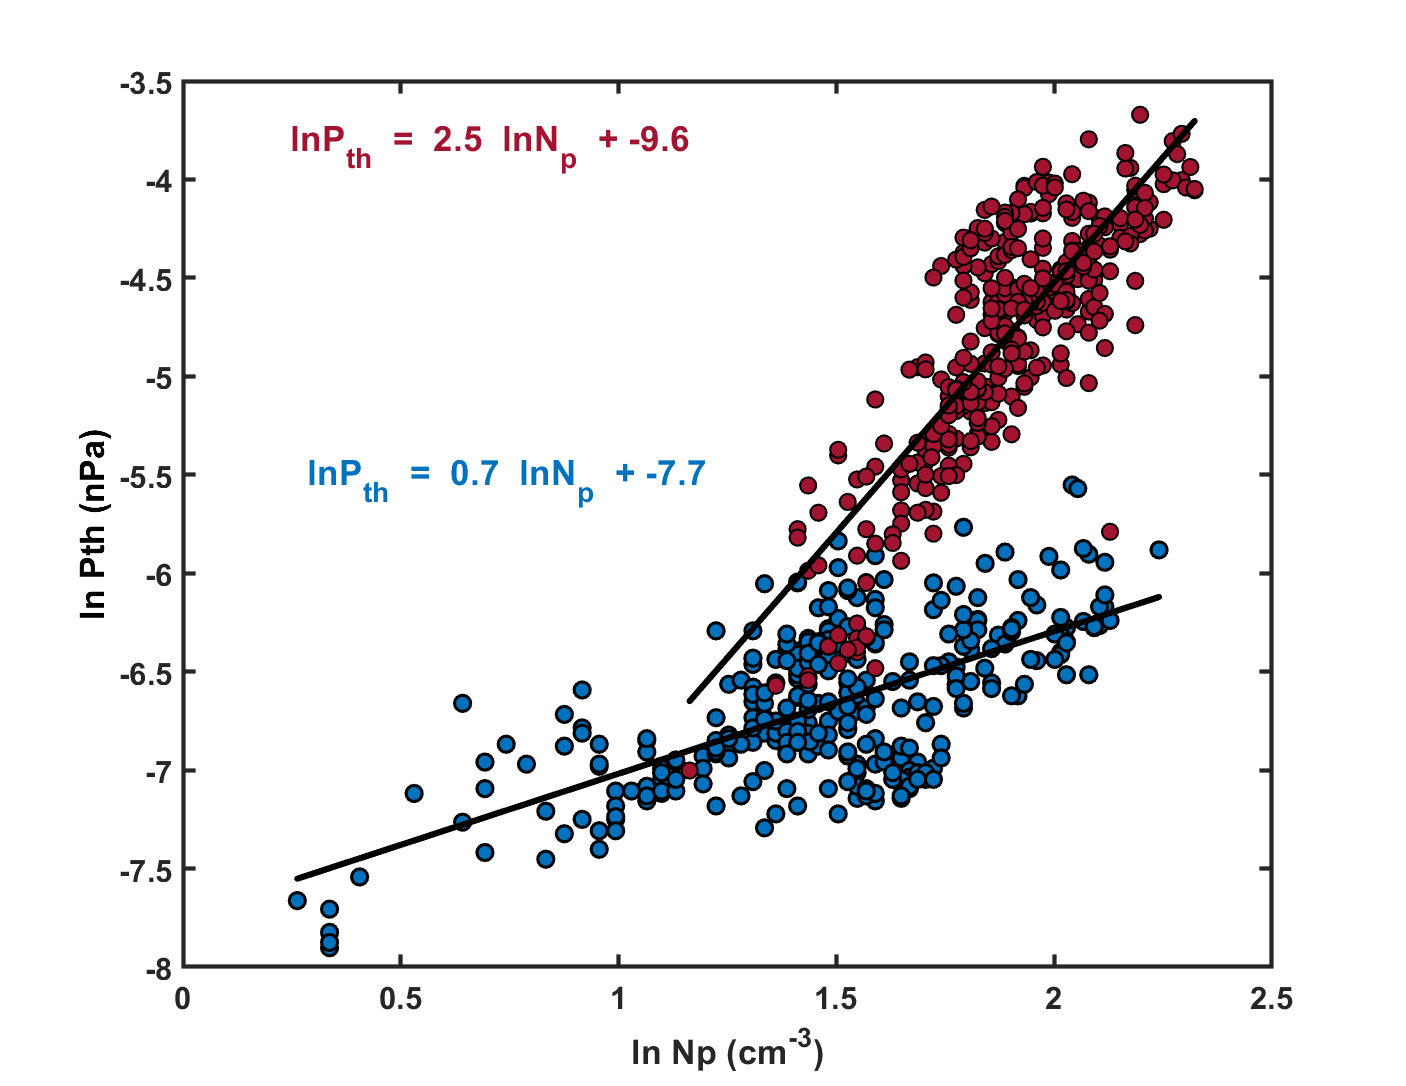
The plasma parameters during the HSS are shown by Figure 1 (b). The enhanced proton velocity shows the signatures of HSS. Figure 1 (c) displays the plasma parameters and magnetic field variation of the MC observed by the Wind spacecraft on 24th February 2021. The low plasma beta, low number density and the smooth rotation of the magnetic field signifies the magnetic cloud. This is the same ICME MC observed by the STEREO-A spacecraft. The MC interacted at the trailing part of HSS which was observed from 20 February 2021, 12.00 UT to 23 February, 23.00 UT, 2021 (Lugaz et al., 2022). The ICME MC starts on 24 February, 2021 04.00 UT and increase in proton number density and proton velocity suggest us to denote the end time as 16.00 UT on 24 February, 2021. The ICME does not show any shock and sheath signature. Furthermore, we have calculated the during the following region (Fig. (e) and (f) in Fig. 1): i) HSS from 20 - 23 February, 2021; ii) MC from 04:00 UT to 16:00 UT on 24 February 2021; iii) MC merged in HSS on 24 February, 2021. We found , , and for the above regions respectively. Thus, different value is observed at different regions during ICME-HSS interaction.
4 Discussion
This study focuses on the polytropic behavior of ICME and its interaction with high speed ambient solar wind. In previous studies the polytropic index of solar wind proton is empirically calculated as 1.46 (Totten et al., 1995). Furthermore, Newbury et al. (1997) derived the polytropic index in the vicinity of stream interactions. The value asymptotically found around 1.67 (i.e. 5/3) and in some occasions 2. Nicolaou et al. (2014) studied the long term variation of polytropic index over 17 years, where they found the the 1.8 on average. Later, Nicolaou et al. (2020) had verified these results using the high resolution measurements by Parker Solar Probe. The large-scale variations of the solar wind proton density and temperature, which are associated with the plasma expansion into the heliosphere, follow a polytropic model with a polytropic index . Furthermore, many studies have observed the polytropic index of the fast and slow solar wind deviates upto 1.8 to 2.0. It is interesting to note that all these studies found that the polytropic behaviour of solar wind plasma is independent on the solar wind speed (Newbury et al., 1997; Nicolaou & Livadiotis, 2019; Livadiotis, 2018). We found the = 1.8 for the HSS region interpreted as near adiabatic behaviour. Besides the significant variations of the proton bulk parameters, is nearly constant.
For ICME, Osherovich et al. (1993) noted different polytropic index within the MC for proton (). It suggest that protons within the MC has quasi-isothermal characteristic. Liu et al. (2006) also show that the ICME has isothermal properties. It implies that, the heat flows from system under constant temperature. Recently, Mishra & Wang (2018) found that the for CME varies from 1.87 to 1.3 as it propagates away from the sun. Initially, when CME emerges from the vicinity of sun, its temperature is high with respect to ambient solar wind. During the erruption of a CME, it is expected as it is being pushed from the back by the high-speed wind, which contributed to the CME’s propagation speed but prohibited the CME from expansion. The insufficient expansion restrict the > 1.67.
(a) STEREO A (ICME)
(b) Wind (HSS)
(c) Wind (ICME)
(d)
(e)
(f)
As it propagates through heliosphere, the expansion of CME causes decrease in temperature as well as number density. The CME reaches to the adiabatic case where the heat is not flowing from system to surrounding (Mishra & Wang, 2018). Later starts to decrease via transferring heat to the surrounding plasma and reaches to quasi-isothermal state. It implies that ICME close to the Sun has adiabatic characteristic whereas at 1 AU it shows quasi-isothermal properties. In our study, we have found = 1.0 at the one arm of CME observed by the STEREO-A, which is in good agreement with Liu et al. (2006) and Osherovich et al. (1993). On the other hand, ICME MC observed by the Wind spacecraft at 1 AU found . Note that, the time gap between HSS and ICME is larger at STEREO-A hence our results are not affected by any interaction. Whereas, at the Wind location the separation between HSS and ICME was small and therefore, the slighlty lower we observe might be a result of the interaction between the two structures.
The ICME interacts with HSS from the side which is crossed by Wind spacecraft on the second half of 24 February, 2022. We have estimated the polytropic index () for this region, surprisingly, we found the during ICME-HSS interaction region. This suggests that investigated region shows super-adiabatic characteristic (Livadiotis, 2019b; Nicolaou et al., 2014; Nicolaou et al., 2020). We believe that such high value of during ICME-HSS interaction could be due to high compression which changes the plasma properties at the time of interaction. The ICME-HSS interaction can restrict the magnetic cloud and solar wind to expand. The insufficient expansion might not have allowed the CME to be cool enough to depart from the heat releasing state i.e isothermal to an superadiabatic state. The MC changes its state from ()= 1.0 to ()= 2.54 during interaction. Due to the interaction with the HSS, the restricted expansion of MC implies the work on the system. Note that the heating and cooling process of plasma depends on the kinetic degrees of freedom of the system.
Therefore, to quantify the heating and cooling process, we have used the relationship between and degrees of freedom () as . From the first law of thermodynamics and following algebra by Livadiotis (2019a), we get
| (3) |
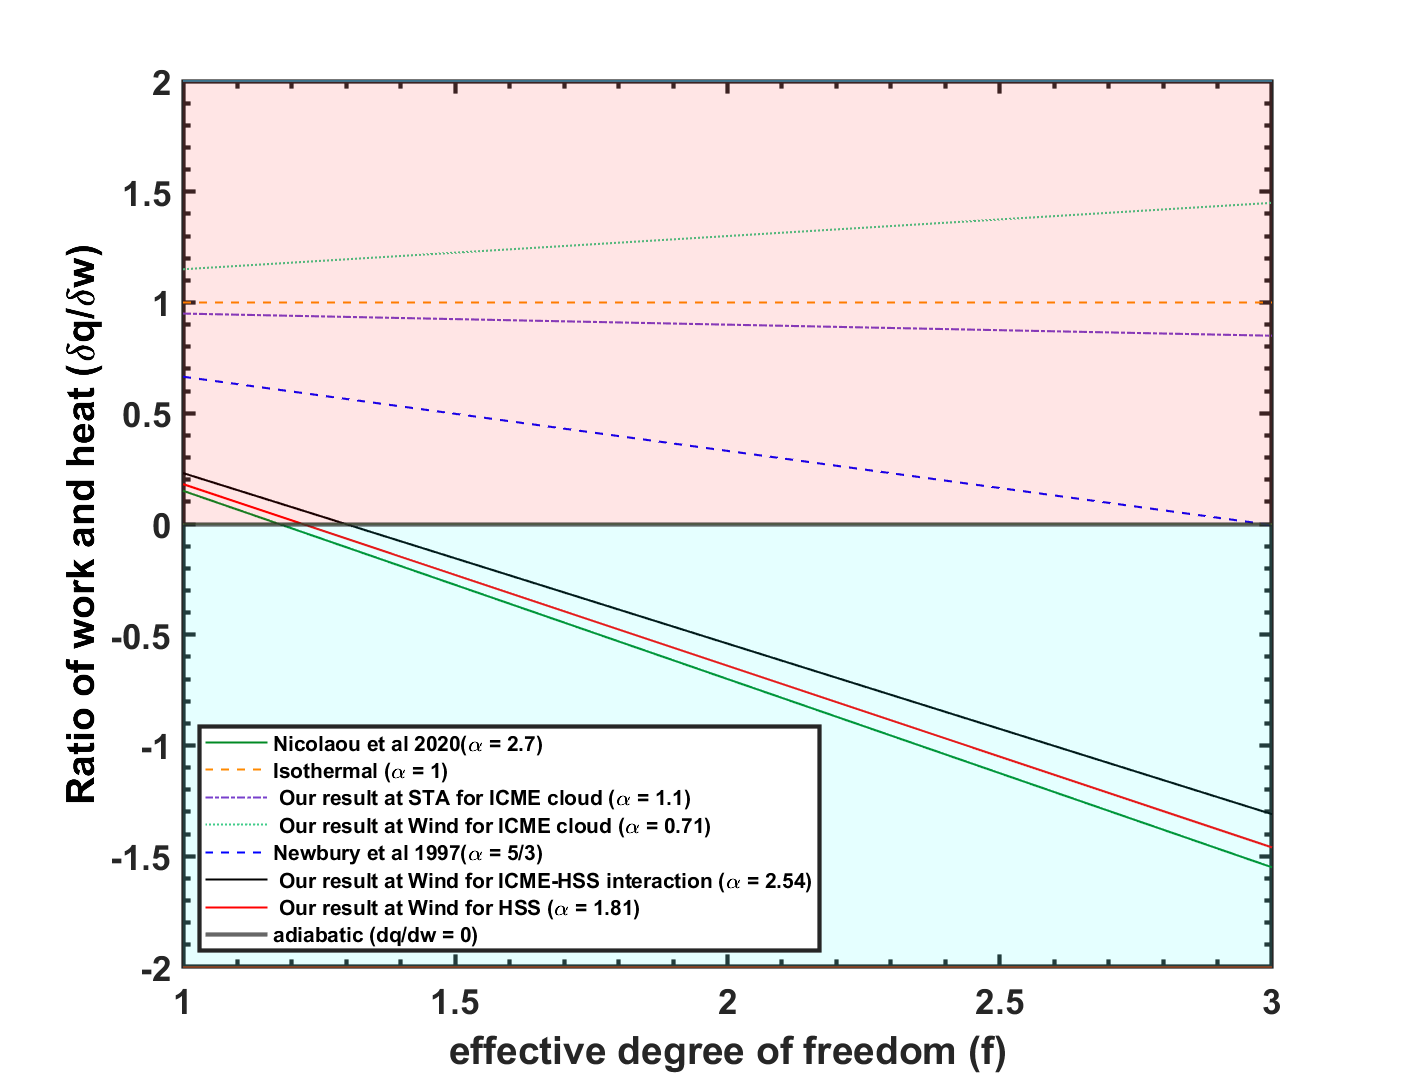
Figure 2 shows the relationship between the and for various values. The red shaded region shows the heating process i.e. > 0 whereas the cyan shaded region shows the cooling processes in expanding plasma for < 0. For isothermal process where = 1, the system is always under the circumstances of heating for any value of . For = = 5/3 the system is under heating process for the < 3. At = 3, the system is adiabatic. Nicolaou et al. (2020) has measured the value using PSP data between 0.17 AU to 0.80 AU. It is found that the alpha value is about 2.7 near the vicinity of sun. From Figure 2 it is observed that for = 1.2 the process is adiabatic for the given polytropic index. This means the heat exchange between system and surrounding is zero. For < 1.2 the is positive which implies that the the heat is gained by the system and hence the heating process may be dominant. On contrast for > 1.2 the negative value of show the system looses its heat and cooling process may dominant. In our study, the magnetic clouds at both observation point i.e at STEREO-A and Wind, the process is isothermal. It implies that for any value of the heating process is dominant. Whereas, the a of the HSS region suggests that there is an energy exchange only if the plasma has <2.5, resulting to heating of the expanding plasma. The interaction region shows the is positive for the < 1.29. It implies that the heating of plasma occurs at < 1.29.
5 Conclusion
Our study examines the distinct polytropic behavior of plasma during the ICME- HSS interaction, here we conclude that.
-
1.
Th isolated ICME MC observed by the STEREO-A shows , while MC observed by the Wind spacecraft shows suggesting that ICME MC shows nearly isothermal behavior.
-
2.
HSS has 1.8, which is nearly adiabatic behavior (for =3)
-
3.
The interaction of ICME with HSS leads to magnetic cloud to behaving superadiabatic (for = 3 ) with = 2.54.
-
4.
The insufficient expansion of the ICME due to the interacting HSS enables the system for heating and cooling mechanisms. Here the degrees of freedom plays vital role. For < 1.29 validates the kinetic description of plasma ions interacting with slow waves, where ions behave as if they are a one-dimensional ( = 1) adiabatic fluid ( = 0) with temperature variations confined along the magnetic field (Verscharen et al., 2017; Nicolaou et al., 2020).
-
5.
The interaction might causes the alteration of magnetic field. The effective degrees of freedom are decreased when high magnetic fields dominate the thermal motions of the particles. Since, the thermodynamic processes are constrained along the magnetic field’s direction and hence the system may efficiently absorbs energy. Thus, we believe that interaction of ICME with HSS causes significant change of thermodynamics of plasma.
-
6.
Our study gives the insight about the unusual behaviour of astrophysical space plasma. The macroscopic study using polytropic approach enables to enhance our understanding regarding the heat exchanges mechanism between different plasma structures and may form a corner stone in understanding the heating cooling process in more advance manner.
Acknowledgements
We acknowledge use of NASA/GSFC’s Space Physics Data Facility’s CDAWeb service. We are thankful to DST, India, since KG is funded by DST-INSPIRE Fellowship (INSPIRE Fellow Registration Number: IF210212). We acknowledge SERB, India, since AR and OD is supported by SERB project reference file number CRG/2020/002314.
DATA AVAILABILITY
The data in this analysis is taken from Wind and STEREO-A spacecrafts. The data is publicly available at (1) NASA’s Goddard Space Flight Center (GSFC) https://wind.nasa.gov/data.php, and (2) Coordinated Data Analysis Web (CDAWeb) https://cdaweb.gsfc.nasa.gov/pub/data/wind/.
References
- Burlaga (1988) Burlaga L., 1988, Journal of Geophysical Research: Space Physics, 93, 7217
- Dasso et al. (2006) Dasso S., Mandrini C. H., Démoulin P., Luoni M. L., 2006, Astronomy & Astrophysics, 455, 349
- Ettori et al. (2000) Ettori S., Bardelli S., De Grandi S., Molendi S., Zamorani G., Zucca E., 2000, Monthly Notices of the Royal Astronomical Society, 318, 239
- Galvin et al. (2008) Galvin A. B., et al., 2008, Space Science Reviews, 136, 437
- Garcia (2001) Garcia H., 2001, ApJ, 557, 897
- Gopalswamy (2012) Gopalswamy N., 2012, in AIP Conference Proceedings. pp 247–252
- He et al. (2018) He W., Liu Y. D., Hu H., Wang R., Zhao X., 2018, The Astrophysical Journal, 860, 78
- Heinemann et al. (2019) Heinemann S. G., et al., 2019, Solar Physics, 294, 1
- Houston et al. (2018) Houston S., Jess D., Ramos A. A., Grant S., Beck C., Norton A., Prasad S. K., 2018, ApJ, 860, 28
- Kilpua et al. (2017) Kilpua E., Koskinen H. E., Pulkkinen T. I., 2017, Living Reviews in Solar Physics, 14, 1
- Lepping et al. (1995) Lepping R., et al., 1995, Space Science Reviews, 71, 207
- Liu et al. (2006) Liu Y., Richardson J., Belcher J., Kasper J., Elliott H., 2006, Journal of Geophysical Research: Space Physics, 111
- Livadiotis (2018) Livadiotis G., 2018, EPL (Europhysics Letters), 122, 50001
- Livadiotis (2019a) Livadiotis G., 2019a, Entropy, 21, 1041
- Livadiotis (2019b) Livadiotis G., 2019b, ApJ, 874, 10
- Livadiotis & Desai (2016) Livadiotis G., Desai M. I., 2016, ApJ, 829, 88
- Livadiotis & McComas (2012) Livadiotis G., McComas D., 2012, The Astrophysical Journal, 749, 11
- Lugaz et al. (2017) Lugaz N., Temmer M., Wang Y., Farrugia C. J., 2017, Solar Physics, 292, 1
- Lugaz et al. (2022) Lugaz N., et al., 2022, The Astrophysical Journal, 929, 149
- Manchester IV et al. (2004) Manchester IV W. B., Gombosi T. I., Roussev I., Ridley A., De Zeeuw D. L., Sokolov I., Powell K. G., Tóth G., 2004, Journal of Geophysical Research: Space Physics, 109
- Manchester IV et al. (2005) Manchester IV W., et al., 2005, The Astrophysical Journal, 622, 1225
- Markevitch et al. (1998) Markevitch M., Forman W. R., Sarazin C. L., Vikhlinin A., 1998, The Astrophysical Journal, 503, 77
- Mishra & Wang (2018) Mishra W., Wang Y., 2018, ApJ, 865, 50
- Morosan et al. (2020) Morosan D., et al., 2020, Astronomy & Astrophysics, 642, A151
- Möstl et al. (2022) Möstl C., et al., 2022, The Astrophysical Journal Letters, 924, L6
- Newbury et al. (1997) Newbury J. A., Russell C. T., Lindsay G. M., 1997, GRL, 24, 1431
- Nicolaou & Livadiotis (2019) Nicolaou G., Livadiotis G., 2019, The Astrophysical Journal, 884, 52
- Nicolaou et al. (2014) Nicolaou G., Livadiotis G., Moussas X., 2014, Solar Physics, 289, 1371
- Nicolaou et al. (2020) Nicolaou G., Livadiotis G., Wicks R. T., Verscharen D., Maruca B. A., 2020, ApJ, 901, 26
- Nieves-Chinchilla et al. (2012) Nieves-Chinchilla T., Colaninno R., Vourlidas A., Szabo A., Lepping R., Boardsen S., Anderson B., Korth H., 2012, Journal of Geophysical Research: Space Physics, 117
- Ogilvie et al. (1995) Ogilvie K., et al., 1995, Space Science Reviews, 71, 55
- Osherovich et al. (1993) Osherovich V., Farrugia C., Burlaga L., Lepping R., Fainberg J., Stone R., 1993, JGR: Space Physics, 98, 15331
- Prasad et al. (2018) Prasad S. K., Raes J., Van Doorsselaere T., Magyar N., Jess D., 2018, ApJ, 868, 149
- (34) Raghav A. N., Kule A., , Monthly Notices of the Royal Astronomical Society: Letters
- Raghav & Kule (2018a) Raghav A. N., Kule A., 2018a, MNRAS: Letters, 476, L6
- Raghav & Kule (2018b) Raghav A. N., Kule A., 2018b, Monthly Notices of the Royal Astronomical Society: Letters, 480, L6
- Raghav et al. (2018) Raghav A. N., Kule A., Bhaskar A., Mishra W., Vichare G., Surve S., 2018, ApJ, 860, 26
- Richardson et al. (2003) Richardson I. G., Lawrence G. R., Haggerty D. K., Kucera T. A., Szabo A., 2003, Geophysical research letters, 30
- Scolini et al. (2020) Scolini C., et al., 2020, The Astrophysical Journal Supplement Series, 247, 21
- Shaikh et al. (2019) Shaikh Z. I., Raghav A., Vichare G., Bhaskar A., Mishra W., Choraghe K., 2019, MNRAS, 490, 3440
- Tatrallyay et al. (1984) Tatrallyay M., Russell C. T., Luhmann J. G., Barnes A., Mihalov J. D., 1984, JGR: Space Physics, 89, 7381
- Totten et al. (1995) Totten T., Freeman J., Arya S., 1995, JGR: Space Physics, 100, 13
- Van Doorsselaere et al. (2011) Van Doorsselaere T., Wardle N., Del Zanna G., Jansari K., VERwICHTE E., NAkARIAkOV V. M., 2011, ApJL, 727, L32
- Verscharen et al. (2017) Verscharen D., Chen C. H. K., Wicks R. T., 2017, The Astrophysical Journal, 840, 106
- Wang et al. (2014) Wang Y., Wang B., Shen C., Shen F., Lugaz N., 2014, Journal of Geophysical Research: Space Physics, 119, 5117
- Wang et al. (2015) Wang T., Ofman L., Sun X., Provornikova E., Davila J. M., 2015, ApJL, 811, L13
- Wang et al. (2016) Wang Y., et al., 2016, Journal of Geophysical Research: Space Physics, 121, 7423
- Winslow et al. (2016) Winslow R. M., et al., 2016, Journal of Geophysical Research: Space Physics, 121, 6092
- Zhu (1990) Zhu X., 1990, GRL, 17, 2321
- Zhuang et al. (2020) Zhuang B., Lugaz N., Gou T., Ding L., Wang Y., 2020, The Astrophysical Journal, 901, 45
- Zurbuchen & Richardson (2006) Zurbuchen T. H., Richardson I. G., 2006, Coronal mass ejections, pp 31–43