Leveraging Structure from Motion to Localize Inaccessible Bus Stops
Abstract
The detection of hazardous conditions near public transit stations is necessary for ensuring the safety and accessibility of public transit. Smart city infrastructures aim to facilitate this task among many others through the use of computer vision. However, most state-of-the-art computer vision models require thousands of images in order to perform accurate detection, and there exist few images of hazardous conditions as they are generally rare.
In this paper, we examine the detection of snow-covered sidewalks along bus routes. Previous work has focused on detecting other vehicles in heavy snowfall or simply detecting the presence of snow. However, our application has an added complication of determining if the snow covers areas of importance and can cause falls or other accidents (e.g. snow covering a sidewalk) or simply covers some background area (e.g. snow on a neighboring field). This problem involves localizing the positions of the areas of importance when they are not necessarily visible.
We introduce a method that utilizes Structure from Motion (SfM) rather than additional annotated data to address this issue. Specifically, our method learns the locations of sidewalks in a given scene by applying a segmentation model and SfM to images from bus cameras during clear weather. Then, we use the learned locations to detect if and where the sidewalks become obscured with snow. After evaluating across various threshold parameters, we identify an optimal range at which our method consistently classifies different categories of sidewalk images correctly. Although we demonstrate an application for snow coverage along bus routes, this method can extend to other hazardous conditions as well. Code for this project is available at https://github.com/ind1010/SfM_for_BusEdge.
Index Terms:
Computer Vision for Transportation, Intelligent Transportation Systems, Localization, Segmentation and CategorizationI INTRODUCTION
Smart city infrastructures aim to use fields like computer vision to facilitate city management, part of which involves overseeing transportation systems. As transportation systems become more intelligent, an increasing amount of public transit vehicles are equipped with cameras that capture thousands of images of the city per day along with geographic positioning information. City infrastructures can use this immense amount of raw data to monitor the conditions of public transit stations and the surrounding areas.
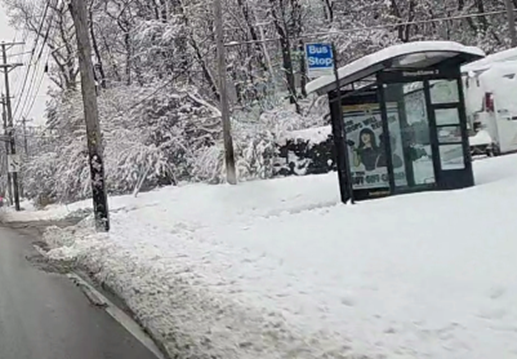
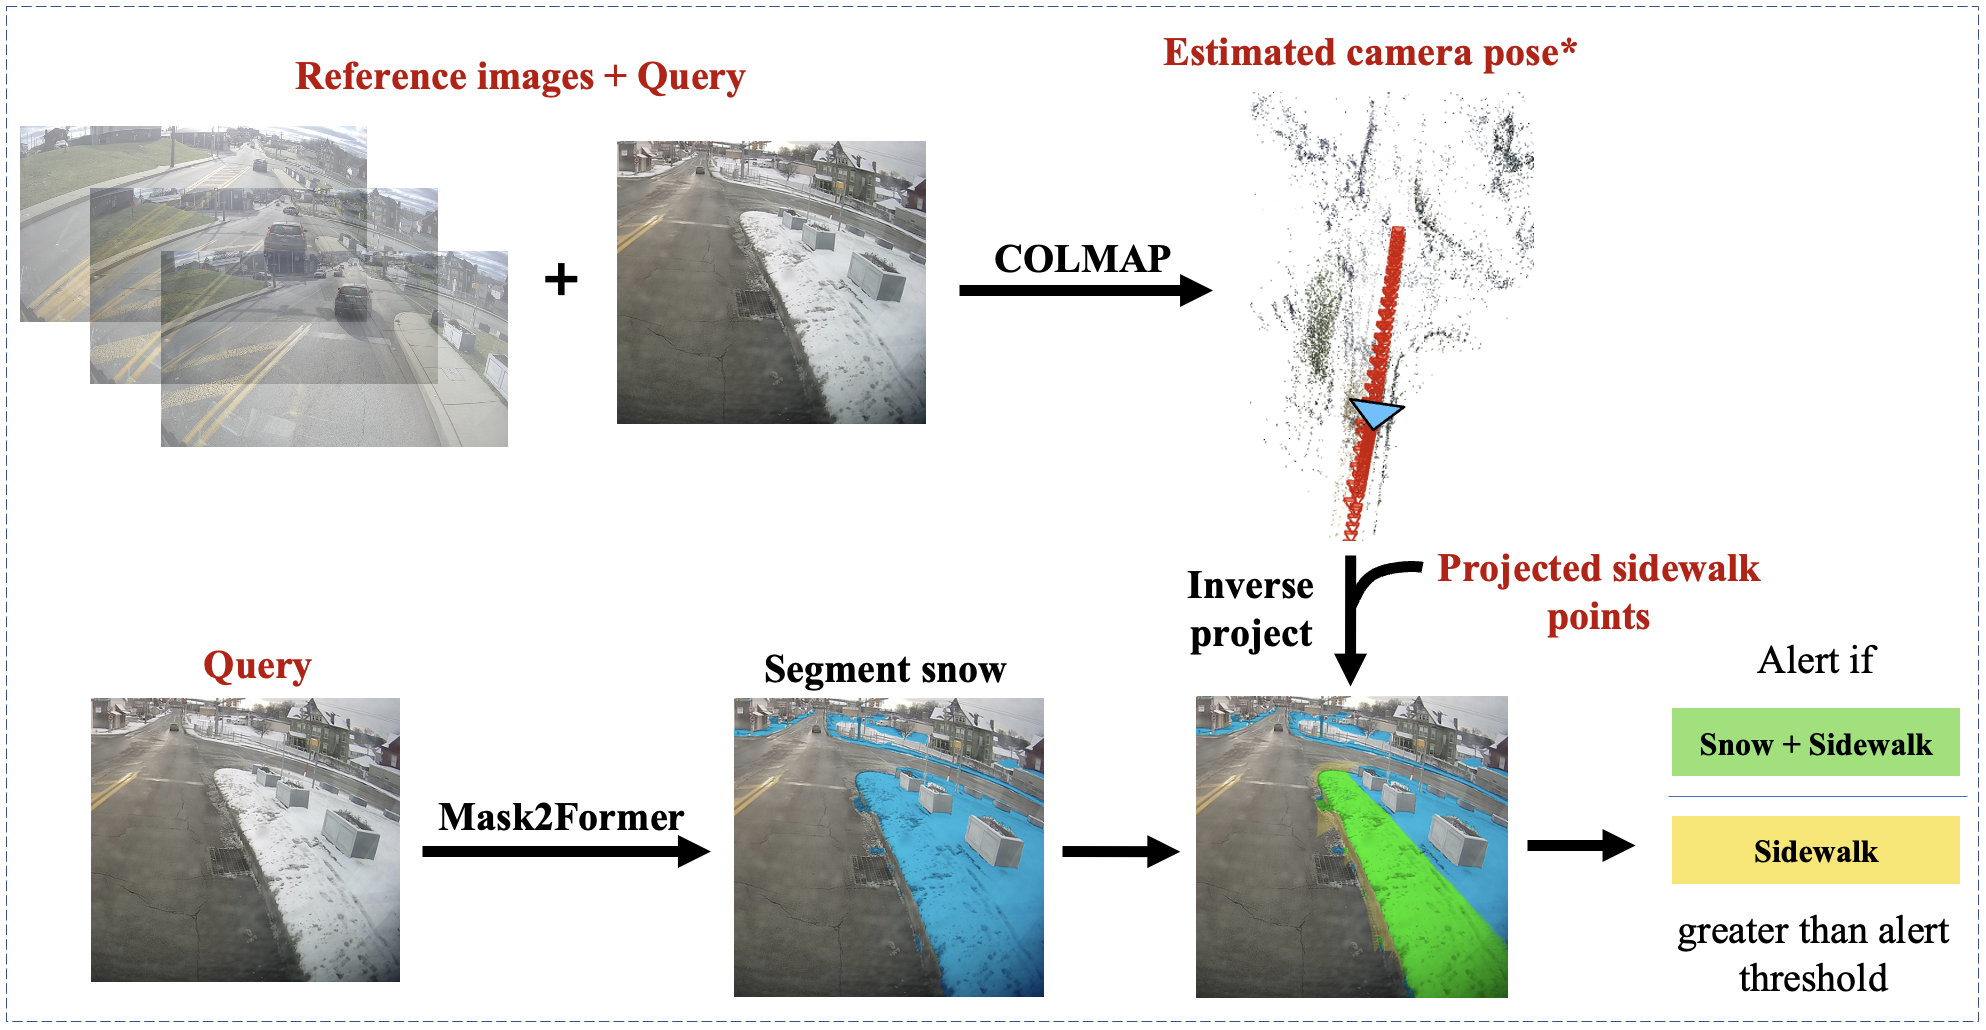
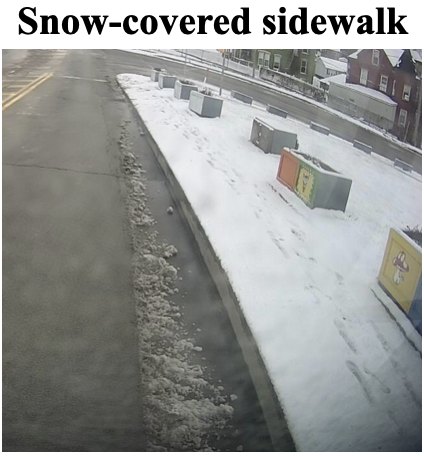
Our application focuses on detecting snow-covered sidewalks along bus routes; snow-covered sidewalks are one type of hazardous condition that can limit the safety and accessibility of public buses as pedestrians can lose access to bus stops and/or slip (Fig. 1). We use images that are captured on-board a public bus as data. However, instead of annotating this data, we leverage the fact that the bus travels around a set route and apply Structure from Motion and a segmentation model to learn the locations of the sidewalks in clear weather. Then, in future rounds, when the bus encounters snowfall, we compare the detected snow coverage to the learned locations of the sidewalks. If the coverage exceeds a set threshold, we generate an alert, and the bus company can contact the city to clear the sidewalk.
When evaluating on a few categories of sidewalk images, we identify a set of thresholds at which our method performs well across all categories for this bus route. Though we demonstrate an application for detecting snow-covered sidewalks, our method can generalize to detecting other conditions such as snow on roads or bike lanes.
Our contributions are as follows:
-
•
We present a method that combines Structure from Motion with a segmentation model to learn the expected locations of sidewalks and detect whether or not the learned sidewalk locations become covered by snow.
-
•
Although we demonstrate by detecting snow-covered sidewalks, our method can easily generalize to other problems.
-
•
We collect a small dataset of images depicting sidewalks in clear and snowy weather that we use for evaluation. Additionally, we compile other categories of images that may be relevant for other works.
II RELATED WORK
II-A Existing Municipal Infrastructures
Many American cities use the telephone number 311 that allows anyone to report issues for the city to fix, such as snow-covered sidewalks. However, this process can be inefficient as it is decentralized and relies on the motivation of people.
II-B BusEdge
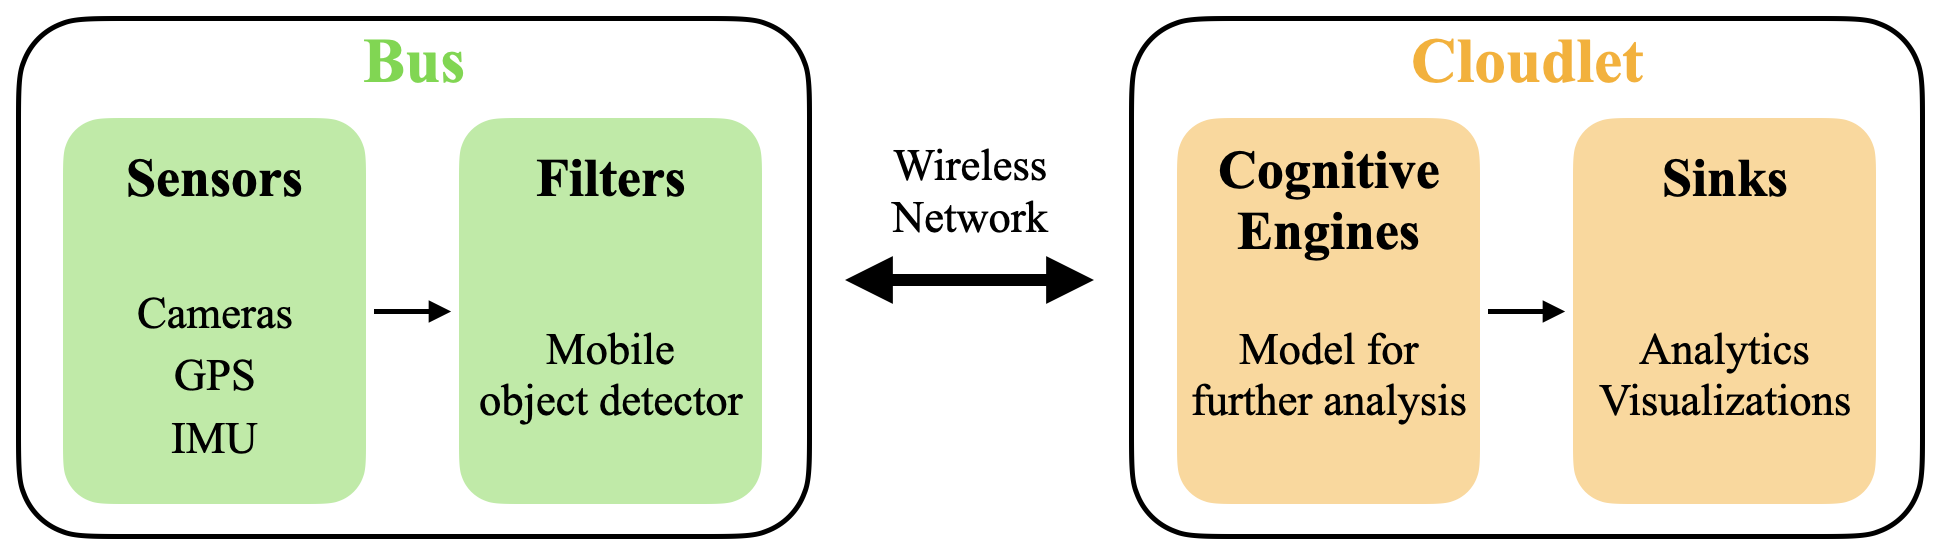
Since buses regularly travel around cities, and many are equipped with cameras, we can facilitate the detection of municipal problems by regularly analyzing bus camera images. We use a platform called BusEdge[1] that captures and packages images with GPS information from the client (bus) and sends the data to the server (cloudlet) to be analyzed (Fig. 2). Intensive on-board analysis can be limited because the bus is equipped with a CPU.
II-C Panoptic Segmentation
Panoptic segmentation combines semantic and instance segmentation by both categorizing pixels that represent uncountable areas (e.g. snow) and grouping pixels into instances if they belong to countable objects (e.g. cars)[2]. Although our application involves semantic segmentation categories, we employ a panoptic segmentation model so that our method can be extended more easily for applications where instances are needed.
We apply an off-the-shelf segmentation model called Mask2Former[3]. This model incorporates a Transformer decoder. Transformers have recently become a popular option for computer vision models in terms of accuracy[4]. They are not necessarily more efficient; however, since our application is not significantly time-sensitive (i.e. the bus company can be informed of a snow-covered sidewalk within a few hours rather than within a few seconds), we prioritize accuracy over efficiency.
II-D Snow Detection
Most work has focused on detecting the presence of snowfall[5, 6, 7, 8] and localizing the presence of vehicles and other objects in adverse weather conditions such as snow[9, 10, 11]. However, in addition to detecting snow, our application has the added complication of localizing the positions of sidewalks that are occluded by snow.
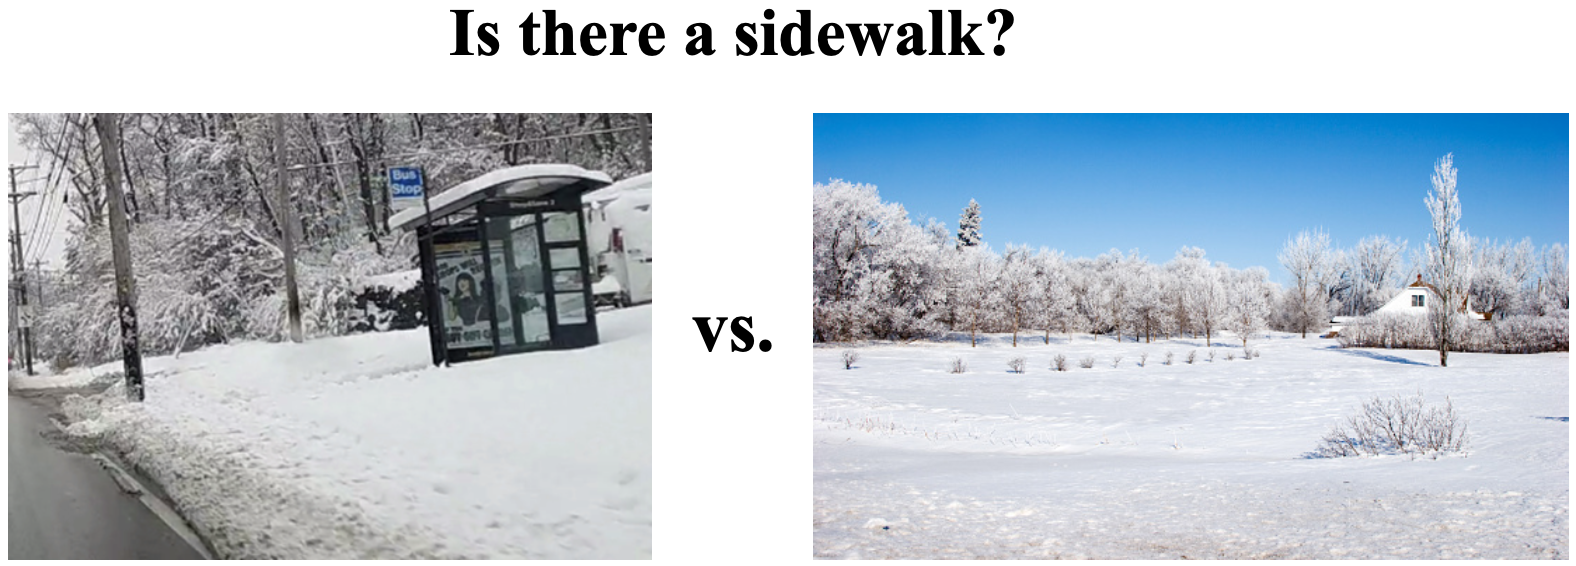
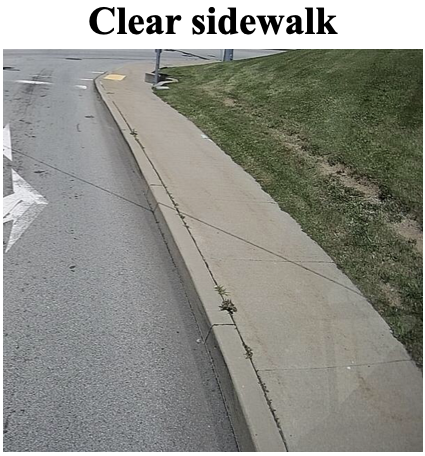
To our knowledge, there exists no dataset that contains labeled snow-covered sidewalks. Synthetic images are commonly used to artificially enlarge datasets; however, they are difficult to render realistic-looking[12]. Furthermore, training a deep learning model to classify an image as a “snow-covered sidewalk” would not be straightforward as any miscellaneous snow-covered area could look identical to a snow-covered sidewalk (Fig. 3).
II-E Image Localization
LiDAR is often used to localize the positions of objects surrounding an autonomous vehicle, such as other vehicles[13, 14, 15, 16, 17, 18]. However, LiDAR is expensive, and we already have thousands of images available from bus cameras[19]. Furthermore, weather conditions like snow can interfere with LiDAR measurements[19].
Some methods have been developed for an analogous problem of localizing roads in adverse weather conditions. Some applications depend on a previously generated map of the terrain[20]; we apply a similar idea of generating a preconception of where the sidewalks should be. A few methods use the geometry of the road, such as the vanishing point of the road and the horizon in the image, to generate an expected target area for where the road could be[21, 22]. Another method uses self-supervision to generate a pseudo-mask of where the road is expected to be[23]. However, these approaches are more effective in weather conditions under which the road is partially occluded, such as fog or rain. They are generally unable to localize roads that are fully occluded by snow. Furthermore, these methods target the autonomous driving domain where they must anticipate completely novel surroundings on any given drive. On the other hand, we leverage the fact that we work with images from a mostly repetitive bus route.
Structure from Motion (SfM)[24, 25] is a classic computer vision algorithm that uses several two-dimensional images taken at different angles of a scene to construct a three-dimensional point cloud representation of the scene. Furthermore, SfM can deduce the pose of the camera for each image and for new images of the same scene[26]. We use a pipeline for SfM called COLMAP[27, 28]. More specifically, COLMAP implements incremental SfM which gradually adds images when reconstructing a scene (Fig. 4); this is as opposed to global SfM[29].
Visual odometry (VO) methods can also localize images [30] and tend to run faster than COLMAP; however, they are not as accurate. Furthermore, VO methods that involve deep learning[31] are inherently data-hungry, and our method aims to reduce the amount of annotated data needed. Since our application is not significantly time-sensitive, and we need to accurately classify a sidewalk as snow-covered or clear, we require a robust pipeline like COLMAP. Furthermore, the COLMAP software is well-documented and often referenced as a baseline method by these new methods.

III METHOD
For simplicity, we describe our method for one stretch of road that includes a bus stop.
III-A Data collection
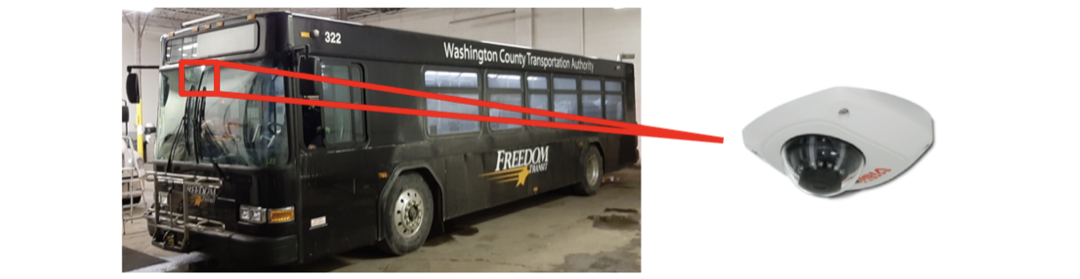
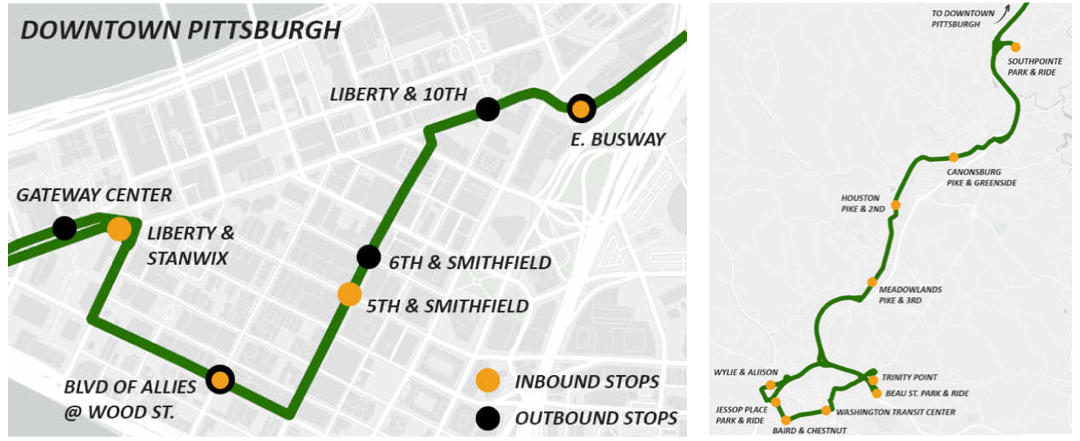
We use images captured from the dash camera on a bus (Fig. 5(a)) that travels around Pittsburgh and Washington County, Pennsylvania (Fig. 5(b)). The camera captures 5 frames per second. Duplicate and blurry images are removed, and the remaining images are sent to a server via the BusEdge Platform[1]. The images, along with their GPS and IMU information, are stored as EXIF files in folders of .bag files. We have data beginning from February 2021.
We choose images corresponding to a stretch of the route with a visible sidewalk in clear weather. Then, using the GPS information of the selected images, we filter images from other clear-weather days to obtain a few runs of the same sidewalk stretch.
We omit images within the selected GPS range where the bus travels on the opposite side of the road (i.e. returning on the same route) so as to focus on one side of the road. This omission is not strictly necessary. Some images have a strong glare from the sunlight and consequently the scenes in these images are extremely dim, so we remove these images. In the end, we keep three runs of the same stretch of sidewalk in clear weather. We use a similar process to collect different categories of sidewalk images for evaluation (described in Sec. IV).
III-B Reconstruction of ground truth sidewalks
The steps detailed in this section are adapted from an analogous work in the detection of changes in crosswalks[32]. For this application, the overall idea is to save the sidewalk locations into a 3D rendering of the scene (Fig. 6(a)).
-
1.
Use reference images to render a point cloud of the scene.
We feed the images of the sidewalk stretch from multiple clear-weather runs (i.e. reference images) into COLMAP[27, 28] and obtain a point cloud representation of the stretch.SfM has three main steps[33] (Fig. 4):
-
(a)
Identify keypoints.
Keypoints are points in the scene that are somewhat salient and specific to the scene. Objects like monuments and store signs tend to provide robust keypoints. - (b)
-
(c)
Reconstruction.
First, the pairwise relationships between images are determined by using RANSAC[36] and the extracted feature vectors. Then, reconstruction begins with the image pair containing the most inliers. Images are gradually added while solving bundle adjustment.
We run COLMAP on images from multiple runs of the same stretch because one run tends to produce too sparse a point cloud. Since the bus camera is unlikely to be in the exact same orientation between runs (e.g. not always centered in the lane), we are effectively guaranteed reasonable stereo pairs which improves the 3D reconstruction.
-
(a)
-
2.
Estimate the ground plane of the scene.
First, we segment the road in each reference image by applying the Mask2Former[3] model. We select the panoptic segmentation model with a Swin-L (IN21k) backbone that is pre-trained on Mapillary Vistas. Mapillary Vistas[37] is a dataset that contains street-level images, and its panoptic segmentation categories include snow, sidewalks, and roads.Then, we use the pixel-to-3D point correspondences provided by COLMAP to identify the points in the point cloud that correspond to the road pixels. Next, we use RANSAC to fit a plane to the identified points; this plane is the estimated ground plane. Finally, we re-orient all the points such that the z-axis of the point cloud aligns with the normal of the ground plane.
-
3.
Segment the sidewalk in each reference image.
For this step, we obtain masks of the sidewalks in the reference images by again applying the Mask2Former model[3]. Using the assumption that the bus is driving on the right side of the road as is the convention in the United States, we omit identified sidewalk pixels that are to the left of and/or above the midpoint of the image. This helps restrict the view of the bus to the sidewalk closest to it. The driving assumption would need to be adjusted in locations where the driving conventions differ. -
4.
Use the estimated ground plane to project the sidewalk masks into the point cloud and save the projected points.
In order to save the sidewalk locations into the point cloud, we use the road to determine the homography from the image to the point cloud. We can assume that the road is a flat reference area and that the slight lift of the sidewalk does not contribute much error as seen in our example qualitative results (Fig. 9).Let us consider one reference image. First, we find the homography from the road pixels in the image to the corresponding 3D points that lie on the estimated ground plane. This is effectively the homography from the image to the estimated ground plane. Next, we use the homography matrix to project each pixel in the sidewalk mask onto the estimated ground plane. Lastly, we save coordinates of the projected sidewalk points. We repeat this process for each reference image, and the combined points form a 3D model of the expected sidewalk locations.

III-C Classification of query image
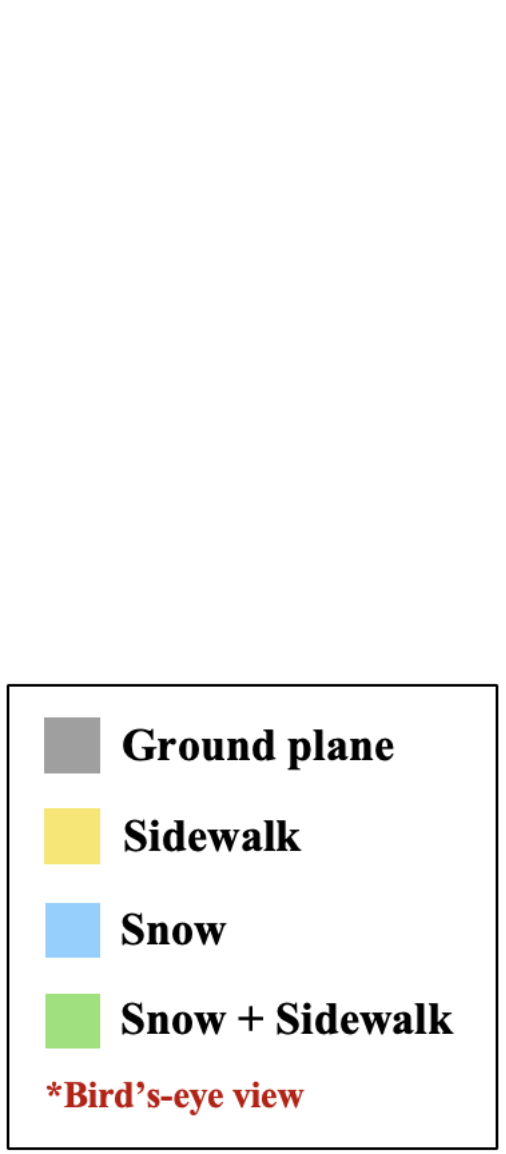
In our application, query images are images from future runs of the bus when there could be snowfall. This part of the method involves classifying a query image as Clear or Snow-covered (Fig. 6(c)).
-
1.
Check if the query image belongs to the scene.
For a given query image, we use GPS information to check if the query belongs to the point cloud. If the query is within the GPS range for the scene, we proceed. -
2.
Identify the snow coverage in the query, if any is present.
We use the Mask2Former model[3] to segment the snow in the query and proceed if snow is present. -
3.
Estimate the camera pose of the query.
If the query does belong to the scene, we add the query to the collection of reference images and re-run COLMAP to obtain an estimated camera pose for the query. Sometimes, COLMAP needs to be re-run more than once to obtain an accurate pose for the query. This reconstruction does not take as long as the initial point cloud rendering because the query is simply added to the existing reconstruction. -
4.
Compare the snow coverage to the expected sidewalk area.
Using the estimated camera pose and ground plane, we project the saved sidewalk points from the point cloud into the image. Finally, we calculate the proportion of the projected sidewalk that overlaps with the snow. -
5.
Generate an alert if the snow significantly covers the expected sidewalk area.
If the coverage is greater than a set threshold, we generate an alert. See Sec. IV for details about selecting an alert threshold.
IV RESULTS
We evaluate by first reconstructing the ground truth sidewalks for two stretches that include bus stops. These stretches were chosen based on where there were images from the categories described below. We select and evenly split test images taken during daylight hours into three categories:
-
1.
Clear
This category includes images in clear weather from February 2022 when the sidewalk in the chosen stretch is clear (Fig. 7(a)). These images should be classified as Clear and are distinct from the reference images originally used to render the point cloud. -
2.
Snow-covered
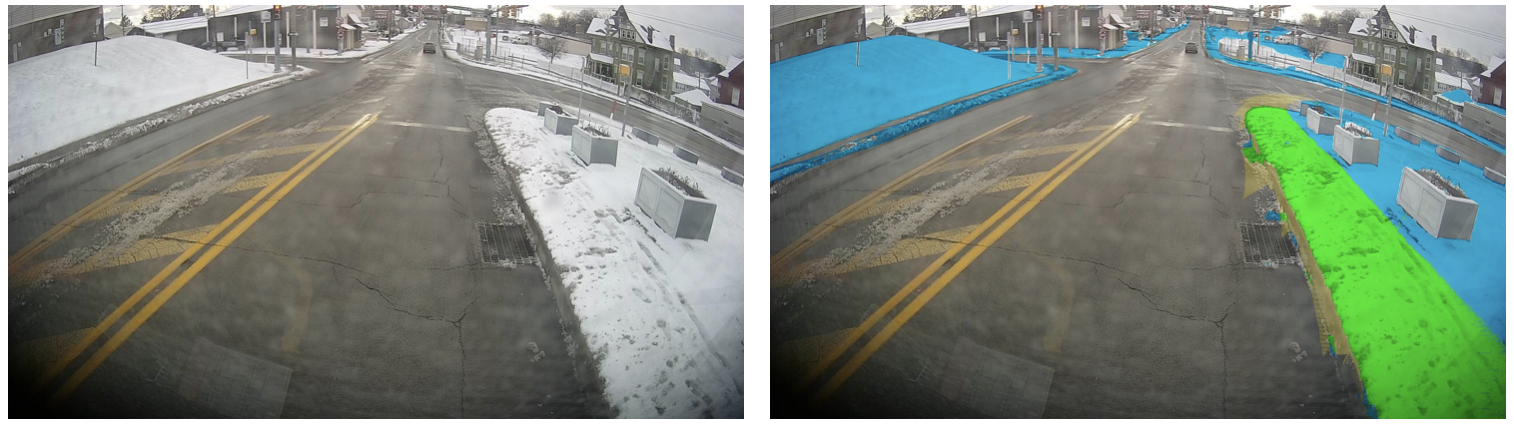
This category includes images in which the sidewalks are obscured by snow (Fig. 7(b)). These images should be classified as Snow-covered and were taken on January \nth7, 2022 when a snowstorm occurred in the Pittsburgh area. -
3.
Cleared
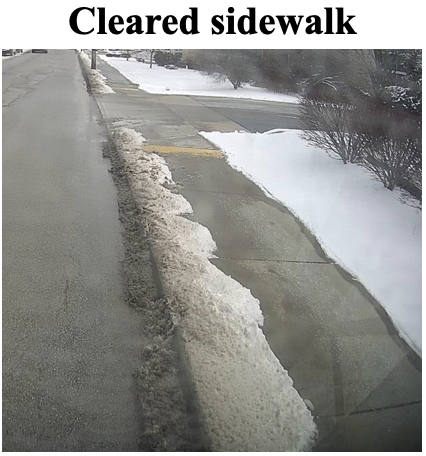
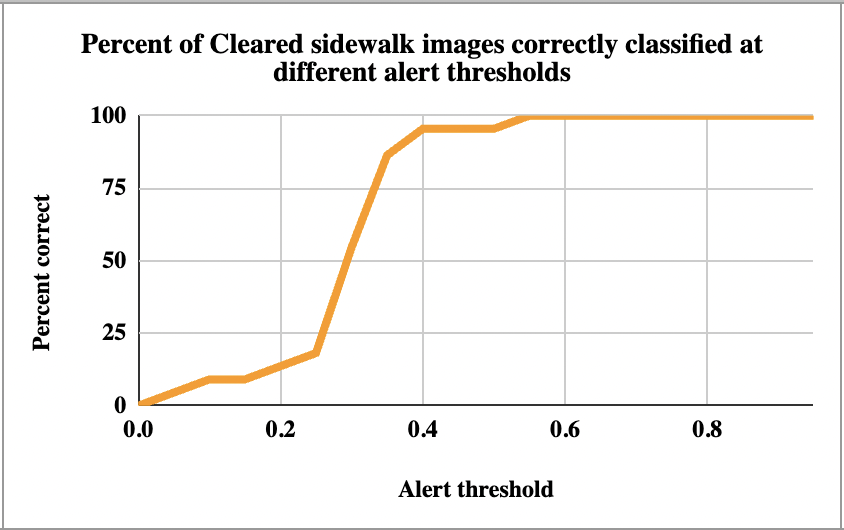
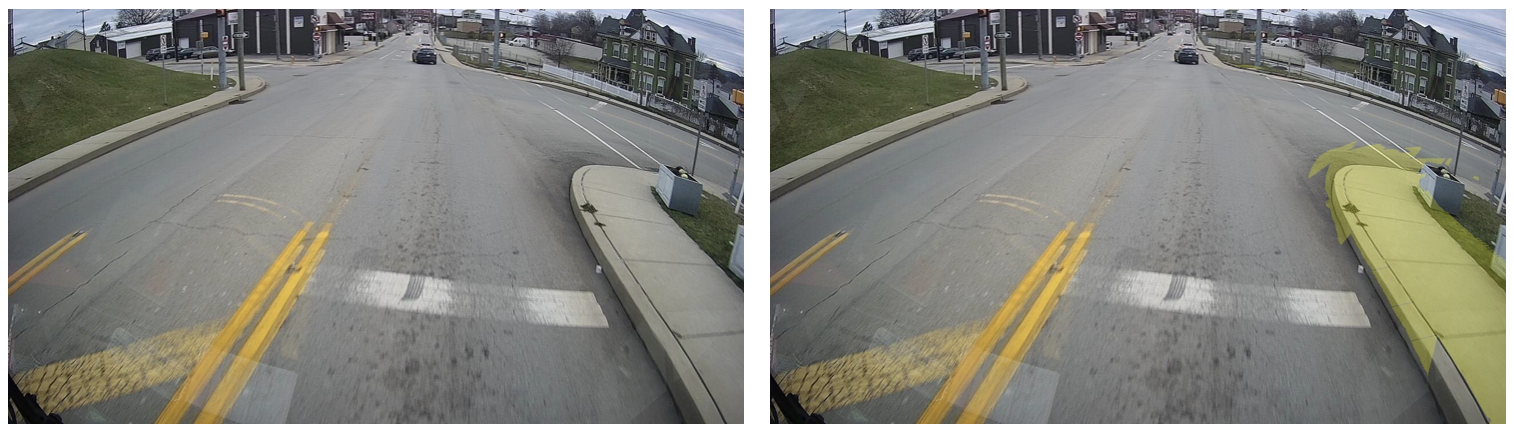
This category includes images in which the sidewalks are surrounded by but not covered with snow (i.e. the sidewalks have been cleared) (Fig. 7(c)). These images are important because snow is present in the image but does not obstruct the sidewalk. These images should be classified as Clear; we do not need to distinguish between clear and cleared sidewalks. Like the snow-covered images, these images were taken on January \nth7, 2022 though in a different stretch.
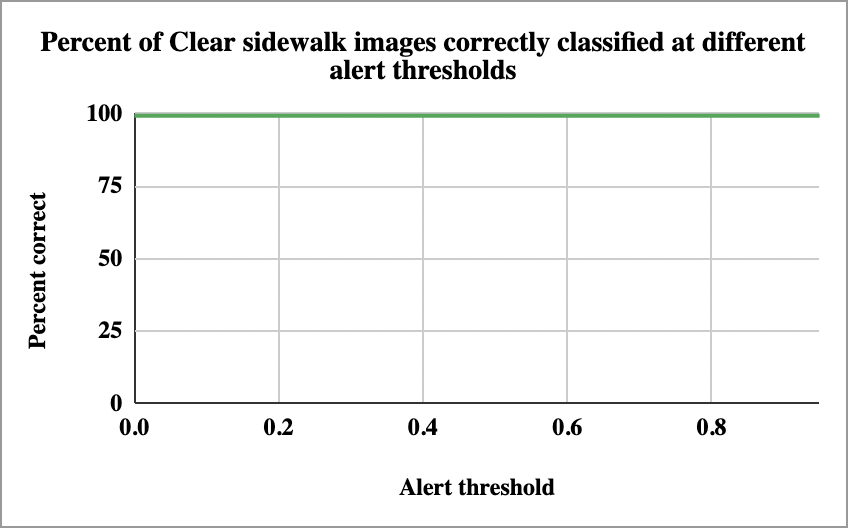
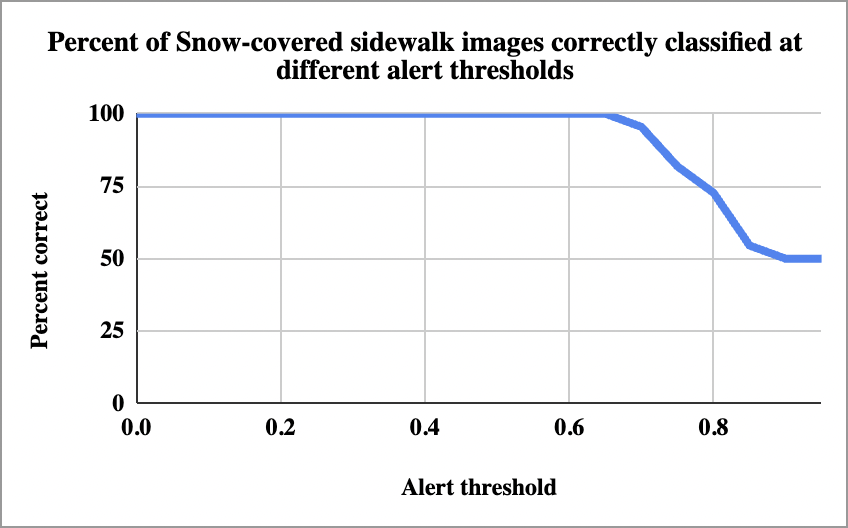
For each category, we obtain the percent of images that are correctly classified as either Snow-covered or Clear across incremented alert thresholds. For clear images, our method trivially performs well across all thresholds because there is no snow present in any of the images (Fig. 8(a)). For snow-covered sidewalks, our method performs well until a threshold of around (Fig. 8(b)). This trend is reasonable because a snow-covered sidewalk will have a high, but not necessarily perfect, overlap with the snow in the image. Finally, for cleared sidewalks, our method performs better as the threshold increases (Fig. 8(c)). This trend is reasonable because a stricter (i.e. higher) threshold will classify more images as Clear.
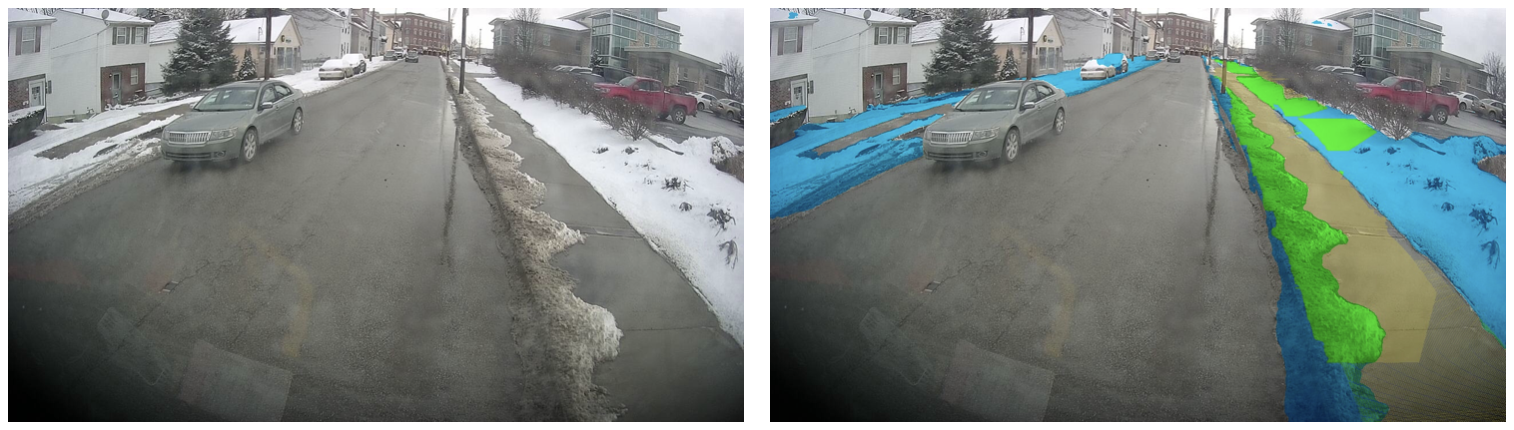
Since we need a threshold that will perform well across all categories, we identify to as a good range of thresholds. We include some example qualitative results from each test category at an alert threshold of (Fig. 9). The saved sidewalk points that are projected into the query image generally align well with the real sidewalk in the query. The few misalignments that we observe (Fig. 9(c)) are most likely due to an inaccurate estimated camera pose for the query and/or for some of the reference images when projecting the ground truth sidewalk masks into the point cloud.
V CONCLUSIONS
In this paper, we present and demonstrate a less data-intensive method for detecting snow-covered sidewalks along bus routes. Our method leverages Structure from Motion to learn the expected locations of sidewalks during clear weather and then uses the learned locations to determine if the sidewalks become covered with snow. By evaluating on different categories of sidewalks, we identify a range of thresholds across which this method performs well for our bus route.
For our particular application, an immediate extension of this method is to incorporate GPS information to form a full route of point clouds. However, our method can also extend to other hazardous conditions such as snow-covered bike lanes or roads.
One limitation of this method is its dependence on keypoints. The effectiveness of the SIFT descriptors in the SfM process depends on the presence of robust and unique keypoints. This, in turn, can affect the estimated camera poses for each image.
In urban scenes, there exist many buildings, signs, and sometimes monuments that provide such keypoints. However, there may not exist many salient keypoints in rural areas Likewise, in night settings, keypoints can be less visible. In these cases, it would be interesting to experiment with adding GPS information for feature matching in SfM.
ACKNOWLEDGMENT
This research was supported by the National Science Foundation under Award No. 2038612. Data and background software were provided by projects sponsored by Carnegie Mellon University’s Mobility21 National University Transportation Center, which is sponsored by the United States Department of Transportation. We would also like to thank Dr. John M. Dolan, Rachel Burcin, and the RISS program and sponsors for further supporting this project.
References
- [1] C. Ye, “BusEdge: Efficient Live Video Analytics for Transit Buses via Edge Computing,” Master’s thesis, Carnegie Mellon University, Pittsburgh, PA, July 2021.
- [2] A. Kirillov, K. He, R. Girshick, C. Rother, and P. Dollar, “Panoptic Segmentation,” in Proceedings of the IEEE/CVF Conference on Computer Vision and Pattern Recognition (CVPR), June 2019.
- [3] B. Cheng, I. Misra, A. G. Schwing, A. Kirillov, and R. Girdhar, “Masked-attention Mask Transformer for Universal Image Segmentation,” 2022.
- [4] A. Dosovitskiy, L. Beyer, A. Kolesnikov, D. Weissenborn, X. Zhai, T. Unterthiner, M. Dehghani, M. Minderer, G. Heigold, S. Gelly, J. Uszkoreit, and N. Houlsby, “An Image is Worth 16x16 Words: Transformers for Image Recognition at Scale,” in International Conference on Learning Representations, 2021. [Online]. Available: https://openreview.net/forum?id=YicbFdNTTy
- [5] Q. A. Al-Haija, M. Gharaibeh, and A. Odeh, “Detection in Adverse Weather Conditions for Autonomous Vehicles via Deep Learning,” AI, vol. 3, no. 2, pp. 303–317, 2022. [Online]. Available: https://www.mdpi.com/2673-2688/3/2/19
- [6] M. N. Khan and M. M. Ahmed, “Snow Detection using In-Vehicle Video Camera with Texture-Based Image Features Utilizing K-Nearest Neighbor, Support Vector Machine, and Random Forest,” Transportation Research Record, vol. 2673, no. 8, pp. 221–232, 2019. [Online]. Available: https://doi.org/10.1177/0361198119842105
- [7] J. Carrillo, M. Crowley, G. Pan, and L. Fu, “Comparison of Deep Learning models for Determining Road Surface Condition from Roadside Camera Images and Weather Data,” in The Transportation Association of Canada and Intelligent Transportation Systems Canada Joint Conference (TAC-ITS), Halifax, Canada, 2019, p. 16.
- [8] A. Lagorio, E. Grosso, and M. Tistarelli, “Automatic Detection of Adverse Weather Conditions in Traffic Scenes,” in 2008 IEEE Fifth International Conference on Advanced Video and Signal Based Surveillance, 2008, pp. 273–279.
- [9] X.-Z. Chen, C.-M. Chang, C.-W. Yu, and Y.-L. Chen, “A Real-Time Vehicle Detection System under Various Bad Weather Conditions Based on a Deep Learning Model without Retraining,” Sensors, vol. 20, no. 20, 2020. [Online]. Available: https://www.mdpi.com/1424-8220/20/20/5731
- [10] M. Hnewa and H. Radha, “Object Detection Under Rainy Conditions for Autonomous Vehicles: A Review of State-of-the-Art and Emerging Techniques,” IEEE Signal Processing Magazine, vol. 38, no. 1, pp. 53–67, 2021.
- [11] M. Hassaballah, M. A. Kenk, K. Muhammad, and S. Minaee, “Vehicle Detection and Tracking in Adverse Weather Using a Deep Learning Framework,” IEEE Transactions on Intelligent Transportation Systems, vol. 22, no. 7, pp. 4230–4242, 2021.
- [12] A. Kar, A. Prakash, M.-Y. Liu, E. Cameracci, J. Yuan, M. Rusiniak, D. Acuna, A. Torralba, and S. Fidler, “Meta-Sim: Learning to Generate Synthetic Datasets,” in Proceedings of the IEEE/CVF International Conference on Computer Vision (ICCV), October 2019.
- [13] W. Lu, Y. Zhou, G. Wan, S. Hou, and S. Song, “L3-Net: Towards Learning Based LiDAR Localization for Autonomous Driving,” in 2019 IEEE/CVF Conference on Computer Vision and Pattern Recognition (CVPR), 2019, pp. 6382–6391.
- [14] J. Levinson, M. Montemerlo, and S. Thrun, “Map-Based Precision Vehicle Localization in Urban Environments,” in Robotics: Science and Systems, 2007.
- [15] J. Levinson and S. Thrun, “Robust vehicle localization in urban environments using probabilistic maps,” 2010 IEEE International Conference on Robotics and Automation, pp. 4372–4378, 2010.
- [16] R. Kummerle, D. Hahnel, D. Dolgov, S. Thrun, and W. Burgard, “Autonomous driving in a multi-level parking structure,” in 2009 IEEE International Conference on Robotics and Automation, 2009, pp. 3395–3400.
- [17] R. W. Wolcott and R. M. Eustice, “Fast LIDAR localization using multiresolution Gaussian mixture maps,” in 2015 IEEE International Conference on Robotics and Automation (ICRA), 2015, pp. 2814–2821.
- [18] X. Chen, I. Vizzo, T. Läbe, J. Behley, and C. Stachniss, “Range Image-based LiDAR Localization for Autonomous Vehicles,” 2021 IEEE International Conference on Robotics and Automation (ICRA), pp. 5802–5808, 2021.
- [19] P. Wang, “Research on Comparison of LiDAR and Camera in Autonomous Driving,” Journal of Physics: Conference Series, vol. 2093, no. 1, p. 012032, nov 2021. [Online]. Available: https://doi.org/10.1088/1742-6596/2093/1/012032
- [20] R. Firoozi, J. Guanetti, R. Horowitz, and F. Borrelli, “Vehicle Localization and Control on Roads with Prior Grade Map,” in 2018 IEEE Conference on Decision and Control (CDC), 2018, pp. 6982–6987.
- [21] E. J. Almazan, Y. Qian, and J. H. Elder, “Road segmentation for classification of road weather conditions,” in Computer Vision – ECCV 2016 Workshops, G. Hua and H. Jégou, Eds. Cham: Springer International Publishing, 2016, pp. 96–108.
- [22] G. Cheng, Y. Qian, and J. H. Elder, “Fusing Geometry and Appearance for Road Segmentation,” in Proceedings of the IEEE International Conference on Computer Vision (ICCV) Workshops, Oct 2017.
- [23] D. Kothandaraman, R. Chandra, and D. Manocha, “SS-SFDA: Self-Supervised Source-Free Domain Adaptation for Road Segmentation in Hazardous Environments,” in Proceedings of the IEEE/CVF International Conference on Computer Vision (ICCV) Workshops, October 2021, pp. 3049–3059.
- [24] S. Ullman, “The Interpretation of Structure from Motion,” Proceedings of the Royal Society of London. Series B, Biological Sciences, vol. 203, no. 1153, pp. 405–426, 1979. [Online]. Available: http://www.jstor.org/stable/77505
- [25] R. I. Hartley and A. Zisserman, Multiple View Geometry in Computer Vision, 2nd ed. Cambridge University Press, ISBN: 0521540518, 2004.
- [26] N. Snavely, S. M. Seitz, and R. Szeliski, “Photo Tourism: Exploring Photo Collections in 3D,” ACM Trans. Graph., vol. 25, no. 3, p. 835–846, jul 2006. [Online]. Available: https://doi.org/10.1145/1141911.1141964
- [27] J. L. Schönberger and J.-M. Frahm, “Structure-from-Motion Revisited,” in Conference on Computer Vision and Pattern Recognition (CVPR), 2016.
- [28] J. L. Schönberger, E. Zheng, M. Pollefeys, and J.-M. Frahm, “Pixelwise View Selection for Unstructured Multi-View Stereo,” in European Conference on Computer Vision (ECCV), 2016.
- [29] D. Crandall, A. Owens, N. Snavely, and D. Huttenlocher, “Discrete-Continuous Optimization for Large-scale Structure from Motion,” in IEEE Conference on Computer Vision and Pattern Recognition (CVPR), 2011.
- [30] C. Campos, R. Elvira, J. J. G. Rodr’iguez, J. M. M. Montiel, and J. D. Tardós, “ORB-SLAM3: An Accurate Open-Source Library for Visual, Visual–Inertial, and Multimap SLAM,” IEEE Transactions on Robotics, vol. 37, pp. 1874–1890, 2021.
- [31] S. Wang, R. Clark, H. Wen, and N. Trigoni, “DeepVO: Towards end-to-end visual odometry with deep Recurrent Convolutional Neural Networks,” in 2017 IEEE International Conference on Robotics and Automation (ICRA), 2017, pp. 2043–2050.
- [32] T. Bu, “Towards HD Map Updates with Crosswalk Change Detection from Vehicle-Mounted Cameras,” Master’s thesis, Carnegie Mellon University, Pittsburgh, PA, August 2022.
- [33] O. Özyeşil, V. Voroninski, R. Basri, and A. Singer, “A Survey of Structure from Motion,” Acta Numerica, vol. 26, p. 305–364, 2017.
- [34] G. LoweDavid, “Distinctive Image Features from Scale-Invariant Keypoints,” International Journal of Computer Vision, 2004.
- [35] D. DeTone, T. Malisiewicz, and A. Rabinovich, “SuperPoint: Self-Supervised Interest Point Detection and Description,” in Proceedings of the IEEE Conference on Computer Vision and Pattern Recognition (CVPR) Workshops, June 2018.
- [36] M. A. Fischler and R. C. Bolles, “Random Sample Consensus: A Paradigm for Model Fitting with Applications to Image Analysis and Automated Cartography,” Commun. ACM, vol. 24, no. 6, p. 381–395, jun 1981. [Online]. Available: https://doi.org/10.1145/358669.358692
- [37] G. Neuhold, T. Ollmann, S. R. Bulò, and P. Kontschieder, “The Mapillary Vistas Dataset for Semantic Understanding of Street Scenes,” in 2017 IEEE International Conference on Computer Vision (ICCV), 2017, pp. 5000–5009.
- [38] Stanford Artificial Intelligence Laboratory et al., “Robot Operating System.” [Online]. Available: https://www.ros.org/
- [39] B. Cheng, A. G. Schwing, and A. Kirillov, “Per-Pixel Classification is Not All You Need for Semantic Segmentation,” 2021.