Ambiguous Images With Human Judgments for Robust Visual Event Classification
Abstract
Contemporary vision benchmarks predominantly consider tasks on which humans can achieve near-perfect performance. However, humans are frequently presented with visual data that they cannot classify with 100% certainty, and models trained on standard vision benchmarks achieve low performance when evaluated on this data. To address this issue, we introduce a procedure for creating datasets of ambiguous images and use it to produce SQUID-E ("Squidy"), a collection of noisy images extracted from videos. All images are annotated with ground truth values and a test set is annotated with human uncertainty judgments. We use this dataset to characterize human uncertainty in vision tasks and evaluate existing visual event classification models. Experimental results suggest that existing vision models are not sufficiently equipped to provide meaningful outputs for ambiguous images and that datasets of this nature can be used to assess and improve such models through model training and direct evaluation of model calibration. These findings motivate large-scale ambiguous dataset creation and further research focusing on noisy visual data.111Dataset and code are available at https://katesanders9.github.io/ambiguous-images.
1 Introduction
When making decisions, the human brain uses perceptual uncertainty judgments to account for missing visual information and other noise denison2018humans ; adler2018comparing ; fleming2017self . For instance, when humans enter a new environment, they must quickly gauge what events are taking place in it using limited sensory input radvansky2011event ; zacks2007event ; zacks2020event . However, this practice is not reflected in most vision models. Robustness to out-of-domain or otherwise noisy data has been an area of focus within the computer vision community in recent years drenkow2021robustness ; apostolidis2021survey with various studies showing model limitations in this regard. However, little work has been done on classifying images that humans also struggle to classify accurately. This lack of emphasis on ambiguous data can cause poor model performance on noisy images that require human uncertainty quantification.
Due to the temporal nature of events and their semantic complexity, visual event classification invites significant data-driven ambiguity. A common task in visual event classification is situation recognition, where a model must identify the verb and corresponding semantic roles (e.g. subject, object, place, reason, etc.) depicted in an image to characterize the event taking place yatskar2016situation . In a typical framework, a situation recognition model first classifies the verb depicted in the image using an action recognition network and then, given that predicted verb, recurrently identifies semantic roles associated with it shown in the image pratt2020grounded . This paradigm lends itself particularly poorly to ambiguous data, as the output of the model depends heavily on correctly identifying the verb depicted using only raw pixels as input. If even humans cannot identify the verb taking place with certainty, then it follows that these models will rarely output meaningful information even when they accurately recognize important event-centric attributes in the data.
Ignoring ambiguity in data can lead to significant consequences in downstream applications. For example, autonomous agents that collaborate with humans in tasks like manufacturing must accurately assess this kind of ambiguous event-based data (such as visual input showing what its human partner is doing) to make behavioral decisions xia2019vision and ensure user safety bascetta2011towards ; mainprice2013human . This requires an ability to produce reliable outputs under perceptual data-driven uncertainty. In some scenarios, a model’s calibration scores may additionally need to resemble judgments made by humans to imitate human behavior and allow for better model interpretation thiagarajan2020calibrating .
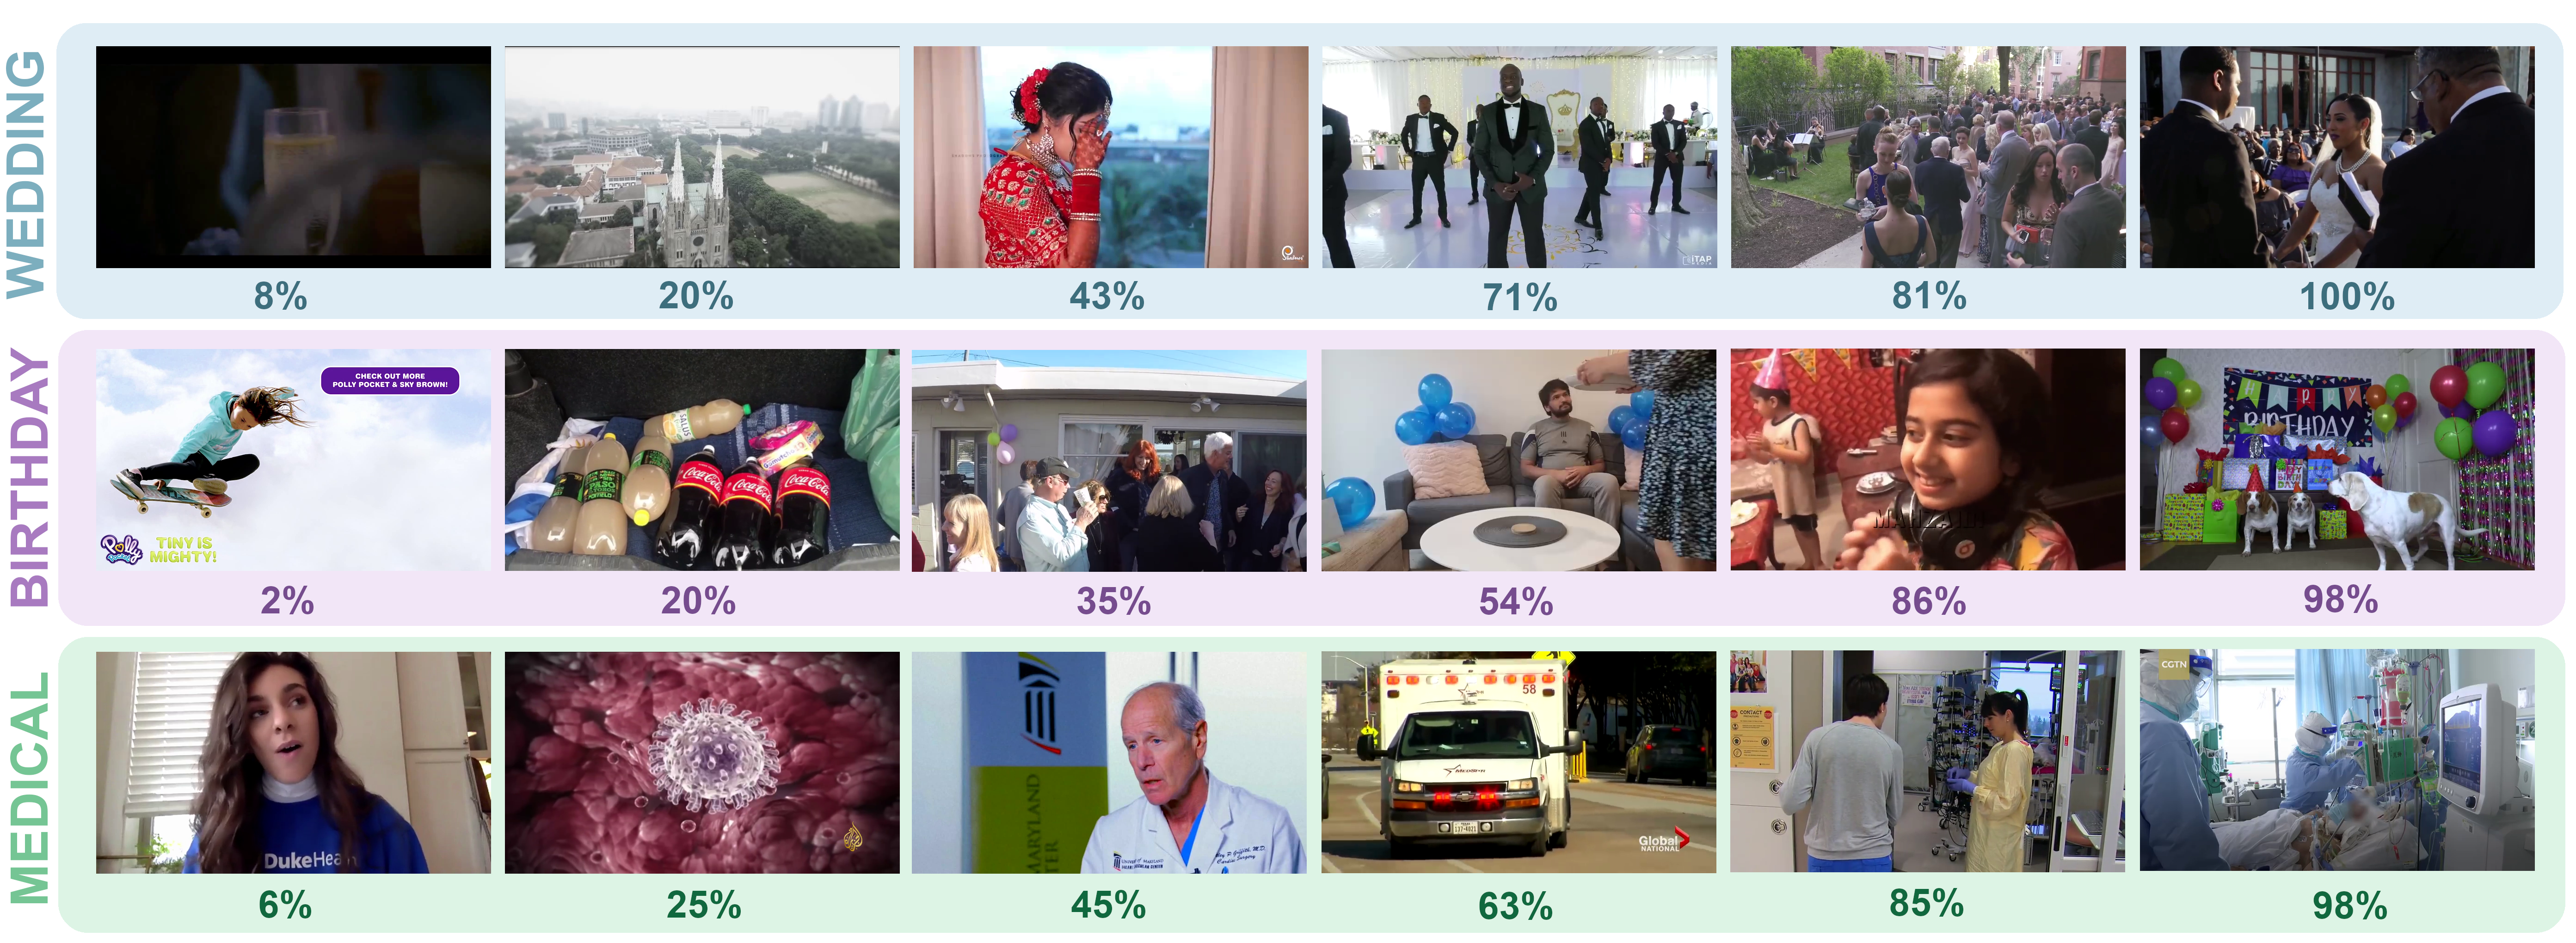
In this paper, we consider the question of how to construct a dataset of noisy images for uncertainty-aware situation recognition. We propose a method for collecting ambiguous images from internet videos and assigning them human judgment scores. This data collection process mitigates the reporting bias found in existing image datasets to model the distribution of visual input experienced by humans. Using this method, we present the first dataset of intentionally ambiguous event-centric images: SQUID-E, or the Scenes with Quantitative Uncertainty Information Dataset for Events. To our knowledge this is also the first event-centric image dataset that uses quantitative human uncertainty judgments as labels. We show in experiments that these images and labels can be used to train robust classification models, assess model accuracy on different distributions of ambiguous data, additionally directly assess model calibration techniques. Sample images and human judgments from SQUID-E are shown in Figure 1.
In summary, we make the following contributions:
-
1.
We introduce a novel method for generating visual uncertainty datasets consisting of noisy images scraped from videos and corresponding human uncertainty judgments.
-
2.
We use this process to construct SQUID-E which consists of 12,000 images with ambiguous contexts, corresponding context labels, and 10,800 human uncertainty judgments for a test set of 1,800 of these images.
-
3.
We demonstrate the applicability of ambiguous image datasets through experiments: We show that training on ambiguous datasets may result in up to a 9-point accuracy improvement on other ambiguous data, existing situation recognition models do not necessarily produce meaningful outputs for ambiguous data, and human uncertainty scores for noisy data can be used to evaluate model calibration approaches.
2 Related Work
2.1 Collecting Ambiguous Data in Computer Vision
While uncertainty in machine learning has been widely studied through lines of work such as model calibration abdar2021review , the practice of using collections of human uncertainty judgments in such efforts is rare. Previous work on collecting information beyond a single label are largely motivated by the issues of training and evaluating models using the standard “clean" dataset. For example, Beyer et al. beyer2020we explore the issue of model overfitting on standard labeling paradigms such as that used to construct ImageNet deng2009imagenet by using soft human-annotated label distributions, exploring how even “high-certainty" data can elicit variance in human responses. Along this line of work, Peterson et al. peterson2019human construct a dataset of CIFAR-10 krizhevsky2009learning images labeled with distributions of human judgments. Other work schmarje2021fuzzy ; collins2022eliciting ; vyas2020learning considers frameworks for learning from fuzzy human labels given possibly ambiguous data. Our dataset differs from these papers in that none of the listed datasets include images that are intentionally ambiguous, or depict more than a single object.
Furthermore, the human labels used in previous datasets do not include individual human uncertainty judgments. For example, Misra et al. misra2016seeing explore the relationship between the explicit contents of an image and the corresponding semantic components that humans label, characterizing the reporting bias of humans, while we solicit quantitative uncertainty judgments pertaining to the image as a whole and its relationship to event classifications instead. Additionally, we provide possible explanations for how humans make these judgments. Another notable research effort is Chen et al.’s work chen2019uncertain which introduces a dataset of human entailment judgments for the Uncertain Natural Language Inference task in which a model must directly predict these human uncertainty scores. Their annotation process is similar to ours, but is used for text annotation as opposed to images.
2.2 Assessing Human Uncertainty in Ambiguous Data
Works in cognitive science provide a natural motivation for the machine learning community to explore the usage of ambiguous data or uncertainty quantification methods when data are collected from humans. Classic works have introduced a variety of notable ideas including theoretical uncertainty taxonomies bland2012different , the impact of implicit bias and context on judgments sykes2011don ; schustek2018instance ; mussweiler2000numeric , and strategies humans use to produce judgments. tversky1974judgment ; bertana2021dual . Many papers consider how human uncertainty scores align with probability theory raufaste2003testing ; adler2018comparing ; Walker365973 . Ma et al. identify the performance gain achieved by organisms who incorporate uncertainty measures through visual processing, etc. into their decision-making ma2014neural ; devkar2017monkeys ; RePEc:plo:pone00:0040216 ; denison2018humans and perceptual organization zhou2018role . Our work differs from these papers in that we approach this concept from a machine learning perspective.
Work concerned with ambiguity in data in machine learning frequently quantifies it by assessing the aleatoric, or data-driven uncertainty in systems kendall2017uncertainties . In the vision community, aleatoric uncertainty is typically considered in the context of medical image processing, where model calibration is necessary to employ agents in high-stakes applications. A popular method of quantifying aleatoric uncertainty in medical imaging is data augmentation ayhan2018test ; sambyal2021towards , but authors such as Beluch et al. beluch2018power and Reinhold et al. reinhold2020validating use alternate techniques such as ensembling and dropout network layers. Nado et al. nado2021uncertainty produce a system for benchmarking such methods, but does not consider using human uncertainty scores to assess models. To our knowledge no work exists that considers ambiguity in semantically complex images, such as ones that depict events.
Various work has also considered aleatoric uncertainty estimation from a more theoretical perspective. For example, works have considered how aleatoric uncertainty can be measured by estimating the parameters of a Gaussian distribution by maximizing the log likelihood seitzer2022pitfalls ; nix1994estimating ; lakshminarayanan2016simple ; kendall2017uncertainties . Other work considers how outputs produced using this method can be further improved in the case of regression muller2019does ; joo2020being ; mukhoti2020calibrating ; neumann2018relaxed and categorical classification muller2019does ; joo2020being ; mukhoti2020calibrating ; neumann2018relaxed . However, these works usually only consider the aleatoric uncertainty estimation problem in the existing data, but do not directly consider datasets with human uncertainty judgement. In this paper, we consider different sources of uncertainty in the context of human uncertainty judgments. We also investigate how these judgments can be used to train and evaluate models in situation recognition applications.
2.3 Situation Recognition and Verb Prediction
Initially, event-centric image classification was primarily constrained to simple tasks like pose estimation. Early forays into more sophisticated event classification proposed organizing images through frameworks that draw from linguistic event semantics gupta2015visual ; ronchi2015describing . This proposal was built on by Yatskar et al. yatskar2016situation who introduced a FrameNet-based ontology for event classification. Many papers consider novel model architectures and extensions based on this work, some exploring multi-modal extensions li2022clip ; wang2021meed , and others implementing bounding box grounding pratt2020grounded . Wei et al. wei2021rethinking and Cho et al. cho2022collaborative introduce new models that depart from the typical two-stage classification pipeline to better model event attribute relationships. Cho et al. cho2021grounded incorporate transformers in the original architecture, Sadhu et al. sadhu2021visual apply the framework to video understanding, and Dehkordi et al. dehkordi2021still alternatively use a CNN ensembling method. In all of these approaches, it is assumed that the necessary elements to identify the event are clearly depicted in the image, and it is not explored how these models perform when presented with ambiguous data. This is what we explore in this paper.
It is typical for situation recognition models to first predict the verb depicted in a given image and then predict the various semantic roles associated with that verb pratt2020grounded ; cho2021grounded ; cho2022collaborative . Given that the semantic role classification depends on accurate verb classification, it is critical for systems to retrieve reliable information regarding the possible verbs depicted in an input. Therefore, in this paper we focus on the verb prediction modules of these systems. However, these verb prediction modules typically do not consider uncertainty, or image-driven ambiguity. In our work, we consider uncertainty quantification for ambiguous data and focus on techniques that account for aleatoric uncertainty.
3 Dataset Construction
In this section we detail our ambiguous dataset construction approach which we used to develop SQUID-E. Our process consists of (1) scraping YouTube for videos of specific events, (2) extracting visually distinct images from these videos, (3) identifying careful annotators to provide human judgments, and (4) executing the full annotation task using images collected in steps (1) and (2) to produce a set of corresponding human uncertainty judgments.
3.1 Image Collection
Considering Reporting Bias The distribution of still images found in publications, internet image libraries, or other corpora is influenced by reporting bias gordon2013reporting : It may not accurately reflect the distribution of visual data humans perceive in real life because images in these corpora are, typically, intentionally selected to maximize saliency. Therefore, most datasets contain images that are generally easy for humans to classify with high certainty. To produce a dataset of noisier, more ambiguous visual data, we extracted images from videos. While videos still suffer from this reporting bias, the video corpora curation processes typically consider the comprehensive contents of an entire video rather than the individual frames that comprise it, resulting in large collections of noisier images that can still be easily classified based on content.
Video Collection and Image Extraction We considered 20 event types, covering topics such as various social activities, sports, and natural disasters. We intentionally selected event types that typically take place over relatively long time frames, allowing for a wide variety of images that can belong to these event types. To populate the dataset, we first scraped YouTube for videos that fall into one of these twenty event types using YouTube’s search algorithm. Search queries involved the name of the event type and related keywords, and were made in multiple languages for each event type. In SQUID-E, we additionally included a selection of videos from the Extended UCF Crime dataset ozturk2021adnet . Retrieved videos were manually checked and removed if they were not relevant or did not contain sufficiently diverse visual content. This process resulted in a collection of 100 videos per event category. Six frames were extracted from each video using a combination of frame sampling and clustering to produce a collection of visually diverse images from each video. Further image collection details are included in Appendix A.1.
3.2 Human Uncertainty Judgment Solicitation
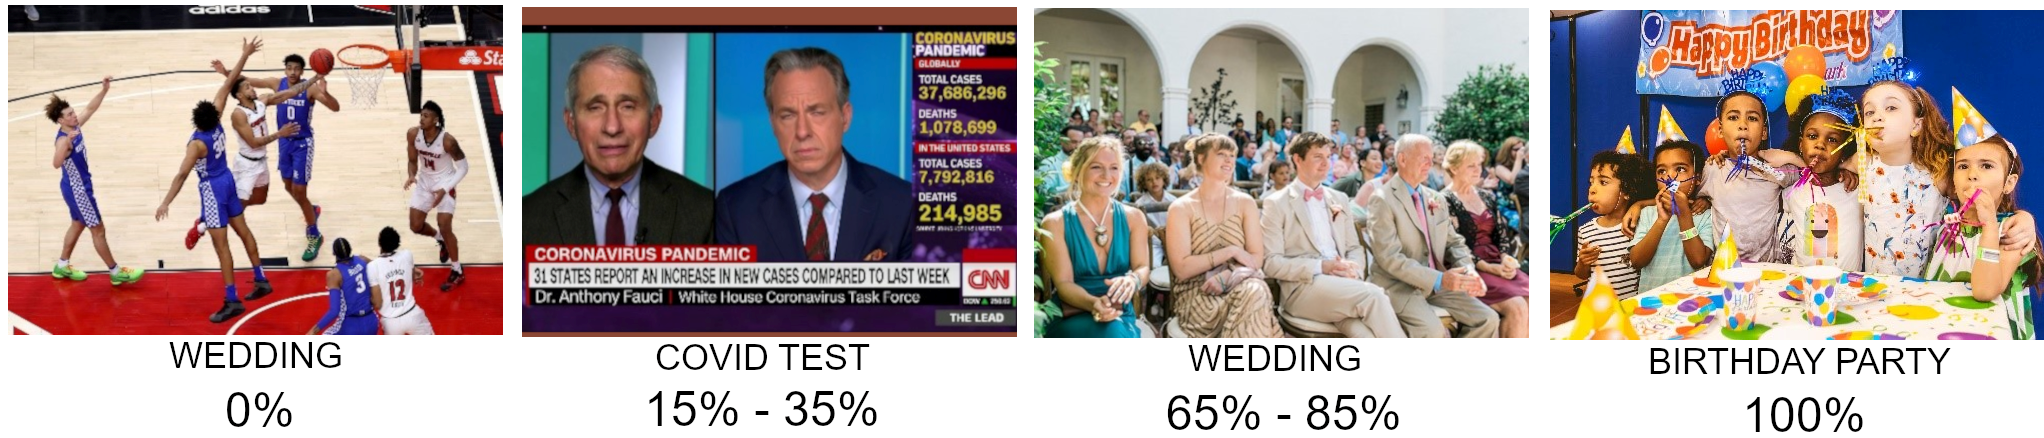
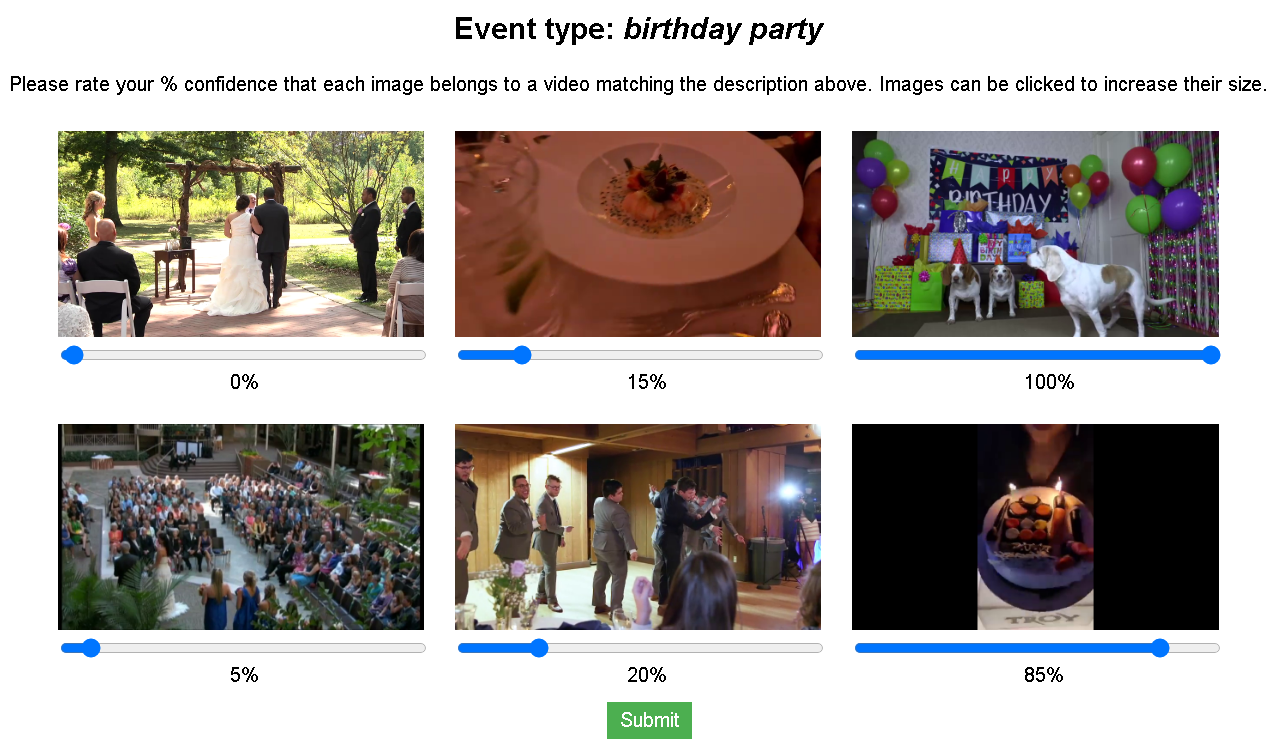
Annotation Setup Annotations were collected for a set of six event types using Amazon Mechanical Turk. Annotators were provided with an event prompt and six images from the dataset. They were then told to rate their confidence that each image belonged to a video depicting the prompted event type using sliding bars ranging from 0% to 100%. Annotators were provided with three example images of each event type and were shown guidelines explaining how to rate their uncertainty on a numerical scale. Notably, annotators were instructed to only rate an image 0% if the image contained a set of visual attributes that necessarily could not appear together alongside the target event type, and rate an image 100% if the image contained a set of attributes that, together, could only belong alongside the target event type. An image should be rated 50% if the annotator felt there was an equal likelihood that the image belonged to a video of the target event type and that the image did not. Examples of images and appropriate ratings given a target event type are shown in Figure 2. The full instructions given to annotators and a screenshot of the annotation setup can be found in Appendix B.
Selecting Annotators A small pilot was first run to identify high-quality annotators. As discussed in the following section, high disagreement on individual image scores is an intrinsic aspect of the task. Therefore, a purely numerical metric such as mean squared error against a ground truth vector could not be used to identify high-quality annotators. Instead, for each set of images, a rubric identifying possible annotator “pitfalls" was established and used to identify lower-quality annotators who either did not read the instructions or did not apply the instructions correctly when evaluating images. Such pitfalls included heuristics such as rating completely black images above 5%, rating images with text clearly stating the event type below 90% or above 10% (depending on the target event and text), etc. This process produced a set of ten to twenty high-quality annotators per task.
Task Variants To identify whether the other five images on screen influence annotator uncertainty scores for an image, we ran two versions of the annotation task. These two variants present annotators with different sets of images at a time. In Variant A, each of the six images that appeared on screen belonged to the same event type, but were sampled from different videos. In Variant B, given a target event type, three frames on screen belonged to videos depicting that target event type, and the other three frames belonged to videos of the event type most semantically similar to the target event type (e.g., three frames from the "birthday" event type and three frames from the "wedding" event type, or three frames from the "parade" event type and three frames from the "protest" event type). The semantic similarity of events was calculated using FrameNet templates. No annotator participated in both task variants after the pilots were completed.
4 Ambiguity of Data
4.1 Inter-Annotator Agreement
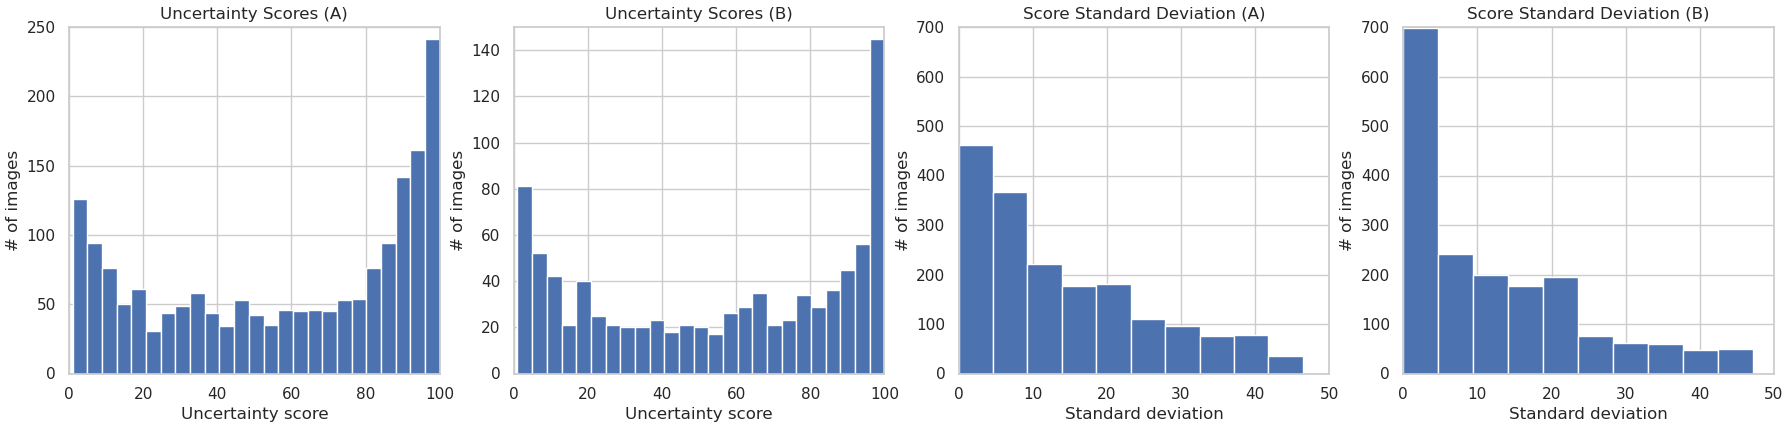
We explicitly aim to quantify the data-driven noise in images through the dataset’s numerical human judgments. However, the set of collected human judgments has its own inter-annotator variance. In SQUID-E, the Spearman correlation among annotators is 0.676 for Variant A, 0.631 for Variant B, and 0.673 across both variants, indicating that there was not a substantial overall difference in annotator behavior between the two versions of the task, although annotators were slightly more confident when annotating for variant B as shown in Figure 3. Alternative metrics for assessing annotation agreement are considered in Appendix C.
4.2 Intra-Annotator Agreement
While most of the analysis in this section focuses on inter-annotator variation, it is also important to consider how a person may annotate the same data differently across multiple samples, and how this intra-annotator variance may influence the annotations of the dataset. To assess this factor, the six annotators who labeled the most images in the original annotation task were given the task again for a random subset of the images they had already annotated. This study was conducted five months after the original annotations had been collected. Five of the six annotators accepted the task (2 from variant A and 3 from variant B) and annotated 60 images each. The Spearman correlation between an annotators’ original scores and their second set of scores was calculated, and the mean correlation was 0.788. This result suggests that some of the variance in the scores between different annotators is likely due to irreducible variance that would occur even if the two annotators were exactly the same. However, the intra-annotator spearman correlation is still significantly higher than the inter-annotator spearman correlation (0.788 vs. 0.673), indicating that there are additional factors that contribute to different humans rating images differently. We explore these factors below.
4.3 Sources of Annotator Disagreement
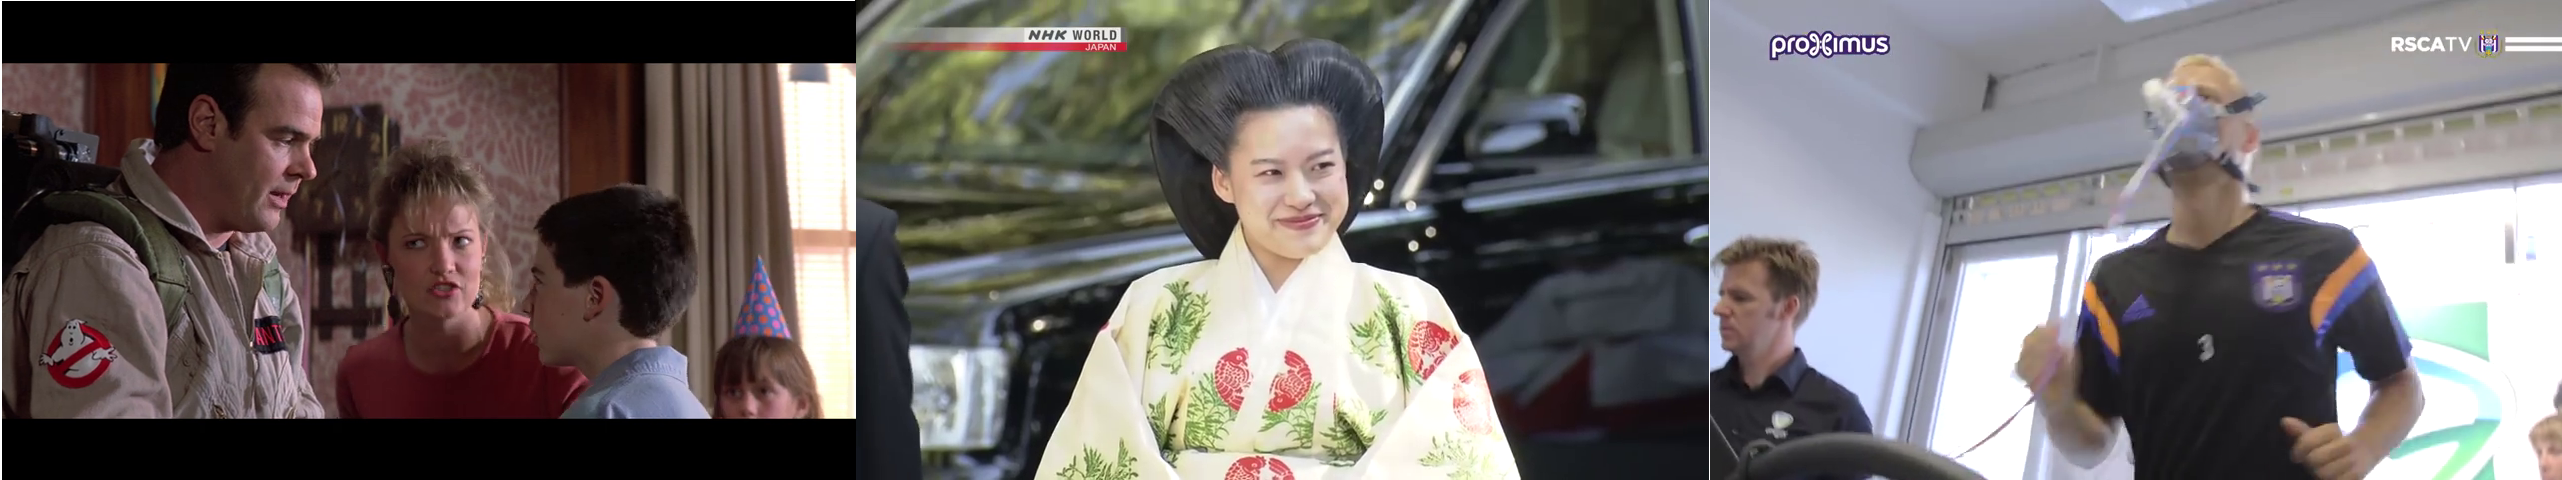
Why do some images produce human judgments with high variance, while others elicit general agreement? Here, we compile possible explanations that illustrate more general human uncertainty quantification trends. Examples of these categories are provided in Figure 4.
Based on an analysis of the human judgments collected for this dataset, the primary sources of inter-annotator variance likely include differences in the following:
-
•
Visual attention. A person’s visual attention can affect their perceptual input and uncertainty calculations carrasco2004attention ; carrasco2011visual ; reynolds2004attentional ; morales2015low ; misra2016seeing . Some studies suggest that visual attention may even directly cause conservative bias in perception rahnev2011attention . We hypothesize that this phenomenon affected the human judgments in our task, since the images in SQUID-E can often be classified as multiple event types depending on where an annotator’s visual attention is focused.
-
•
Background knowledge. Many images require an annotator to hold specific knowledge to classify them accurately, and so people may annotate these images differently depending on their personal knowledge bases. Necessary background knowledge is often cultural, or otherwise related to current events or history. This source of disagreement highlights the importance of formulating tasks and datasets such that they include diverse data and are annotated by diverse annotators liu2021visually .
-
•
Uncertainty quantification strategies. Prior work explores various sources of human probability estimation error and noise, indicating that one notable factor is that the way humans calculate probability is inherently imperfect. tversky1974judgment ; kahneman2021noise ; erev1994simultaneous These studies detail heuristics and psychological biases that influence human judgments that are not necessarily caused by external factors such as input or contextual knowledge. We hypothesize that this type of internal factor, divorced from visual input and knowledge bases, may affect annotator score discrepancy.
In addition to these sources, it is highly probable that some of the annotation variance can be attributed to annotator carelessness. In other cases, the underlying cause of this variance may be due to a combination of the sources listed above. The complexity of the factors affecting annotator uncertainty scores illustrates the nuance of human uncertainty judgments and indicates that more research may need to be conducted in this field to better understand in what way humans differ in their processing of uncertain sensory input.
5 Experiments
We run three experiments using SQUID-E to demonstrate the uses of ambiguous image datasets in training and evaluating models: (1) We show how training models on ambiguous images can improve their accuracy when classifying other ambiguous images by comparing models trained on “high-certainty" data with a model trained on SQUID-E. (2) We illustrate how SQUID-E can be used to assess existing situation models’ performance on varying degrees of noisy data by evaluating state-of-the-art models on a subset of SQUID-E and partitioning their performance on SQUID-E’s human labels. (3) We explore how SQUID-E can be used to directly evaluate model calibration techniques by comparing model confidence scores to SQUID-E’s human labels. Additional details regarding experiments are included in Appendix D. We use mean human annotation scores as human labels for these experiments, which is compared to other aggregation approaches in Appendix D.3.
5.1 Training on SQUID-E for Event Classification
Models We compare the accuracy of models trained on standard, “high-certainty" data and models trained on ambiguous images. We train one ResNet-based model using images from SQUID-E (RN+ES), and a set of ResNet-based models using images from standard, high-certainty image datasets (Visual Genome krishnavisualgenome , Crowd Activity wang2022knowledge , USED ahmad2016used , WIDER xiong2015recognize , and UCLA Protest Images won2017protest ): RN+SD is trained on the images with no augmentation techniques, RN+PA is trained with photometric augmentation filters, RN+GA is trained with geometric augmentation filters, RN+NM is trained with noise injection and masking, RN+AU is trained with a combination of the augmentation filters listed above, and RN+AM is trained with the AugMix augmentation method hendrycks2019augmix .
Task We consider a four-way classification task using birthday party, wedding, parade, and protest images (with their respective event names as labels), since these are the four event types that are both represented in existing high-certainty image datasets and have human labels in SQUID-E. We train each model on these four event types using the same number of images from the two datsets. We run this experiment across 10 seeds and report mean accuracy and standard deviation in Table 1.
| Model | 0-20% | 20-40% | 40-60% | 60-80% | 80-100% | Avg. Acc | SD Acc. |
|---|---|---|---|---|---|---|---|
| RN+SD | .34 .07 | .47 .05 | .53 .03 | .69 .02 | .75 .02 | .61 .02 | .93 .00 |
| RN+PA | .27 .03 | .32 .02 | .47 .05 | .65 .02 | .74 .02 | .57 .02 | .90 .01 |
| RN+GA | .38 .05 | .37 .03 | .57 .03 | .63 .03 | .78 .01 | .64 .01 | .89 .01 |
| RN+NM | .28 .05 | .45 .03 | .61 .02 | .69 .02 | .81 .02 | .64 .02 | .91 .01 |
| RN+AU | .35 .03 | .37 .02 | .57 .03 | .61 .02 | .80 .01 | .64 .01 | .87 .01 |
| RN+AM | .31 .05 | .40 .08 | .53 .03 | .69 .02 | .77 .03 | .60 .02 | .93 .00 |
| RN+ES | .51 .04 | .49 .03 | .70 .04 | .67 .02 | .81 .02 | .70 .01 | .71 .02 |
Results The results in Table 1 suggest that while data augmentation can improve model results on ambiguous data, it is not necessarily as effective as training on ambiguous data. The results indicate that this is the case even for images with relatively high certainty annotations. However, RN+ES having high accuracy scores for the lower certainty bins seems to indicate that it is poorly calibrated compared to the other approaches. While this may just be poor calibration, we hypothesize that this result is at least partially caused by the small set of possible classification labels in the experiment. In our annotation task, the human annotators had to account for the full range of possible event types that could occur in a video, but in this experiment the models only select between four event types.
5.2 Evaluating Verb Prediction Models
Models To assess contemporary situation recognition models on ambiguous data, we evaluate the verb prediction modules of three high-performing models on the SQUID-E test set: JSL (Platt et al. pratt2020grounded ), GSRTR (Cho et al. cho2021grounded ), and CoFormer (Cho et al. cho2022collaborative ). These models were selected because of their varied architectures and strong performance on existing benchmarks, and because they have publicly available model weights, ensuring accurate comparisons. JSL uses a ResNet-based verb predictor, GSRTR uses a transformer encoder for verb prediction, and CoFormer uses two transformers for verb prediction (a "glance" transformer and a "gaze" transformer). All three models are trained on the SWiG dataset pratt2020grounded and can classify 504 distinct verbs in images. We specifically assess the models’ verb prediction modules because verb prediction makes up the foundational task of situation recognition and aligns with the course-grained event information we ask annotators to judge in the data collection process. A more detailed explanation is included in appendix D.2.
Task We evaluate each verb classifier on "parade" and "protest" images in SQUID-E, because these are the two event types in SQUID-E that have human labels and also exist within the ImSitu ontology. We consider the top scoring verb from each model as well as the top 10 scoring verbs. Results are partitioned on the images’ human uncertainty scores, and are reported in Table 2 along with top-1 verb prediction performance on SWiG as reported in the models’ respective papers.
| Model | 0-20% | 20-40% | 40-60% | 60-80% | 80-100% | Avg. Acc | SD Acc. |
|---|---|---|---|---|---|---|---|
| Situation Recognition Model Verb Accuracy (Top 1) | |||||||
| JSL | .00 | .07 | .17 | .22 | .52 | .35 | .40 |
| GSRTR | .02 | .09 | .22 | .25 | .59 | .41 | .41 |
| CoFormer | .02 | .13 | .22 | .23 | .58 | .40 | .45 |
| Situation Recognition Model Verb Accuracy (Top 10) | |||||||
| JSL | .11 | .43 | .49 | .72 | .86 | .66 | - |
| GSRTR | .11 | .55 | .54 | .77 | .88 | .70 | - |
| CoFormer | .09 | .42 | .58 | .82 | .91 | .70 | - |
Results This experiment demonstrates how we can use SQUID-E to characterize model performance on noisy data. Using the bin partitions in Table 2, we are able to identify average model performance at different levels of ambiguity. By comparing top-1 accuracy to top-10 accuracy, we are able to identify how much of the accuracy drop between bins is due to fine-tuning compared to more significant image understanding problems. Here, the verb classification models perform well on the 80%-100% certainty SQUID-E images, but top-1 accuracy falls drastically when human certainty drops to 60%-80%. Furthermore, we can see that for the images with labels above 40%, top-10 accuracy is substantially higher than top-1 accuracy, but below this threshold the difference between top-10 accuracy and top-1 accuracy decreases. This indicates that the models are much less likely to extract relevant event features for images rated below 40%. It should also be noted that the ResNet model trained on standard data (RN+SD) in Section 5.1 achieves higher accuracy scores than these situation recognition models’ top-1 verb performance. This can likely be attributed to the fact that RN+SD is trained on four events while these models are trained on 504 verb classes.
5.3 Evaluating Uncertainty Quantification Methods
Models We evaluate a collection of uncertainty quantification approaches on SQUID-E human judgments. We consider a selection of approaches that aim to reduce model overconfidence (label smoothing muller2019does , belief matching joo2020being , focal loss mukhoti2020calibrating , and relaxed softmax neumann2018relaxed ) as well as Monte-Carlo Dropout and a standard softmax + cross entropy loss baseline. We use the ResNet-based architecture described in Section 5.1 for the models in this experiment. We train two copies of each model, one using SQUID-E and one using the "high certainty" dataset introduced in Section 5.1.
Task We consider the task of binary classification where a model must identify whether or not an image belongs to a target event to mirror the annotation task detailed in Section 3.2. We compare mean human judgment scores of the SQUID-E validation set against the softmax logits of the trained models using mean squared error loss. We also report model accuracy on SQUID-E and the standard dataset (see Section 5.1), as well as the expected calibration error (using the ground truth labels). We run this experiment across 8 seeds and report the mean scores and standard deviation in Table 3.
| Trained on SD | Trained on SQUID-E | |||||||
|---|---|---|---|---|---|---|---|---|
| SD Acc | SE Acc | HUJ MSE | ECE | SD Acc | SE Acc | HUJ MSE | ECE | |
| BL | .92 .02 | .69 .02 | .15 .05 | .58 .02 | .76 .03 | .73 .04 | .16 .04 | .61 .05 |
| MC | .92 .02 | .69 .02 | .14 .05 | .57 .03 | .76 .03 | .72 .05 | .16 .04 | .57 .04 |
| LS | .92 .02 | .69 .02 | .12 .03 | .46 .02 | .77 .03 | .73 .04 | .14 .03 | .52 .04 |
| BM | .92 .02 | .69 .02 | .14 .05 | .55 .02 | .76 .03 | .73 .04 | .15 .04 | .58 .04 |
| FL | .92 .02 | .68 .02 | .11 .02 | .42 .02 | .76 .04 | .72 .05 | .12 .02 | .45 .05 |
| RS | .91 .03 | .68 .03 | .12 .03 | .46 .05 | .75 .05 | .73 .05 | .14 .04 | .53 .06 |
Results The model calibration techniques result in human judgment MSE improvements for the models trained on standard data, and more modest improvements for the models trained on SQUID-E. This is noteworthy considering that the models trained on SQUID-E achieve higher accuracy on the SQUID-E validation set. We hypothesize that this poorer calibration on RN+ES could possibly occur because RN+ES overall is less confident due to being trained on ambiguous data, whereas the calibration methods could have a larger impact on the more-confident RN+SD model. It should also be noted that the accuracy scores are slightly different from those in Section 5.2 because this is a binary classification task (to accurately compare against the human annotations which were collected through a binary decision task) while the task used in Section 5.2 was a 4-way classification task.
These results achieved using the models trained on standard data suggest that model calibration techniques can produce models that align better with human judgments. Similarly, they show that human uncertainty judgments can be used to directly evaluate calibration approaches. The MSE and ECE show positive correlation, indicating that comparing against human judgments aligns with more traditional calibration assessment metrics. Based on these results, work remains to be done to identify the best approaches for aligning model confidence with human judgments for noisy data.
6 Limitations, Ethical Considerations, and Alternate Approaches
Limitations SQUID-E only includes human judgments for a small portion of its images, and so models cannot be directly trained on these judgments given the high variance within this domain. Furthermore, each annotated image only has 6 human uncertainty judgments, which is not enough samples to capture the distribution of human judgments for a given image. Experiments in Section 5 are consequently run on a small amount of data and may produce different results if run on different event types, etc. We also cannot guarantee that the frame selection algorithm detailed in Section 3.1 produced the optimal set of visually distinct frames. While we attempted to remove all videos that did not involve a particularly wide range of visual data or contained clips used in other videos, it is likely that not all were filtered out, and so there may be some overly-similar images in the dataset.
Ethical considerations Our video collection queries were made in only 11 languages spoken widely online, and the majority were made in English, which likely produced an uneven distribution of regional and cultural representation within the dataset. Only collecting data via the YouTube platform also skewed the dataset’s coverage. Because of these aspects of our data collection process, our dataset does not proportionately represent the experiences of the global population, which can potentially lead to biased models in downstream tasks. Similarly, we solicited our annotations from people located in the U.S. and used three-way redundancy for both tasks, meaning that the human judgments in the dataset are not representative of the general population, are likely skewed toward Western perspectives, and likely include demographic-driven biases.
While the owners of the videos from which we extracted images were not asked for permission to include their content in the dataset, all used videos have been made publicly available by their creators. If a creator takes their content offline the associated images will automatically be removed from our public dataset loader as well. It should be noted that the videos used to create the dataset were not checked for personally identifiable or offensive content.
Alternate approaches There are multiple interpretations of what makes an image ambiguous, and what sort of ambiguous images are most relevant in the context of computer vision. In this paper, our goal is to minimize reporting bias gordon2013reporting in image collection to retrieve a distribution of images that closely models natural human visual input. However, focusing on subsets of this distribution may provide data better suited for research in certain applications. For instance, some applications may only require images that depict the event type sufficiently well, and so images with low certainty scores should be removed from the main dataset. For other applications, it might be optimal to additionally remove images with high certainty labels and images with higher variance in their annotations. The remaining dataset, consisting of the images rated near the 50% mark with high agreement from annotators, could be used for efforts such as an in-depth analysis of the decision boundary of a model. These are both exciting directions for future work that consider different aspects of ambiguity and would provide opportunities for interesting analysis on these subsets of the dataset.
7 Conclusion
In this paper, we introduce a framework for generating datasets of ambiguous images and human uncertainty judgments and use it to develop SQUID-E (the Scenes with Quantitative Uncertainty Information Dataset for Events) consisting of 12,000 event-based ambiguous images and 10,800 human uncertainty judgments. We explore the characteristics of human uncertainty judgments for ambiguous visual data and show how this dataset can be used to assess the behavior of situation recognition models. Experiment results suggest that there is room for improvement in designing models that produce meaningful outputs when presented with ambiguous data, and that ambiguous datasets with human judgments can be used to train more robust models and to directly evaluate model calibration techniques. These findings motivate the creation of larger-scale ambiguous image datasets to develop more robust models and uncertainty quantification approaches and to further explore the relationship between models and human uncertainty judgments. This work also prompts other future work such as training models to learn individual annotators’ uncertainty scoring functions and developing human-centric model calibration methods using human uncertainty judgments.
Acknowledgments
The authors would like to thank David Etter, Elias Stengel-Eskin, Zhuowan Li, Zhengping Jiang, João Sedoc, and the anonymous reviewers.
References
- [1] Moloud Abdar, Farhad Pourpanah, Sadiq Hussain, Dana Rezazadegan, Li Liu, Mohammad Ghavamzadeh, Paul Fieguth, Xiaochun Cao, Abbas Khosravi, U Rajendra Acharya, et al. A review of uncertainty quantification in deep learning: Techniques, applications and challenges. Information Fusion, 76:243–297, 2021.
- [2] William T Adler and Wei Ji Ma. Comparing bayesian and non-bayesian accounts of human confidence reports. PLoS computational biology, 14(11):e1006572, 2018.
- [3] Kashif Ahmad, Nicola Conci, Giulia Boato, and Francesco GB De Natale. Used: a large-scale social event detection dataset. In Proceedings of the 7th International Conference on Multimedia Systems, pages 1–6, 2016.
- [4] Kyriakos D Apostolidis and George A Papakostas. A survey on adversarial deep learning robustness in medical image analysis. Electronics, 10(17):2132, 2021.
- [5] Murat Seckin Ayhan and Philipp Berens. Test-time data augmentation for estimation of heteroscedastic aleatoric uncertainty in deep neural networks. In Medical Imaging with Deep Learning, 2018.
- [6] Luca Bascetta, Gianni Ferretti, Paolo Rocco, Håkan Ardö, Herman Bruyninckx, Eric Demeester, and Enrico Di Lello. Towards safe human-robot interaction in robotic cells: an approach based on visual tracking and intention estimation. In 2011 IEEE/RSJ international conference on intelligent robots and systems, pages 2971–2978. IEEE, 2011.
- [7] Valerio Basile. It’s the end of the gold standard as we know it. on the impact of pre-aggregation on the evaluation of highly subjective tasks. In 2020 AIxIA Discussion Papers Workshop, AIxIA 2020 DP, volume 2776, pages 31–40. CEUR-WS, 2020.
- [8] Valerio Basile, Michael Fell, Tommaso Fornaciari, Dirk Hovy, Silviu Paun, Barbara Plank, Massimo Poesio, Alexandra Uma, et al. We need to consider disagreement in evaluation. In 1st Workshop on Benchmarking: Past, Present and Future, pages 15–21. Association for Computational Linguistics, 2021.
- [9] William H Beluch, Tim Genewein, Andreas Nürnberger, and Jan M Köhler. The power of ensembles for active learning in image classification. In Proceedings of the IEEE conference on computer vision and pattern recognition, pages 9368–9377, 2018.
- [10] Andrea Bertana, Andrey Chetverikov, Ruben S van Bergen, Sam Ling, and Janneke FM Jehee. Dual strategies in human confidence judgments. Journal of vision, 21(5):21–21, 2021.
- [11] Lucas Beyer, Olivier J Hénaff, Alexander Kolesnikov, Xiaohua Zhai, and Aäron van den Oord. Are we done with imagenet? arXiv preprint arXiv:2006.07159, 2020.
- [12] Amy R Bland and Alexandre Schaefer. Different varieties of uncertainty in human decision-making. Frontiers in neuroscience, 6:85, 2012.
- [13] Marisa Carrasco. Visual attention: The past 25 years. Vision research, 51(13):1484–1525, 2011.
- [14] Marisa Carrasco, Sam Ling, and Sarah Read. Attention alters appearance. Nature neuroscience, 7(3):308–313, 2004.
- [15] Tongfei Chen, Zhengping Jiang, Adam Poliak, Keisuke Sakaguchi, and Benjamin Van Durme. Uncertain natural language inference. arXiv preprint arXiv:1909.03042, 2019.
- [16] Junhyeong Cho, Youngseok Yoon, and Suha Kwak. Collaborative transformers for grounded situation recognition. arXiv preprint arXiv:2203.16518, 2022.
- [17] Junhyeong Cho, Youngseok Yoon, Hyeonjun Lee, and Suha Kwak. Grounded situation recognition with transformers. arXiv preprint arXiv:2111.10135, 2021.
- [18] Romain Cohendet, Claire-Hélène Demarty, Ngoc QK Duong, and Martin Engilberge. Videomem: Constructing, analyzing, predicting short-term and long-term video memorability. In Proceedings of the IEEE/CVF International Conference on Computer Vision, pages 2531–2540, 2019.
- [19] Katherine M Collins, Umang Bhatt, and Adrian Weller. Eliciting and learning with soft labels from every annotator. arXiv preprint arXiv:2207.00810, 2022.
- [20] Hojat Asgarian Dehkordi, Ali Soltani Nezhad, Seyed Sajad Ashrafi, and Shahriar B Shokouhi. Still image action recognition using ensemble learning. In 2021 7th International Conference on Web Research (ICWR), pages 125–129. IEEE, 2021.
- [21] Jia Deng, Wei Dong, Richard Socher, Li-Jia Li, Kai Li, and Li Fei-Fei. Imagenet: A large-scale hierarchical image database. In 2009 IEEE conference on computer vision and pattern recognition, pages 248–255. Ieee, 2009.
- [22] Rachel N Denison, William T Adler, Marisa Carrasco, and Wei Ji Ma. Humans incorporate attention-dependent uncertainty into perceptual decisions and confidence. Proceedings of the National Academy of Sciences, 115(43):11090–11095, 2018.
- [23] Deepna Devkar, Anthony A Wright, and Wei Ji Ma. Monkeys and humans take local uncertainty into account when localizing a change. Journal of Vision, 17(11):4–4, 2017.
- [24] Nathan Drenkow, Numair Sani, Ilya Shpitser, and Mathias Unberath. Robustness in deep learning for computer vision: Mind the gap? arXiv preprint arXiv:2112.00639, 2021.
- [25] Ido Erev, Thomas S Wallsten, and David V Budescu. Simultaneous over-and underconfidence: The role of error in judgment processes. Psychological review, 101(3):519, 1994.
- [26] Stephen M Fleming and Nathaniel D Daw. Self-evaluation of decision-making: A general bayesian framework for metacognitive computation. Psychological review, 124(1):91, 2017.
- [27] Jonathan Gordon and Benjamin Van Durme. Reporting bias and knowledge acquisition. In Proceedings of the 2013 Workshop on Automated Knowledge Base Construction, AKBC ’13, page 25–30, New York, NY, USA, 2013. Association for Computing Machinery.
- [28] Saurabh Gupta and Jitendra Malik. Visual semantic role labeling. arXiv preprint arXiv:1505.04474, 2015.
- [29] Kaiming He, Xiangyu Zhang, Shaoqing Ren, and Jian Sun. Deep residual learning for image recognition. arxiv 2015. arXiv preprint arXiv:1512.03385, 2015.
- [30] Dan Hendrycks, Norman Mu, Ekin D Cubuk, Barret Zoph, Justin Gilmer, and Balaji Lakshminarayanan. Augmix: A simple data processing method to improve robustness and uncertainty. arXiv preprint arXiv:1912.02781, 2019.
- [31] Taejong Joo, Uijung Chung, and Min-Gwan Seo. Being bayesian about categorical probability. In International Conference on Machine Learning, pages 4950–4961. PMLR, 2020.
- [32] Daniel Kahneman, Olivier Sibony, and Cass R Sunstein. Noise: A flaw in human judgment. Little, Brown, 2021.
- [33] Alex Kendall and Yarin Gal. What uncertainties do we need in bayesian deep learning for computer vision? Advances in neural information processing systems, 30, 2017.
- [34] Shaiyan Keshvari, Ronald van den Berg, and Wei Ji Ma. Probabilistic Computation in Human Perception under Variability in Encoding Precision. PLOS ONE, 7(6):1–9, June 2012.
- [35] Ranjay Krishna, Yuke Zhu, Oliver Groth, Justin Johnson, Kenji Hata, Joshua Kravitz, Stephanie Chen, Yannis Kalantidis, Li-Jia Li, David A Shamma, et al. Visual genome: Connecting language and vision using crowdsourced dense image annotations. International journal of computer vision, 123(1):32–73, 2017.
- [36] Alex Krizhevsky and Geoffrey Hinton. Learning multiple layers of features from tiny images. Technical Report 0, University of Toronto, Toronto, Ontario, 2009.
- [37] Balaji Lakshminarayanan, Alexander Pritzel, and Charles Blundell. Simple and scalable predictive uncertainty estimation using deep ensembles. arxiv e-prints, page. arXiv preprint arXiv:1612.01474, 5, 2016.
- [38] Manling Li, Ruochen Xu, Shuohang Wang, Luowei Zhou, Xudong Lin, Chenguang Zhu, Michael Zeng, Heng Ji, and Shih-Fu Chang. Clip-event: Connecting text and images with event structures. arXiv preprint arXiv:2201.05078, 2022.
- [39] Fangyu Liu, Emanuele Bugliarello, Edoardo Maria Ponti, Siva Reddy, Nigel Collier, and Desmond Elliott. Visually grounded reasoning across languages and cultures. arXiv preprint arXiv:2109.13238, 2021.
- [40] Wei Ji Ma and Mehrdad Jazayeri. Neural coding of uncertainty and probability. Annual review of neuroscience, 37:205–220, 2014.
- [41] Jim Mainprice and Dmitry Berenson. Human-robot collaborative manipulation planning using early prediction of human motion. In 2013 IEEE/RSJ International Conference on Intelligent Robots and Systems, pages 299–306. IEEE, 2013.
- [42] Ishan Misra, C Lawrence Zitnick, Margaret Mitchell, and Ross Girshick. Seeing through the human reporting bias: Visual classifiers from noisy human-centric labels. In Proceedings of the IEEE Conference on Computer Vision and Pattern Recognition, pages 2930–2939, 2016.
- [43] Jorge Morales, Guillermo Solovey, Brian Maniscalco, Dobromir Rahnev, Floris P de Lange, and Hakwan Lau. Low attention impairs optimal incorporation of prior knowledge in perceptual decisions. Attention, Perception, & Psychophysics, 77(6):2021–2036, 2015.
- [44] Jishnu Mukhoti, Viveka Kulharia, Amartya Sanyal, Stuart Golodetz, Philip Torr, and Puneet Dokania. Calibrating deep neural networks using focal loss. Advances in Neural Information Processing Systems, 33:15288–15299, 2020.
- [45] Rafael Müller, Simon Kornblith, and Geoffrey E Hinton. When does label smoothing help? Advances in neural information processing systems, 32, 2019.
- [46] Thomas Mussweiler and Fritz Strack. Numeric judgments under uncertainty: The role of knowledge in anchoring. Journal of experimental social psychology, 36(5):495–518, 2000.
- [47] Zachary Nado, Neil Band, Mark Collier, Josip Djolonga, Michael Dusenberry, Sebastian Farquhar, Angelos Filos, Marton Havasi, Rodolphe Jenatton, Ghassen Jerfel, Jeremiah Liu, Zelda Mariet, Jeremy Nixon, Shreyas Padhy, Jie Ren, Tim Rudner, Yeming Wen, Florian Wenzel, Kevin Murphy, D. Sculley, Balaji Lakshminarayanan, Jasper Snoek, Yarin Gal, and Dustin Tran. Uncertainty Baselines: Benchmarks for uncertainty & robustness in deep learning. arXiv preprint arXiv:2106.04015, 2021.
- [48] Lukas Neumann, Andrew Zisserman, and Andrea Vedaldi. Relaxed softmax: Efficient confidence auto-calibration for safe pedestrian detection. NIPS 2018 Workshop MLITS, 2018.
- [49] David A Nix and Andreas S Weigend. Estimating the mean and variance of the target probability distribution. In Proceedings of 1994 ieee international conference on neural networks (ICNN’94), volume 1, pages 55–60. IEEE, 1994.
- [50] Halil İbrahim Öztürk and Ahmet Burak Can. Adnet: Temporal anomaly detection in surveillance videos. In International Conference on Pattern Recognition, pages 88–101. Springer, 2021.
- [51] Joshua C. Peterson, Ruairidh M. Battleday, Thomas L. Griffiths, and Olga Russakovsky. Human uncertainty makes classification more robust. CoRR, abs/1908.07086, 2019.
- [52] Sarah Pratt, Mark Yatskar, Luca Weihs, Ali Farhadi, and Aniruddha Kembhavi. Grounded situation recognition. In European Conference on Computer Vision, pages 314–332. Springer, 2020.
- [53] Gabriel A Radvansky and Jeffrey M Zacks. Event perception. Wiley Interdisciplinary Reviews: Cognitive Science, 2(6):608–620, 2011.
- [54] Dobromir Rahnev, Brian Maniscalco, Tashina Graves, Elliott Huang, Floris P De Lange, and Hakwan Lau. Attention induces conservative subjective biases in visual perception. Nature neuroscience, 14(12):1513–1515, 2011.
- [55] Eric Raufaste, Rui da Silva Neves, and Claudette Mariné. Testing the descriptive validity of possibility theory in human judgments of uncertainty. Artificial Intelligence, 148(1-2):197–218, 2003.
- [56] Jacob C Reinhold, Yufan He, Shizhong Han, Yunqiang Chen, Dashan Gao, Junghoon Lee, Jerry L Prince, and Aaron Carass. Validating uncertainty in medical image translation. In 2020 IEEE 17th International Symposium on Biomedical Imaging (ISBI), pages 95–98. IEEE, 2020.
- [57] John H Reynolds and Leonardo Chelazzi. Attentional modulation of visual processing. Annu. Rev. Neurosci., 27:611–647, 2004.
- [58] Matteo Ruggero Ronchi and Pietro Perona. Describing common human visual actions in images. arXiv preprint arXiv:1506.02203, 2015.
- [59] Olga Russakovsky, Jia Deng, Hao Su, Jonathan Krause, Sanjeev Satheesh, Sean Ma, Zhiheng Huang, Andrej Karpathy, Aditya Khosla, Michael Bernstein, et al. Imagenet large scale visual recognition challenge (2014). arXiv preprint arXiv:1409.0575, 2(3), 2014.
- [60] Arka Sadhu, Tanmay Gupta, Mark Yatskar, Ram Nevatia, and Aniruddha Kembhavi. Visual semantic role labeling for video understanding. In Proceedings of the IEEE/CVF Conference on Computer Vision and Pattern Recognition, pages 5589–5600, 2021.
- [61] Keisuke Sakaguchi and Benjamin Van Durme. Efficient online scalar annotation with bounded support. arXiv preprint arXiv:1806.01170, 2018.
- [62] Abhishek Singh Sambyal, Narayanan C Krishnan, and Deepti R Bathula. Towards reducing aleatoric uncertainty for medical imaging tasks. arXiv preprint arXiv:2110.11012, 2021.
- [63] Lars Schmarje, Johannes Brünger, Monty Santarossa, Simon-Martin Schröder, Rainer Kiko, and Reinhard Koch. Fuzzy overclustering: Semi-supervised classification of fuzzy labels with overclustering and inverse cross-entropy. Sensors, 21(19):6661, 2021.
- [64] Philipp Schustek and Rubén Moreno-Bote. Instance-based generalization for human judgments about uncertainty. PLoS Computational Biology, 14(6):e1006205, 2018.
- [65] Maximilian Seitzer, Arash Tavakoli, Dimitrije Antic, and Georg Martius. On the pitfalls of heteroscedastic uncertainty estimation with probabilistic neural networks. arXiv preprint arXiv:2203.09168, 2022.
- [66] MA Sykes, MB Welsh, and SH Begg. Don’t drop the anchor: Recognizing and mitigating human factors when making assessment judgments under uncertainty. In SPE Annual Technical Conference and Exhibition. OnePetro, 2011.
- [67] Jayaraman J Thiagarajan, Prasanna Sattigeri, Deepta Rajan, and Bindya Venkatesh. Calibrating healthcare ai: Towards reliable and interpretable deep predictive models. arXiv preprint arXiv:2004.14480, 2020.
- [68] Amos Tversky and Daniel Kahneman. Judgment under uncertainty: Heuristics and biases: Biases in judgments reveal some heuristics of thinking under uncertainty. science, 185(4157):1124–1131, 1974.
- [69] Sirion Vittayakorn and James Hays. Quality assessment for crowdsourced object annotations. In BMVC, pages 1–11, 2011.
- [70] Nidhi Vyas, Shreyas Saxena, and Thomas Voice. Learning soft labels via meta learning. arXiv preprint arXiv:2009.09496, 2020.
- [71] Edgar Y. Walker, R. James Cotton, Wei Ji Ma, and Andreas S. Tolias. A neural basis of probabilistic computation in visual cortex. bioRxiv, 2018.
- [72] Hao Wang, Junchao Liao, Tianheng Cheng, Zewen Gao, Hao Liu, Bo Ren, Xiang Bai, and Wenyu Liu. Knowledge mining with scene text for fine-grained recognition. arXiv preprint arXiv:2203.14215, 2022.
- [73] Shuo Wang, Qiushuo Zheng, Zherong Su, Chongning Na, and Guilin Qi. Meed: A multimodal event extraction dataset. In China Conference on Knowledge Graph and Semantic Computing, pages 288–294. Springer, 2021.
- [74] Meng Wei, Long Chen, Wei Ji, Xiaoyu Yue, and Tat-Seng Chua. Rethinking the two-stage framework for grounded situation recognition. arXiv preprint arXiv:2112.05375, 2021.
- [75] Donghyeon Won, Zachary C Steinert-Threlkeld, and Jungseock Joo. Protest activity detection and perceived violence estimation from social media images. In Proceedings of the 25th ACM international conference on Multimedia, pages 786–794, 2017.
- [76] Zanwu Xia, Qujiang Lei, Yang Yang, Hongda Zhang, Yue He, Weijun Wang, and Minghui Huang. Vision-based hand gesture recognition for human-robot collaboration: a survey. In 2019 5th International Conference on Control, Automation and Robotics (ICCAR), pages 198–205. IEEE, 2019.
- [77] Yuanjun Xiong, Kai Zhu, Dahua Lin, and Xiaoou Tang. Recognize complex events from static images by fusing deep channels. In Proceedings of the IEEE Conference on Computer Vision and Pattern Recognition, pages 1600–1609, 2015.
- [78] Mark Yatskar, Luke Zettlemoyer, and Ali Farhadi. Situation recognition: Visual semantic role labeling for image understanding. In Proceedings of the IEEE conference on computer vision and pattern recognition, pages 5534–5542, 2016.
- [79] Jeffrey M Zacks. Event perception and memory. Annual Review of Psychology, 71:165–191, 2020.
- [80] Jeffrey M Zacks, Nicole K Speer, Khena M Swallow, Todd S Braver, and Jeremy R Reynolds. Event perception: a mind-brain perspective. Psychological bulletin, 133(2):273, 2007.
- [81] Yanli Zhou, Luigi Acerbi, and Wei Ji Ma. The role of sensory uncertainty in simple perceptual organization. bioRxiv, page 350082, 2018.
Appendix A Dataset Construction Details
A.1 Image Collection
The full list of events included in SQUID-E is: baseball, basketball, birthday parties, cooking, COVID tests, cricket, natural disaster fires, fishing, gardening, graduation ceremonies, hiking, hurricanes, medical procedures, music concerts, parades, protests, soccer/football, tennis, tsunamis, and weddings. Human uncertainty judgments were collected for the birthday party, wedding, parade, protest, COVID test, and other medical procedure event types. YouTube video queries were primarily made in English, but videos retrieved using Korean, Russian, Arabic, Chinese (simplified), French, Japanese, Hindi, German, Persian, and Spanish queries were also included.
36 frames from each video were sampled at even intervals, and each of these video frames were passed through a ResNet50 model he2015deep trained on ImageNet russakovsky2014imagenet attached to two pooling layers to featurize the frame. The feature vector of each sampled frame was passed into a k-means clustering algorithm with 6 centroids. The six frames whose featurizations had the closest Euclidean distance to a centroid were extracted and included in the dataset.
A.2 Annotations
1,800 images were annotated using three-way redundancy on each task, resulting in a total of 10,800 uncertainty judgments (6 judgments per image). $0.20 was paid for six judgments (approximately $16/hr based on preliminary task completion time calculations), plus the 20% Mechanical Turk fee. This resulted in a total cost of $432 for the full set of human judgments, plus $31.50 for the initial pilot tests to identify quality annotators. Annotators were paid twice this amount for the intra-annotator variance analysis, resulting in a cost of $0.40 10 5 $24. In all tasks, annotators were not given speed-related instructions or a time limit (other than the AMT task expiration limit). A screenshot of the annotation interface is included in Figure 5.
Appendix B Annotator Instructions
Below are the full instructions provided to annotators for human uncertainty labeling.
INSTRUCTIONS:
You will be presented with (1) a set of still images taken from videos and (2) a prompt specifying a type of event. Your task is to rate your confidence that each still image belongs to a video depicting the provided event type on a scale from 0% to 100%. Rate each image individually. A guideline for ratings is shown in Table LABEL:tab:instructions1.
| Rating | Guidelines |
|---|---|
| 0% | An image should only be rated 0% if you are nearly certain that the video it belongs to does not depict the target event type. This rating would be appropriate if the image contains a set of attributes that, together, necessarily could not appear in the target event type. |
| 1% - 49% | Rating an image between 1% - 49% indicates that the visual evidence in the image suggesting it belongs to the target event type is weak enough that it is likelier that the video depicts to another event type. How weak the evidence is will determine where in the scale of 1-49 you rate it (keeping in mind the definitions of a 0% rating and a 50% rating). |
| 50% | Rating an image at 50% indicates that you feel there is an equal likelihood that the image belongs to a video of the target event type and that the image belongs to a video of a similar event type that shares some visual attributes (i.e., a birthday party and a wedding). |
| 51% - 99% | Ratings between 51% - 99% indicate that it is likelier that the video depicts the target event than it doesn’t, and where on the scale you rate it depends on the strength of the visual evidence (again, keeping in mind the definitions of a 50% rating and a 100% rating). |
| 100% | An image should only be rated 100% if you are nearly certain that the video it belongs to depicts the target event type. This rating would be appropriate if the image contains a set of attributes that, together, could not reasonably belong to any other event other than the target event type. |
The event types you will be asked to consider in this task are birthday parties, COVID tests, medical procedures (other than COVID tests), parades, protests, and weddings (both ceremony & reception). Examples of core attributes belonging to these event types and images rated 100% for these event types are listed in Table LABEL:tab:instructions2. In addition to the attributes listed, you are encouraged to also draw from your own experiences when making confidence ratings.
| Event Type | Images w/ 100% Rating |
|---|---|
| Birthday party |
![[Uncaptioned image]](/html/2210.03102/assets/figures/ims2/bir0.jpg)
![[Uncaptioned image]](/html/2210.03102/assets/figures/ims2/bir1.jpg)
![[Uncaptioned image]](/html/2210.03102/assets/figures/ims2/bir2.jpg)
|
| COVID test |
![[Uncaptioned image]](/html/2210.03102/assets/figures/ims2/cov0.jpg)
![[Uncaptioned image]](/html/2210.03102/assets/figures/ims2/cov1.jpg)
![[Uncaptioned image]](/html/2210.03102/assets/figures/ims2/cov2.jpg)
|
| Medical procedure |
![[Uncaptioned image]](/html/2210.03102/assets/figures/ims2/med0.jpg)
![[Uncaptioned image]](/html/2210.03102/assets/figures/ims2/med1.jpg)
![[Uncaptioned image]](/html/2210.03102/assets/figures/ims2/med2.jpg)
|
| Parade |
![[Uncaptioned image]](/html/2210.03102/assets/figures/ims2/par0.jpeg)
![[Uncaptioned image]](/html/2210.03102/assets/figures/ims2/par1.jpg)
![[Uncaptioned image]](/html/2210.03102/assets/figures/ims2/par2.jpg)
|
| Protest |
![[Uncaptioned image]](/html/2210.03102/assets/figures/ims2/pro0.jpg)
![[Uncaptioned image]](/html/2210.03102/assets/figures/ims2/pro1.jpg)
![[Uncaptioned image]](/html/2210.03102/assets/figures/ims2/pro2.jpg)
|
| Wedding |
![[Uncaptioned image]](/html/2210.03102/assets/figures/ims2/wed0.jpg)
![[Uncaptioned image]](/html/2210.03102/assets/figures/ims2/wed1.jpeg)
![[Uncaptioned image]](/html/2210.03102/assets/figures/ims2/wed2.jpg)
|
| RATING EXAMPLES | ||
|---|---|---|
![[Uncaptioned image]](/html/2210.03102/assets/figures/ims1/Picture1.jpg)
|
![[Uncaptioned image]](/html/2210.03102/assets/figures/ims1/Picture2.jpg)
|
![[Uncaptioned image]](/html/2210.03102/assets/figures/ims1/Picture3.jpg)
|
| WEDDING | PARADE | COVID TEST |
| Rating: 0%. All visual attributes in this image suggest that the video is of a basketball game, which virtually never coincides with a wedding event in the same video. | Rating: 10%. Depicts the location of a parade, but lacks all distinguishing attributes of a parade. Could conceivably belong to a video of this event type, but there are many possible events that are significantly more likely. | Rating: 30%. Contains attributes closely related to a COVID test, but is not an image that would occur immediately before/after a depiction of a COVID test in a video, making it less likely than an image that would score 50%+. |
![[Uncaptioned image]](/html/2210.03102/assets/figures/ims1/Picture4.jpg)
|
![[Uncaptioned image]](/html/2210.03102/assets/figures/ims1/Picture5.jpg)
|
![[Uncaptioned image]](/html/2210.03102/assets/figures/ims1/Picture6.jpg)
|
| MEDICAL PROCEDURE | WEDDING | BIRTHDAY PARTY |
| Rating: 50%. The image could quite possibly belong to a video depicting a medical procedure, but there are few enough defining features that it could easily belong to a different event type as well (i.e. a video tour of the clinic, a news story about hospital staff shortages, etc). | Rating: 85%. Has many attributes closely tied to a wedding, but could conceivably belong to a closely related event type. | Rating: 100%. Most of the attributes in this image are uniquely characteristic of a birthday party. The chances of these elements occurring together in another setting are virtually nonexistent. |
Example ratings are shown in Table LABEL:tab:instructions3.
The event type is listed at the top of each page. Move the slider below each image to rate it. You may click on any image to increase its size to view image details more clearly. While the scores you assign are subjective in nature, we will be carefully checking to ensure that they follow the guidelines in the instructions. Please reach us at <email> if anything else is unclear or if you found an error in the task.
Appendix C Annotation Analysis
Historically, Spearman correlation has often been used for measuring agreement for scalar annotations cohendet2019videomem ; sakaguchi2018efficient ; vittayakorn2011quality . However, other metrics, such as Fleiss’s kappa and Krippendorff’s alpha, are also methods of quantifying annotator agreement. Here, we compare these two metrics against Spearman correlation when applied to the annotations in SQUID-E. Fleiss’s kappa requires nominal data, and so when computing this metric we bin the probabilistic judgments into categories (e.g., for 5 bins, annotations are divided into 5 classes: 0-20%, 20-40%, 40-60%, 60-80%, and 80-100%) and apply the metric accordingly. For Krippendorff’s alpha, we use the interval metric for calculations. Results are reported in Table 7. The Spearman correlation and Krippendorff’s alpha metrics align closely, whereas Fleiss’s kappa is consistently much lower. We hypothesize that this is the case due to binning being an imperfect method of converting quantitative data to nominal data.
| Task | Spearman | Alpha | Kappa (3 bins) | Kappa (4 bins) | Kappa (5 bins) |
|---|---|---|---|---|---|
| A | .676 | .658 | .468 | .397 | .341 |
| B | .631 | .696 | .491 | .431 | .386 |
| A+B | .673 | .676 | .482 | .424 | .364 |
Appendix D Experiment Details
All experiments are run on an internal cluster using 1 GPU and 12 GB of memory. Experiments described in Sections 5.1 and 5.2 are run using annotations from task variant A, and experiments described in Section 5.3 are run using annotations from task variant B to allow for both positive and negative samples to be used in evaluation.
D.1 Training
Section 5.1 We use a headless ResNet50 model attached to a fully connected layer for all three models. They are initialized with ImageNet weights, as weights pretrained on the SWiG situation recognition dataset pratt2020grounded resulted in poorer overall performance. Training and validation sets are mutually exclusive for both datasets, and the SQUID-E validation set does not include frames from videos that are included in the SQUID-E training data. For this experiment we evaluate models on both datasets. We train each model for 5 epochs with a learning rate of 1e-5 using the Adam optimization algorithm. Below, we describe the unique TorchVision augmentation filters applied to each model:
RN+SD: No data augmentation.
RN+PA: ColorJitter(0.5,0.5,0.5,0.5), RandomSolarize(220), RandomPosterize(4).
RN+GA: Resize(512), RandomPerspective(0.5), RandomCrop(256).
RN+NM: RandomErasing(0.5) (applied twice), GaussianBlur(kernel_size=(5,9)).
RN+AU: RandomPerspective(0.5), RandomCrop(256), RandomErasing(0.5),
GaussianBlur(kernel_size=(5,9)).
RN+AM: AugMix(5).
Section 5.3 The models are trained on a dataset of 960 event-centric images, where 480 belong to the target class, and the other 480 are equally comprised of three other event types. The validation datasets both consist of 120 images of the target event and 120 images of a similar but distinct event (e.g. "birthday party" and "wedding" or "parade" and "protest"). We train each model for 5 epochs with a learning rate of 1e-5 using the Adam optimization algorithm.
D.2 Section 5.2 Verb Prediction
In the situation recognition task, an event is defined by (1) a verb (e.g. jumping) and (2) the set of semantic roles dependent on that verb (e.g. agent: boy, source: rock, destination: water) yatskar2016situation . As stated in Section 2, contemporary models first predict the event’s verb and then pass that verb into a semantic role classification model to predict the event’s roles. Therefore, a situation model’s accuracy is upper-bounded by its verb prediction accuracy. Given this, we simplify the task of situation recognition in this experiment by focusing solely on models’ verb classification performance. We take the verbs assigned to each event using the ImSitu event ontology (used to train most contemporary situation recognition models) and assess performance by identifying how accurately models can predict these verbs.
D.3 Alternate Binning Approach
While we primarily consider mean human annotation scores for the experiments in Section 5, some literature argues for handling human quantitative judgments differently. Peterson et al. consider the labels of a data point as samples from an underlying label distribution peterson2019human , whereas Basile et al. propose that, for subjective tasks, all annotations may be “correct” and should therefore all be used in evaluation without pre-aggregation basile2020s ; basile2021we . They propose an evaluation method where model outputs are compared against each annotation label individually. Along these lines, in this experiment we consider each (image, judgment label) pair as a data point for binning and compare the resulting accuracy scores against what is currently listed in Table 2. Results of this experiment are reported in Table 8. As shown in the table, the alternate binning method increases model performance for all bins but 80-100%, which drops in accuracy, but overall the same performance trends remain.
| Model | Bins | 0-20% | 20-40% | 40-60% | 60-80% | 80-100% | Avg. |
|---|---|---|---|---|---|---|---|
| Verb Accuracy (Top 1) | |||||||
| JSL | Mean | .00 | .07 | .17 | .22 | .52 | .35 |
| GSRTR | Mean | .02 | .09 | .22 | .25 | .59 | .41 |
| CoFormer | Mean | .02 | .13 | .22 | .23 | .58 | .40 |
| JSL | Alt | .04 | .09 | .19 | .32 | .49 | .33 |
| GSRTR | Alt | .07 | .11 | .19 | .39 | .55 | .38 |
| CoFormer | Alt | .07 | .15 | .20 | .40 | .54 | .38 |
| Verb Accuracy (Top 10) | |||||||
| JSL | Mean | .11 | .43 | .49 | .72 | .86 | .66 |
| GSRTR | Mean | .11 | .55 | .54 | .77 | .88 | .70 |
| CoFormer | Mean | .09 | .42 | .58 | .82 | .91 | .70 |
| JSL | Alt | .23 | .49 | .61 | .73 | .83 | .66 |
| GSRTR | Alt | .26 | .54 | .72 | .77 | .85 | .70 |
| CoFormer | Alt | .23 | .50 | .67 | .82 | .88 | .70 |
D.4 Mean Squared Error vs. KL Divergence
For the experiment detailed in Section 5.3, we additionally calculated the KL divergence between the model confidence scores and the human judgments to compare against the MSE. Results are aggregated across 8 seeds and are presented in Table 9. As shown in the table, there is a positive correlation between the three metrics, indicating that the MSE and KL divergence measure similar aspects of the model’s calibration.
| Trained on SD | Trained on SQUID-E | |||||
|---|---|---|---|---|---|---|
| HUJ MSE | KL | ECE | HUJ MSE | KL | ECE | |
| Baseline | .15 .05 | .49 .17 | .58 .02 | .16 .04 | .52 .13 | .61 .05 |
| Monte Carlo | .14 .05 | .45 .16 | .57 .03 | .16 .04 | .46 .11 | .57 .04 |
| Label Smoothing | .12 .03 | .30 .08 | .46 .02 | .14 .03 | .36 .08 | .52 .04 |
| Belief Matching | .14 .05 | .42 .14 | .55 .02 | .15 .04 | .45 .11 | .58 .04 |
| Focal Loss | .11 .02 | .29 .06 | .42 .02 | .12 .02 | .31 .05 | .45 .05 |
| Relaxed Softmax | .12 .03 | .32 .08 | .46 .05 | .14 .04 | .37 .09 | .53 .06 |
Appendix E Asset Licenses
Models JSL pratt2020grounded is licensed under the MIT License, and GSRTR cho2021grounded and CoFormer cho2022collaborative are licensed under Apache License 2.0.
Datasets Visual Genome krishnavisualgenome is licensed under CC-BY 4.0, WIDER xiong2015recognize is available for research purposes, and UCLA Protest Images won2017protest is available for academic use only.