Explainable Verbal Deception Detection using Transformers
Abstract
People are regularly confronted with potentially deceptive statements (e.g., fake news, misleading product reviews, or lies about activities). Only few works on automated text-based deception detection have exploited the potential of deep learning approaches. A critique of deep-learning methods is their lack of interpretability, preventing us from understanding the underlying (linguistic) mechanisms involved in deception. However, recent advancements have made it possible to explain some aspects of such models. This paper proposes and evaluates six deep-learning models, including combinations of BERT (and RoBERTa), MultiHead Attention, co-attentions, and transformers. To understand how the models reach their decisions, we then examine the model’s predictions with LIME. We then zoom in on vocabulary uniqueness and the correlation of LIWC categories with the outcome class (truthful vs deceptive). The findings suggest that our transformer-based models can enhance automated deception detection performances (+2.11% in accuracy) and show significant differences pertinent to the usage of LIWC features in truthful and deceptive statements.
1 Introduction
Computer-automated verbal deception detection has gained much attention in recent years (Kleinberg et al., 2018; Khan et al., 2021; Chebbi and Jebara, 2021). During this time, studies examining deception detection have used data from various domains including news (Rubin et al., 2015; Conroy et al., 2015; Girgis et al., 2018), customer reviews (Kennedy et al., 2019; Hajek et al., 2020; Fontanarava et al., 2017; Ott et al., 2011), court testimonies (Fornaciari and Poesio, 2012, 2013; Fornaciari et al., 2021; Kao et al., 2020), or interactions in lie games (Soldner et al., 2019). Other work has collected text data from experiments about topics such as personal/political opinions (Capuozzo et al., 2020), people’s weekend plans (Kleinberg and Verschuere, 2021) or intentions about flying (Kleinberg et al., 2017).
For the task of deception detection, it is worth demarcating deception from related tasks, particularly those of fact-checking and misinformation detection. Our work is related to efforts on interpretable fact-checking (e.g., (Nguyen et al., 2018)) in that it aims to understand how classifiers use the input information, but it differs in the type of deception. The core difference between deception (lie) detection and fact-checking or misinformation detection is that deception detection often does not lend itself to external verification of truth absent additional information. For example, someone lying about their activities during the last weekend may state that they watched a movie at home. This statement cannot easily be submitted to external verification queries as is possible in fact-checking or in some cases even misinformation detection (if external information is available). As such, deception detection research is particularly eager to use linguistic patterns as a means to identify truths or lies (see Fitzpatrick et al. (2015)). More so, even within deception detection research - as defined above - two prominent types of lies are differentiated (see Nahari et al. (2019)): lies of commission are those where a liar makes a false statement (e.g., about their weekend plans), while lies of omission are an attempt to hide events or facts that did happen (e.g., that someone visited a bar yesterday). For a comprehensive review of challenges for computational approaches to deception detection from language, see Tomas et al. (2022). Moreover, for a review on general pitfalls and opportunities in verbal deception detection from a theoretical and psychological angle, see Vrij et al. (2010).
However, most approaches in deception detection use only traditional (ensemble) machine learning methods, such as logistic regression, support vector machines, random forests, or naive bayes classifiers to predict veracity (Wu et al., 2018; Banerjee et al., 2015; Fornaciari and Poesio, 2013). Only few studies have explored deep learning methods based on transformer-networks (Fornaciari et al., 2021; Kao et al., 2020; Kennedy et al., 2019), which show increased prediction performances over the traditional approaches, but do not focus on interpreting the linguistic properties of the texts. Since previous research has found mostly mixed results about deceptive cues in text, it is important to be able to interpret more powerful methods, to add to our understanding of deception as expressed in text. However, deep learning models are difficult to interpret and often called black boxes, due to their high complexity of many layers involving a large number of (combinations of) trainable parameters.
Recently, interpreting deep learning methods has become more feasible and can be described as (1) local post-hoc (i.e. the explanation of a single prediction by performing additional operations), (2) local self-explaining (i.e. the explanation of a single prediction using the model itself), (3) global post-hoc (i.e. by performing additional operations for explaining the entire model’s predictive reasoning) and (4) global self-explaining (i.e. using the predictive model itself for explaining its entire predictive reasoning) (Danilevsky et al., 2020). Several explainability techniques belonging to the aforementioned categories have been introduced including the visualization of neural networks (Simonyan et al., 2014; Li et al., 2015), so-called surrogate models (Ribeiro et al., 2016), and layer-wise relevance propagation (Binder et al., 2016). However, for the task of deception detection, researchers usually face the dilemma of choosing between high model performance promises from deep learning models or easier interpretability from simpler approaches. Almost no prior work aimed to explore explainability techniques for interpreting the predictions made by deep learning architectures for deception detection. Thus, with this paper we aim to add to the understanding of deceptive text characteristics by implementing several deep learning approaches and interpreting the best performing method. Our main contributions are:
-
•
trying to detect deception using two statements concurrently inspired by the success of the siamese neural networks.
-
•
comparing transformer-based networks to shallow machine learning algorithms and human baseline approaches.
-
•
performing an analysis of the linguistic patterns of truthful and deceptive texts.
-
•
employing LIME (Ribeiro et al., 2016) to examine the predictions made by the best performing model.
2 Related Work
A number of studies have proposed systems to address automated verbal deception detection. Some works made datasets publicly available, some of which were transcripts of court cases (Fornaciari and Poesio, 2012; Kleinberg and Verschuere, 2021; Pérez-Rosas et al., 2015), were generated in the laboratory (Ott et al., 2011) or stem from transcripts of lie games (Soldner et al., 2019). More recently, Fornaciari et al. (2021) used the data by Fornaciari and Poesio (2012) and introduced contextualized and non-contextualized transformer-based networks for detecting deception from real-life court transcripts. The authors found that no model significantly outperformed the accuracy obtained by the SVM classifier (Fornaciari and Poesio, 2013). For finding the linguistic patterns used in deceptive language, the authors looked at Information gain of n-grams (Forman et al., 2003) and the sampling and occlusion algorithm (Jin et al., 2019). They concluded that deceptive statements contain more negations, and were less assertive in contrast to truthful statements.
Another deception detection study proposed a neural network architecture consisting of a fully-connected layer and/or an LSTM layer (Kao et al., 2020). They showed that one-hot-encoding yields the highest F1-score compared to embedding models obtained via fastText and BERT (Devlin et al., 2019). Another task of verbal deception detection is fake review detection (Kennedy et al., 2019; Hajek et al., 2020; Fontanarava et al., 2017; Ott et al., 2011). Findings in this area suggest that the use of transformer-based networks, e.g., BERT, may improve detection results.
3 Datasets
3.1 Deception in future activities
For our experiments, we use the publicly available dataset introduced by Kleinberg and Verschuere (2021). The data were collected through crowdsourcing (via Prolific Academic) in which participants were asked to provide a statement about their most significant non-work-related activity in the next seven days. Participants were asked the two following questions:
-
•
Q1: “Please describe your activity as specific as possible”
-
•
Q2: “Which information can you give us to reassure us that you are telling the truth”.
Each participant was randomly assigned to either the truthful condition (i.e. they answered the questions about an activity they genuinely planned to do) or the deceptive condition. In the deceptive condition, participants were assigned matched activities from the truthful condition.111The matching ensured that the participants were given an activity they had not planned themselves so that fully deceptive statements were written.
The dataset contains 1640 statements (857 deceptive and 783 truthful) consisting of two answers per participant.
We opted for this dataset, since it can be characterized as of high quality due to the strong experimental control during the collection procedure. Thus, the ground truth about each statement is known, which is often uncertain in other datasets.
3.2 Open Domain Deception
For showing the robustness of our proposed approaches towards the task of deception detection we use an additional dataset: the Open Domain Deception Dataset (Pérez-Rosas and Mihalcea, 2015). Here, the authors asked 512 participants through Amazon Mechanical Turk to provide seven truths and seven lies, on topics of their own choice. For conducting our experiments, we merged statements of each participant into one. Thus, the dataset includes 512 truthful and 512 deceptive statements.
4 Predicting Deceptive Statements
Here we detail the prediction models that we compare on the abovementioned datasets.
BERT+Dense Layers. The BERT model (Devlin et al., 2019) receives as input the answer to the question Q1222For the Open Domain Deception Dataset, the data provided by each participant serves analogously as Q1.. The sequence of hidden-states at the output of the model’s last layer constitutes the output of the BERT model. That output is passed through a mean-pooling layer whose output is passed through three dense layers to obtain the final output.
BERT+MultiHead Attention. The approach is identical to the one above, with the addition that the output of the BERT model is passed through a multi-head attention layer consisting of six heads. Finally, the output of the transformer is fed to three dense layers, which produce the final prediction.
BERT+Transformer. Identical to BERT+Dense Layers with the difference that the output of the BERT model is passed through the encoder layer of the transformer (Vaswani et al., 2017) consisting of six layers and six heads. Finally, the output of the transformer is fed to a mean pooling layer. The output of the pooling layer is fed to three ReLU activated Dense layers of size 512, 128, 64 and finally to a dense layer with a sigmoid activation function and one unit, which results in the final prediction.
BERT+Co-Attention. The model receives the two answers to questions Q1 & Q2 as input.333In terms of the Open Domain Deception Dataset, we split each statement into two statements of equal length. Both answers are fed to two siamese BERT models (sharing the same weights). Next, we employ the co-attention mechanism introduced by Lu et al. (2016) over the two embeddings (of the two statements) in an attempt to improve detection performance.
Let and be the outputs of the BERT model, where indicates the hidden size of the BERT model and is equal to 768, while N & T constitute the number of tokens in answers to the questions Q1 & Q2 respectively. We have omitted the first dimension, which corresponds to the batch size. Following the methodology proposed by Lu et al. (2016), firstly we compute the affinity matrix as:
| (1) |
where contains the weights. Next, by considering this affinity matrix as a feature, we learn to predict the attention maps for both statements via the following,
| (2) | |||
where are the weight parameters. The attention probabilities for each word in both statements are calculated via the following,
| (3) | |||
where and . are the weight parameters. Based on the above attention weights, the attention vectors for each statement are calculated as the weighted sum of the features from each statement. Formally,
| (4) |
where and .
Then, we concatenate these two vectors, so that
| (5) |
where and we feed the vector z to a series of dense layers, to obtain the output.
BERT+Co-Attention+LIWC. Identical to BERT+Co-Attention with the difference that the output of the co-attention mechanism z is fed to a Dense layer, where the ouput of this dense layer is concatenated with Linguistic Inquiry and Word Count (LIWC) features obtained by the statements-answers to question Q1. The LIWC software offers a (psycho)linguistic dictionary developed with domain experts and measures constructs such as cognitive processes, references to time, or personal concerns (Pennebaker et al., 2015). Numerous works at the intersection of psychology and computational linguistics have used the LIWC (e.g., (Tausczik and Pennebaker, 2010; Pérez-Rosas et al., 2018)) and recently the newest version “LIWC-22” (Boyd et al., 2022) has been released (note that we used the features obtained with the 2015 version). We feed the concatenated vector to two dense layers, so as to get the final prediction.
BERT+Transformers+Co-Attention. As above, the model receives the two answers to questions Q1 & Q2 as input. Both answers are fed to two siamese BERT models (sharing the same weights). Each output of the BERT model is passed through the encoder layer of the transformer with six layers and six heads. Then, the two outputs of the respective transformers, namely & are passed through a co-attention mechanism, as described via the equations 1-5. Then the output of the co-attention mechanism z is fed to a series of Dense layers, which produce the final output.
We experiment also with RoBERTa (Liu et al., 2019) instead of BERT and lower performance results are achieved.
5 Experiments
Baselines. Regarding the dataset by Kleinberg and Verschuere (2021), we compare the performance of the proposed approaches introduced in Section 4 against the performing system adopted by Kleinberg and Verschuere (2021), who used both machine learning and human judgements to classify veracity. The baselines are presented below.
-
•
Human Baseline. In this framework, the participants were asked to read each statement and indicate their judgement on a slider ranging from 0 to 100, with 0 meaning certainty truthful, whereas 100 meaning certainty deceptive.
-
•
Machine Learning: LIWC. This method trains a random forest classifier by using all 93 categories of the LIWC as the feature set.
-
•
Machine Learning: POS. This approach exploits relative part-of-speech (POS) frequencies. A random forest classifier is trained with the corresponding feature set.
Regarding the experiments conducted on the Open Domain Deception Dataset, we compare the performance of our introduced approaches with:
-
•
Feature Set: POS: This method extracts POS tags per statement and trains an SVM Classifier.
Experimental Setup. We use a 5-fold stratified cross-validation procedure with five repetitions for training and evaluating the introduced approaches. Within each loop we divide the training set into a training and evaluation set (80% - 20% respectively). We use the base-uncased version of BERT model from the Transformers library (Wolf et al., 2020). Furthermore, the SGD optimizer is used for all architectures, except for BERT + Co-Attention + LIWC where we use the Adam optimizer, and train the proposed architectures by minimizing the binary cross entropy loss function. The initial learning rate for all architectures is 0.001. For dealing with the imbalanced dataset, we introduce balanced class weights to the loss function. During the training an early stopping method with a patience of 10 is applied based on the validation loss. Concurrently, we apply the callback ReduceLROnPlateau, where we reduce the learning rate by a factor of 0.1 if the validation loss has not been decreased for three consecutive epochs. Specifically, we train the architectures by freezing the weights of the BERT model. After having trained the architectures, we unfreeze the weights of the BERT model and we keep training the proposed architectures, where an early stopping method with a patience of 2 is applied based on the validation loss for avoiding overfitting. All models are created using the Tensorflow library (Abadi et al., 2016) and trained on a single 24Gb NVIDIA Titan RTX GPU.
Evaluation Metrics. We report the Accuracy, Precision, Recall, F1-score, Area Under the ROC Curve (AUROC), and Specificity as performance metrics. All these metrics were calculated by considering the deceptive statements as the positive class and the truthful statements as the negative class.
6 Results
Table 1 presents the results of both the baselines and the introduced transformer-based models for the experiments on the dataset described in Section 3.1.444The results of RoBERTa for the dataset by Kleinberg and Verschuere (2021) are reported in Appendix A. The results of the proposed models on the Open Domain Deception Dataset are reported in Appendix B.
Regarding the experiments conducted on the dataset described in Section 3.1, we observe that in the previous traditional models, the Machine Learning: LIWC approach shows best performances in most metrics (Precision, Recall, F1-score, Accuracy, and AUROC) and is used as a baseline for comparison with the introduced transformer-based models.
Of the new approaches, BERT+Co-Attention performs best in most metrics. Compared to the next best result (BERT+Co-Attention+LIWC and BERT+Transformers+Co-Attention), the model increased precision by 0.18 points, recall by 1.12 points, the F1-score by 0.60 points, and Accuracy by 0.45 points. In terms of AUROC score, BERT+Co-Attention performs slightly worse than BERT+Co-Attention+LIWC (-0.06 points). Furthermore, one can observe that BERT+Co-Attention, BERT+Co-Attention+LIWC, and BERT+Transformers+Co-Attention yield better evaluation results than BERT+Dense Layers, BERT+MultiHead Attention, and BERT+Transformers, which indicates, that using both statements is useful towards a better classification performance of categorizing truthful and deceptive statements. Also, we observe that BERT+Co-Attention+LIWC performs slightly worse than BERT+Co-Attention. This slight difference is attributable to the usage of the concatenation operation (i.e., LIWC features are concatenated with the representation vector obtained from both statements). In addition, the difference in performance between BERT+Co-Attention and BERT+Transformers+Co-Attention is attributable to the usage of the encoder layer of the transformer. Specifically, the addition of the Transformer consisting of six layers and six heads may lead to overfitting and decrease of the performance due to the small dataset used.
It is worth mentioning that BERT+Co-Attention outperforms the previous results obtained by Machine Learning: LIWC, on all evaluation metrics (Precision: +2.43 points, Recall: +1.72 points, F1-score:+1.71 points, Accuracy: +2.11 points, AUROC: +2.77 points, Specificity: +2.59 points).
| Evaluation metrics | ||||||
| Architecture | Precision | Recall | F1-score | Accuracy | AUROC | Specificity |
| Human Baseline | 54.66 | 24.40 | 33.74 | 50.15 | 52.00 | 78.06 |
| Machine Learning: LIWC | 67.71 | 76.02 | 71.62 | 68.50 | 75.00 | 60.26 |
| Machine Learning: POS | 63.68 | 70.76 | 67.03 | 63.61 | 67.00 | 55.77 |
| BERT + Dense Layers | 68.90 | 65.92 | 66.67 | 66.36 | 73.09 | 66.90 |
| 3.15 | 10.92 | 8.01 | 3.74 | 4.00 | 7.84 | |
| BERT + MultiHead Attention | 69.86 | 71.64 | 70.65 | 68.89 | 76.43 | 65.85 |
| 2.68 | 3.76 | 2.09 | 2.24 | 1.88 | 5.21 | |
| BERT + Transformers | 69.89 | 72.68 | 71.16 | 69.33 | 77.18 | 65.68 |
| 2.59 | 3.93 | 2.05 | 1.88 | 1.81 | 4.61 | |
| BERT + Co-Attention | 70.14 | 77.74 | 73.33 | 70.61 | 77.77 | 62.85 |
| 4.39 | 7.76 | 2.59 | 2.58 | 2.88 | 10.25 | |
| BERT + Co-Attention + LIWC | 69.96 | 76.66 | 72.73 | 70.16 | 77.83 | 63.04 |
| 3.76 | 8.22 | 2.71 | 1.90 | 2.53 | 9.37 | |
| BERT + Transformers + Co-Attention | 69.96 | 74.19 | 71.94 | 69.77 | 77.16 | 64.93 |
| 2.76 | 3.73 | 2.29 | 2.39 | 1.83 | 4.92 | |
7 Analysis of the Language of Deceptive and Truthful Statements
7.1 Summary text statistics
The summary statistics between truthful and deceptive statements using the TEXTSTAT python library are reported in Appendix C. We observe that the syllable & lexicon count is significantly higher in deceptive statements (tested with an independent t-test).
7.2 Vocabulary Uniqueness
To examine the language of truthful and deceptive statements, we followed the steps by Ríssola et al. (2020), who used the Jaccard’s index to measure the similarity between finite sample sets (here: truthful and deceptive statements). The Jaccard’s index is calculated as follows: let be the unique set of words obtained from truthful statements and that from deceptive statements. The Jaccard’s is calculated via the equation below:
| (6) |
The Jaccard’s index ranges from 0 to 1, where an index of 1 indicates that the sets completely intersect. As the value approaches 0, the sets have different elements. The sets & intersect only to a low degree with Jaccard’s index ranging from 0.33 to 0.36 (see Appendix D for full details), suggesting that people tend to use a different vocabulary for truthful and deceptive statements.
| Truthful Statements | Deceptive Statements | ||
| LIWC | corr. | LIWC | corr. |
| ingestion | 0.1695 | apostrophes | 0.1850 |
| biological processes | 0.1397 | past focus | 0.1190 |
| analytical thinking | 0.1266 | reward | 0.1106 |
| numbers | 0.1228 | Word Count | 0.0992 |
| leisure | 0.1209 | all pronouns | 0.0955 |
| future focus | 0.1165 | personal pronoun | 0.0915 |
| dictionary words | 0.1106 | exclamation marks | 0.0906 |
| article | 0.0930 | emotional tone | 0.0879 |
| time | 0.0718 | present focus | 0.0789 |
| affiliation | 0.0693 | positive emotion | 0.0785 |
| home | 0.0665 | affect | 0.0749 |
| - | - | all punctuation | 0.0724 |
| - | - | adjective | 0.0662 |
| - | - | commons verbs | 0.0657 |
| - | - | 3rd pers singular | 0.0627 |
7.3 Feature Analysis - Correlation
To understand how individual features are related to each outcome class (truthful vs deceptive), we computed the point-biserial correlation of each LIWC555We provide examples of LIWC categories in Appendix E. feature with the binary outcome class (truthful vs deceptive). Before calculating the correlation, we normalized the feature frequency for each document. The point-biserial correlation ranges from -1 to 1. Negative correlations were associated with truthful statements, whereas positive correlations were associated with deceptive statements. Thus, we considered the absolute values of the correlations. Table 2 shows all significant correlations (p < 0.05) after using the Benjamini-Hochberg alpha level correction procedure (Benjamini and Hochberg, 1995).
Table 2 indicates that the top-6 LIWC features which are associated with truthful statements are ingestion, biological processes, analytical thinking, numbers, leisure, and future focus. This finding is illustrated in the following example (truthful text): ’I will attend the party at 1pm at my friends Charlotte and David’s home. There will be food available such as burgers and sausages and salads. I will sit in the shade if possible to avoid getting sunburnt’
We further see that the majority of tokens correspond to the aforementioned LIWC features, i.e., (’will’ –> ’future focus’), (’the’ –> ’article’), (’food, burgers, sausages, salads’ –> ’ingestion’), (’friends’ –> ’affiliation’).
The LIWC features correlated with deceptive statements are: apostrophes, past focus, reward, word count, all pronouns, personal pronoun, exclamation marks, emotional tone. The following example of a deceptive statement illustrates this:
’I recently got my motorcycle license, a few year after my friend who got his back when we were in uni. I haven’t seen him since I graduated as he moved to Scotland and I work in London. We agreed to go on a 2-day motorcycle holiday around the Brecon Becons as I have never seen them.’
As one can easily observe, this deceptive statement includes verbs in past tense (LIWC category of past focus), apostrophes (haven’t), all pronouns (my, his, we, I, we, them).
7.4 Explainability-Error Analysis
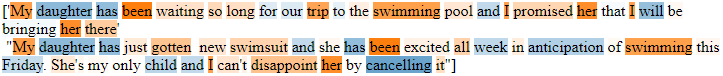
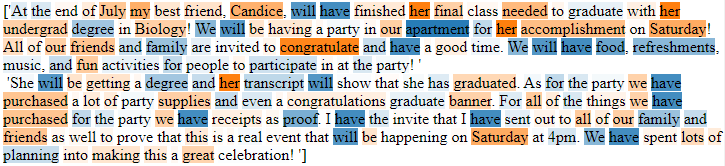
In this section we seek to further understand our best performing model from Section 4 (BERT+Co-Attention). To do this, we employ LIME (Ribeiro et al., 2016), a model agnostic framework for interpretability. We experiment with 5000 samples and compare the findings of LIME with the results obtained in Section 7.3. The LIME results for (in)correct classifications of each class are illustrated in Figures 1-4. Tokens in blue colour indicate those that were identified as truthful by LIME, whereas orange colour indicates tokens identified as deceptive. The examples can be summarised as follows:
7.4.1 Correct classifications
-
•
Truthful statements (Fig. 1): the model relied on personal pronouns as important for the deceptive class, while tokens corresponding to the LIWC categories leisure (leisure centre, walk, swimming), and home, were deemed indicative of the truthful class. Both results are in line with the findings presented in Section 7.3.
-
•
Deceptive statements (Fig. 2): personal pronouns were correlated to the deceptive class, as was the LIWC category of past focus (promised, gotten), apostrophes (She’s, can’t), and affect (excited) were important for the deceptive class. However, tokens indicating future focus (will) seem important for the truthful class.
7.4.2 Misclassifications
-
•
Truthful statements (misclassified as deceptive) (Fig. 3): the model relies on tokens belonging to the LIWC categories of future focus (will), article (the), and ingestion (food), as being important for the truthful class. Similarly, it leans towards deceptive for the LIWC categories of personal pronouns, reward (congratulate, accomplishment), exclamation marks (!), past/present focus (graduated, purchased). However, the misclassification can be largely attributed to the majority of tokens belonging to the LIWC categories that are correlated with deceptive statements as described in Section 7.3.
-
•
Deceptive statements (misclassified as truthful) (Fig. 4): similarly to the aforementioned example, this statement shows that the majority of tokens belong to the LIWC categories of future focus (will, may), article (a), leisure (cinema, entertainment) - all of which are correlated (for the whole corpus) with truthful statements. Those that correlated with the deceptive class (e.g., personal pronouns) are not frequent in this example, hence the risk for misclassification.


8 Conclusions
We face the challenge of differentiating truthful from deceptive texts in various aspects of our everyday life. In this paper, we have introduced several transformer-based network models and demonstrated that these models outperform other approaches reaching up to 70.61% and 73.33% in Accuracy and F1-score respectively. Furthermore, we have presented an in-depth analysis over the similarities and differences that can be observed between truthful and deceptive statements. We showed which LIWC categories correlate with truthful and deceptive texts. The findings revealed a mixed picture of similarities (e.g., number of sentences, etc.) and differences (e.g., different vocabulary, correlation with LIWC features). Finally, we have employed LIME to understand better how our best performing model classifies statements as truthful or deceptive. That analysis suggested that misclassifications are attributable to the presence of LIWC categories, which are significantly correlated with deceptive statements, in truthful statements and vice versa.
In the future, we aim to expand our approach to other datasets and domains and examine other transformer-based models (e.g., ALBERT, XLNet). A key challenge for applied verbal deception detection will lie in explainable methods and we aim to contribute to that task by further looking at statistical differences in language use as well as explainability techniques. We have shown how we can harness more advanced machine learning approaches without sacrificing explainability of these models.
Limitations
Hyperparameter Tuning: In this work, we did not perform hyperparameter tuning. For instance, the value of k in the co-attention mechanism, the number of units in the dense layers, the number of dense layers, the number of heads in the encoder part of the transformer, the learning rate have not been selected via the procedure of hyperparameter tuning. However, the procedure of fine-tuning leads to an increase in evaluation results. Therefore, the results of this study could be higher if the procedure of hyperparameter tuning had been adopted.
Misclassifications: Results showed that our model fails to correctly classify statements of the truthful class when they contain words significantly correlated with deceptive statements. Vice versa, some deceptive statements include words that belong to the LIWC categories presenting high correlation with truthful statements. Therefore, our model may need more contextualized information rather than relying on word frequencies alone to improve classification performance.
Limitations of LIME: We used LIME to explain the predictions of our best performing model. LIME constitutes an example of post-hoc approach, meaning that a second more explainable model must be trained. However, these learned surrogate models and the original models may rely on different mechanisms to make their predictions, leading to concerns about the fidelity of surrogate model-based approaches (Danilevsky et al., 2020). Therefore, future work could use interpretable (self-explaining) models to mitigate with the limitations of LIME.
Training: We trained our proposed approaches on two publicly available datasets for proving the robustness of our introduced approaches. This led to an increase of training time and use of GPU resources. In the future, we aim to adopt continual learning methods (De Lange et al., 2022) for saving time and adopting the same or even better performance on both datasets.
Ethical Considerations
Our work brings with it a few ethical questions. First, if systems such as the current one (or related ones) were to be deployed for deception detection applications, we need to be aware of the considerable error rates that automated deception detection still involves. Of most concern here would be the false positives that incorrectly identify a statement (or person) as being deceptive (or a liar), which can create undesirable consequences (e.g., being marginalized). Second, especially in areas that touch law enforcement applications, we need to be cautious not to develop systems that are opaque in their working mechanisms, as they would violate the right to transparency. A prominent ethics framework (ALGOCARE) from the UK on data science applications in law enforcement (Oswald et al., 2018) states clearly that a human must have the right to transparently trace how an automated decision was made. We hope that our work makes a step in that direction by looking beyond the classification performance of deep learning models.
References
- Abadi et al. (2016) Martín Abadi, Ashish Agarwal, Paul Barham, Eugene Brevdo, Zhifeng Chen, Craig Citro, Greg S Corrado, Andy Davis, Jeffrey Dean, Matthieu Devin, et al. 2016. Tensorflow: Large-scale machine learning on heterogeneous distributed systems. arXiv preprint arXiv:1603.04467.
- Banerjee et al. (2015) Snehasish Banerjee, Alton Y. K. Chua, and Jung-Jae Kim. 2015. Using supervised learning to classify authentic and fake online reviews. In Proceedings of the 9th International Conference on Ubiquitous Information Management and Communication, IMCOM ’15, New York, NY, USA. Association for Computing Machinery.
- Benjamini and Hochberg (1995) Yoav Benjamini and Yosef Hochberg. 1995. Controlling the false discovery rate: a practical and powerful approach to multiple testing. Journal of the Royal statistical society: series B (Methodological), 57(1):289–300.
- Binder et al. (2016) Alexander Binder, Sebastian Bach, Gregoire Montavon, Klaus-Robert Müller, and Wojciech Samek. 2016. Layer-wise relevance propagation for deep neural network architectures. In Information science and applications (ICISA) 2016, pages 913–922. Springer.
- Boyd et al. (2022) Ryan L Boyd, Ashwini Ashokkumar, Sarah Seraj, and James W Pennebaker. 2022. The development and psychometric properties of liwc-22. Austin, TX: University of Texas at Austin.
- Capuozzo et al. (2020) Pasquale Capuozzo, Ivano Lauriola, Carlo Strapparava, Fabio Aiolli, and Giuseppe Sartori. 2020. DecOp: A multilingual and multi-domain corpus for detecting deception in typed text. In Proceedings of the 12th Language Resources and Evaluation Conference, pages 1423–1430, Marseille, France. European Language Resources Association.
- Chebbi and Jebara (2021) Safa Chebbi and Sofia Ben Jebara. 2021. Deception detection using multimodal fusion approaches. Multimedia Tools and Applications, pages 1–30.
- Conroy et al. (2015) Nadia K Conroy, Victoria L Rubin, and Yimin Chen. 2015. Automatic deception detection: Methods for finding fake news. Proceedings of the Association for Information Science and Technology, 52(1):1–4.
- Danilevsky et al. (2020) Marina Danilevsky, Kun Qian, Ranit Aharonov, Yannis Katsis, Ban Kawas, and Prithviraj Sen. 2020. A survey of the state of explainable AI for natural language processing. In Proceedings of the 1st Conference of the Asia-Pacific Chapter of the Association for Computational Linguistics and the 10th International Joint Conference on Natural Language Processing, pages 447–459, Suzhou, China. Association for Computational Linguistics.
- De Lange et al. (2022) Matthias De Lange, Rahaf Aljundi, Marc Masana, Sarah Parisot, Xu Jia, Ales Leonardis, Gregory Slabaugh, and Tinne Tuytelaars. 2022. A continual learning survey: Defying forgetting in classification tasks. IEEE Transactions on Pattern Analysis and Machine Intelligence, 44(7):3366–3385.
- Devlin et al. (2019) Jacob Devlin, Ming-Wei Chang, Kenton Lee, and Kristina Toutanova. 2019. Bert: Pre-training of deep bidirectional transformers for language understanding.
- Fitzpatrick et al. (2015) Eileen Fitzpatrick, Joan Bachenko, and Tommaso Fornaciari. 2015. Automatic detection of verbal deception. Synthesis Lectures on Human Language Technologies, 8(3):1–119.
- Fontanarava et al. (2017) Julien Fontanarava, Gabriella Pasi, and Marco Viviani. 2017. Feature analysis for fake review detection through supervised classification. In 2017 IEEE International Conference on Data Science and Advanced Analytics (DSAA), pages 658–666.
- Forman et al. (2003) George Forman et al. 2003. An extensive empirical study of feature selection metrics for text classification. J. Mach. Learn. Res., 3(Mar):1289–1305.
- Fornaciari et al. (2021) Tommaso Fornaciari, Federico Bianchi, Massimo Poesio, and Dirk Hovy. 2021. BERTective: Language models and contextual information for deception detection. In Proceedings of the 16th Conference of the European Chapter of the Association for Computational Linguistics: Main Volume, pages 2699–2708, Online. Association for Computational Linguistics.
- Fornaciari and Poesio (2012) Tommaso Fornaciari and Massimo Poesio. 2012. DeCour: a corpus of DEceptive statements in Italian COURts. In Proceedings of the Eighth International Conference on Language Resources and Evaluation (LREC’12), pages 1585–1590, Istanbul, Turkey. European Language Resources Association (ELRA).
- Fornaciari and Poesio (2013) Tommaso Fornaciari and Massimo Poesio. 2013. Automatic deception detection in italian court cases. Artificial intelligence and law, 21(3):303–340.
- Girgis et al. (2018) Sherry Girgis, Eslam Amer, and Mahmoud Gadallah. 2018. Deep learning algorithms for detecting fake news in online text. In 2018 13th International Conference on Computer Engineering and Systems (ICCES), pages 93–97. IEEE.
- Hajek et al. (2020) Petr Hajek, Aliaksandr Barushka, and Michal Munk. 2020. Fake consumer review detection using deep neural networks integrating word embeddings and emotion mining. Neural Computing and Applications, 32(23):17259–17274.
- Jin et al. (2019) Xisen Jin, Zhongyu Wei, Junyi Du, Xiangyang Xue, and Xiang Ren. 2019. Towards Hierarchical Importance Attribution: Explaining Compositional Semantics for Neural Sequence Models. arXiv e-prints, page arXiv:1911.06194.
- Kao et al. (2020) Yi-Ying Kao, Po-Han Chen, Chun-Chiao Tzeng, Zi-Yuan Chen, Boaz Shmueli, and Lun-Wei Ku. 2020. Detecting deceptive language in crime interrogation. In International Conference on Human-Computer Interaction, pages 80–90. Springer.
- Kennedy et al. (2019) Stefan Kennedy, Niall Walsh, Kirils Sloka, Andrew McCarren, and Jennifer Foster. 2019. Fact or factitious? contextualized opinion spam detection. In Proceedings of the 57th Annual Meeting of the Association for Computational Linguistics: Student Research Workshop, pages 344–350, Florence, Italy. Association for Computational Linguistics.
- Khan et al. (2021) Wasiq Khan, Keeley Crockett, James O’Shea, Abir Hussain, and Bilal M. Khan. 2021. Deception in the eyes of deceiver: A computer vision and machine learning based automated deception detection. Expert Systems with Applications, 169:114341.
- Kleinberg et al. (2018) Bennett Kleinberg, Maximilian Mozes, Arnoud Arntz, and Bruno Verschuere. 2018. Using named entities for computer-automated verbal deception detection. Journal of forensic sciences, 63(3):714–723.
- Kleinberg et al. (2017) Bennett Kleinberg, Galit Nahari, Arnoud Arntz, and Bruno Verschuere. 2017. An investigation on the detectability of deceptive intent about flying through verbal deception detection. Collabra: Psychology, 3(1).
- Kleinberg and Verschuere (2021) Bennett Kleinberg and Bruno Verschuere. 2021. How humans impair automated deception detection performance. Acta Psychologica, 213:103250.
- Li et al. (2015) Jiwei Li, Xinlei Chen, Eduard Hovy, and Dan Jurafsky. 2015. Visualizing and understanding neural models in nlp. arXiv preprint arXiv:1506.01066.
- Liu et al. (2019) Yinhan Liu, Myle Ott, Naman Goyal, Jingfei Du, Mandar Joshi, Danqi Chen, Omer Levy, Mike Lewis, Luke Zettlemoyer, and Veselin Stoyanov. 2019. Roberta: A robustly optimized bert pretraining approach.
- Lu et al. (2016) Jiasen Lu, Jianwei Yang, Dhruv Batra, and Devi Parikh. 2016. Hierarchical question-image co-attention for visual question answering. In Advances in Neural Information Processing Systems, volume 29. Curran Associates, Inc.
- Nahari et al. (2019) Galit Nahari, Tzachi Ashkenazi, Ronald P Fisher, Pär-Anders Granhag, Irit Hershkowitz, Jaume Masip, Ewout H Meijer, Zvi Nisin, Nadav Sarid, Paul J Taylor, et al. 2019. ‘language of lies’: Urgent issues and prospects in verbal lie detection research. Legal and Criminological Psychology, 24(1):1–23.
- Nguyen et al. (2018) An Nguyen, Aditya Kharosekar, Matthew Lease, and Byron Wallace. 2018. An interpretable joint graphical model for fact-checking from crowds. Proceedings of the AAAI Conference on Artificial Intelligence, 32(1).
- Oswald et al. (2018) Marion Oswald, Jamie Grace, Sheena Urwin, and Geoffrey C. Barnes. 2018. Algorithmic risk assessment policing models: lessons from the durham hart model and ‘experimental’ proportionality. Information & Communications Technology Law, 27(2):223–250.
- Ott et al. (2011) Myle Ott, Yejin Choi, Claire Cardie, and Jeffrey T. Hancock. 2011. Finding deceptive opinion spam by any stretch of the imagination. In Proceedings of the 49th Annual Meeting of the Association for Computational Linguistics: Human Language Technologies, pages 309–319, Portland, Oregon, USA. Association for Computational Linguistics.
- Pennebaker et al. (2015) James W Pennebaker, Ryan L Boyd, Kayla Jordan, and Kate Blackburn. 2015. The development and psychometric properties of liwc2015. Technical report.
- Pérez-Rosas et al. (2015) Verónica Pérez-Rosas, Mohamed Abouelenien, Rada Mihalcea, Yao Xiao, CJ Linton, and Mihai Burzo. 2015. Verbal and nonverbal clues for real-life deception detection. In Proceedings of the 2015 Conference on Empirical Methods in Natural Language Processing, pages 2336–2346, Lisbon, Portugal. Association for Computational Linguistics.
- Pérez-Rosas et al. (2018) Verónica Pérez-Rosas, Bennett Kleinberg, Alexandra Lefevre, and Rada Mihalcea. 2018. Automatic detection of fake news. In Proceedings of the 27th International Conference on Computational Linguistics, pages 3391–3401, Santa Fe, New Mexico, USA. Association for Computational Linguistics.
- Pérez-Rosas and Mihalcea (2015) Verónica Pérez-Rosas and Rada Mihalcea. 2015. Experiments in open domain deception detection. In Proceedings of the 2015 Conference on Empirical Methods in Natural Language Processing, pages 1120–1125, Lisbon, Portugal. Association for Computational Linguistics.
- Ribeiro et al. (2016) Marco Tulio Ribeiro, Sameer Singh, and Carlos Guestrin. 2016. " why should i trust you?" explaining the predictions of any classifier. In Proceedings of the 22nd ACM SIGKDD international conference on knowledge discovery and data mining, pages 1135–1144.
- Ríssola et al. (2020) Esteban Andrés Ríssola, Mohammad Aliannejadi, and Fabio Crestani. 2020. Beyond modelling: understanding mental disorders in online social media. In European Conference on Information Retrieval, pages 296–310. Springer.
- Rubin et al. (2015) Victoria L Rubin, Yimin Chen, and Nadia K Conroy. 2015. Deception detection for news: three types of fakes. Proceedings of the Association for Information Science and Technology, 52(1):1–4.
- Simonyan et al. (2014) Karen Simonyan, Andrea Vedaldi, and Andrew Zisserman. 2014. Deep inside convolutional networks: Visualising image classification models and saliency maps.
- Soldner et al. (2019) Felix Soldner, Verónica Pérez-Rosas, and Rada Mihalcea. 2019. Box of lies: Multimodal deception detection in dialogues. In Proceedings of the 2019 Conference of the North American Chapter of the Association for Computational Linguistics: Human Language Technologies, Volume 1 (Long and Short Papers), pages 1768–1777, Minneapolis, Minnesota. Association for Computational Linguistics.
- Tausczik and Pennebaker (2010) Yla R. Tausczik and James W. Pennebaker. 2010. The psychological meaning of words: Liwc and computerized text analysis methods. Journal of Language and Social Psychology, 29:24 – 54.
- Tomas et al. (2022) Frédéric Tomas, Olivier Dodier, and Samuel Demarchi. 2022. Computational measures of deceptive language: prospects and issues. Frontiers in Communication, 7:792378.
- Vaswani et al. (2017) Ashish Vaswani, Noam Shazeer, Niki Parmar, Jakob Uszkoreit, Llion Jones, Aidan N Gomez, Ł ukasz Kaiser, and Illia Polosukhin. 2017. Attention is all you need. In Advances in Neural Information Processing Systems, volume 30. Curran Associates, Inc.
- Vrij et al. (2010) Aldert Vrij, Pär Anders Granhag, and Stephen Porter. 2010. Pitfalls and opportunities in nonverbal and verbal lie detection. Psychological science in the public interest, 11(3):89–121.
- Wolf et al. (2020) Thomas Wolf, Lysandre Debut, Victor Sanh, Julien Chaumond, Clement Delangue, Anthony Moi, Pierric Cistac, Tim Rault, Rémi Louf, Morgan Funtowicz, Joe Davison, Sam Shleifer, Patrick von Platen, Clara Ma, Yacine Jernite, Julien Plu, Canwen Xu, Teven Le Scao, Sylvain Gugger, Mariama Drame, Quentin Lhoest, and Alexander M. Rush. 2020. Transformers: State-of-the-art natural language processing. In Proceedings of the 2020 Conference on Empirical Methods in Natural Language Processing: System Demonstrations, pages 38–45, Online. Association for Computational Linguistics.
- Wu et al. (2018) Zhe Wu, Bharat Singh, Larry Davis, and V. Subrahmanian. 2018. Deception detection in videos. Proceedings of the AAAI Conference on Artificial Intelligence, 32(1).
Appendix A Results of RoBERTa
In Table 3, the results of our proposed approaches (by employing RoBERTa) are reported.
| Evaluation metrics | ||||||
| Architecture | Precision | Recall | F1-score | Accuracy | AUROC | Specificity |
| RoBERTa + Dense Layers | 63.56 | 41.99 | 47.64 | 56.15 | 61.24 | 71.74 |
| 6.07 | 17.93 | 13.85 | 3.99 | 3.94 | 16.20 | |
| RoBERTa + MultiHead Attention | 66.75 | 47.84 | 54.99 | 60.01 | 66.35 | 73.42 |
| 4.75 | 10.64 | 7.29 | 3.60 | 4.34 | 7.98 | |
| RoBERTa + Transformers | 67.58 | 52.26 | 57.53 | 61.90 | 68.21 | 72.40 |
| 3.33 | 15.33 | 10.79 | 4.52 | 4.92 | 9.26 | |
| RoBERTa + Co-Attention | 69.31 | 76.89 | 72.44 | 69.70 | 76.68 | 61.84 |
| 3.94 | 8.60 | 2.81 | 2.25 | 2.12 | 10.57 | |
| RoBERTa + Co-Attention + LIWC | 70.47 | 73.40 | 71.22 | 69.31 | 76.91 | 64.79 |
| 5.39 | 9.47 | 3.18 | 2.83 | 2.42 | 12.94 | |
| RoBERTa + Transformers + Co-Attention | 69.55 | 75.70 | 72.38 | 69.86 | 76.67 | 63.50 |
| 3.17 | 4.14 | 2.11 | 2.34 | 2.52 | 5.96 | |
Appendix B Results of the introduced approaches on the Open Domain Deception Dataset
Table 4 shows that BERT+Co-Attention constitutes our best performing model, since it outperforms the other proposed models in terms of Accuracy, Recall, F1-score, and AUROC. Although it performs worse in Precision, it surpasses all models in the F1-score, which constitutes the weighted average of Precision and Recall. Moreover, it surpasses all other models models in Accuracy, in F1-score, in AUROC, and in Recall by 1.01-12.45, 2.23-20.67, 1.59-16.63, and 5.38-27.12 points respectively. However, it performs worse than Feature Set: POS by 1.09 points.
| Evaluation metrics | ||||||
| Architecture | Precision | Recall | F1-score | Accuracy | AUROC | Specificity |
| Feature Set: POS | - | - | - | 69.50 | - | - |
| BERT + Dense Layers | 60.42 | 57.10 | 57.41 | 59.27 | 62.99 | 61.53 |
| 5.37 | 13.96 | 7.11 | 3.53 | 3.45 | 15.05 | |
| BERT + MultiHead Attention | 58.83 | 43.59 | 48.10 | 55.96 | 59.61 | 68.30 |
| 6.80 | 16.60 | 10.95 | 3.80 | 4.88 | 17.07 | |
| BERT + Transformers | 68.53 | 65.02 | 66.54 | 67.40 | 74.65 | 69.75 |
| 3.71 | 6.26 | 4.02 | 2.99 | 2.93 | 5.79 | |
| BERT + Co-Attention | 68.52 | 70.71 | 68.77 | 68.41 | 76.24 | 66.12 |
| 5.19 | 10.77 | 4.64 | 3.03 | 2.74 | 11.67 | |
| BERT + Transformers + Co-Attention | 67.16 | 65.33 | 66.14 | 66.71 | 73.18 | 68.07 |
| 2.06 | 5.37 | 3.44 | 2.44 | 3.03 | 3.02 | |
Appendix C Summary Text Statistics
Table 5 reports the results of the TEXTSTAT library.
| Q1 | Q2 | Q1 & Q2 | ||||
| Metric | T | D | T | D | T | D |
| Syllable Count | 59.9 36.0 | 67.5 39.5 | 45.3 30.7 | 50.7 32.2 | 104.6 57.1 | 117.6 59.9 |
| Lexicon Count | 46.2 27.7 | 52 30.4 | 34.5 23.4 | 38.9 24.4 | 79.9 43.3 | 90.1 45.7 |
| Sentence Count | 2.3 1.6 | 2.4 1.5 | 1.9 1.3 | 2.0 1.2 | 3.4 2.5 | 3.6 2.4 |
| Difficult Words | 4.9 3.8 | 5.4 4.0 | 4.1 3.4 | 4.6 3.7 | 8.5 5.8 | 9.2 6.0 |
Appendix D Vocabulary Uniqueness
Table 6 reports the results of Jaccard Index between truthful and deceptive statements.
| Jaccard Index between statements | Result |
| J(= truthful & , =deceptive & ) | 0.3618 |
| J(= truthful , =deceptive ) | 0.3548 |
| J(= truthful , =deceptive ) | 0.3341 |
Appendix E LIWC Categories
Table 7 provides an overview of the LIWC features along with some specific examples.
| LIWC categories | Examples |
| ingestion | dish, eat, pizza |
| biological processes | eat, blood, pain |
| analytical thinking | |
| numbers | second, thousand |
| leisure | cook, chat, movie |
| future focus | may, will, soon |
| dictionary words | |
| article | a, an, the |
| time | end, until, season |
| affiliation | ally, friend, social |
| home | kitchen, landlord |
| apostrophes | ’ |
| past focus | ago, did, talked |
| reward | take, prize, benefit |
| word count | |
| all pronouns | I, them, itself |
| personal pronoun | I, them, her |
| exclamation marks | ! |
| emotional tone | |
| present focus | today, is, now |
| positive emotion | love, nice, sweet |
| affect | happy, cried |
| all punctuation | periods, colons, etc. |
| adjective | ree, happy, long |
| common verbs | eat, come, carry |
| 3rd pers singular | she, he |