Corresponding author: D. Shy, e-mail: daniel.shy.ctr@nrl.navy.mil
DISTRIBUTION A: Approved for public release, distribution is unlimited.
Development of the ComPair gamma-ray telescope prototype
Abstract
There is a growing interest in the science uniquely enabled by observations in the MeV range, particularly in light of multi-messenger astrophysics. The Compton Pair (ComPair) telescope, a prototype of the AMEGO Probe-class concept, consists of four subsystems that together detect and characterize gamma rays in the MeV regime. A double-sided strip silicon Tracker gives a precise measure of the first Compton scatter interaction and tracks pair-conversion products. A novel cadmium zinc telluride (CZT) detector with excellent position and energy resolution beneath the Tracker detects the Compton-scattered photons. A thick cesium iodide (CsI) calorimeter contains the high-energy Compton and pair events. The instrument is surrounded by a plastic anti-coincidence (ACD) detector to veto the cosmic-ray background. In this work, we will give an overview of the science motivation and a description of the prototype development and performance.
keywords:
Gamma-ray astrophysics, gamma-ray instrumentation, Compton imaging, pair-conversion telescope1 INTRODUCTION
Gamma rays have an integral part in multi-messenger discoveries such as the combined detection with neutrinos from supernova SN1987A [1, 2] and gravitational waves (GWs) from GW 170817 [3]. However, the MeV domain remains largely under explored; COMPTEL on the Compton Gamma Ray Observatory was the last major imaging instrument sensitive to that energy range and was de-orbited in 2000 [4].
The All-sky Medium Energy Gamma-ray Observatory (AMEGO) is a probe-class mission concept designed to address the MeV gap [5]. AMEGO is sensitive to photons from to , which covers both the Compton and pair-conversion regime. To accomplish the detection and imaging of both these processes, we employ a unique combination of a ‘Tracker’ with both a low- and high-energy calorimeter that are all surrounded by an anti-coincidence detector. These four major subsystems are briefly summarized here:
-
•
Double Sided Silicon Strip Detector (DSSD) Tracker acts as the Compton-scattering element for low-energy gamma rays and the pair-conversion material for high-energy gamma rays by measuring the position and energy of the particles moving through the Tracker layers.
-
•
Cadmium Zinc Telluride (CZT) calorimeter, or low-energy calorimeter, is optimized for detecting the scattered photon and enhances the line sensitivity, as well as providing improved imaging and polarization capabilities.
-
•
Cesium Iodide (CsI) calorimeter, or high-energy calorimeter, is designed to extend the energy range by detecting the ensuing electromagnetic showers.
-
•
Anti-coincidence detector (ACD) consisting of a plastic scintillator to reject charged particle background.
The simulated performance of the AMEGO concept is available in Ref. 6 which is optimized for continuum sensitivity across a broad energy range. There are other astrophysical instruments with a slightly different mission set and technological solution in various stages of conception/development. They include the Compton Spectrometer and Imager (COSI) [7], ASTROGAM [4], Galactic Explorer with a Coded Aperture Mask Compton Telescope (GECCO), Advanced Particle-astrophysics Telescope (APT) [8], SMILE-2+ [9], and AMEGO-X [10, 11].
To demonstrate the instrument’s potential, the AMEGO team has developed a prototype, ComPair, to advance the hardware and software used in the probe concept. Like the AMEGO probe, it consists of all four subsystems but with an energy range of . After in-lab calibration and qualification, the prototype is slated to perform a balloon test flight.
This work presents an update on the development and initial performance of the ComPair instrument. Sec. 2 presents an overview of the ComPair prototype while Sec. 3 presents the preliminary performance of each subsystem as well as the integrated instrument. The manuscript also describes the planned future work.
2 ComPair: An AMEGO Prototype
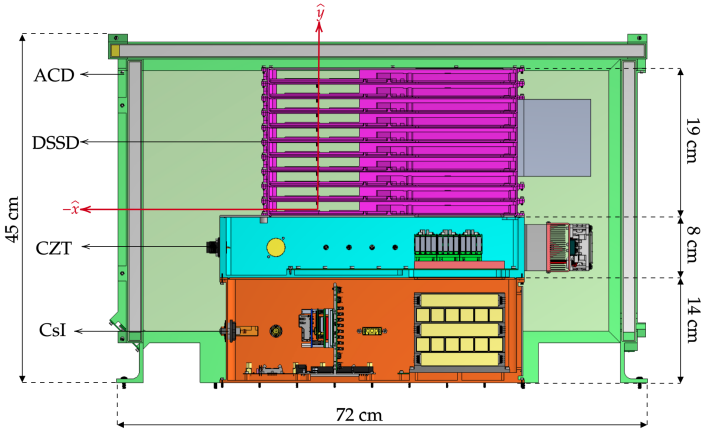
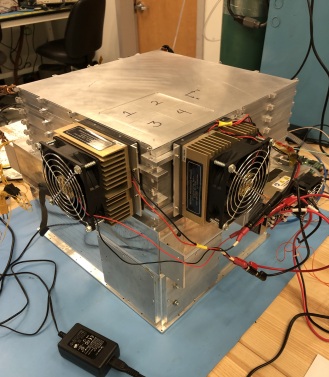
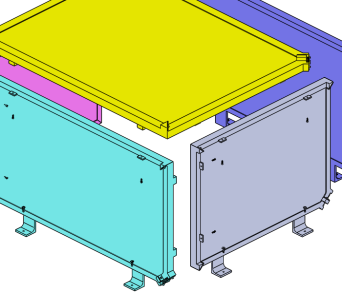
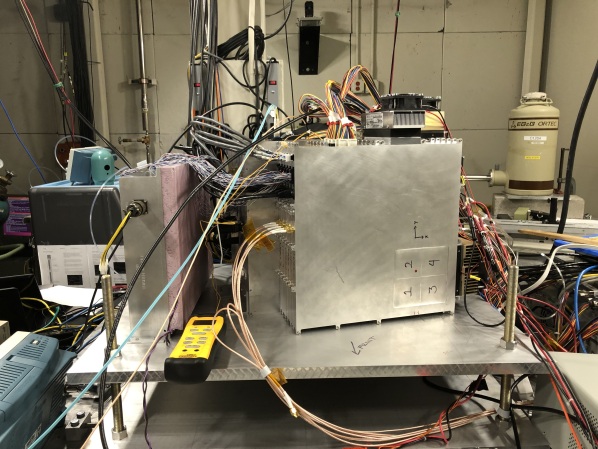
Fig. 1a presents a computer-aided design (CAD) model of the ComPair balloon prototype, while Fig. 1b presents the actual experimental setup without the ACD. The three core subsystems (Tracker, CZT and CsI) all fit within an envelope of roughly . The DSSD Tracker layers are at the top of the instrument. Below the Tracker are arrays of the CZT detectors, and the CsI calorimeter is at the bottom of the instrument.
For the actual balloon flight, the CZT housing will be re-designed to be hermetically sealed. The entire balloon instrument with the associated electronics weighs less than . Additional information on the balloon instrument is available in Sec. 4. The rest of this section overviews the different subsystems, trigger module, and flight computer.
2.1 Tracker: Double Sided Silicon Strip Detector
The ComPair Tracker has been designed, built, and tested by NASA’s Goddard Space Flight Center (GSFC), with firmware support from Los Alamos National Laboratory (LANL). Its goal is to achieve position sensitivity within each Tracker layer to measure the Compton-scattered electron or the tracks from the pair production. During a Compton scatter, should the recoiled electron proliferate into other layers, the Tracker also has the potential to track the electron and produce Compton arcs rather than rings [12].
Fig. 2a presents a single layer of the Tracker. The DSSD is positioned on the lower-right side of the image and has an active area of . Fabricated by Micron Semiconductor Ltd, the silicon wafers are thick with strips on each side that are orthogonal to each other to reconstruct the and positions of interaction [13]. The strips are wide with a pitch of . This results in 192 AC-coupled strips per side.
The wafers are mounted in a custom carrier that routes the signals to front-end electronics that use the IDEAS VATA460.3 application-specific integrated circuits (ASIC) [14]. Each side of the DSSD requires 6 ASICs with 32 channels on each ASIC. A complete description of the readout is available in Ref. 15. The ComPair prototype aims to use ten layers. Fig. 2b presents 6 fully integrated layers.
2.2 Low-Energy Calorimeter: CZT
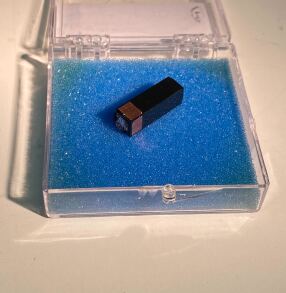
The low-energy calorimeter uses 3D position-sensitive virtual Frisch-grid Cadmium Zinc Telluride (CZT) developed at Brookhaven National Laboratory [16, 17]. Its performance is optimized to act as the absorber plane for gamma rays scattered in the Tracker. Its major advantage over other semiconductors is that it can operate at room temperature due to its wide bandgap. Each CZT crystal, manufactured by Redlen Technologies, is in size. Fig. 3a illustrates a single CZT crystal. Each end has a gold electrode representing the cathode and anode. Due to the severe trapping of the holes in CZT, single polarity charge sensing techniques need to be applied [18]. In this work, we utilize a virtual Frisch-grid technique whereby the shielding electrode pads are placed on the sides of the crystal. This allows for the reconstruction of the 3D position of interaction.
First, the cathode-to-anode ratio (CAR) calculates the depth of interaction ( coordinate). Due to the single-polar nature of CZT, the signal on the cathode is depth-dependent, while the virtual Frisch grid allows for an induced charge on the anode that is depth-independent. Therefore, the ratio results in a relative depth of interaction. Using the technique, the depth resolution is estimated to be less than 0.5 mm. Next, the side pads and the relative amplitudes induced on each pad could be used to calculate the coordinates of interaction [19]. Therefore, assuming a linear approximation for the response function, the coordinate could be calculated as
| (1) |
where and represent the recorded amplitude of pad 1 that is opposite of pad 2 in the direction. and similarly represent the pads in the direction. This method can produce a position resolution of better than in . Since the 3D position of each interaction can be reconstruction, a 3D voxel correction can be applied. This technique can compensate for non-uniformity in the detector material and results in a resolution of around 1% FWHM at 662 keV.
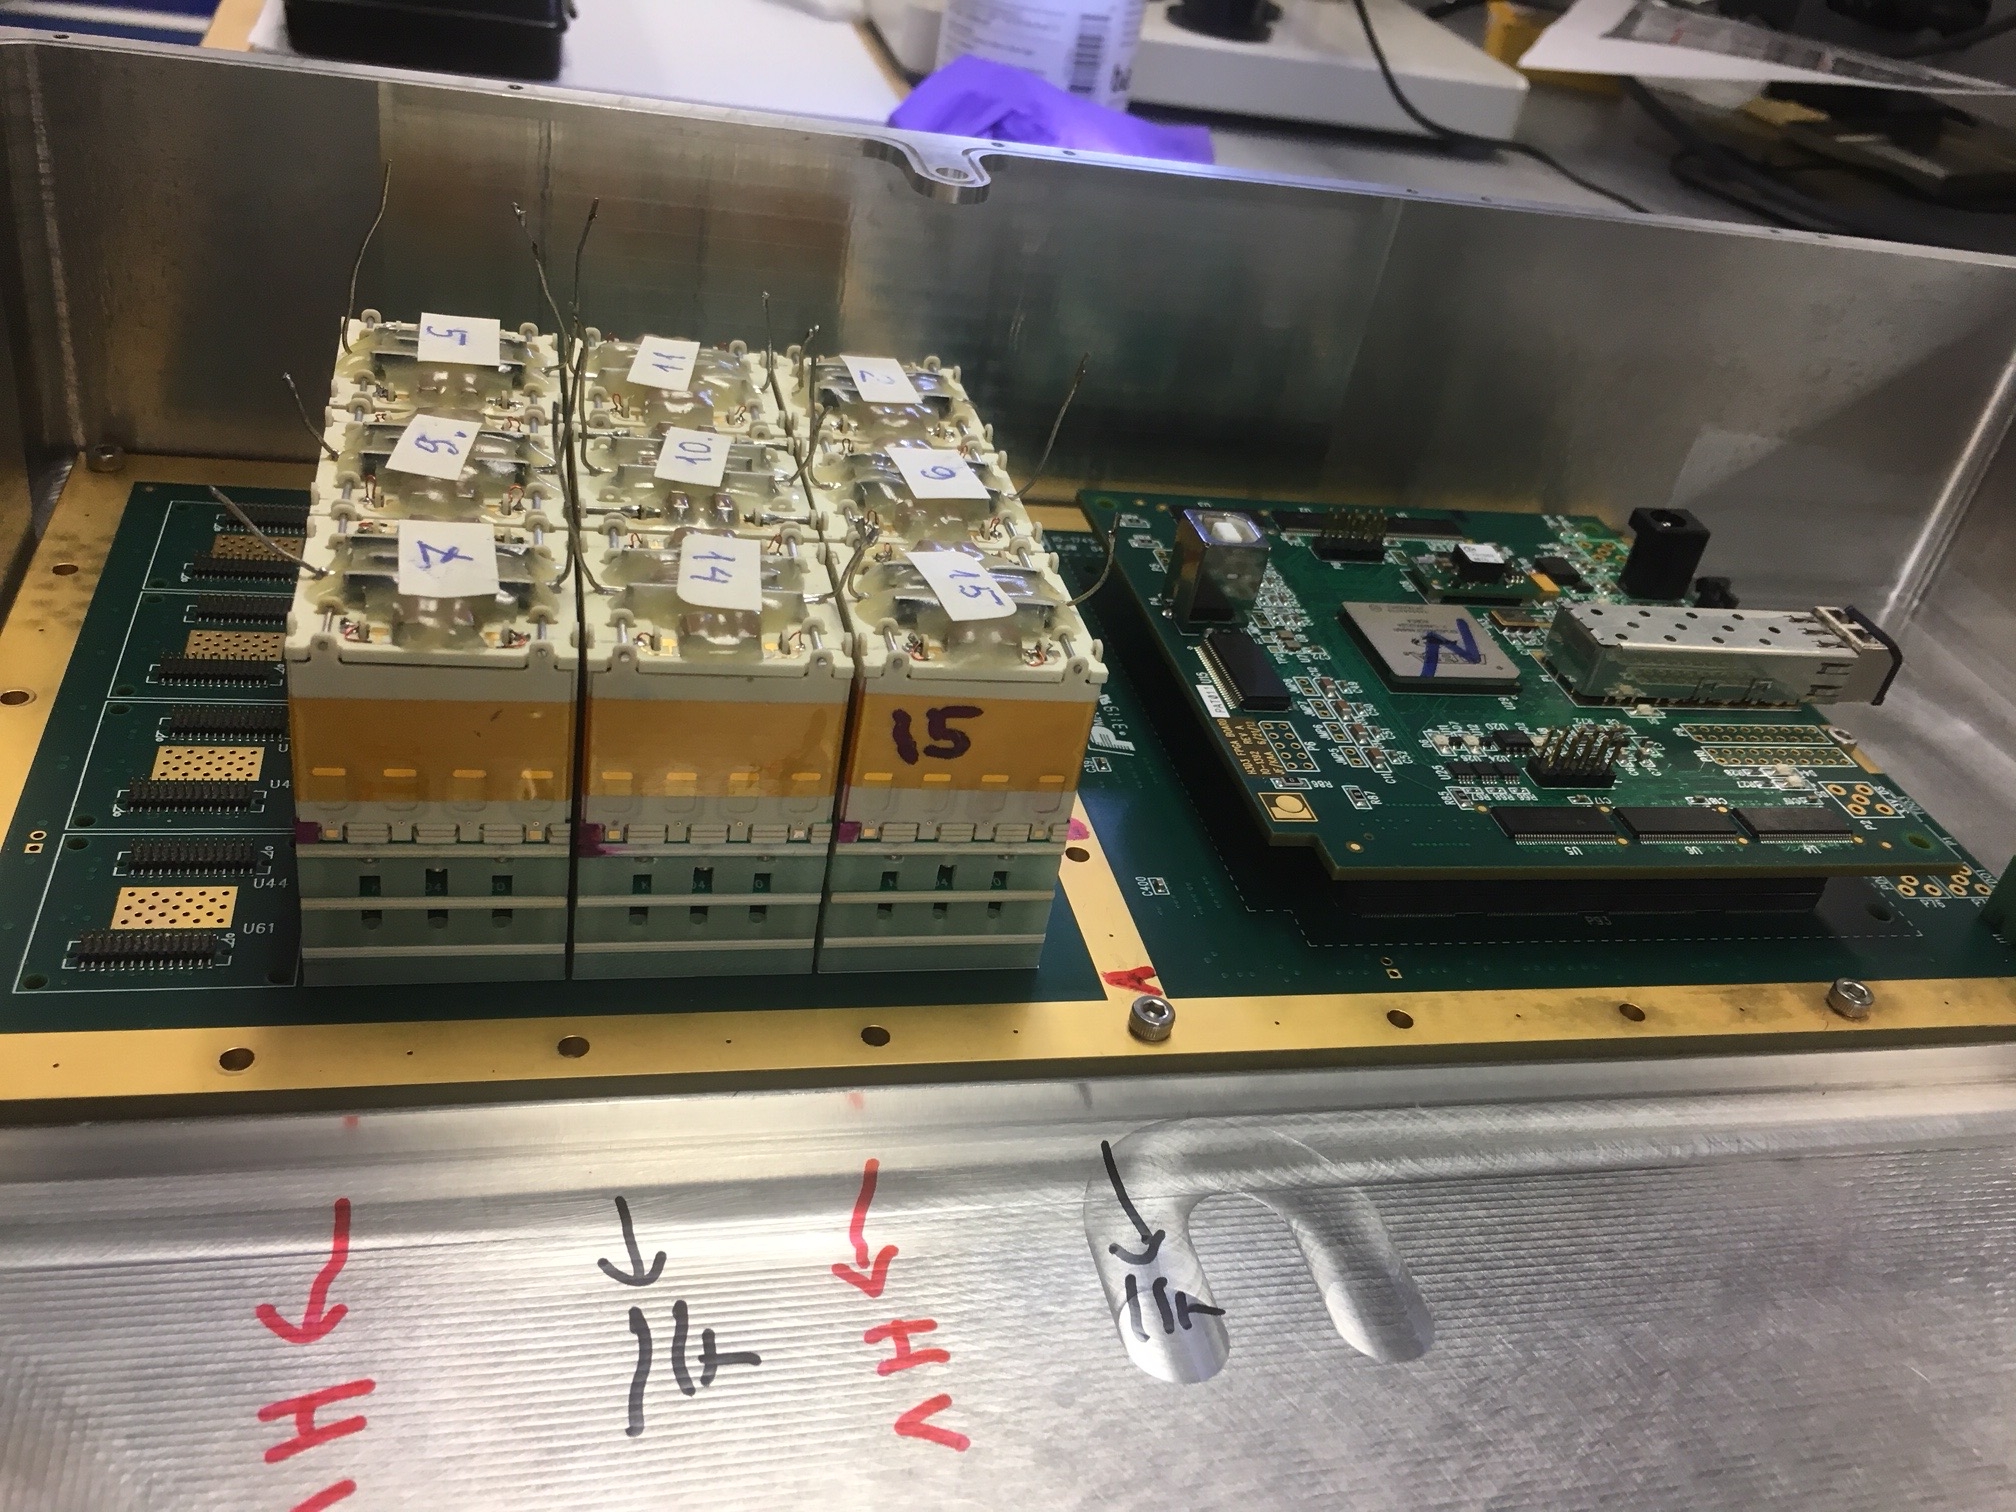
As a subsystem for ComPair, each crystal is packaged in a crate that encloses a array of crystals, shown in Fig. 3b. The crate is read out by a custom low-noise ASIC called the advanced virtual Frisch-Grid 2 (AVG2) [20]. An Altera Arria GX FPGA then handles the data recording and ASIC controls. In ComPair, there are a total of 9 crates arranged in a array, shown in Fig. 3c. The bars are biased to 2500 volts which requires the need for it to be placed in a pressure vessel for the balloon flight.

2.3 High-Energy Calorimeter: CsI
Developed by the U.S. Naval Research Laboratory, the high-energy calorimeter is composed of CsI:Tl bars and takes heritage from Fermi’s Large Area Telescope (LAT) CsI:Tl Calorimeter [21]. Each bar, grown by either Amcrys in Kharkov, Ukraine or Saint-Gobain, has dimension . Each face of the scintillator is roughened with 180-grit sandpaper to increase light asymmetry along the length of the bar. The crystals are then wrapped with Tetratex to increase light output [22]. Each end of the bar is read out by a array of J-series SiPMs manufactured by ON Semiconductors. Fig. 4a shows the SiPMs being bonded with epoxy to the crystal bars.
The CsI calorimeter makes use of 30 bars arranged in a hodoscopic fashion. In other words, the bars are arranged in rows of 6 that alternate direction between each layer. The bars are placed in a 3D printed plastic housing such that the center-to-center pitch between each bar is . The 60 SiPMs are read out by an IDEAS ROSSPAD [23], which is a module with 64 channels that is distributed to four SiPHRAs ASICS [24]. If and represent the energy recorded on each end of the bar, the depth of interaction in the bar is calculated as and the energy deposited is calculated as . The gain and SiPM voltage is tuned such that each bar has a dynamic energy range of roughly 250 keV to 30 MeV. Fig. 4b shows the CsI calorimeter in its final configuration.
2.4 ACD
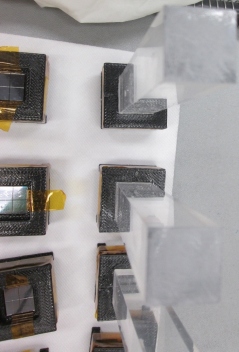
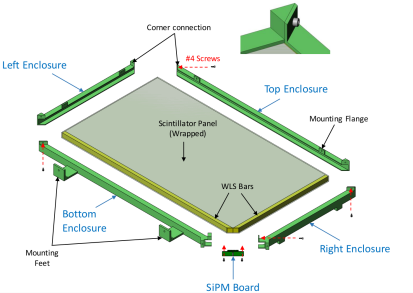
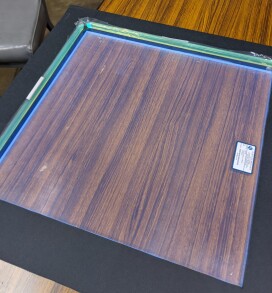
Similarly to the Fermi-LAT, the ComPair ACD uses plastic scintillator panels, specifically Eljen EJ-208. Unlike the Fermi LAT, the panels are not tiled as there is less concern of self-vetoing at the lower AMEGO energies. Two wavelength shifters are appended to two adjacent edges, shown in Fig. 5a. At the edge where the two shifters meet, the edges are chamfered out such that two arrays of C-Series SiPMs by On Semiconductors can be placed and read out the scintillation signals. The panels are then placed in aluminum frames for structural support.
Five panels compose the entire subsystem and cover the instrument’s four sides and its top. The ACD’s dimensions span , as seen in Fig. 5b. The ACD is then mounted onto a base plate with a bracket that elevates the panel slightly such that harnessing can pass from the core instrument to outside the ACD to connect to their relevant electronics. The front-end readout is duplicated from the CsI calorimeter.
2.5 Trigger Module
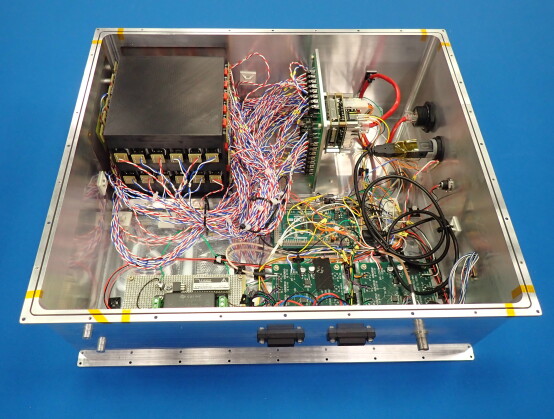
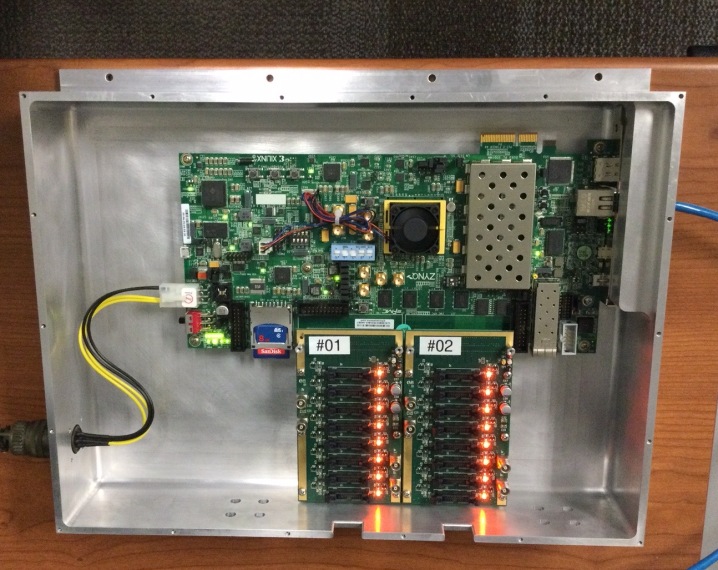
The Trigger Module (TM) is designed and built at GSFC to check for coincidences between the subsystems within a programmable window [25]. It uses a Xilinx Zynq-7000 FPGA evaluation kit with a custom breakout board for the 14 separate front-end boards: 10 for the Tracker layers, and one each for the CZT, CsI, and ACD. Fig. 6 shows the trigger module in its housing. Each subsystem produces a fast trigger signal with the Tracker’s layers acting independently from each other. If an interaction occurs in a subsystem, it will send a trigger to the TM, which will check for coincidence between other subsystems and flag it appropriately. If the triggers pass the coincidence logic, a trigger acknowledgment along with an Event ID is distributed to all the subsystems. The TM is programmable to enable 16 coincidence logic modes with various permutations of the different subsystems.
The ROSSPAD, which is the front-end readout for the CsI calorimeter and the ACD, does not have the general-purpose input/output capability to accept the Event ID from the TM. Therefore, we utilize an Arduino Due to accept EventIDs and synchronize them with the ROSSPAD triggers. The system also accepts a pulse-per-second (PPS) signal that is converted with a TTL-LVDS board to maintain synchronization between the different components. The Arduino and the TTL-LVDS converter boards are shown in Fig. 4b.
3 Preliminary Performance
This section presents the performance of individual subsystems as well as the performance of the integrated system.
3.1 Individual System Performance
Before full system integration, each subsystem has individually undergone testing and calibrations to validate performance. The Tracker underwent a series of inspections to study the uniformity, depletion voltage, and inter-strip capacitance of the DSSDs.
At the time of writing, six of the ten layers have been assembled and characterized. Fig. 7 presents an Am-241 spectrum from all the live strips in layer 2 with the line measured with a full-width-at-half-maximum (FWHM) of , or . The energy range of each Tracker strip is estimated to be around .
The CZT subsystem has undergone rigorous testing with its performance reported numerous times [19, 20, 16]. Fig. 8 presents the CZT’s response to an Na-22 source showing FWHM resolution at the . The energy range of the CZT subsystem is estimated to be 0.2-10 MeV per bar.

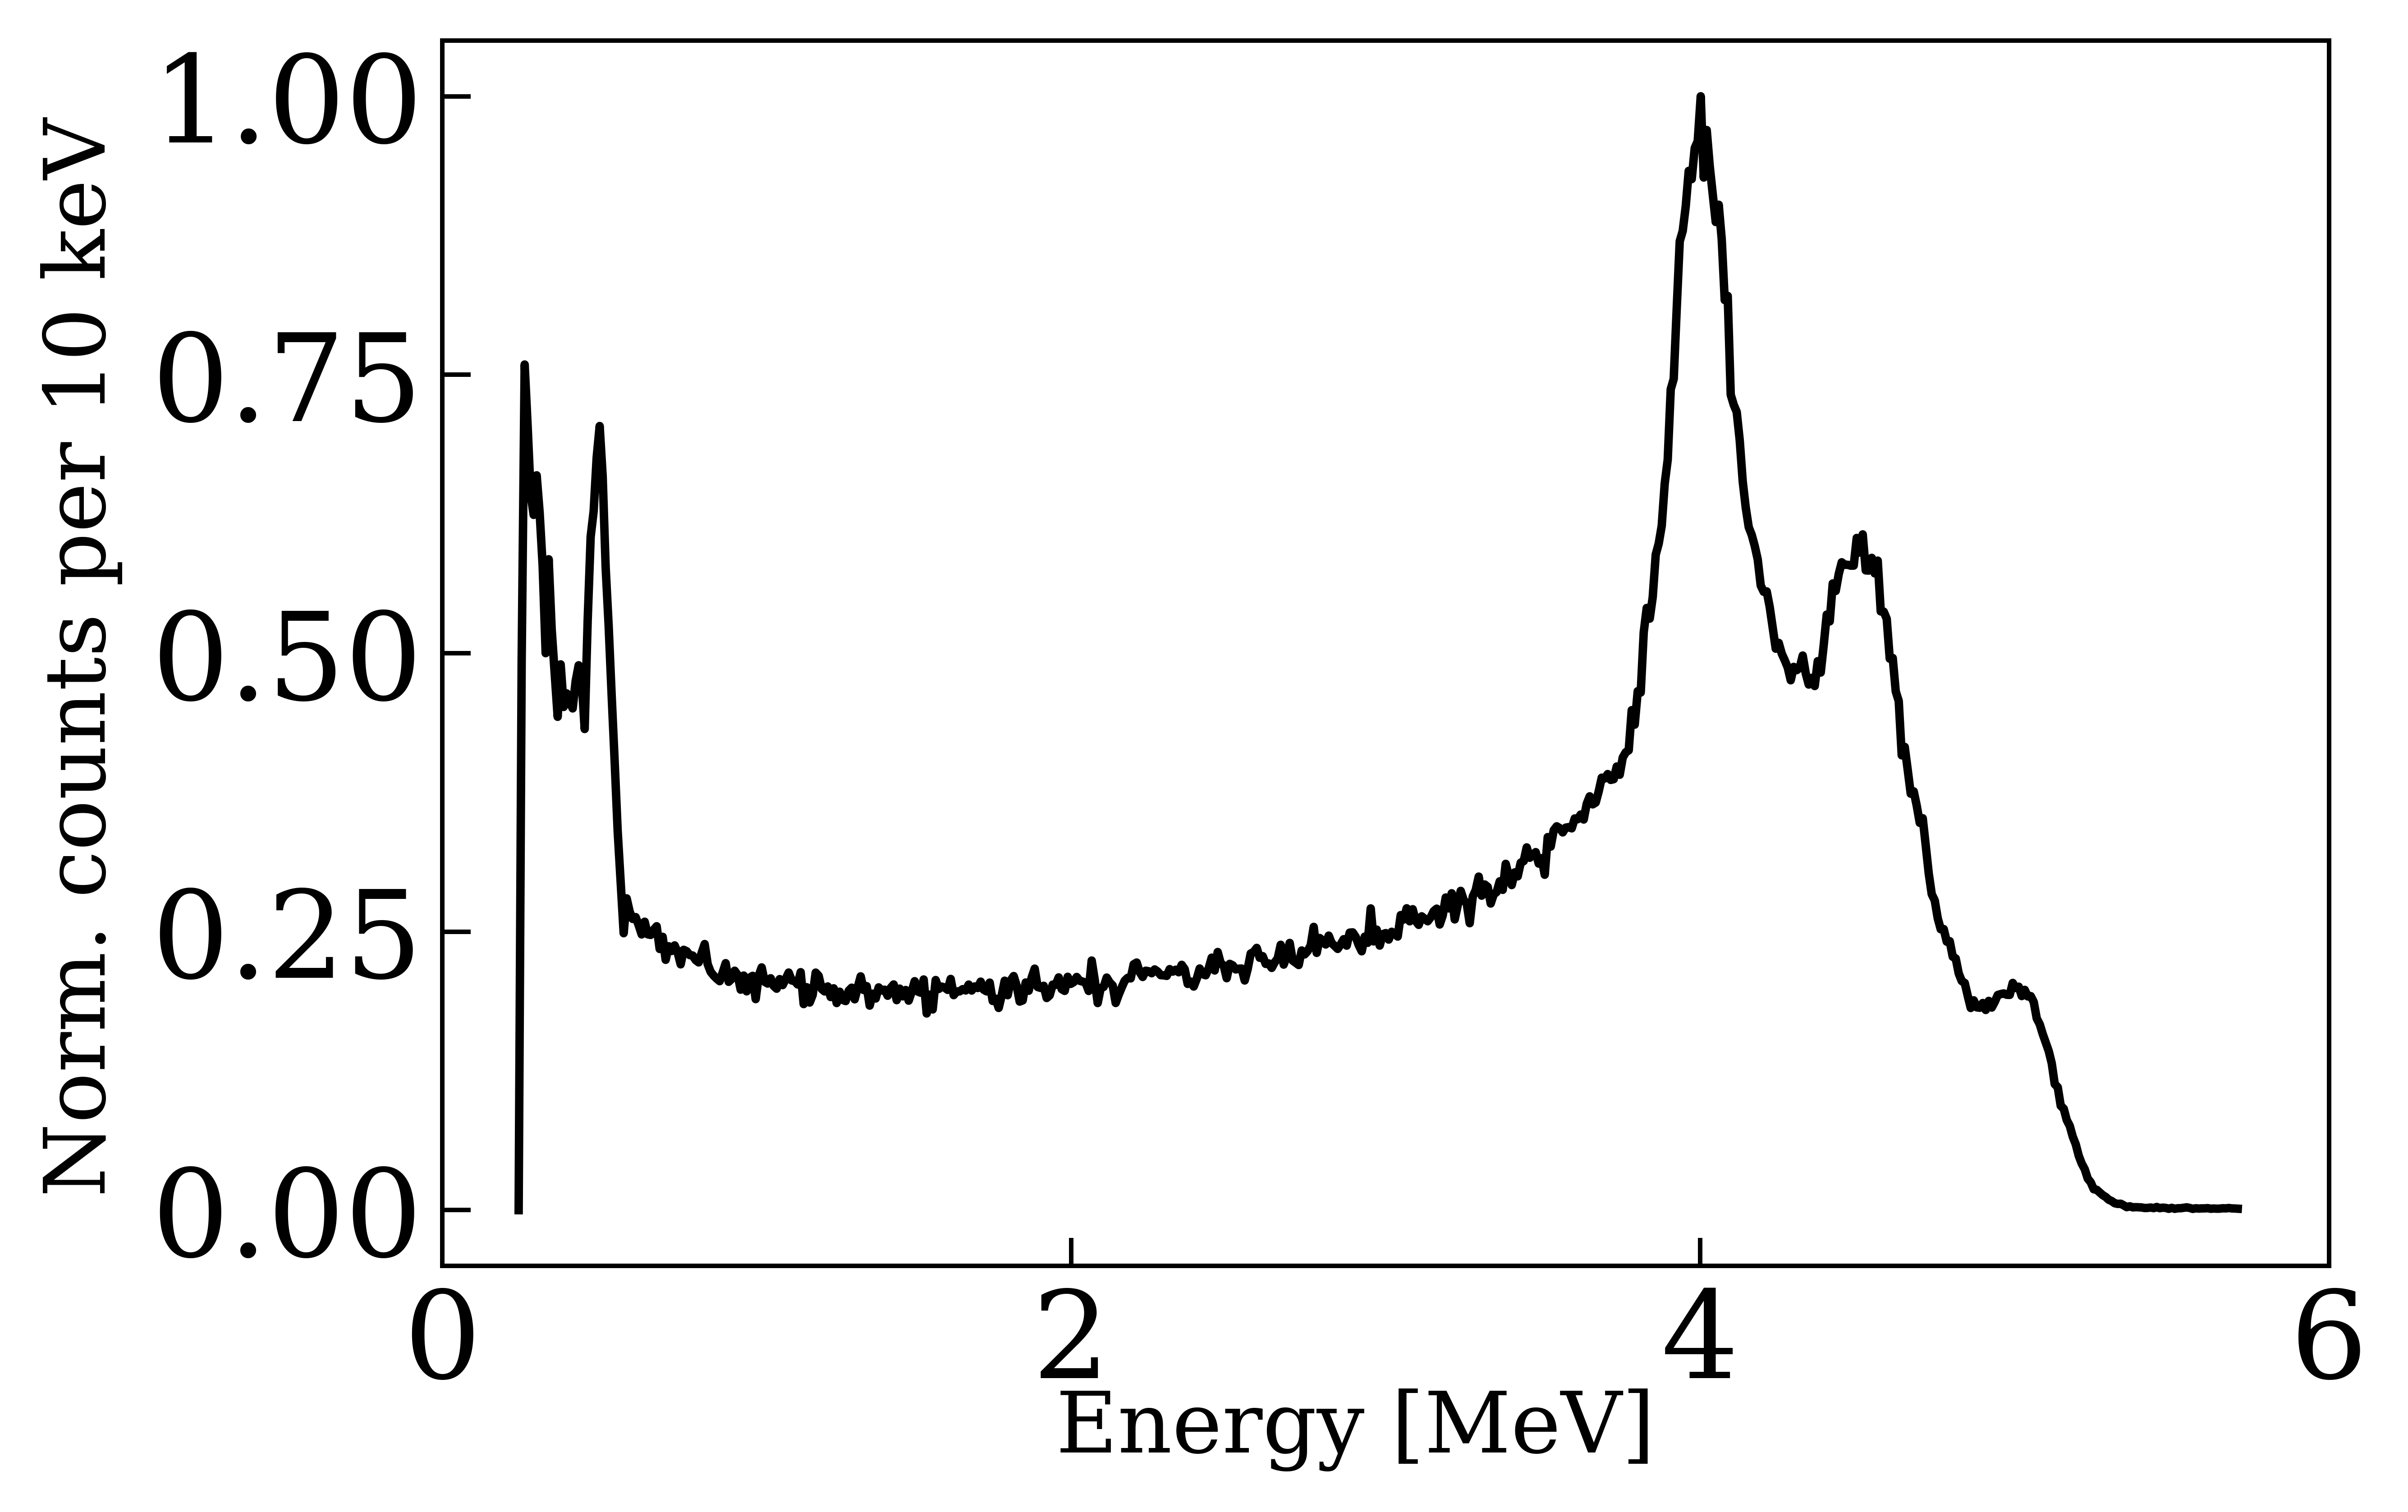
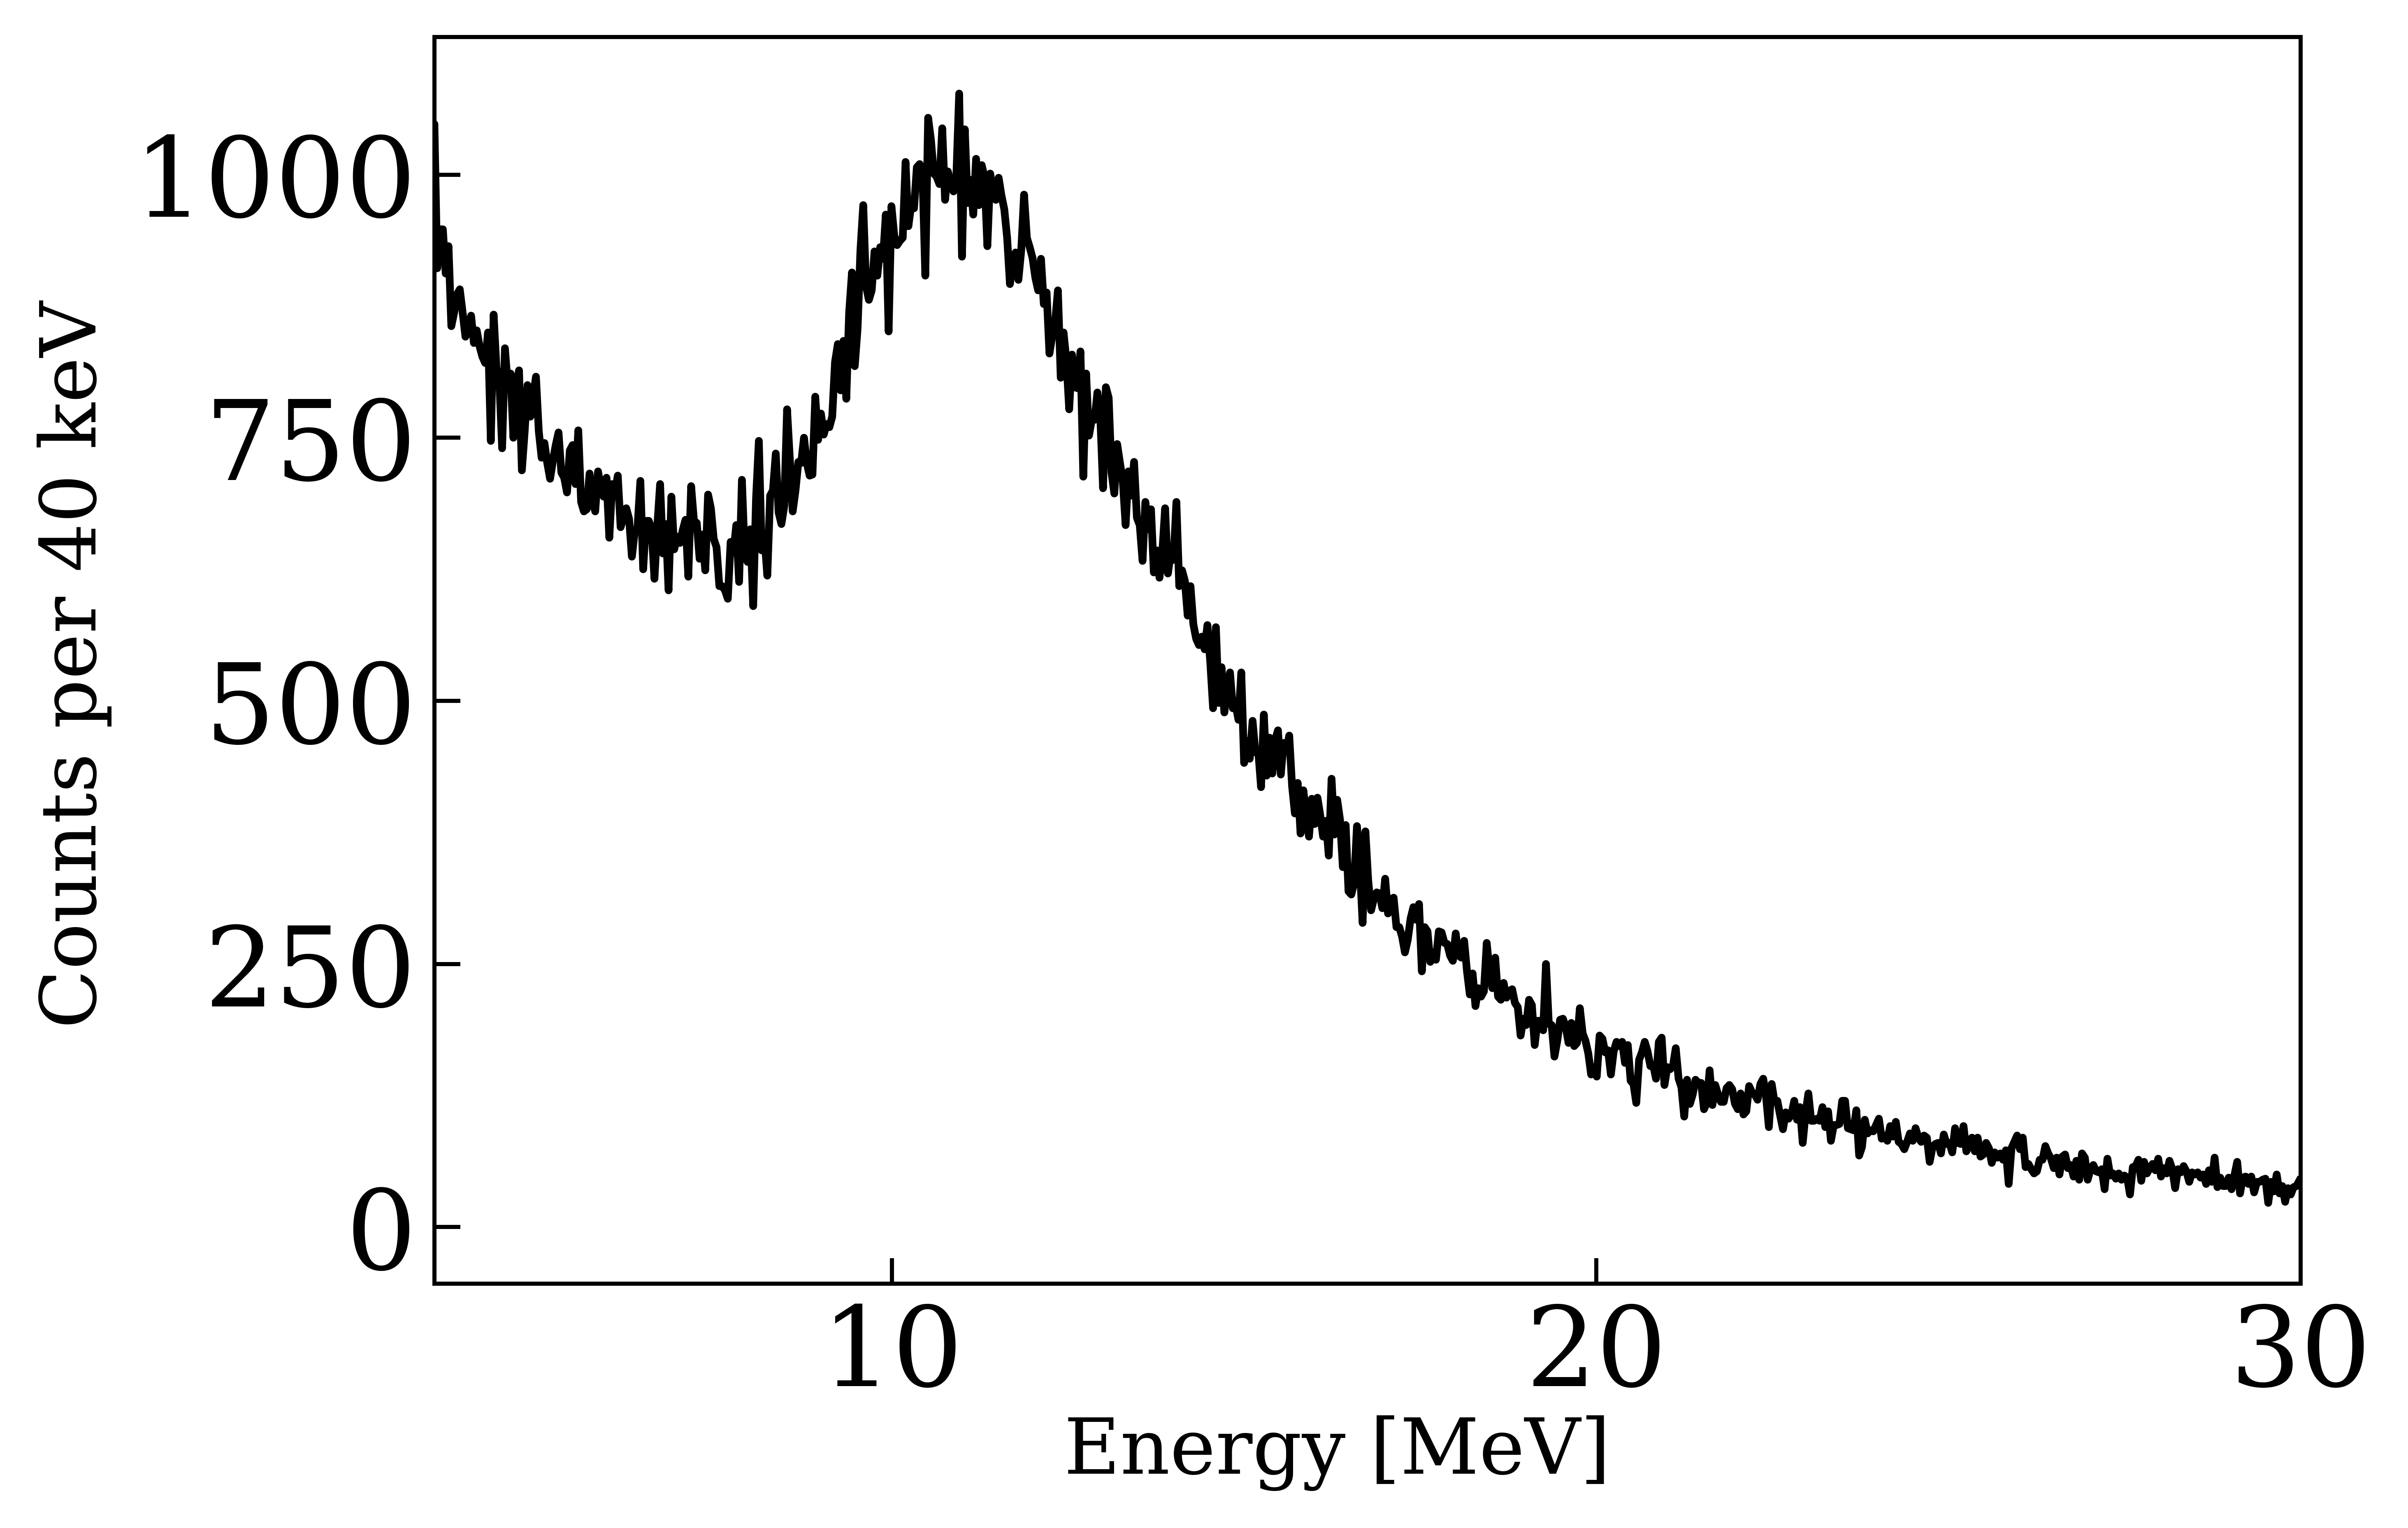
We tested the CsI subsystem extensively in the lab with various check sources at energies such as (Na-22) and from Th-228. The energy resolution across all individual bars in the system averages around FWHM at . The energy range of a single bar is set to be . In addition, the CsI calorimeter has undergone various tests from monoenergetic beams. Fig. 9a plots the energy response of a single bar to a monoenergetic gamma-ray beam. Fig. 9b plots the calorimeter’s response to muons showing a clear Landau distribution.
3.2 Fully Integrated System
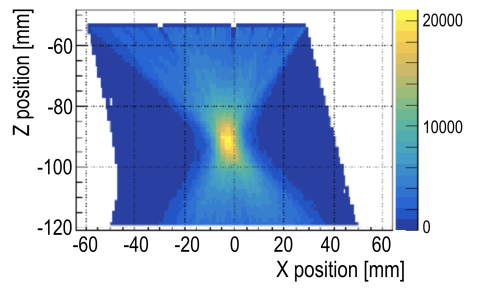
We conducted several tests and experiments to validate the integrated system during the instrument commissioning phase. To test the timing and position calibration of the CZT and CsI subsystem, a Na-22 check source was placed in between the active area of the two systems. As the Na-22 source undergoes decay, it emits two characteristic annihilation photons in anti-parallel directions. Simultaneous detection by the CZT and CsI subsystems of the photons indicates that the triggering mechanism is actively working and assures that the geometry is appropriately modeled. Fig. 10 plots the lines of response between the locations of the detected photons. Since a clear hot spot is visible, this implies a simultaneous detection of the photons and a verification of coincidence. The hot spot also indicates that position reconstruction is functioning.
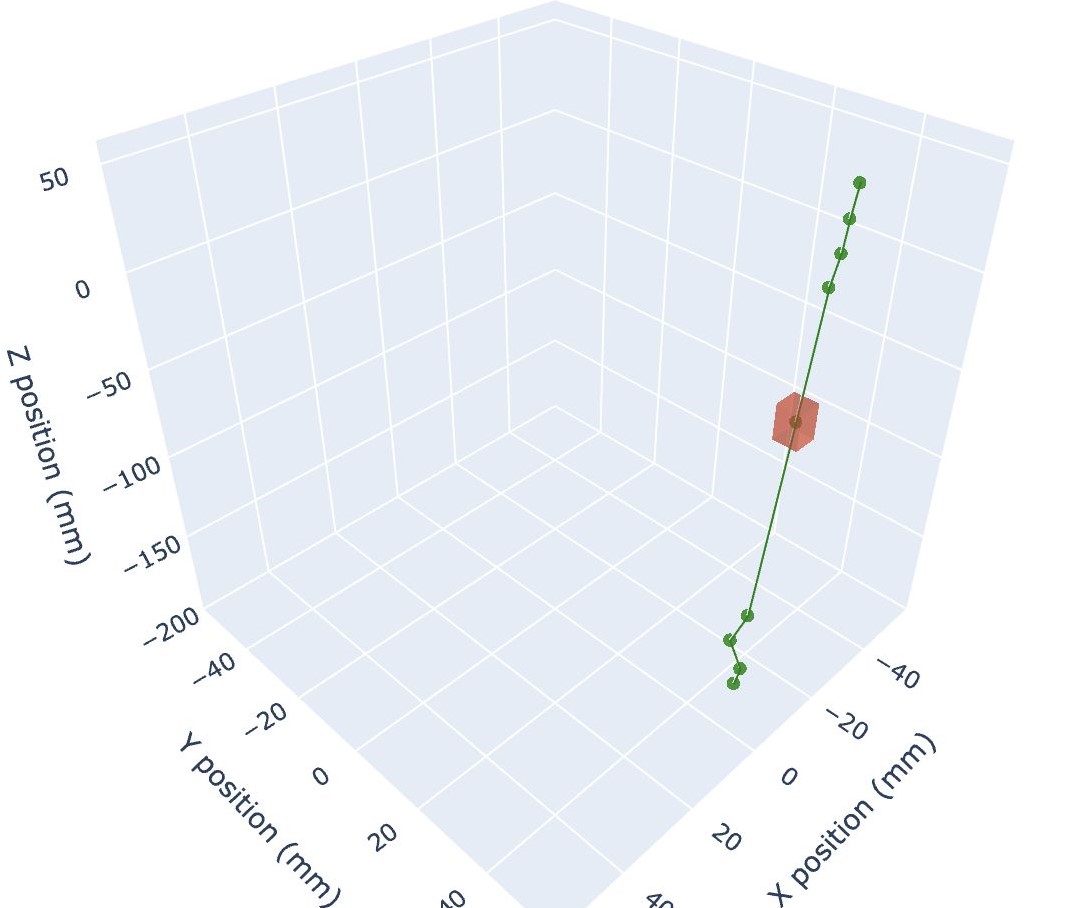
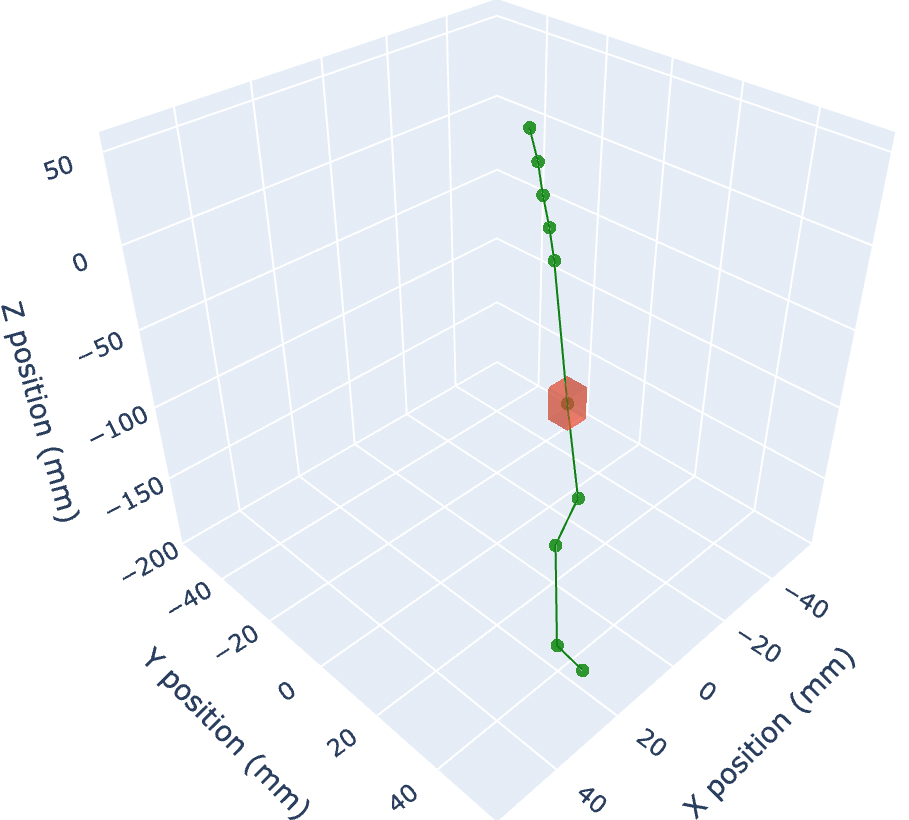
When the Tracker was incorporated, cosmic rays presented a convenient tool to validate its integration [26]. Muons are an attractive source in which to verify the coincident triggering mechanism and the geometry of the system due to their greater mass and electric charge. They are therefore very penetrating and travel in straight lines. Fig. 11 plots two different muon tracks traversing ComPair. In the plot, the positive Z represents the top of the instrument, where the Tracker is located. The red box represents the error associated with the position reconstructed by the CZT. No error considerations or visual aids are added to the CsI calorimeter tracks.
The linear tracks indicate the coincidence logic that requires a trigger among all subsystems. Next, since the muons travel in a straight line, recording such a behavior is another indication that integration is successful.
3.3 Preliminary results from HIGS Beam Test 2022
In April 2022, a beam test of the prototype without the ACD was performed at Triangle Universities Nuclear Laboratory’s High Intensity Gamma-ray Source (HIGS) facility, which delivers monoenergetic gamma-ray beams. The energies studied include 2, 5, 7, 15, and 25 MeV. We present the preliminary results here.
Fig. 12 shows the experimental setup at the HIGS facility. During the runs, the implemented coincidence allows for full-system readout after any two subsystems have triggered. Fig. 13 presents the spectral responses to a monoenergetic beam for each subsystem and the summed energies across all subsystems, showing a full-energy peak at 2 MeV. Note that the results are preliminary as more advanced calibrations are currently under investigation.
To study the energy responses of the subsystem, Fig. 14 plots the bivariate nature of the energies deposited in the CsI and CZT calorimeters for (a) experimental and (b) simulated data. Several features are visible in both experiment and simulation, mainly the double escape peak in the CZT and an escaped annihilating photon detected in the CsI. In addition, small angle scatters in the CZT with a photo-absorption in the CsI region are clearly visible in both the experiment and simulation.

4 Future Work
Analysis of HIGS beam test is underway with more results expected in the future. Next, in fall of 2023, the system is slated to fly as a short-duration balloon experiment out of Fort Sumner, NM, hosted by NASA’s Columbia Scientific Balloon Facility (CSBP). The system is therefore undergoing design upgrades to a balloon flight-ready prototype. This includes upgrading the CZT housing to a hermetically sealed container to maintain appropriate high-voltage safety and ensure high performance. The upgrade also includes the integration of the ACD. Finally, each subsystem will undergo thermal-vacuum testing to characterize and study its performance. Fig. 15a presents the instrument’s block diagram with Fig. 15b presenting the notional balloon instrument.
4.1 Flight Computer
The ComPair DAQ computer is under development by the Los Alamos National Laboratory (LANL) and acts as the data acquisition CPU for the different subsystems. As the main controller, it will send appropriate commands to each subsystem and store data during the flight. Its architecture is based on a Versalogic BayCat single board computer.
During the balloon flight, the computer will supervise subsystem-specific long-running processes, manage data collection, control the power distribution unit and readout thermometry. The instrument will also connect to the CSBP miniature science instrument package to telemeter housekeeping and a subset of data during the flight.
4.2 Further Technology Development
Several technologies are currently in development for future observatories. The Tracker group is looking into implementing Si Pixel technology [27]. The CZT group is developing a digital system that can digitize the waveforms that yield better energy and position resolution. The CsI group is developing Dual-Gain SiPMs [28] to extend the dynamic range while maintaining energy linearity with high position and energy resolution. Also in development is a ‘finger’ array rather than a hodoscopic geometry which has vertical short chunks placed in an array and readout from the top and bottom, rather than the sides. This has the potential of delivering higher position resolution. Improvements to the image processing code, MEGALib, is being done by advancing pair reconstruction techniques and optimization for ComPair and AMEGO. This includes using single-site events to improve the detection and localization efficiency of gamma sources [29].
5 Conclusion
The ComPair instrument has been developed as a prototype for AMEGO to demonstrate its technological potential for a MeV gamma ray observatory. Each subsystem and the integrated system as a whole have undergone testing and verification. An augmentation to AMEGO, named AMEGO-X [11], which uses Silicon pixels and a CsI calorimeter, is currently proposed as a medium-explorer class instrument. The technology developed in ComPair directly supports AMEGO-X and the training of early career scientists in MeV gamma-ray instrument development.
Acknowledgements.
This work is supported under NASA Astrophysics Research and Analysis (APRA) grants NNH14ZDA001N-APRA, NNH15ZDA001N-APRA, NNH18ZDA001N-APRA, NNH21ZDA001N-APRA.References
- [1] Matz, S. M., Share, G. H., Leising, M. D., Chupp, E. L., Vestrandt, W. T., Purcell, W. R., Strickman, M. S., and Reppin, C., “Gamma-ray line emission from SN1987A,” Nature 331, 416–418 (Feb 1988).
- [2] Gehrels, N., Leventhal, M., and MacCallum, C. J., “Prospects for Gamma-Ray Line Observations of Individual Supernovae,” The Astrophysical Journal 322, 215 (Nov. 1987).
- [3] Abbott, B. P. et al., “Multi-messenger observations of a binary neutron star merger,” The Astrophysical Journal 848, L12 (oct 2017).
- [4] De Angelis, A. and Tothers, “Gamma-ray astrophysics in the MeV range,” Experimental Astronomy 51, 1225–1254 (Jun 2021).
- [5] McEnery, J. et al., “All-sky Medium Energy Gamma-ray Observatory: Exploring the Extreme Multimessenger Universe,” (2019).
- [6] Kierans, C. A., “AMEGO: exploring the extreme multi-messenger universe,” in [Space Telescopes and Instrumentation 2020: Ultraviolet to Gamma Ray ], den Herder, J.-W. A., Nakazawa, K., and Nikzad, S., eds., SPIE (dec 2020).
- [7] Tomsick, J. A., Boggs, S. E., Zoglauer, A., Wulf, E., Mitchell, L., Phlips, B., Sleator, C., Brandt, T., Shih, A., Roberts, J., Jean, P., von Ballmoos, P., Oliveros, J. M., Smale, A., Kierans, C., Hartmann, D., Leising, M., Ajello, M., Burns, E., Fryer, C., Saint-Hilaire, P., Malzac, J., Tavecchio, F., Fioretti, V., Bulgarelli, A., Ghirlanda, G., Chang, H.-K., Takahashi, T., Nakazawa, K., Matsumoto, S., Melia, T., Siegert, T., Lowell, A., Lazar, H., Beechert, J., and Gulick, H., “The Compton Spectrometer and Imager Project for MeV Astronomy,” (2021).
- [8] Buckley, J., Bergstrom, L., Binns, B., Buhler, J., Chen, W., Cherry, M., Funk, S., Hooper, D., Mitchell, J., Nolfo, G. D., Nussirat, S. A., Profumo, S., Rauch, B., Stern, D., Varner, G., Wakely, S., and Zink, A., “The Advanced Particle-astrophysics Telescope (APT),” Bulletin of the AAS 51 (sep 30 2019). https://baas.aas.org/pub/2020n7i078.
- [9] Takada, A., Takemura, T., Yoshikawa, K., Mizumura, Y., Ikeda, T., Nakamura, Y., Onozaka, K., Abe, M., Hamaguchi, K., Kubo, H., Kurosawa, S., Miuchi, K., Saito, K., Sawano, T., and Tanimori, T., “First Observation of the MeV Gamma-Ray Universe with Bijective Imaging Spectroscopy Using the Electron-tracking Compton Telescope on Board SMILE-2+,” The Astrophysical Journal 930 (2022).
- [10] Caputo, R., Perkins, J., Racusin, J., Ajello, M., Kierans, C., Fleischhack, H., Negro, M., Zhang, H., Venters, T., Cannady, N., Bissaldi, E., Karwin, C., Lewis, T., Sheng, Y., Lien, A., Steinhebel, A., Shawhan, P., Baring, M., Martinez-Castellanos, I., Wadiasingh, Z., Woolf, R., Prescod-Weinstein, C., Kocevski, D., Razzaque, S., Tak, D., Suda, Y., Zoglauer, A., Howell, E., Mazziotta, M. N., Silva, R. C. d., Valverde, J., Wulf, E., Metcalfe, J., McEnery, J., and Neilson, N. K., “Amego-X Mission Overview,” Bulletin of the AAS 54 (apr 1 2022). https://baas.aas.org/pub/2022n3i404p03.
- [11] Fleischhack, H., “AMEGO-X: MeV gamma-ray Astronomy in the Multimessenger Era,” arXiv (2021).
- [12] Kanbach, G., Andritschke, R., Zoglauer, A., Ajello, M., McConnell, M., Macri, J., Ryan, J., Bloser, P., Hunter, S., DiCocco, G., Kurfess, J., and Reglero, V., “Development and calibration of the tracking compton/pair telescope mega,” Nuclear Instruments and Methods in Physics Research Section A: Accelerators, Spectrometers, Detectors and Associated Equipment 541(1), 310–322 (2005). Development and Application of Semiconductor Tracking Detectors.
- [13] Griffin, S., “Development of a Silicon Tracker for the All-sky Medium Energy Gamma-ray Observatory Prototype,” in [2018 IEEE Nuclear Science Symposium and Medical Imaging Conference Proceedings (NSS/MIC) ], 1–5 (2018).
- [14] “Vata460.3 ideas.” https://ideas.no/products/vata460-3/ (2022).
- [15] Griffin, S., Kierans, C., Parker, L., Schoenwald, A., Shawhan, P., Caputo, R., McEnery, J., and Perkins, J., “Current status of the ComPair silicon tracker,” in [Space Telescopes and Instrumentation 2020: Ultraviolet to Gamma Ray ], den Herder, J.-W. A., Nikzad, S., and Nakazawa, K., eds., 11444, 547 – 555, International Society for Optics and Photonics, SPIE (2020).
- [16] Bolotnikov, A. E., Abdul-Jabbar, N. M., Babalola, S., Camarda, G. S., Cui, Y., Hossain, A., Jackson, E., Jackson, H., James, J. R., Luryi, A. L., and James, R. B., “Optimization of virtual Frisch-grid CdZnTe detector designs for imaging and spectroscopy of gamma rays,” in [Hard X-Ray and Gamma-Ray Detector Physics IX ], James, R. B., Burger, A., and Franks, L. A., eds., 6706, 27 – 40, International Society for Optics and Photonics, SPIE (2007).
- [17] Hays, E. A., Bolotnikov, A., Kierans, C., Moiseev, A., and Thompson, D., “Modular Position-sensitive High-resolution Calorimeter for Use in Space Gamma-ray Instruments Based on Virtual Frisch-grid CdZnTe Detectors,” PoS ICRC2019, 584 (2020).
- [18] He, Z., “Review of the Shockley–Ramo theorem and its application in semiconductor gamma-ray detectors,” Nuclear Instruments and Methods in Physics Research Section A: Accelerators, Spectrometers, Detectors and Associated Equipment 463(1), 250–267 (2001).
- [19] Bolotnikov, A., Camarda, G., Geronimo, G. D., Fried, J., Hodges, D., Hossain, A., Kim, K., Mahler, G., Giraldo, L. O., Vernon, E., Yang, G., and James, R., “A 4×4 array module of position-sensitive virtual Frisch-grid CdZnTe detectors for gamma-ray imaging spectrometers,” Nuclear Instruments and Methods in Physics Research Section A: Accelerators, Spectrometers, Detectors and Associated Equipment 954, 161036 (2020). Symposium on Radiation Measurements and Applications XVII.
- [20] Vernon, E., De Geronimo, G., Bolotnikov, A., Stanacevic, M., Fried, J., Giraldo, L. O., Smith, G., Wolniewicz, K., Ackley, K., Salwen, C., Triolo, J., Pinelli, D., and Luong, K., “Front-end ASIC for spectroscopic readout of virtual Frisch-grid CZT bar sensors,” Nuclear Instruments and Methods in Physics Research Section A: Accelerators, Spectrometers, Detectors and Associated Equipment 940, 1–11 (2019).
- [21] Grove, J. E. and Johnson, W. N., “The calorimeter of the Fermi Large Area Telescope,” in [Space Telescopes and Instrumentation 2010: Ultraviolet to Gamma Ray ], Arnaud, M., Murray, S. S., and Takahashi, T., eds., 7732, 138 – 148, International Society for Optics and Photonics, SPIE (2010).
- [22] Woolf, R. S., Grove, J. E., Phlips, B. F., and Wulf, E. A., “Development of a CsI:Tl calorimeter subsystem for the All-Sky Medium-Energy Gamma-Ray Observatory (AMEGO),” in [2018 IEEE Nuclear Science Symposium and Medical Imaging Conference Proceedings (NSS/MIC) ], 1–6 (2018).
- [23] “Rosspad.” https://ideas.no/products/rosspad/ (2022).
- [24] Meier, D., Ackermann, J., Olsen, A., Berge, H. K. O., Hasanbegovic, A., Altan, M. A., Azman, S., Najafiuchevler, B., Talebi, J., Påhlsson, P., Steenari, D., Fredriksen, A., Øya, P., Johansen, T. M., Gheorghe, C., Stein, T. A., and Maehlum, G. E., “SIPHRA 16-Channel Silicon Photomultiplier Readout ASIC,” (2016).
- [25] Sasaki, M., “Trigger system for the ComPair instrument,” in [Space Telescopes and Instrumentation 2020: Ultraviolet to Gamma Ray ], den Herder, J.-W. A., Nikzad, S., and Nakazawa, K., eds., 11444, 1023 – 1028, International Society for Optics and Photonics, SPIE (2020).
- [26] Thompson, D., Godfrey, G., Williams, S., Grove, J., Mizuno, T., Sadrozinski, H.-W., Kamae, T., Ampe, J., Briber, S., Dann, J., Silva, E., Dubois, R., Fukazawa, Y., Giebels, B., Haller, G., Handa, T., Hartman, R., Hirano, K., Hirayama, M., and Wood, D., “Gamma-ray Large-Area Space Telescope (GLAST) balloon flight engineering model: Overview,” Nuclear Science, IEEE Transactions on 49, 1898 – 1903 (09 2002).
- [27] Brewer, I., Negro, M., Striebig, N., Kierans, C., Caputo, R., Leys, R., Peric, I., Fleischhack, H., Metcalfe, J., and Perkins, J., “Developing the future of gamma-ray astrophysics with monolithic silicon pixels,” Nuclear Instruments and Methods in Physics Research Section A: Accelerators, Spectrometers, Detectors and Associated Equipment 1019, 165795 (2021).
- [28] Shy, D., Woolf, R., Grove, E., Phlips, B., Hutcheson, A., Mitchell, L., and Wulf, E., “Development of Dual-Gain SiPMs to Mitigate Non-Linearity,” IEEE Nuclear Science Symposium (NSS), Medical Imaging Conference (MIC) and Room Temperature Semiconductor Detector (RTSD) Conference (2021).
- [29] Martinez-Castellanos, I., Fleischhack, H., Karwin, C., Negro, M., Tak, D., Lien, A., Kierans, C. A., Wadiasingh, Z., Fukazawa, Y., Ajello, M., Baring, M. G., Burns, E., Caputo, R., Hartmann, D. H., Perkins, J. S., Racusin, J. L., and Sheng, Y., “Improving the low-energy transient sensitivity of AMEGO-X using single-site events,” (2021).