SND@LHC: The Scattering and Neutrino Detector at the LHC
Abstract
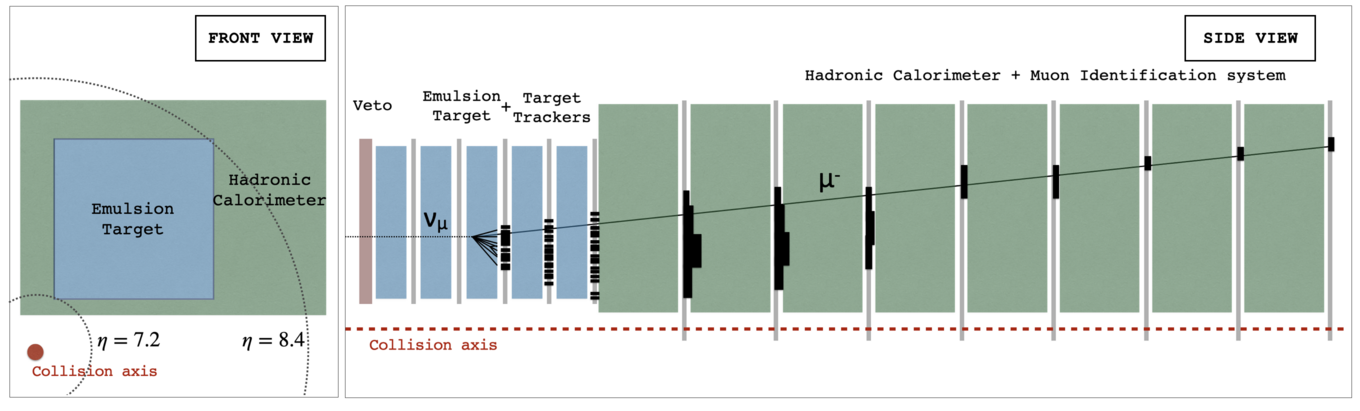
SND@LHC is a compact and stand-alone experiment designed to perform measurements with neutrinos produced at the LHC in the pseudo-rapidity region of . The experiment is located downstream of the ATLAS interaction point, in the TI18 tunnel. The detector is composed of a hybrid system based on an target made of tungsten plates, interleaved with emulsion and electronic trackers, also acting as an electromagnetic calorimeter, and followed by a hadronic calorimeter and a muon identification system. The detector is able to distinguish interactions of all three neutrino flavours, which allows probing the physics of heavy flavour production at the LHC in the very forward region. This region is of particular interest for future circular colliders and for very high energy astrophysical neutrino experiments. The detector is also able to search for the scattering of Feebly Interacting Particles. In its first phase, the detector is ready to operate throughout LHC Run 3 and collect a total of .
1 Introduction
1.1 Overview
SND@LHC is a compact experiment proposed to exploit the high flux of energetic neutrinos of all flavours from the LHC [1, 2]. It is located slightly off-axis, covering the unexplored pseudo-rapidity () range from to , in which a large fraction of neutrinos originate from charmed-hadrons decays. Thus, neutrinos can probe heavy-flavour production in a region that is not accessible to other large LHC experiments, which are designed to study high- physics at <5.
Together with the FASER [3] experiment, SND@LHC will make the first observations of neutrinos produced by a collider, in an energy range which was inaccessible at accelerators so far. SND@LHC is also sensitive to Feebly Interacting Particles (FIPs) through scattering off nuclei and electrons in the detector target. The direct-search strategy gives the experiment sensitivity in a region of the FIP mass-coupling parameter space that is complementary to other indirect searches [4].
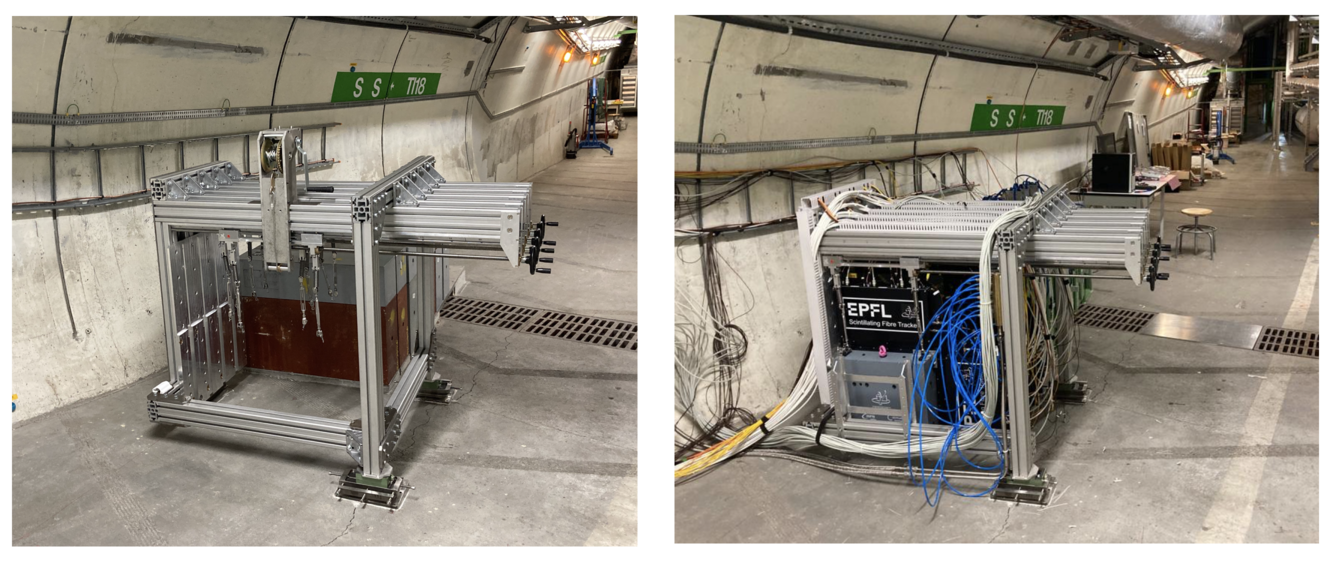
In order to shield the detector from most of the charged particles produced in the LHC collisions, SND@LHC is located in the TI18 tunnel, about downstream of the ATLAS interaction point (IP1). Charged-lepton identification and the measurement of the neutrino energy are essential to distinguish among the three flavours in neutrino charged-current interactions and to identify and study the corresponding neutrino production process. These features were the main drivers in the design of the SND@LHC apparatus, that had also to account for geometrical constraints of the selected location. The detector was installed in TI18 in 2021 during the Long Shutdown 2 and it has started to collect data since the beginning of the LHC Run 3 in April 2022. The SND@LHC experiment will run throughout the whole Run 3 and it is expected to collect of data in 2022–25, corresponding to two thousands high-energy neutrino interactions of all flavours in the detector target.
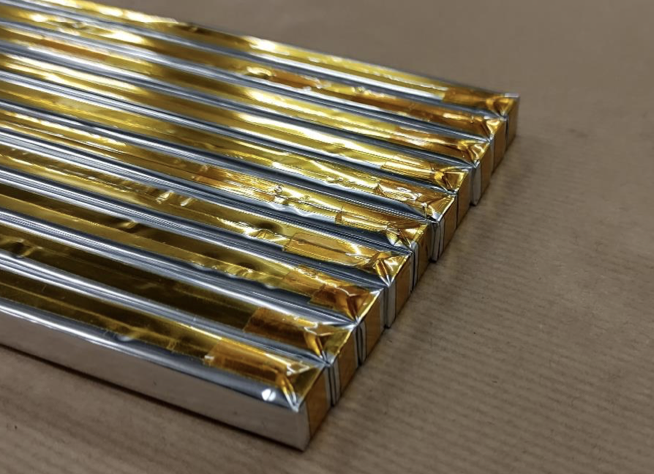
The SND@LHC detector is composed of several parts (see Figure 1). The veto system tags events with charged particles entering the detector from the front. It is followed by the emulsion target, which acts as a vertex detector, and the target trackers that provide the timestamp to the events reconstructed in the emulsions. The combination of the emulsion target and the target tracker also acts as an electromagnetic calorimeter. A shielding surrounding the target has been put in place to absorb low-energy neutrons and as a thermal insulation chamber. The target system is followed by a hadronic calorimeter and a muon identification system.
The detector concept and the physics goals of the SND@LHC experiment have been described in the Technical Proposal [2]. This document details the detector layout, construction and installation phases. Sections 2 to 5 describe the sub-systems of the detector. Section 6 describes the data acquisition and online systems, while Section 7 discusses the offline software and simulation framework. Sections 8 and 9 give details about the commissioning and installation of the detector. Finally, in Section 10 we give some ideas about a possible upgrade of the detector.
1.2 The physics case
Neutrinos allow for precise tests of the Standard Model (SM) [5, 6, 7, 8]. They are a probe for new physics [9, 10] and provide a unique view of the Universe [11]. The neutrino-nucleon cross section region between 350 GeV and 10 TeV is currently unexplored [12, 13]. Indeed, measurements of neutrino interactions in the last decades were mainly performed at low energies for neutrino oscillation studies.
Neutrinos in interactions at the CERN LHC arise promptly from leptonic and decays, and and decays. They are subsequently also produced in the decays of pions and kaons.
The use of LHC as a neutrino factory was first envisaged about 30 years ago [14, 15, 16], in particular for the then undiscovered [17]. The idea suggested a detector intercepting the very forward flux () of neutrinos (about have flavour) from and decays. Recently, it was pointed out [18] that at larger angles () leptonic and decays also provide an additional contribution to the neutrino flux, of which one third has flavour. The role of an off-axis setup has been emphasised in a recent paper [19].
Today, two factors make it possible and particularly interesting to add a compact neutrino detector at the LHC. The high intensity of collisions achieved by the machine turns into a large expected neutrino flux in the forward direction [1], and the high neutrino energies imply relatively large neutrino cross-sections. As a result, even a detector with a relatively modest size to fit into one of the existing underground areas close to the LHC tunnel has significant physics potential. Machine-induced backgrounds decrease rapidly while moving along and away from the beam line.
A detailed study of a possible underground location for a neutrino detector was conducted in 2018 [1], during the LHC Run 2. Four locations were considered for hosting a possible neutrino detector: the CMS quadrupole region ( from the CMS Interaction Point (IP5)), UJ53 and UJ57 (nd from IP5), RR53 and RR57 ( from IP5), TI18 ( from IP1). The potential sites were studied on the basis of expected neutrino rates, flavour composition and energy spectrum, predicted backgrounds, and in-situ measurements performed with a nuclear emulsion detector and radiation monitors. TI18 emerged as the most favourable location. Assuming a luminosity of in the LHC Run 3, a detector with a mass of located in TI18 can observe and study about two thousand high-energy neutrino interactions of all flavours.
The main physics goals of the SND@LHC experiment are summarised in the following sections.
Neutrino physics
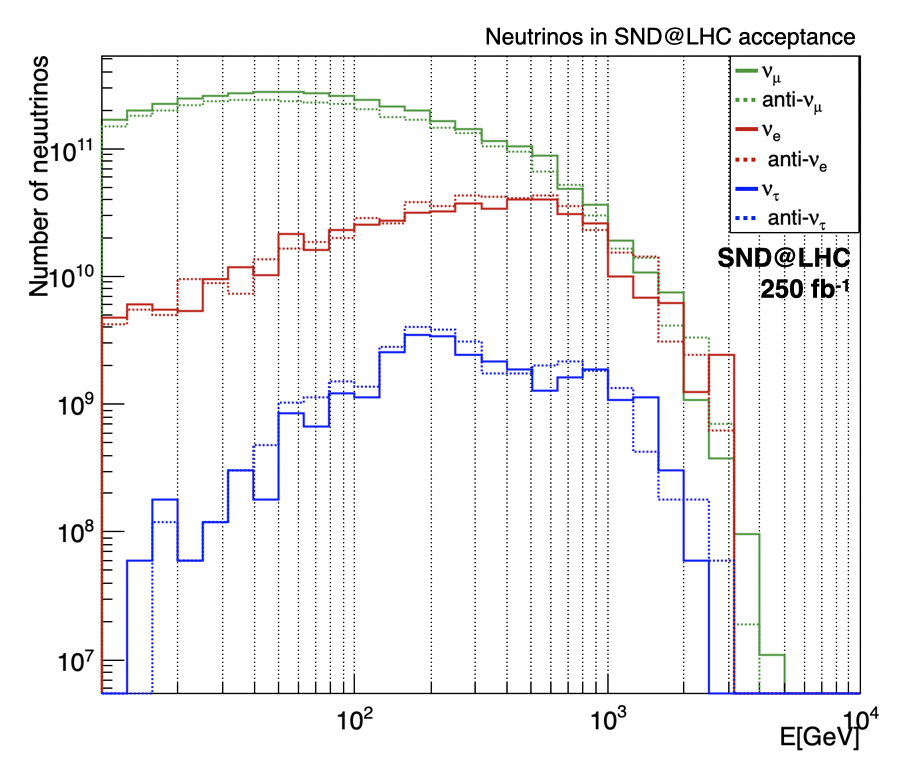
Figure 2 shows the energy spectrum of incoming neutrinos and anti-neutrinos in the pseudo-rapidity range covered by the SND@LHC detector, , normalised to . Neutrino production in proton-proton collisions at the LHC is simulated with the FLUKA Monte Carlo code [20, 21]. DPMJET3 (Dual Parton Model, including charm) [22, 23] is used for the event generation, and FLUKA performs the particle propagation towards the SND@LHC detector with the help of the FLUKA model of the LHC accelerator [24].
FLUKA also takes care of simulating the production of neutrinos from decays of long-lived products of the collisions and of particles produced in re-interactions with the surrounding material. Genie [25] is then used to simulate neutrino interactions with the SND@LHC detector material. About 1700 charged-current (CC) and 550 neutral current (NC) neutrino interactions are expected in the target volume, mainly from muon neutrinos (72%) and electron neutrinos (23%).
In the explored range, electron neutrinos and anti-neutrinos are predominantly produced by charmed-hadron decays. Therefore, if one assumes that the deep-inelastic charged-current cross-section of the electron neutrino follows the SM prediction, as also supported by the HERA results in their SM interpretation [26, 27], electron neutrinos can be used as a probe of the production of charm. Taking into account uncertainties in the correlation between the yield of charmed hadrons in a given region with the neutrinos in the measured region, it was evaluated that the measurement of the charmed-hadron production in collision can be done with a statistical uncertainty of about , while the leading contribution to the uncertainty is the systematic error of [2].
Furthermore, the measurement of the charmed hadrons can be translated into a measurement of the corresponding open charm production in the same rapidity window, given the linear correlation between the parent charm quark and the hadron. The dominant partonic process for associated charm production at the LHC is the scattering of two gluons producing a pair [28]. The average lowest momentum fraction () of interacting gluons probed by SND@LHC is around . The extraction of the gluon PDF at such low values of , where it is completely unknown, could provide valuable information for future experiments probing the same low range, such as FCC [29]. It can also reduce uncertainties on the flux of very-high-energy (PeV scale) atmospheric neutrinos produced in charm decays, essential for the evidence of neutrinos from astrophysical sources [30, 31].
Since the three neutrino flavours can be identified, the lepton flavour universality can be tested in the neutrino sector by measuring the ratio of / and / interactions. Both and are mainly produced by semi-leptonic and fully leptonic decays of charmed hadrons. Unlike s that are produced almost only in decays, s are produced in the decay of all ground-state charmed hadrons, essentially , , and . Therefore, the ratio depends only on the charm hadronisation fractions and decay branching ratios. The systematic uncertainties due to the charm-quark production mechanism cancel out, and the ratio becomes sensitive to the -nucleon interaction cross-section ratio of the two neutrino species, which is affected by the uncertainty on hadronisation processes. The estimate of the branching ratios has a systematic uncertainty of about 22% while the statistical uncertainty is dominated by the low statistics of the sample, which corresponds to a 30% accuracy.
The situation is rather different for s when compared to s. The s are much more abundant but heavily contaminated by and decays, and therefore the production mechanism cannot be considered the same as in the case of . However, this contamination is mostly concentrating at low energies. Above , the contamination is predicted to be reduced to about 35%, and stable with the energy. Moreover, charmed-hadrons decays have practically equal branching ratios into electron and muon neutrinos. Therefore the ratio is not affected by the systematic uncertainties in the weighted branching fractions, but rather by uncertainties due to and production in this range and to their propagation through the machine elements along the beamline, that can be assessed thanks to the available measurements used to constrain the simulation. The ratio provides a test of the lepton flavour universality with an uncertainty of 15%, with an equal 10% statistical and systematic contribution.
SND@LHC plans to measure the ratio between charged-current (CC) and neutral-current (NC) interactions as an internal consistency test. Indeed, by summing over neutrinos and anti-neutrinos, the ratio between NC and CC deep-inelastic interaction cross-sections at a given energy can be written as a simple function of the Weinberg angle, with a correction factor accounting for the non-isoscalarity of the target [32]. In the approximation that the differential and fluxes, as a function of their energy, are equal, the same formula also applies to the observed interactions since the convolution with the flux would bring the same factor everywhere, that then cancels out in the ratio. The statistical uncertainty on the NC/CC ratio for observed events is expected to be lower than while the systematic uncertainty on the unfolded ratio amounts to about [2].
Feebly Interacting Particles
The SND@LHC experiment is also capable of performing model-independent direct searches for FIPs. The background from neutrino interactions can be rejected by making a time-of-flight (TOF) measurement. With a time resolution of ps, it will be possible to disentangle the scattering of massive FIPs and neutrinos, with a significance that depends on the particle mass [2]. The hybrid nature of the apparatus, which combines emulsion trackers and electronic detectors, makes it possible to disentangle the scattering of massive FIPs and neutrinos, with a significance that depends on the particle mass.
FIPs may be produced in the scattering at the LHC interaction point, propagate to the detector and decay or scatter inside it. A recent work [33] summarises SND@LHC sensitivity to physics beyond the Standard Model considering the scatterings of light dark matter particles via leptophobic mediator, as well as decays of Heavy Neutral Leptons, dark scalars and dark photons. The elastic scattering was considered, showing an excess of neutrino-like elastic scatterings over the SM yield due to the process. The excellent spatial resolution of nuclear emulsions and the muon identification system makes SND@LHC also suited to search for the decay of neutral mediators decaying in two charged particles.
1.3 Detector layout
The detector layout was developed to allow for the identification of the three neutrino flavours and the direct search for FIPs.
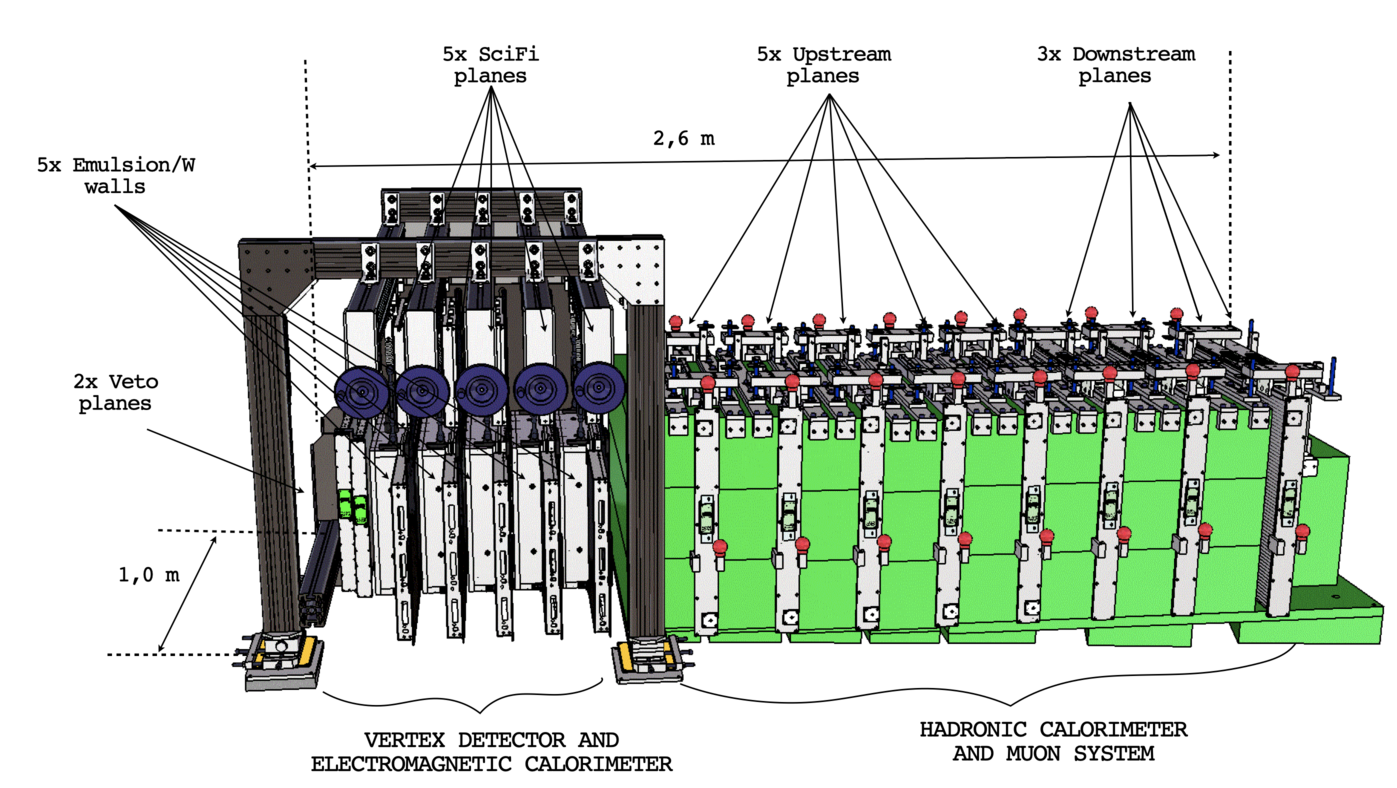
The layout of the detector, with the exclusion of the neutron shield, is shown in Figure 3. The apparatus is composed of a target region followed downstream by a hadronic calorimeter and a muon identification system. Upstream of the target region, two planes of scintillator bars act as a veto for charged particles, mostly muons coming from IP1. The target region, with a mass of about , is instrumented with five walls of Emulsion Cloud Chambers (ECC) [34], each followed by a Scintillating Fibre (SciFi) plane The ECC technology alternates emulsion films, acting as tracking devices with micrometric accuracy, with passive material acting as the neutrino target. Tungsten is used as a passive material to maximize the mass within the available volume. The SciFi planes provide the timestamp for the reconstructed events and have an appropriate time resolution for the time-of-flight measurements of particles from IP1. The combination of the emulsion target and the target tracker also acts as an electromagnetic calorimeter, with a total of 85 .
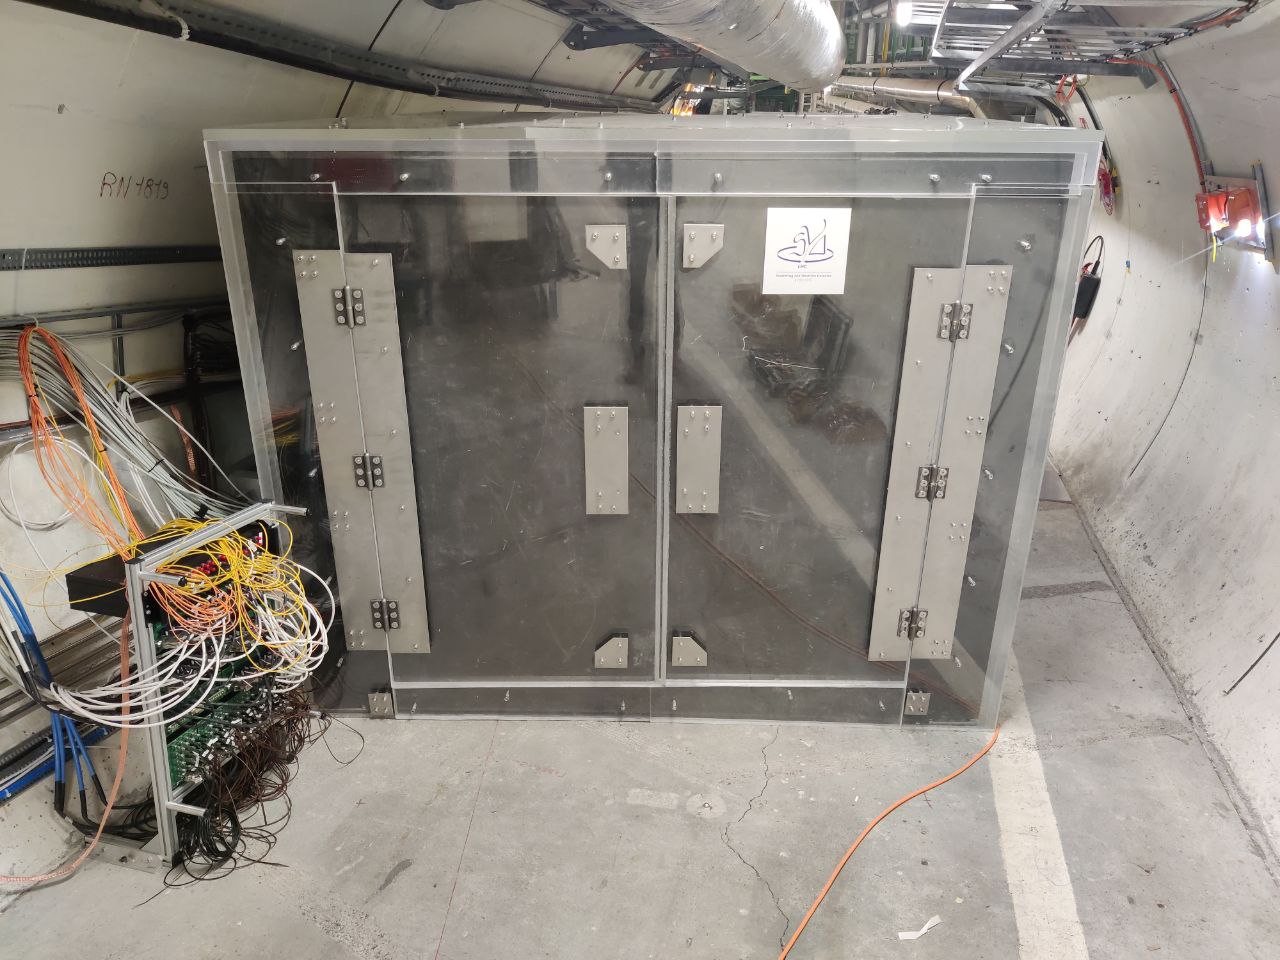
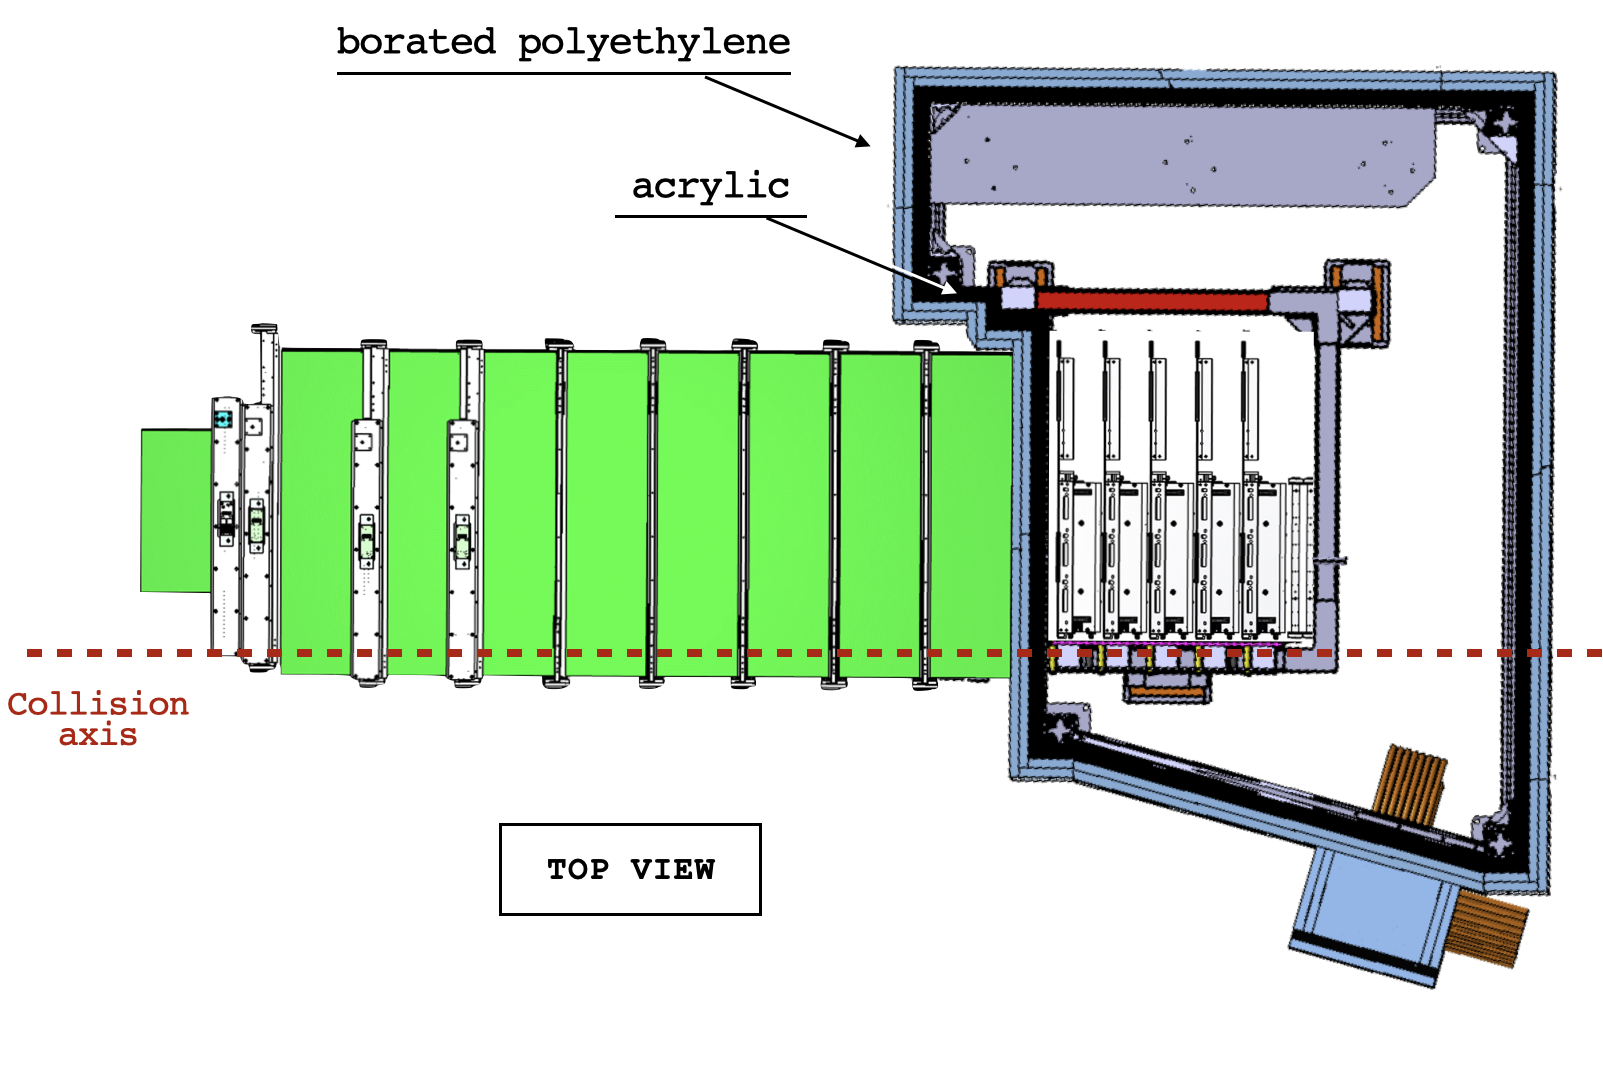
Veto, emulsion target and target tracker are contained in a 30% borated polyethylene and acrylic box which has the dual function of acting as a neutron shield from low energy neutrons and maintaining controlled temperature and humidity levels in order to guarantee optimal conditions for emulsion films.
The hadronic calorimeter and muon identification system are located downstream of the target and consist of eight -thick thick iron slabs (green) making up 9.5 interaction lengths in total, each followed by one or two planes of -thick scintillating bars.
The hadronic shower starts developing already in the target region, which adds on average 1.5 , for an average total length of 11 , thus providing a good coverage of the hadronic showers. The muon identification is mainly based on the last three planes of scintillator bars. These planes have double layers with narrower bars located both vertically and horizontally for higher granularity.
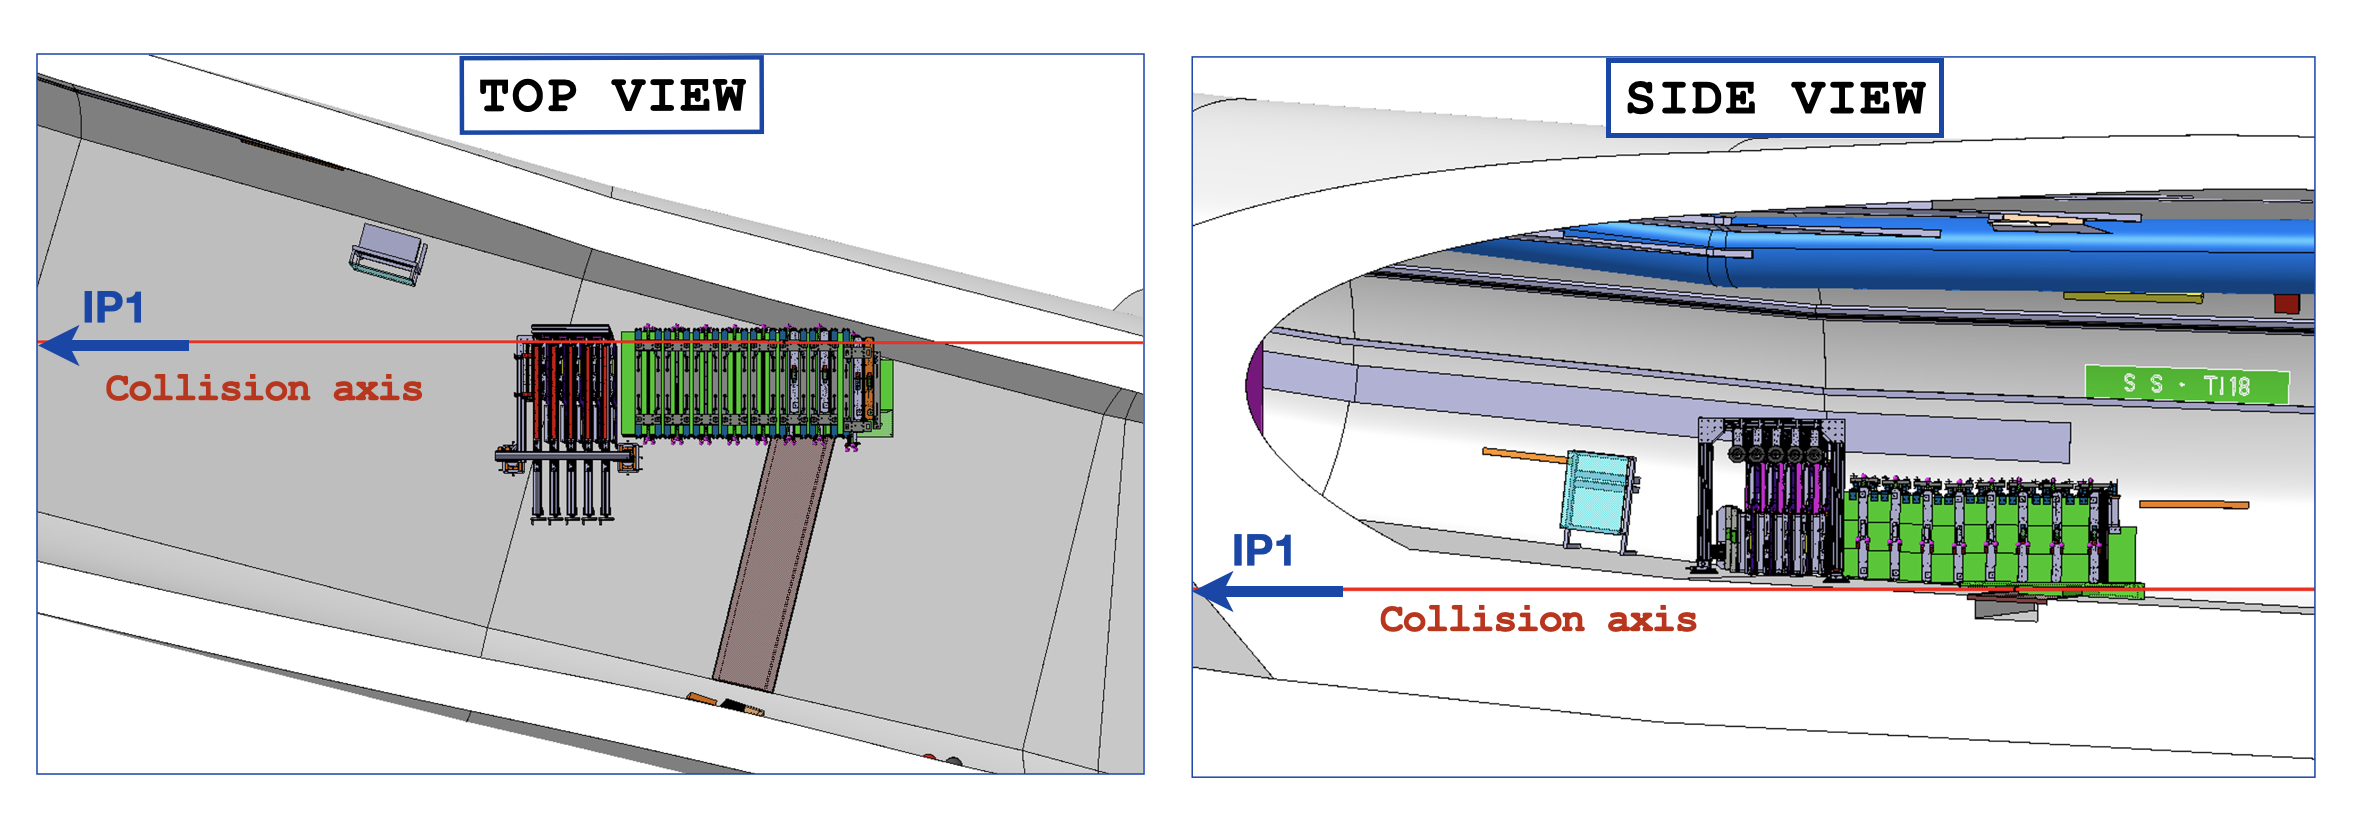
The detector, including the neutron shield described in Section 4.4, exploits all the available space in the TI18 tunnel to cover the desired range in pseudo-rapidity. Figure 4 shows the side and top views of the detector positioned inside the tunnel. The size of the tunnel, the tilted slope of the floor, as well as the distance of tunnel walls and floor from the nominal collision axis, imposed several constraints to the detector design since no civil engineering work could have been done in time for the operation in Run 3. The detector layout was therefore optimised in order to find the best compromise between geometrical constraints and the following physics requirements: a good calorimetric measurement of the energy requiring about 10 , a good muon identification efficiency requiring enough material to absorb hadrons, a transverse size of the target region having the desired azimuthal angular acceptance. The energy measurement and the muon identification set a constraint on the minimum length of the detector. With the constraints from the tunnel, this requirement competes with the azimuthal angular acceptance that determines the overall flux intercepted and therefore the total number of observed interactions. The geometrical constraints also restrict the detector to the first quadrant only around the nominal collision axis.
The identification of the neutrino flavour is done in charged current interactions by identifying the charged lepton produced at the primary vertex (see Section 7). Electrons will be clearly separated from neutral pions thanks to the micrometric accuracy and fine sampling of the Emulsion Cloud Chambers, which will enable photon conversions downstream of the neutrino interaction vertex to be identified. Muons will be identified by the electronic detectors as the most penetrating particles. Tau leptons will be identified topologically in the ECCs, through the observation of the tau decay vertex, together with the absence of any electron or muon at the primary vertex, following the technique developed by OPERA [35, 36].
FIPs will be identified through their scattering off electrons and nuclei of the emulsion target material. In the case of a FIP elastic scattering off atomic electrons, the experimental signature consists of an isolated recoil electron that can be identified through the development of an electromagnetic shower in the target region. For FIPs interacting elastically with a proton, instead, an isolated proton will produce a hadronic shower in the detector. In both cases the background can be reduced down to a negligible level by topological and kinematic selections. The timing information will be used to confirm any excess of events with the expected signature [2].
2 Veto system
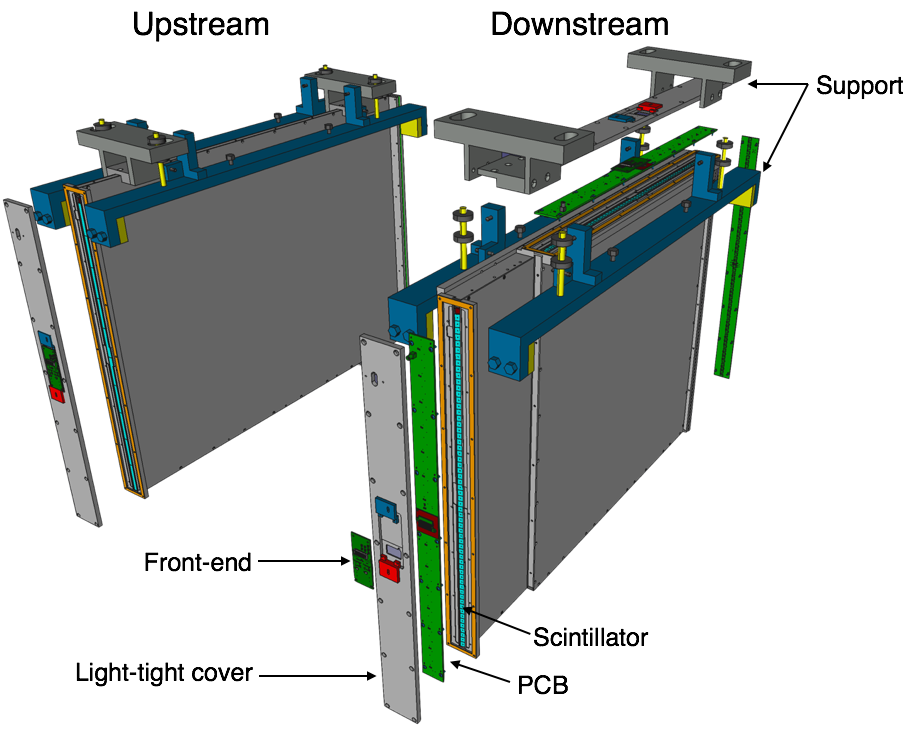
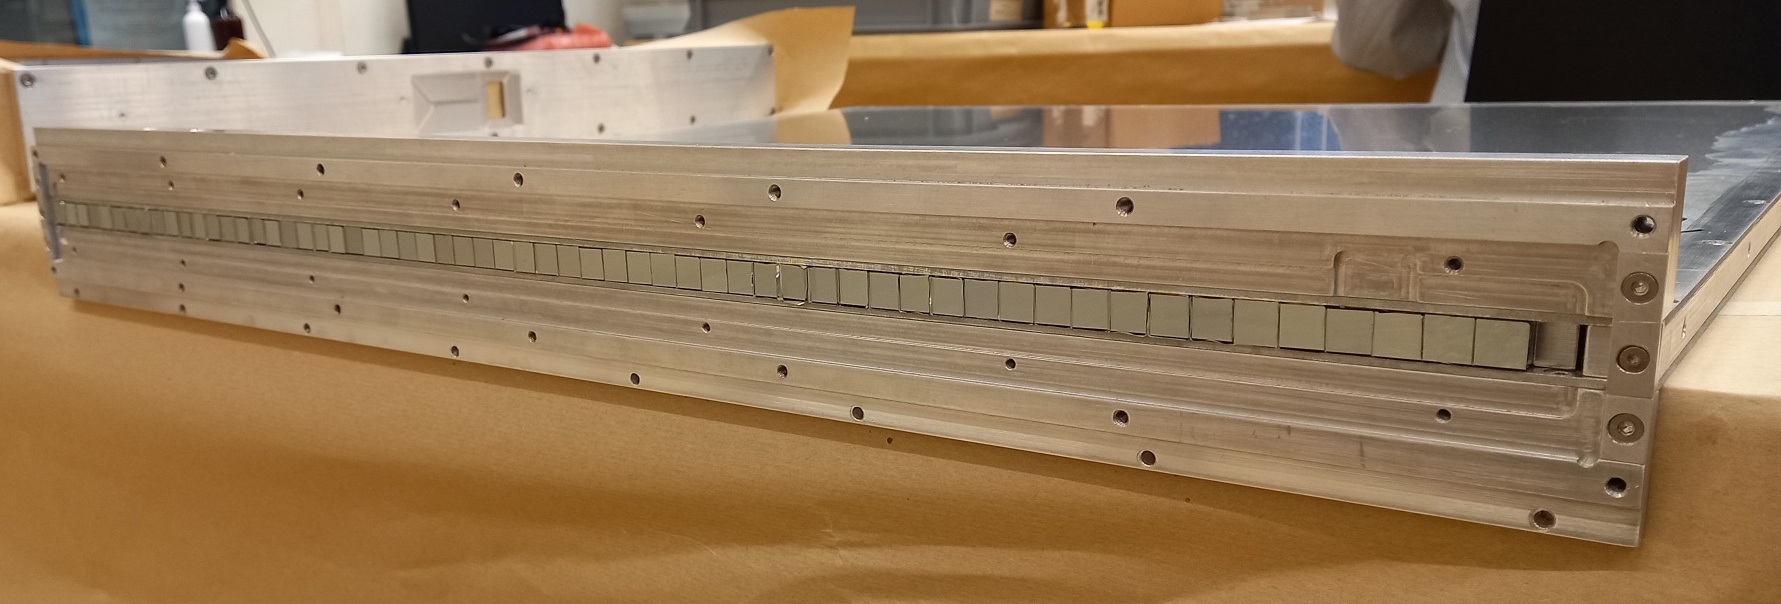
The veto system aims at rejecting charged particles entering the detector acceptance, mostly muons coming from IP1. It is located upstream of the target region and comprises two parallel planes, located apart, of stacked scintillating bars read out on both ends by silicon photomultipliers (SiPMs) as shown in Figure 5.
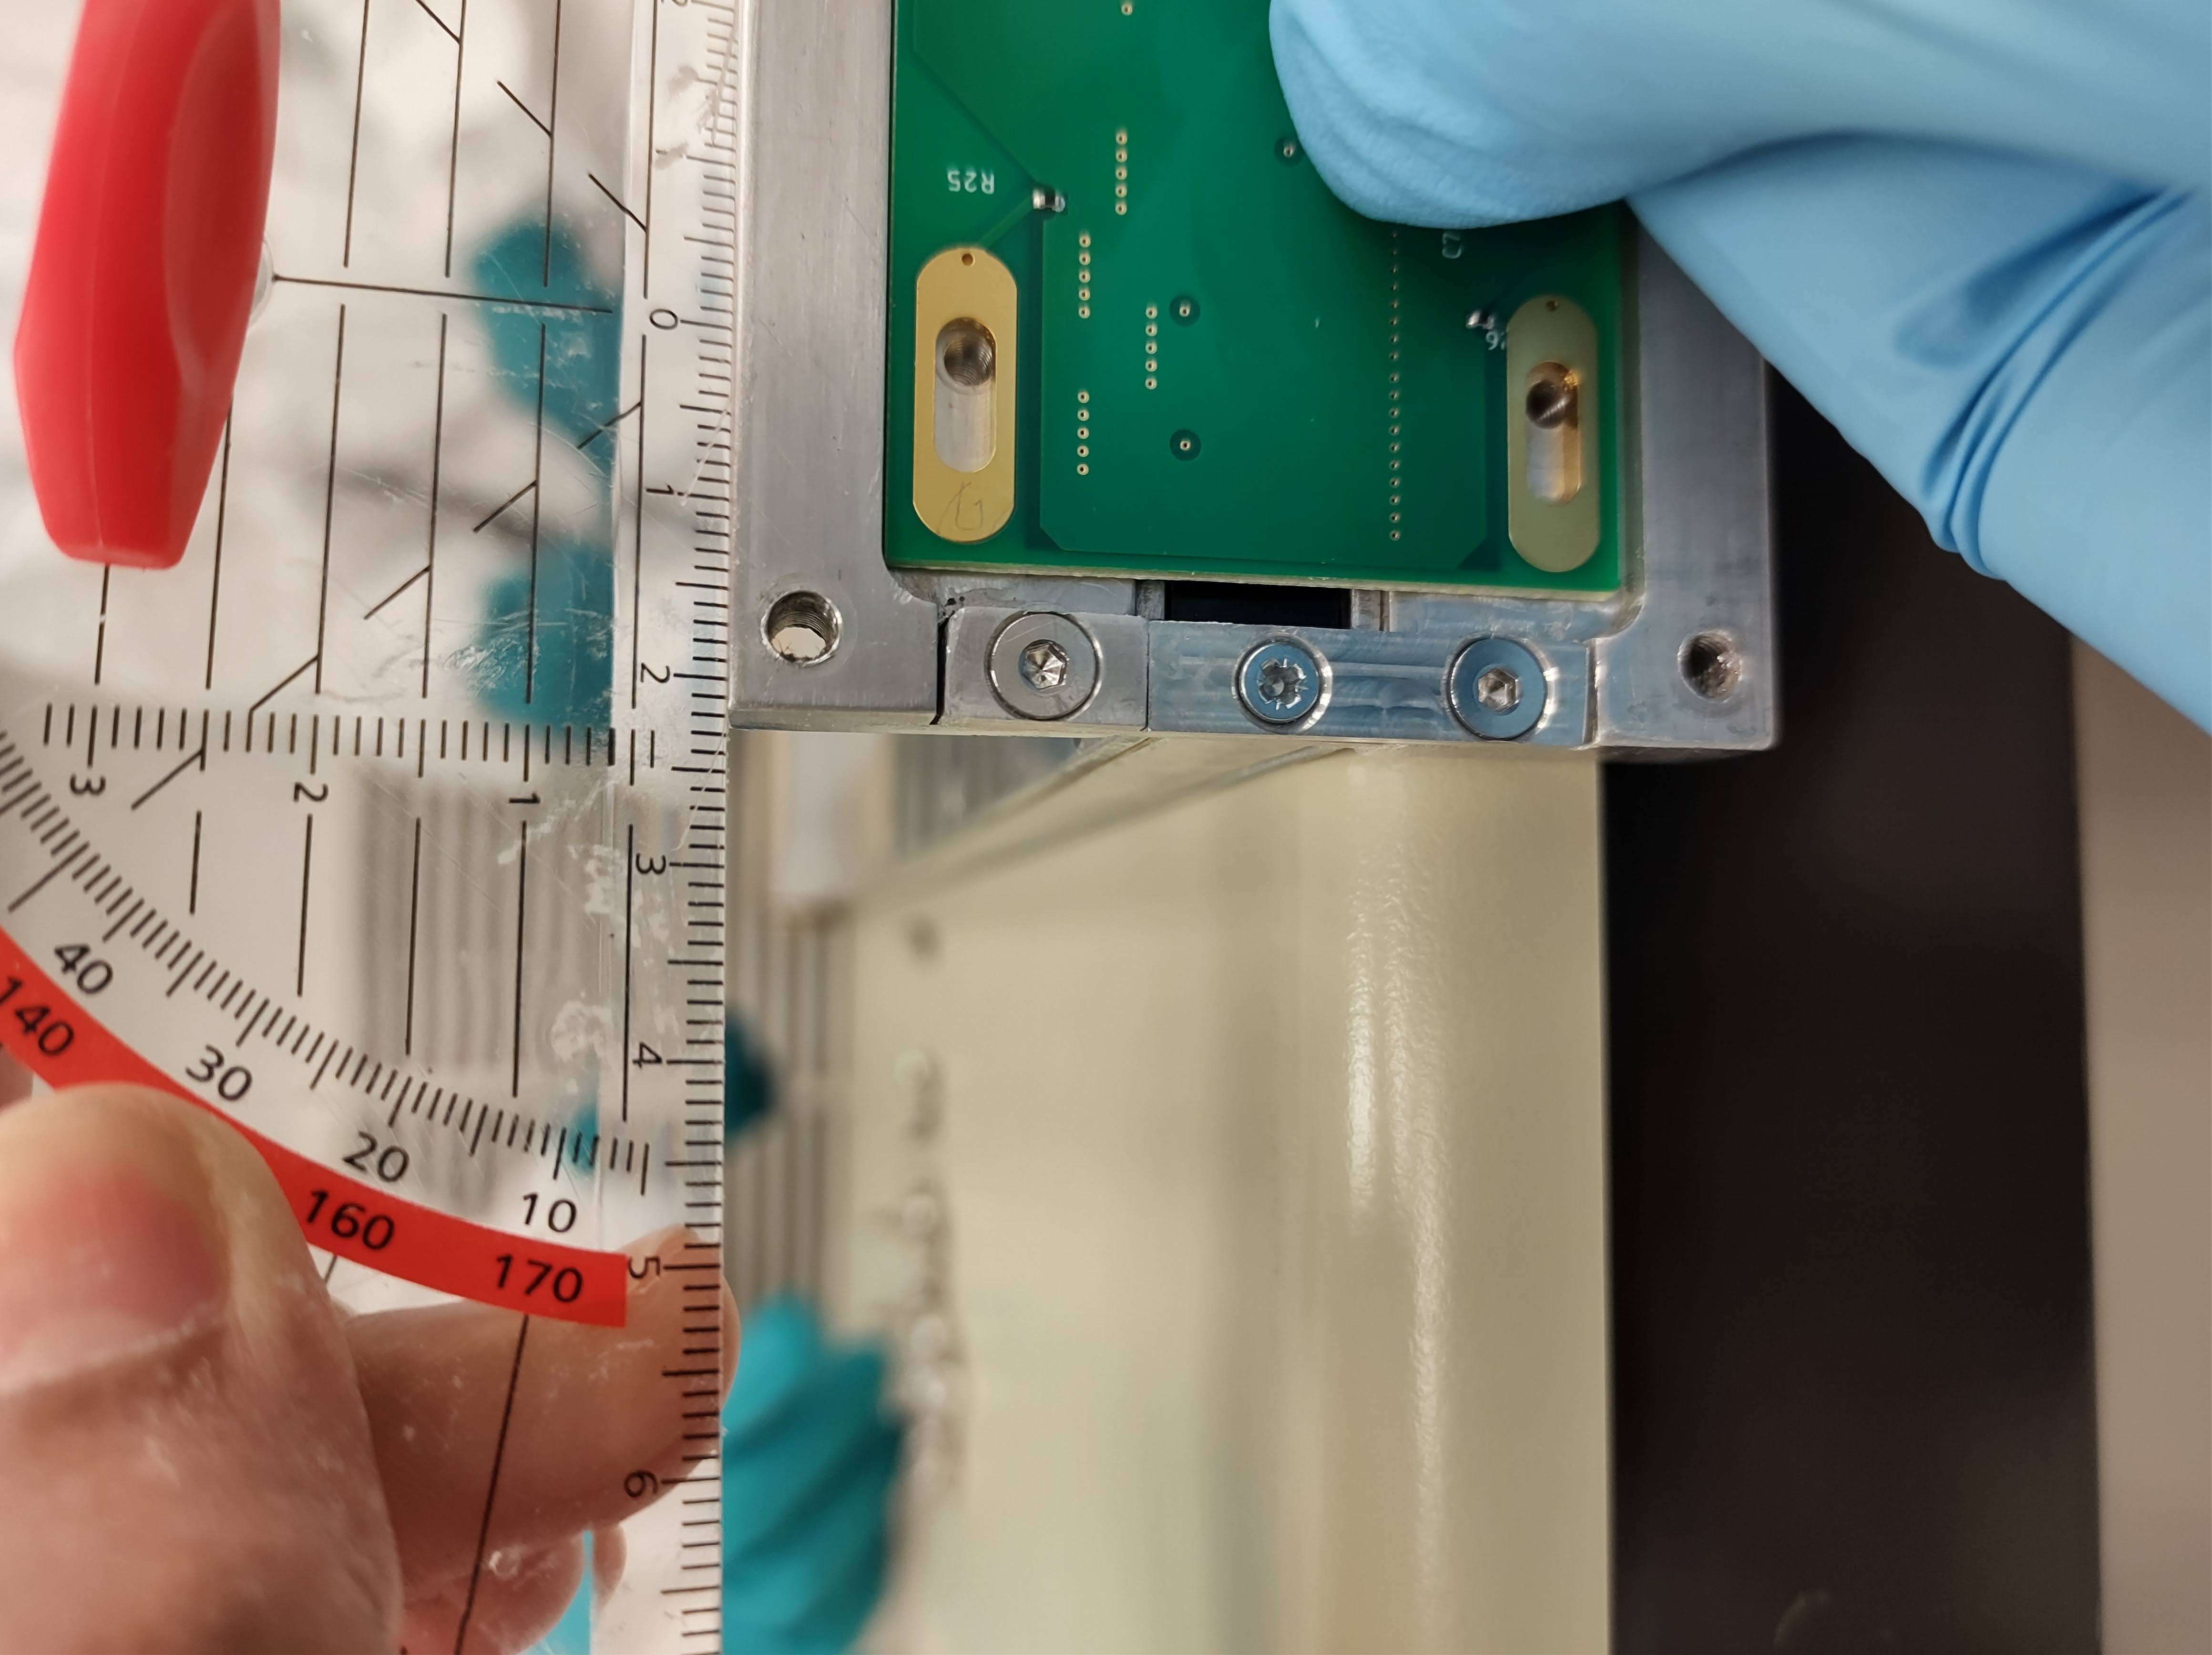
One plane consists of seven stacked bars of EJ-200 scintillator [37]. EJ-200 is found to have the right combination of light output, attenuation length () and fast timing (rise time of and decay time of ). The emission spectrum peaks at , closely matching the SiPMs spectral response. The number of photons generated by a minimum-ionising particle crossing scintillator is of the order of . Bars are wrapped in aluminized Mylar foil [38] to ensure opacity and isolate them from light in adjacent bars.


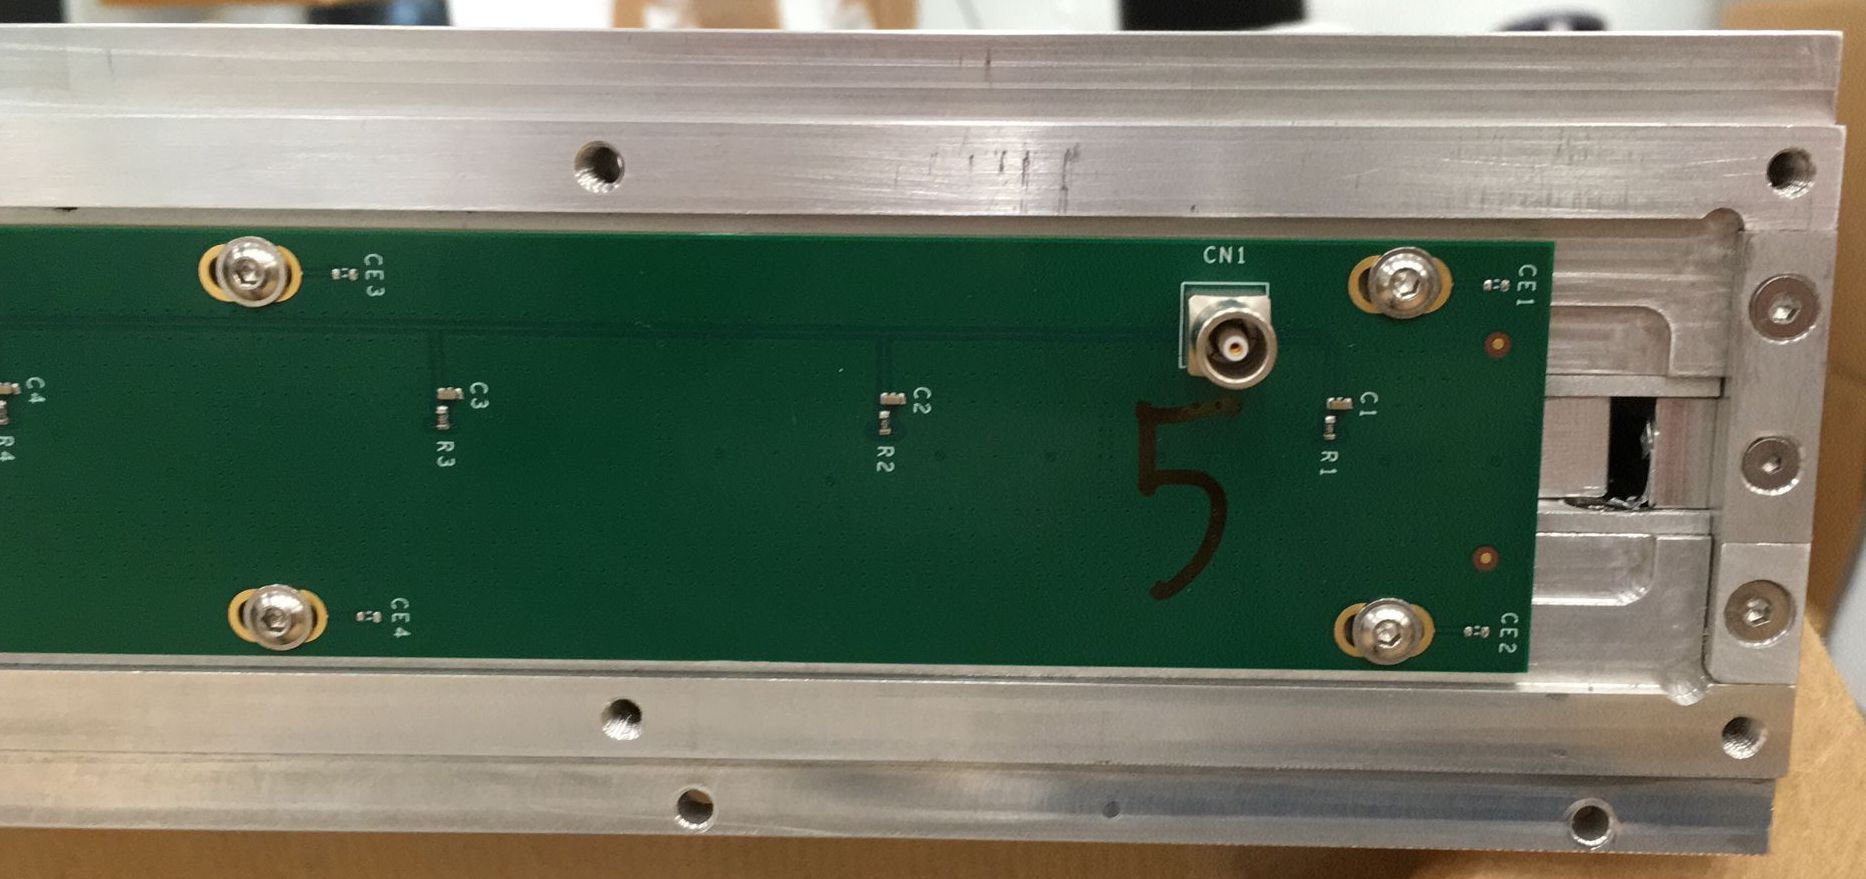
Each bar end is read out by eight Hamamatsu S14160-6050HS [39] ( wide, pixel size) SiPMs. The SiPMs are mounted on a custom built PCB, seen in Figure 6, that covers all seven bars on each end of a plane. A transparent silicone epoxy gel [40] fills the space of between the SiPMs and bars. Each individual SiPM signal is read out by a single channel of the front-end (FE) board, containing two TOFPET2 ASICs (described in Section 6.1.2). A DAQ board collects the digitized signals from four FE boards. A CAEN mainframe, described in Section 6.1, which is shared with the muon system, houses low voltage (LV) and high voltage (HV) CAEN power supplies. Details of the data acquisition (DAQ) system and of the boards are described in Section 6. The total number of channels per PCB is 56, totaling 224 channels for the entire veto system.
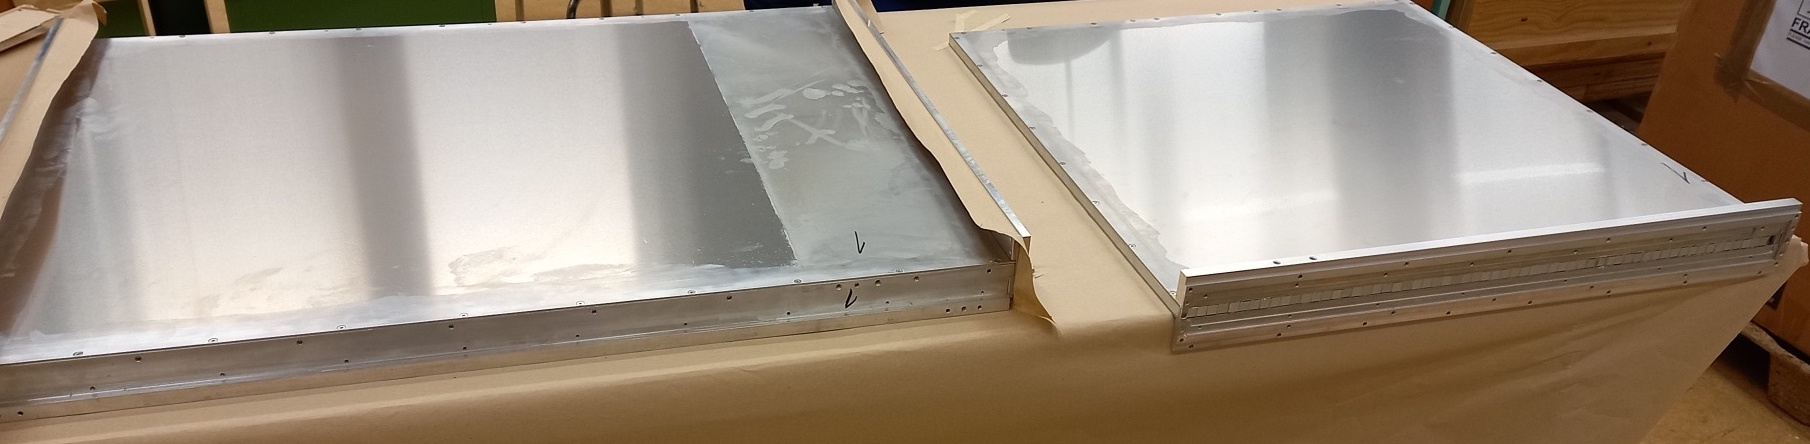
The stacked bars for each plane are housed in an aluminum frame, with thick walls. PCBs are mounted on wide rectangular flanges on both ends and act as end caps for the frame. An aluminum cover on each end is used to ensure light tightness and also acts as a heat sink for the FE board, which generates and is placed in a groove in the cover on the side opposite to the PCB.
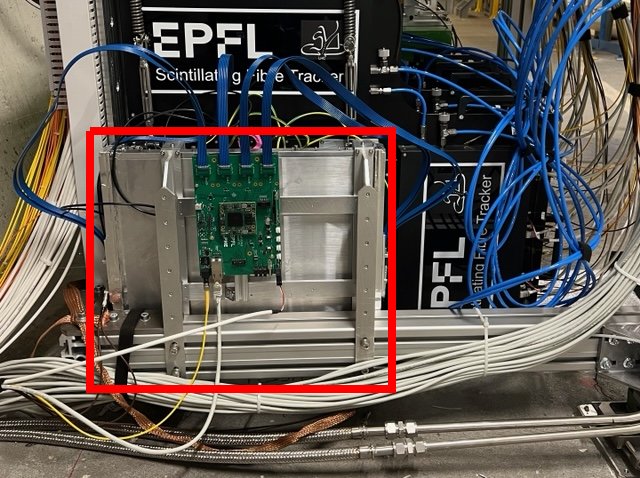
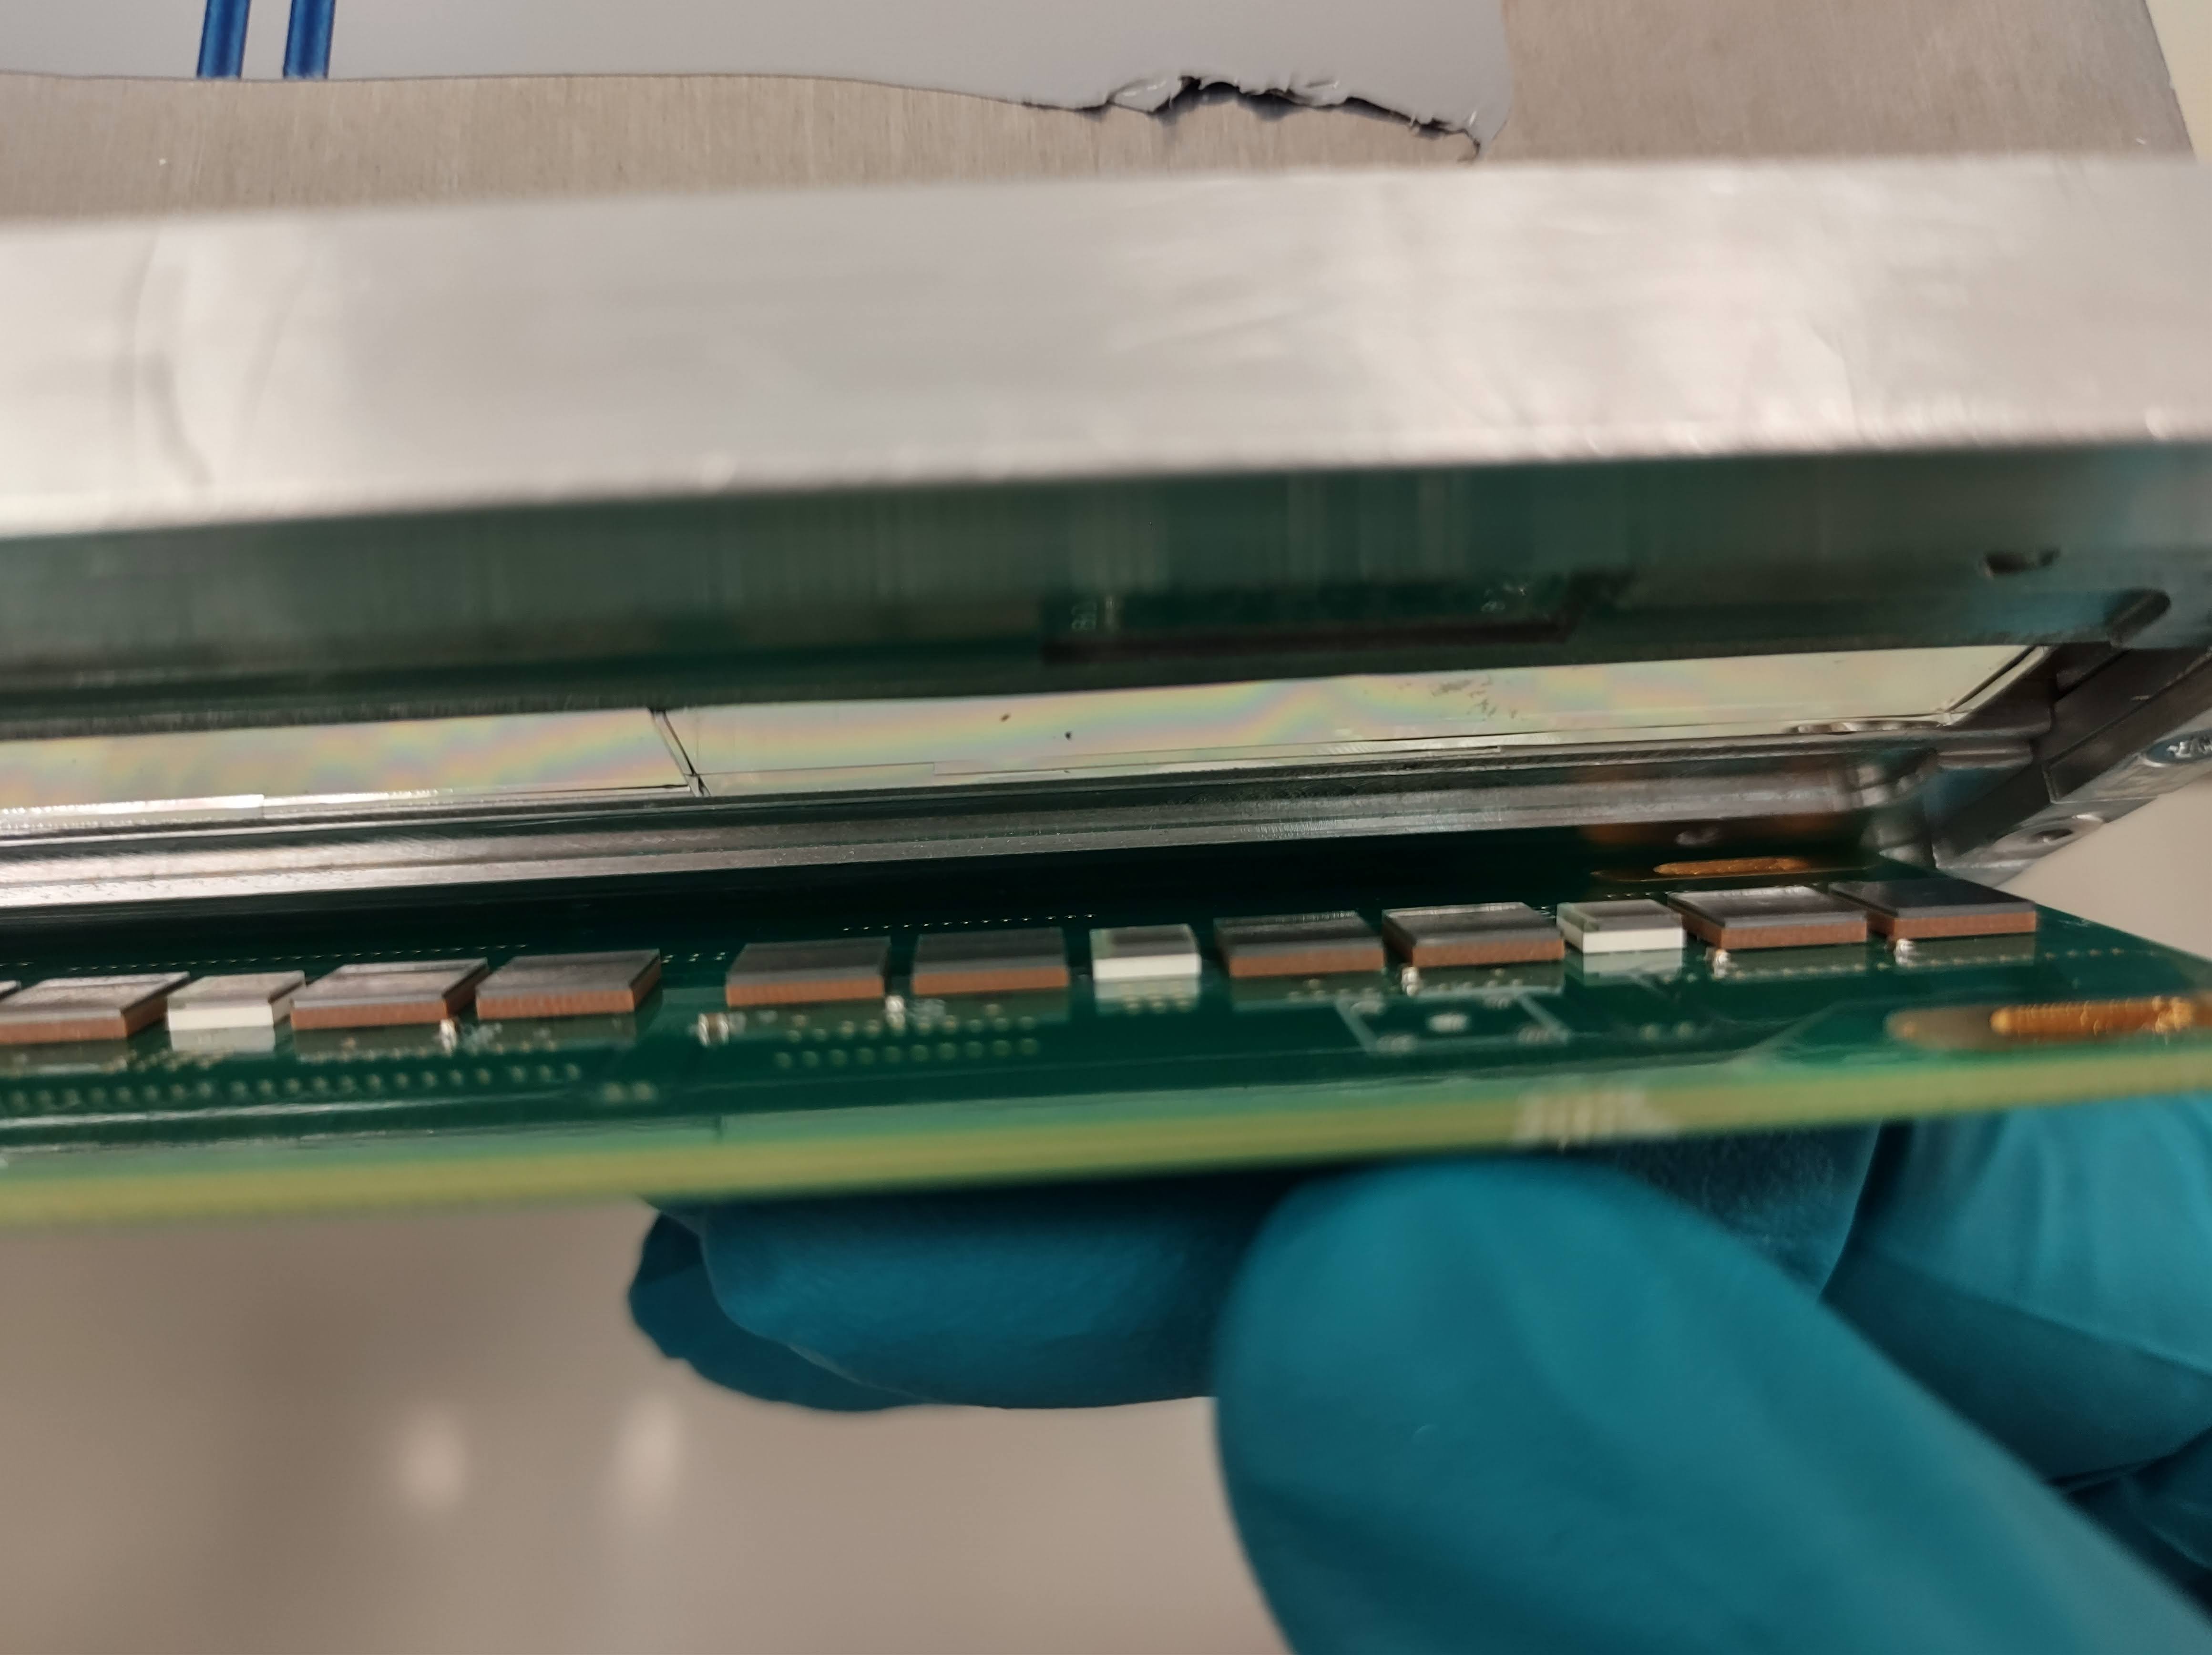
The two frames of the veto system are held together by a small support structure. This in turn is attached to the support of the target region within accuracy, as shown in Figure 7. A vertical shift of between the two frames allows for coverage of the target region, compensating for inefficiency due to the dead area between bars introduced by wrapping material () and variations in bar height (). The DAQ board is mounted on the support frame directly in front of the veto planes. Fine alignment is performed as part of the target region alignment as mentioned in Section 4.
3 Target Tracker and electromagnetic calorimeter
3.1 Overview
The Target Tracker system is made of five scintillating fibre (SciFi) planes interleaving the five target walls. The SciFi technology is well suited to cover large surfaces in a low track density environment††† The expected rate of tracks from the ATLAS impact point is about at peak luminosity., where a spatial resolution is required.
The role of SciFi trackers is two-fold: assign a timestamp to neutrino interactions reconstructed in the ECC walls and provide an energy measurement of electromagnetic showers. Moreover, the combination of SciFi and scintillating bars of the muon detector will also act as a non-homogenous hadronic calorimeter for the measurement of the energy of the hadronic jet produced in the neutrino interaction and hence for the neutrino energy.
The matching with events reconstructed in the target walls is performed by connecting the centre of gravity of electromagnetic and hadronic showers, reconstructed in the SciFi immediately downstream of the ECC where the interaction occurred, with tracks reconstructed in emulsions. The large multiplicity of tracks produced in neutrino interactions and the high density of passing-through muons prevent a track-by-track matching between SciFi and ECC.
The measurement of electromagnetic shower energy is based on information provided both by ECC bricks and Target Tracker planes. The five target walls ( each) interleaved with SciFi tracker modules, form a coarse sampling calorimeter.
The two main components employed in this SciFi tracker, the scintillating fibre mats and the multichannel SiPM photo-detectors, were developed by the EPFL group for the LHCb SciFi Tracker [41]. The read-out electronics is different from the one used in LHCb and it has been optimised to have an improved time resolution and to detect electromagnetic showers.

3.2 The SciFi modules
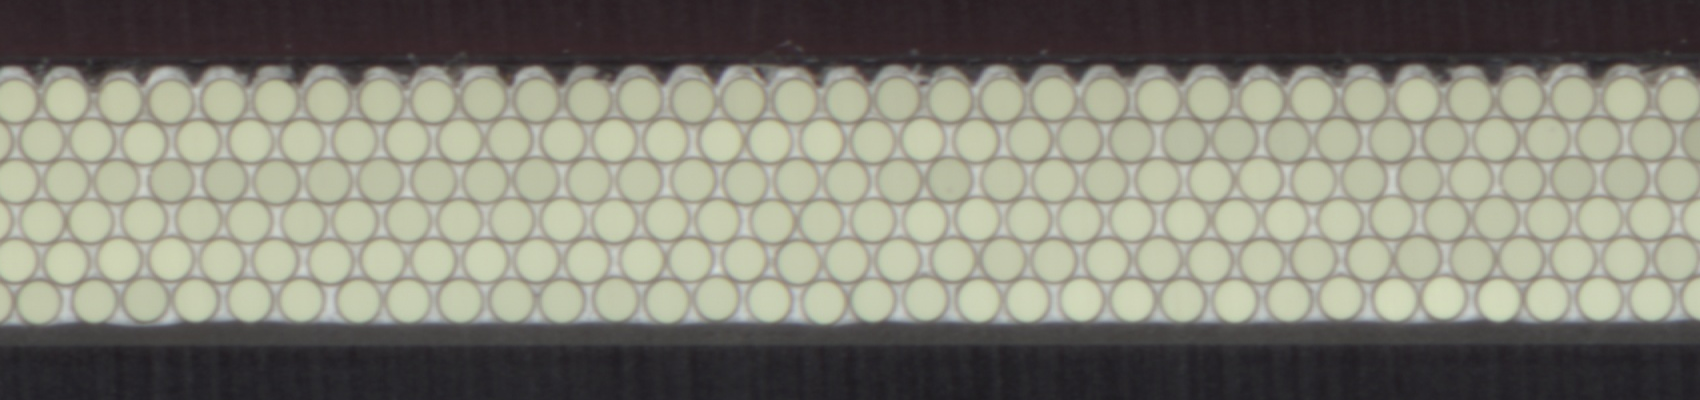
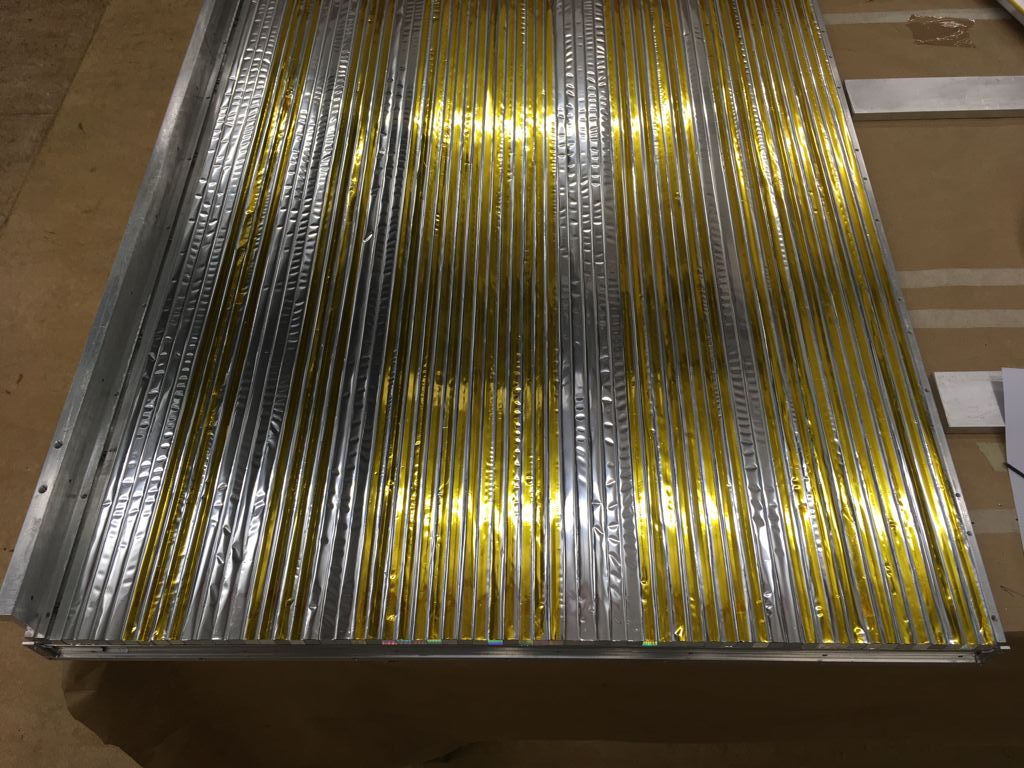
The SciFi modules for SND@LHC, shown in Figure 8, are closely following the design of the long modules built for LHCb. The double-cladded polystyrene scintillating fibres from Kuraray (SCSF-78MJ), with a diameter of , are blue emitting fibres with a decay time of . The fibres are arranged in six densely-packed staggered layers, forming fibre mats of thickness. A picture of the cross section of such a mat is shown in Figure 9.
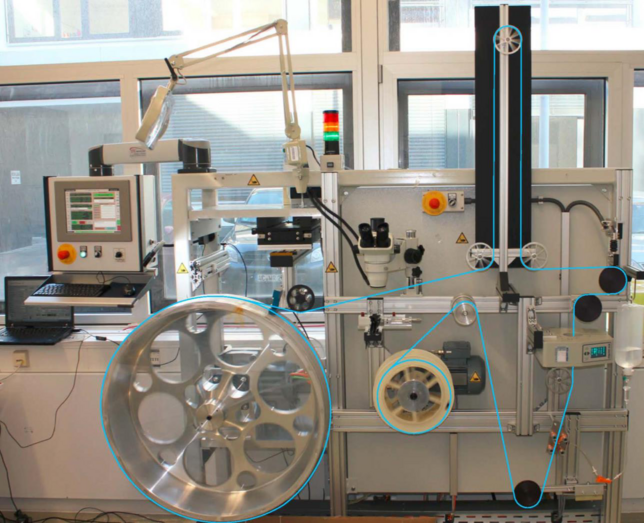
The fibre winding and gluing process has been developed within the LHCb SciFi collaboration. A dedicated winding machine, shown in Figure 10, with tension and position control as well as optical feedback has been engineered. Fibre mats produced for the SND@LHC tracker are wide and long; they are integrated into a fibre plane with less than dead zones.
A polycarbonate end-piece is glued and an optical surface cut is applied to each end of the fibre mat. One side of the mat is brought in direct contact with the epoxy entrance window of the photo-detector and the other end can optionally have a mirror or a light injection fibre coupling.
3.3 The SiPM photo-detectors and readout electronics
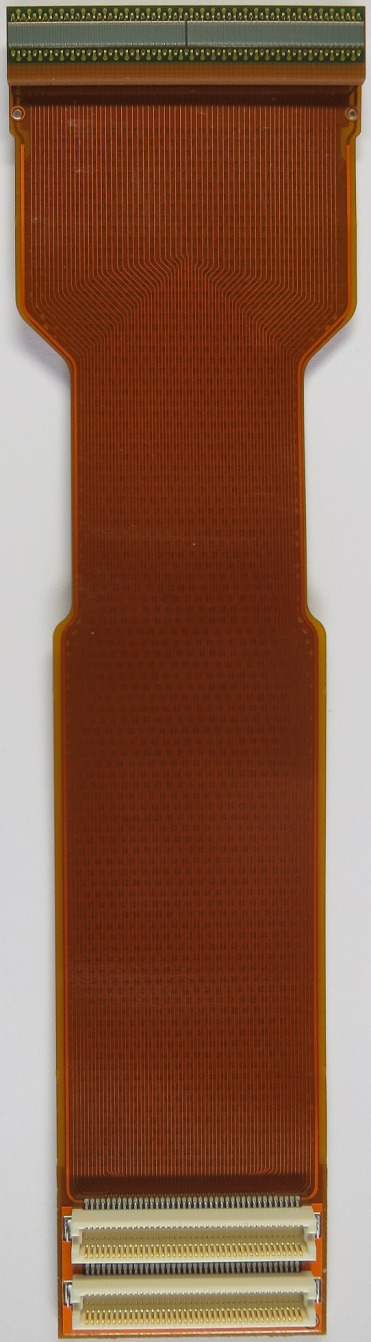
The readout consists of the photo-detector (S13552 SiPM multichannel arrays by Hamamatsu) at the end of the fibre module, a short Kapton flex PCB holding the photo-detector and signal connectors and the front-end electronics board, shown in Figure 11(a). The light tightness of the module is ensured by a seal on the flat Kapton flex, the aluminium module frame and an opaque Tedlar sheet on both sides of the module. This encloses the photo-detector and the entire fibre region. The light tightness is evaluated during the assembly phase and leaks closed with glue. The photo-detectors are not actively cooled, as their heat dissipation is low and the expected noise is acceptable at the operation temperature of .
The SiPM multichannel array is optimised for low light-intensity detection. For application in SND@LHC, the SciFi performance has to be tuned for maximising the hit detection efficiency at an acceptable noise rate. The final threshold chosen for operation produces a noise rate of per channel, which poses no problem to the event builder (described in Section 6.1.4) and can be efficiently suppressed by the online noise filter. The SciFi detector with this configuration features an efficiency of , as discussed in Section 8.2.2.
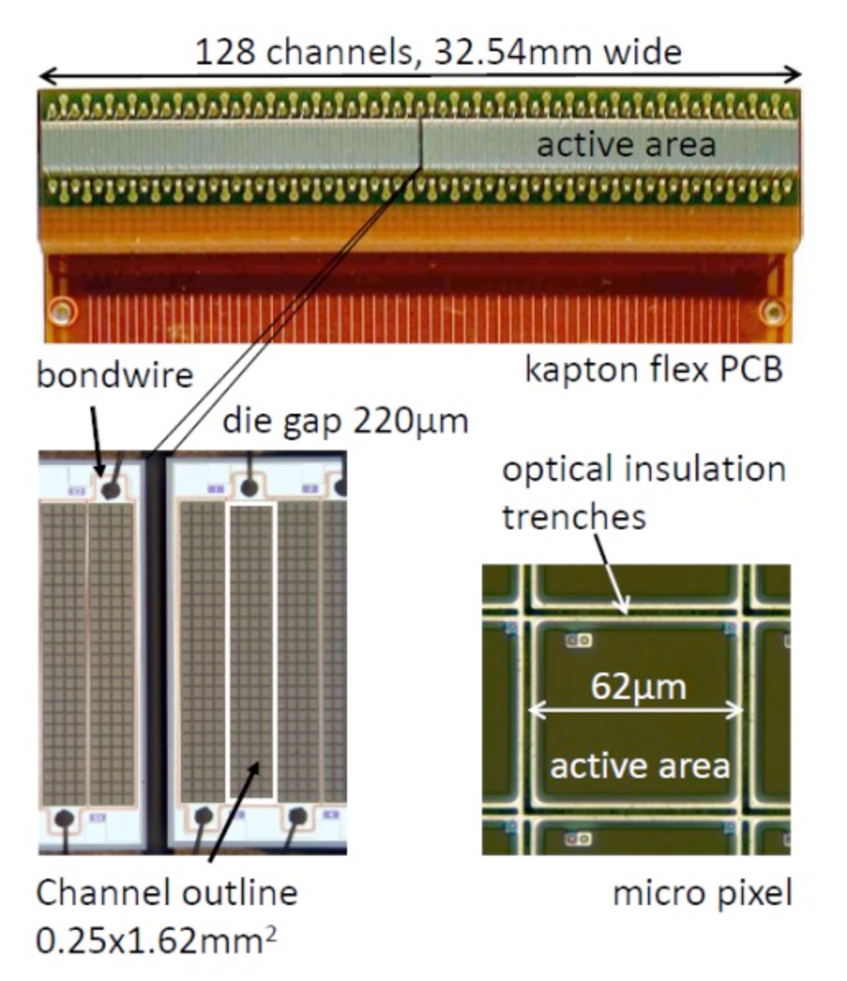
The array used in SND@LHC, shown in Figure 11, has an active channel area of , a peak photo-detection efficiency (PDE) of and a gain of at over-voltage. To obtain a high PDE, the choice of large pixels , leading to an array of pixels per channel, significantly limits the linearity and the dynamic range to about 50 photo-electrons per channel. For this operation condition, the light yield (LY) for a minimum ionising particle (MIP) traversing the fibre plane in the center of the module, is photo-electrons (PE).
The readout chip chosen for this tracker is the TOFPET2 ASIC [42, 43, 44], described in Section 6.1.2. Its power consumption is per readout channels, including the loss for linear voltage regulation. A water cooling system has been chosen to counteract limited convection due to dense packing between modules. To simplify the mechanical design of the water cooling, the FPGA of the DAQ boards is connected to the large aluminium support of the module and not to the water cooling. The thermal design has been verified and the temperature lies within the required range during operation. The heat dissipation of the electronics into the target enclosure is per board or a total of for the complete SciFi tracker.
3.4 Low voltage and SiPM bias voltage
The power for each DAQ board is provided with a CAEN A2519, an 8-channel, , power supply module, hosted in one of the CAEN mainframes (see Section 6.1 for more detail). To optimise the cost for the bias voltage of the SiPMs, a single channel per DAQ board is used. A group selection of SiPM arrays allows to minimise the break down voltage spread among SiPMs biased by the same bias voltage.
3.5 Calibration
The DAQ electronics provide an electrical injection signal, synchronous to all TOFPET2 FE chips on one board. This allows for a first-order time calibration between channels on the same board. Subsequently, a fine time calibration based on muon tracks among different boards and layers can be used to correct and verify the time calibration based on the collected data during the runs. The studies from a DESY test beam in October 2019 show that, based on the initial time alignment, the time calibration for channels can be improved using data with single tracks producing multiple hits in all ten SciFi layers.
When detecting electromagnetic showers in a - detector layout, a large number of tracks are produced in a small region of space and therefore only a projection of the shower profile can be obtained. Additionally, the pixelised silicon photomultiplier (SiPM) suffers from non-linear amplitude response due to the limited number of pixels. With a light yield of and a total of pixels per channel, a pixel occupancy of almost is expected for a shower track density of tracks per channel (). Beyond this track density, a strong non-linear response of the detector signal is expected. The saturation is of statistical nature and can be corrected to make the detector response linear. To obtain a correlation between the measured signal amplitude by the TOFPET2 electronics and the number of MIP tracks in the detector, a Geant4 simulation will be used to model the EM shower development and the SiPM saturation.
3.6 Alignment
The mechanical alignment between the SciFi planes and the emulsion boxes is ensured with mechanical precision pins, constraining the relative position between the two objects. Because of the large number of tracks from high-momentum muons traversing the target (a few thousands//), an accurate spatial alignment between SciFi planes can be obtained by using the tracks themselves.
Each SiPM array of channels is expected to have a constant shift relative to the nominal position and each fibre mat (three per detection plane) has to be corrected for its constant rotation angle. These corrections have been studied during the commissioning in the SPS H6 beam line, presented in Section 8.2.
4 Target and vertex detector
4.1 Overview
The emulsion target is based on the Emulsion Cloud Chamber (ECC) technique, that makes use of nuclear emulsion films interleaved with passive layers to build up a tracking device with sub-micrometric spatial and milliradian angular resolution, as demonstrated by the OPERA experiment [34]. It is capable of detecting leptons [36] and charmed hadrons [45] by disentangling their production and decay vertices. It is also suited for FIP detection through the direct observation of their scattering off electrons or nucleons in the passive plates.
The ECC technology alternates 1-mm thick tungsten plates acting as the neutrino target with 300-micron thick films, each made of two sensitive emulsion layers poured on a plastic base, acting as tracking devices with micrometric accuracy. The reconstruction of track segments in consecutive films provide the vertex reconstruction with an accuracy at the micron level. The fine segmentation of active films interleaving tungsten plates is motivated by the longitudinal resolution required to observe the tau lepton track and by the need to keep the combinatorial background in the association of track segments sufficiently low over an integrated luminosity of about 25 fb-1 (corresponding to days of data taking in nominal conditions), after which the emulsion films are replaced. It also makes the emulsion-tungsten ECC a high-sampling electromagnetic calorimeter with more than three active layers every radiation length, , essential for electron identification and discrimination against neutral pion decays [46].
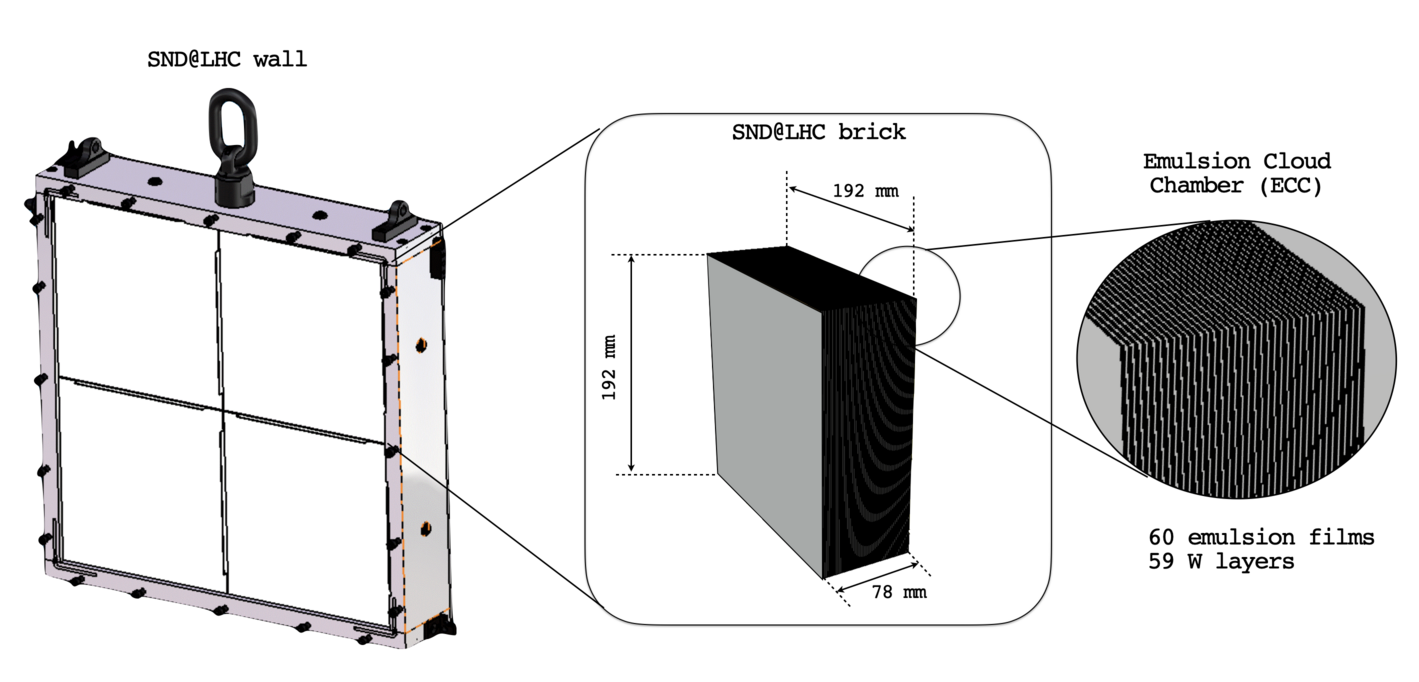
The emulsion target is made of five walls with a sensitive transverse size of . Each wall consists of four cells, called bricks as illustrated in Figure 12. Each brick is made of 60 emulsion films with a transverse size of , interleaved with 59 -thick tungsten plates. The resulting brick has a total thickness of , making , and a mass of . The overall target mass with five walls of bricks amounts to .
The layout of the target was optimised to fulfill conflicting requirements: overall dimensions that cover the desired pseudo-rapidity region and maximse the azimuthal angular acceptance, large emulsion surface to maximise the event containment in the brick and reduced number of bricks per wall to minimise the dead area between adjacent cells.
4.2 Target walls
Nuclear emulsion films are the most compact, thinnest and lightest three-dimensional tracking detectors with sub-micrometric position and milliradian angular resolution. A nuclear emulsion film has two sensitive layers (-thick) on both sides of a transparent plastic base (-thick). By connecting the two hits generated by a charged particle on both sides of the base, the slope of the track can be measured with milliradian accuracy. The whole detector will contain 1200 emulsion films, for a total of . Emulsion films will be produced by the Nagoya University in Japan and by the Slavich Company in Russia.‡‡‡Slavich Company, Yaroslavskaya Region, Peresavl-Zalessky, Russia.
Emulsion films are analysed by fully automated optical microscopes [47, 48]. The scanning speed, measured in terms of film surface per unit time, was significantly increased in recent years [49, 50, 51], reaching . R&D is still ongoing [52] to further increase the scanning speed.
Tungsten was selected as target material in order to maximise the interaction rate per unit volume. Its small radiation length () allows for good performance in the electromagnetic shower reconstruction in the ECC. The low intrinsic radioactivity makes tungsten a suitable material for an emulsion detector.§§§Tungsten supplied by Luoyang Sifon Electronic Material Co Ltd, China, through the INTENT Company, Torino, Italy.
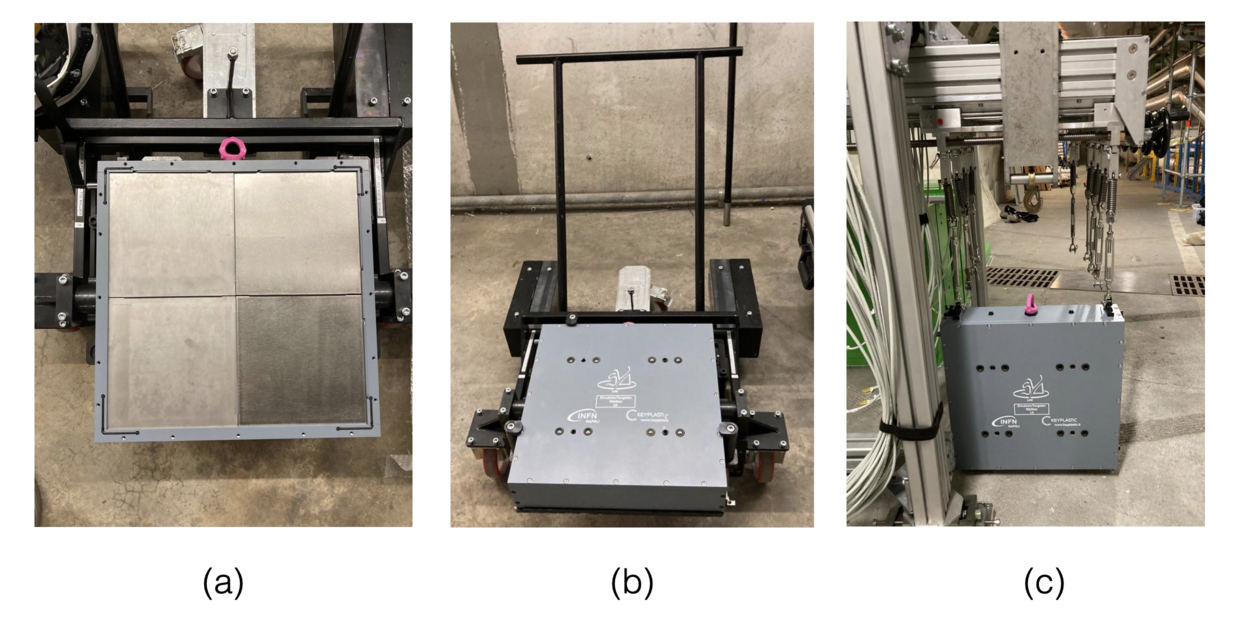
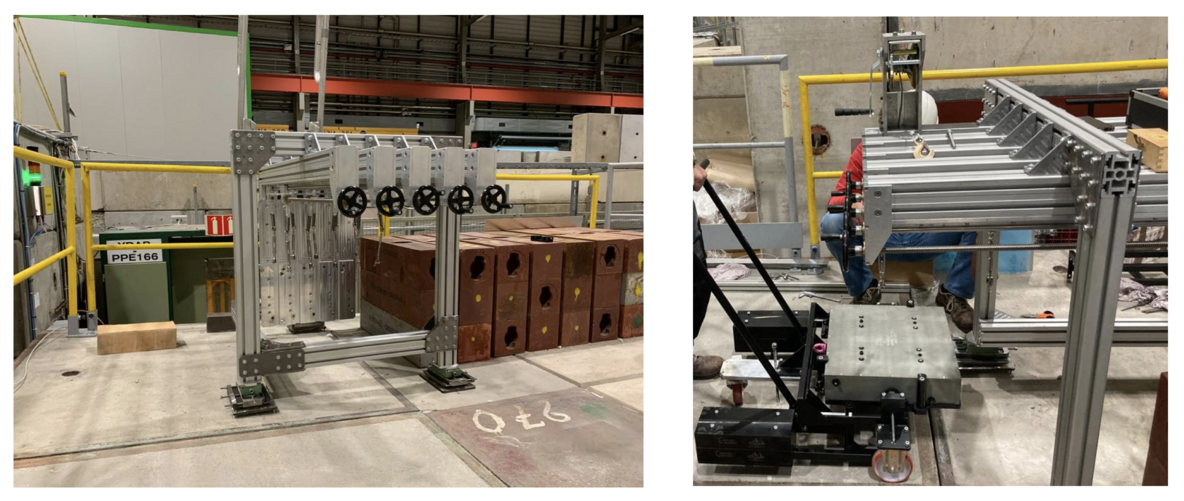
An ECC wall is contained in an aluminum box that hosts the four bricks, which are assembled one after the other by piling up 60 emulsion films and 59 tungsten sheets. The box is then closed using a semi-automatic tool that keeps the necessary pressure to avoid relative displacements between emulsion films. Once closed, the box is light tight. Each wall is transported from the dark room where it is assembled to the TI18 tunnel by means of a custom trolley and, once there, inserted into the mechanical structure of SND@LHC. The different phases of the wall assembly, transportation and installation are described in Figure 13.¶¶¶Design of wall structure, transportation trolley and assembly tools performed in collaboration with the KeyPlastic Company, Montale (MO), Italy.
The emulsion target will be replaced every . The exchange of target walls will be performed during LHC Technical Stops. Since it is not assured that the integration of the target luminosity will be in coincidence with Technical Stops, the Collaboration has developed a procedure for a fast brick replacement (about shift), that could fit within shorter accesses to the LHC tunnel.
4.3 Target mechanics
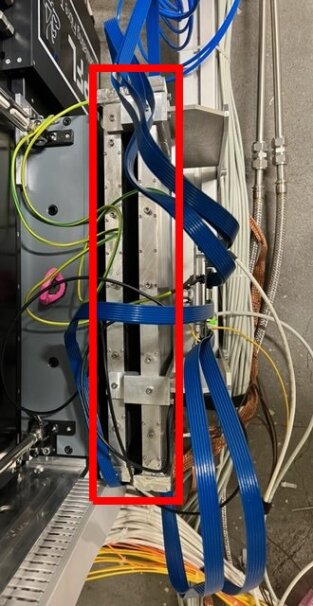
The mechanical structure of the SND@LHC target was designed to have a single support structure for both the five emulsion/tungsten walls and the five SciFi planes. It is made of a vertical rectified aluminum plate, that guarantees a fine mechanical alignment of target walls, and of five aluminum horizontal profiles, each sustaining a target wall, as shown in Figure 14. Each SciFi plane is fixed to the upstream wall box via three pins. Wall boxes are suspended to two horizontal profiles by two rope tensioners, two springs and a pendulum link. Each wall box is placed into the loading position with the transportation trolley, it is then suspended to the structure and translated to the final position via recirculating ball guides. Finally, the wall box is secured to the vertical plate with two screws.
The whole structure is supported isostatically on three points. Alignment feet are used to adjust the height of the structure, to compensate for the inclined floor. Horizontal plates located below each foot are used for fine adjustment of the target position on the tunnel floor. The alignment of the target system is performed via three alignment spheres located at the rear of the vertical plate. The required mechanical tolerances are of the order of the millimeter, being the fine alignment performed with penetrating tracks coming from the ALTAS impact point.
4.4 Neutron shield and cold box
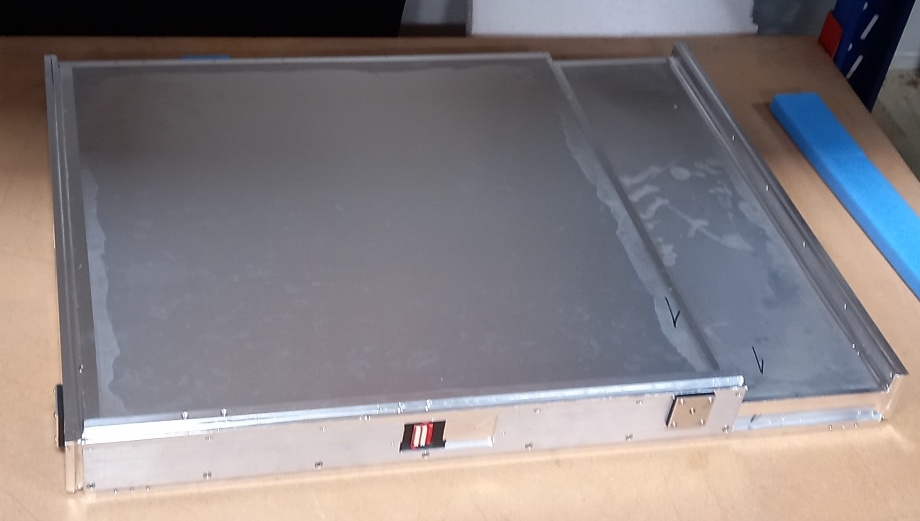
The interaction of proton beams with the residual gas inside the LHC beam pipe produces low energy neutrons, with a spectrum ranging from a few meV to a few hundreds of MeV, about half of them being thermal neutrons. The neutron flux expected in the TI18 tunnel is predominantly produced by the counterclockwise beam (beam 2) that passes by TI18 while moving towards IP1. Thermal neutrons would cause an increase of fog, number of developed grains per unit volume, in the emulsion films. A shielding box was therefore built around the target region. It is made of -thick 30% borated polyethylene and -thick acrylic layers, as shown in Figure 15. It provides a background reduction of a factor of [2].
The box acts also as an insulation chamber. For the long-term stability of emulsion films, a cooling system was installed to keep the temperature of the target at () and the relative humidity in the range to .
5 Hadronic calorimeter and muon system
5.1 Overview
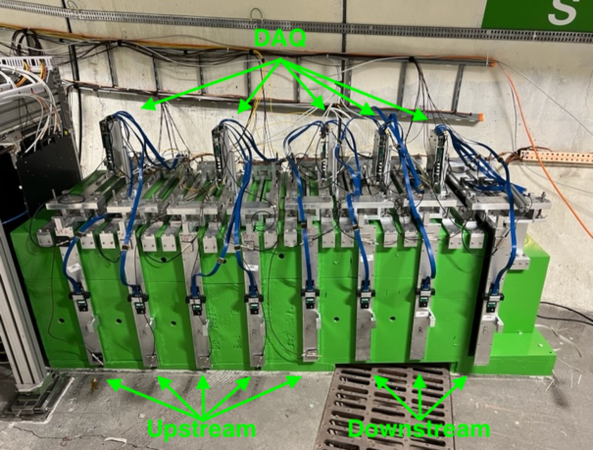
Downstream of the target region lies the hadronic calorimeter and muon system, shown in Figure 16. Its primary purpose is to identify passing-through muons and, together with the SciFi, it serves as a sampling hadronic calorimeter, enabling measurement of the energy of hadronic jets. It comprises eight layers of scintillating planes interleaved with -thick iron slabs, which acts as passive material with a thickness of . This adds up to an average total of for a shower originating in the target region. Muons are identified as being the most penetrating particles through all eight planes. The system is further divided in two sections: the first five upstream layers (US), made of -thick horizontal scintillating bars, and the last three downstream layers (DS), made of fine-grained horizontal and vertical scintillating bars, illustrated in Figure 17.
5.2 Upstream system
The first five US layers are similar to the veto planes, albeit with different dimensions. Each layer consists of ten stacked bars of EJ-200, each bar having dimensions . The length was chosen to be longer than the iron blocks to allow the FE to be placed outside the gap between them, reducing the space needed for the gap and overall length of the muon system along the collision axis, a critical parameter in the apparatus design as described in Section 1. The bars are wrapped in aluminized Mylar foil in the same fashion as the veto system.
Every bar end is viewed by eight SiPMs; six Hamamatsu S14160-6050HS ( , pitch) and two Hamamatsu S14160-3010PS [53] (, pitch) SiPMs. The SiPMs are arranged on a custom PCB as shown in Figure 18, which is read out by a front-end TOFPET2 board (see Section 6). The placement of SiPMs along a bar can be seen on the left of Figure 19. The two smaller-size SiPMs are used to increase the dynamic range for each bar, which has to cover the low light yield generated by minimum ionizing particles and the large light yield in case of hadronic showers created in the target region or iron blocks. The latter can lead to large charged-particle fluxes through the bars, and hence to large signals, which can saturate the larger SiPMs but not the smaller ones. Each SiPM is read out as a single channel, giving 80 channels per PCB totaling 800 channels for all US layers.
The PCBs are aligned to the bars within , as shown on the right in Figure 19. The space between the SiPMs and bars on one side is filled with the same silicon epoxy gel ( thick) as in the veto, while the PCB on the opposite end is pressed against the bars to minimize the air gap. This leads to a small asymmetry between left and right side signals for a given plane, which however does not affect the detection efficiency.


5.3 Downstream system


Muon identification is completed with three high-granularity DS stations, placed further downstream, for providing the muon position with a resolution of better than (Figures 16, 17). Each station consists of two planes of thin scintillating (EJ-200) bars (Figure 20): one of horizontal bars ( each), and one of vertical bars ( each). The third station has an additional plane of vertical bars.
Every horizontal bar is read out by one SiPM (Hamamatsu S14160-6050HS) on either end; verticals bar have one SiPM only on the top edge, since the bottom is end is located as close as possible to the floor in order to maximise the detector acceptance. Sixty SiPMs are mounted at regular intervals of on a single PCB, placed at the edge of the bar stack. The total number of channels for DS part of the muon system is .
Bars are individually wrapped in aluminized mylar foil. Because of the bar shape, most of the light collected by the edge SiPM is indirect. Therefore a tool was developed in order to ensure that the aluminized mylar foil is very tightly wrapped around the scintillating bar, minimising the light loss because of multiple reflections. For vertical bars, the wrapping of the foil at the bar end without SiPM was terminated with an additional flat layer that optimises reflection.
Scintillating bars in the same plane can differ in dimensions and be out of square from one edge to the other within fabrication tolerances. Since the SiPMs are locked in position on the PCB, assembling tools have been developed to ensure that the one-to-one alignment of SiPMs and bar edges is preserved along the entire stack: wide SiPMs are centred on the wide bar edge with an uncertainty of .
The quality of the contact between SiPMs and bar edges can differ because of differences in bar lengths. Thus it was decided to sort bars in groups of similar lengths, maximising uniformity in the same plane, and adjust the distance of the PCB, so that the SiPM-to-bar-edge gap was measured to be less than for all bars.
5.4 Low voltage and SiPM bias voltage
The low voltage for powering the DAQ boards and the bias voltage for the SiPMs are provided by CAEN power supplies, described in Section 6.1. For the US system, two separate HV bias lines are used for the two types of SiPMs, connected with two LEMO connectors on each PCB, as seen in Figure 18, while for the DS a single LEMO connector is used to power all SiPMs.
5.5 Mechanical support
Bars and PCBs are housed in aluminum frames that provide light tightness. The thickness of the frames is and the rectangular flanges are wide. An aluminum cover shields the PCBs from outside light and protects it from heat generated in the FE board, located on the opposite side of the cover. A Kapton gasket between the PCB and flange prevents electrical shorts between the electronics and frame. The inside of the aluminum cover is also lined with Kapton to electrically isolate the PCB.
5.6 Alignment
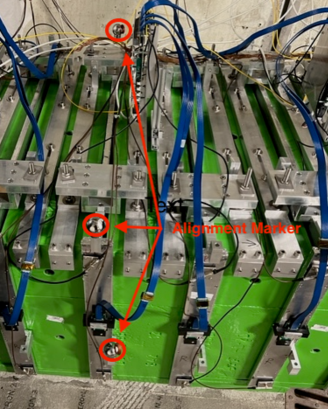
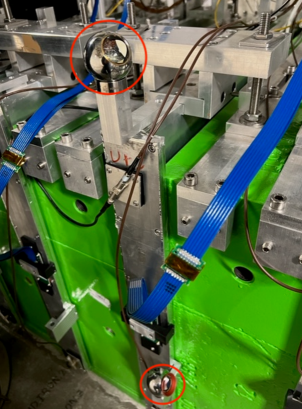
Frame support mechanics are mounted on the iron blocks; adjustment screws allow for correcting the placement in position, rotation and tilt. Individual frames are installed in gaps between the iron blocks, and then fixed to the support mechanics. Three spherical alignment markers, shown in Figure 21, are mounted on each frame for global survey measurements. Alignment was performed by the Geodetic Metrology Group within the Beams Department (BE-GM) at CERN, with each marker aligned with respect to the nominal positions within 1–.
6 Online system
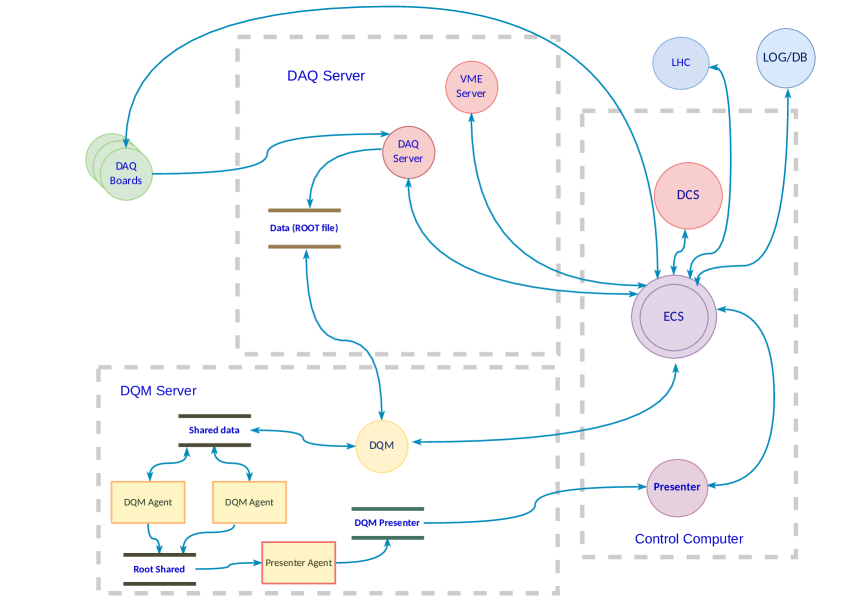
The SND@LHC online system includes all components involved in operating the experiment, i.e. the timing and the data acquisition hardware and software that realise the data flow from the detector to the storage, the detector control system (DCS) that controls and monitors the detector services, such as power supplies, cooling system, etc, and the data quality monitoring (DQM) and real-time analysis (RTA) system, necessary to ensure a good quality of the collected data. Globally, the top-level software, the experiment control system (ECS), encompasses all the sub-components above, together with the system of logs and databases in order to store information about the state, configuration and conditions of the data taking. The ECS is constructed to allow full automation of the data taking.
The different components, shown in the scheme in Figure 22, and the readout system are described in more details in the following sections.
6.1 Readout system
As discussed in Sections 2, 3 and 5, the SND@LHC experiment features two types of electronic detector systems: scintillator bars read out by SiPMs in the Veto, the hadronic calorimeter and muon system, and scintillating fibres read out by SiPMs in the Target Tracker. These sub-systems are read out with the same data acquisition (DAQ) electronics, consisting of front-end (FE) boards, described in Section 6.1.2, and DAQ readout boards, described in Section 6.1.3. They read out the signals from the SiPMs, digitize them and send the recorded data (including timestamp and integrated signal charge) to a DAQ server.
The detector uses in total 37 DAQ boards, each of which is connected to four FE boards. The system runs synchronously with the LHC bunch crossing clock, and operates in a trigger-less fashion, i.e. all hits recorded by each board are transmitted to the DAQ server. Noise reduction is performed at the front-end level by setting an appropriate threshold for each channel, and on the DAQ server after event building.
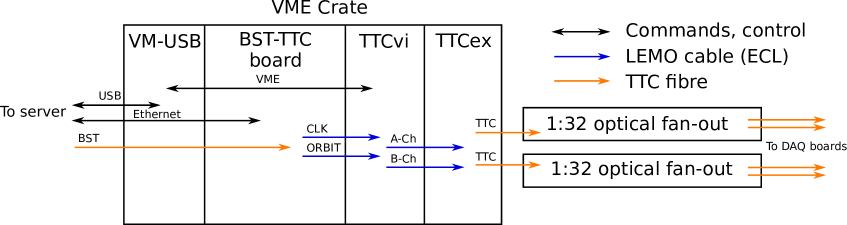
A Trigger Timing Control (TTC) crate[54], described in Section 6.1.1, is responsible for receiving the LHC clock and the orbit signals from the LHC Beam Synchronous Timing (BST) system and distribute them to the DAQ boards.
The detector is powered using CAEN A2519 modules for the DAQ readout boards power, requiring and each, and A1539B modules for the bias voltage of the SiPMs, requiring up to and up to per channel. These modules are hosted in two SY5527 mainframes.
The control of power supplies is performed by the detector control system (DCS, in the control computer in Figure 22) discussed in Section 6.2.1, which also monitors the voltages and currents drawn on both the LV and HV channels and monitors the presence of alarms.
The online system (DAQ Server, DQM server and Control computer shown in Figure 22) includes two servers located on the surface. One of them receives data from the DAQ readout boards, combines the data into events, and performs the online processing of the detector data, as described in Section 6.1.4, before saving the data to disk. The other one runs the ECS and the other elements of the online system.
6.1.1 Timing system
The LHC clock ( bunch crossing frequency) and orbit clock ( revolution frequency of the LHC) signals are obtained from the LHC BST system via optical fibres based on the TTC system.
A scheme of the system used in SND@LHC is shown in Figure 23. The BST signal is received by a dedicated board, BST-TTC, that extracts the clock and orbit signals, cleans the clock using a Phase Lock Loop, and distributes them to the detector using the TTC system. The board is the same that is used for the read-out of the detector, described in Section 6.1.3, with the addition of a mezzanine card to generate the correct signal levels for the TTC modules.
The clock and synchronous commands are distributed to the DAQ boards using the TTCvi and TTCex modules [55], housed in a VME crate. The TTCvi receives the clock and orbit signals, and generates the A-channel (trigger) and B-channel (synchronous and asynchronous commands) signals, which are encoded and transmitted by the TTCex.
The TTCvi module can be programmed and controlled using the VME bus. A USB-to-VME converter allows it to be programmed from the computer server.
Variations of several nanoseconds in the phase of the clock are to be expected due to temperature changes. For this reason, the absolute timing offset will be calibrated with the timestamps of the muons generated by collisions at the ATLAS interaction point and detected in SND@LHC.
6.1.2 Front-end electronics
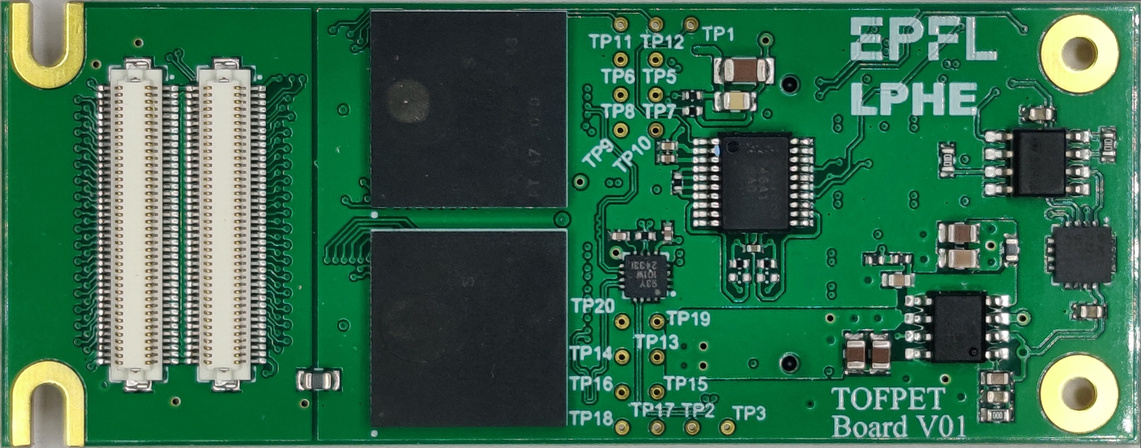
The front-end (FE) boards, shown in Figure 24, are based on the TOFPET2 ASIC by PETsys [42]. The TOFPET2 is a 64-channels readout and digitization ASIC designed for time of flight positron emission tomography systems [56]. It incorporates signal amplification circuitry, discriminators, charge integrators, analog-to-digital converters (ADC, in this case QDCs as in charge-to-digital converters) and time-to-digital converters (TDC). The ASIC has been found to be perfectly suitable to measure signals produced by SiPMs, and to record their timestamp and charge. The FE boards contain two TOFPET2 ASICs each for a total of 128 channels, and has temperature monitoring capabilities of both the SiPMs and the boards themselves.
Each channel of the TOFPET2 features a preamplifier and two amplifiers, one optimized for the timing measurement and the second for the charge measurement. A combination of up to three discriminators with configurable thresholds can be used. The first one is mainly used for timing measurements, and normally has the lowest threshold, while the other two are used to reject low amplitude pulses and to start charge integration. The TDCs feature a time binning of and the QDCs have a linear response up to input charge. In addition, the gain of the QDC branch can be selected to have a value between and to achieve the best resolution and dynamic range, depending on the signal generated by the SiPMs [56].
The TOFPET2 ASIC requires calibration in a three-step procedure. The first two steps include adjusting the input level of each amplifier just above the electronic noise produced by the detector, and then calibrating the TDCs and QDCs with the help of pulses with known duration and phase relative to the clock injected from the FPGAs. This is performed with the bias voltage of the SiPMs below the breakdown. Last, the dark count rates of the SiPMs are measured as a function of the thresholds of the three discriminators in each TOFPET2 to determine the best settings to achieve an optimal efficiency and data rate. The last step is performed at the nominal operating voltage of the SIPMs. The calibration procedure has been implemented in an automated way, and the parameters obtained from it are stored in configuration files.
6.1.3 DAQ electronics
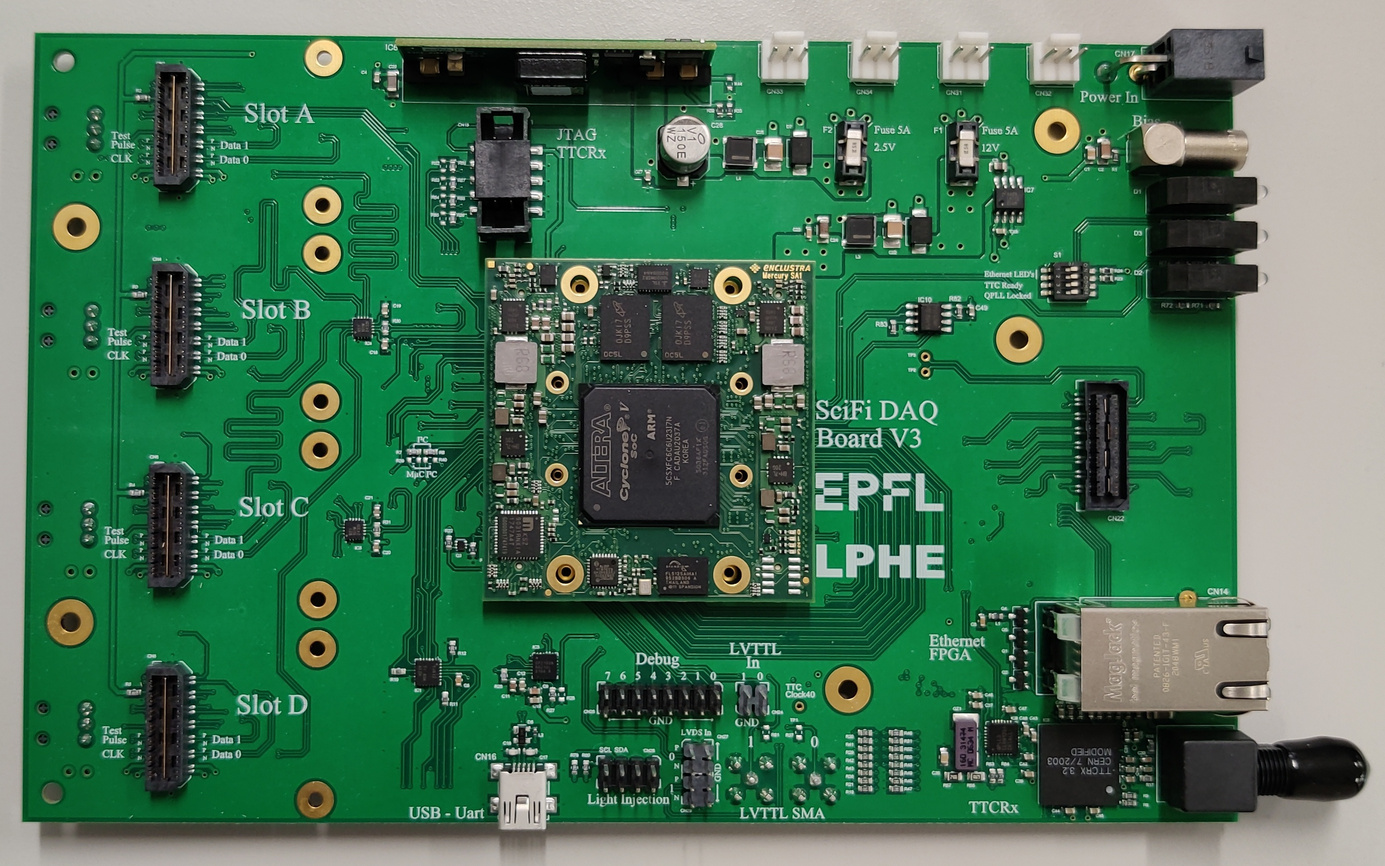
The DAQ readout boards, shown in Figure 25, are based on the Mercury SA1 module from Enclustra [57], featuring an Altera Cyclone V FPGA. This board is equipped with four high-speed connectors for the FE boards, a TTCrx ASIC [55] with an optical fibre receiver to receive the clock and synchronous signals from the TTC system, a Ethernet port used for data and command transmission, and a coaxial LEMO connector to deliver the bias voltage to SiPMs.
Each DAQ board collects the data digitized by four FE boards, i.e. 512 channels, and transmits it to the DAQ computer server located on the surface.
6.1.4 Readout software
Each DAQ board transmits all the recorded hits to the DAQ computer server, where event building is performed. The hits are grouped into events based on their timestamp, and saved to disk as a ROOT file.
The DAQ boards also transmit periodic triggers received from the TTC system. These heartbeat triggers are used by the event building software in the DAQ server to verify that all the boards are running synchronously, and operating properly even when there is no data.
The readout process from starting servers to starting the data taking, sending periodic triggers, monitoring the status of each element, etc, is fully controlled by the ECS, described in Section 6.2.3.
The event building process is structured in two main steps, shown in Figure 26. In the first step, hits collected by all boards and belonging to the same event, i.e. with time stamps within , are grouped into “events”. The event timestamp corresponds to the timestamp of the earliest hit within the event. The events are then filtered and processed online, before being written to disk. The details of the processing depend on the chosen settings, but it always contains an online noise filter, described below.
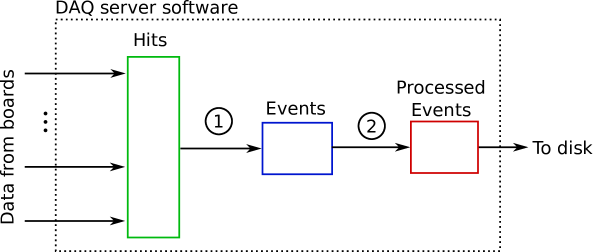
The noise filtering is performed in two steps. In the first one, events are required to have a minimum number of DAQ boards that have detected a certain number of hits. This is fast and eliminates all the events generated by single noise hits. In the second step, the hits are grouped by the plane that generated them. This allows more advanced requirements on the topology of the events to be imposed.
The system includes a number of additional configurable data processors, such as the FE calibration that may be applied during the data acquisition.
The DAQ server writes the recorded data to a local disk. At the end of each run the data is transferred to a permanent storage and converted to the format used by the reconstruction software.
The DAQ server can cope with a maximum rate of . The dark rate in the whole detector produces , the muon flux at the highest instantaneous luminosity () produces , leaving of spare bandwidth.
6.2 Experiment control
6.2.1 Detector control and safety monitoring
The detector control system (DCS) controls and monitors the status of all the detector services, i.e. the detector and electronics power supplies, the cooling system and the environmental sensors within the neutron-shielded box surrounding the target system, as well as the safety system. The voltage, currents and channel status of the power supplies are continuously monitored and transmitted to the ECS. The ECS then acts accordingly, logging the events or raising an alarm in case of problems.
The neutron-shielded box surrounding the target system is equipped with sensors for temperature, humidity and smoke. The safety and environment monitoring system (SMS) monitors these environmental parameters inside the box, detects the presence of smoke and monitors the status of the cooling system. The monitoring and safety decison logic is implemented on a NUCLEO-H743ZI development board [58], featuring an ARM Cortex-M7 microcontroller. A schematic illustration of the SMS is depicted in Figure 27.
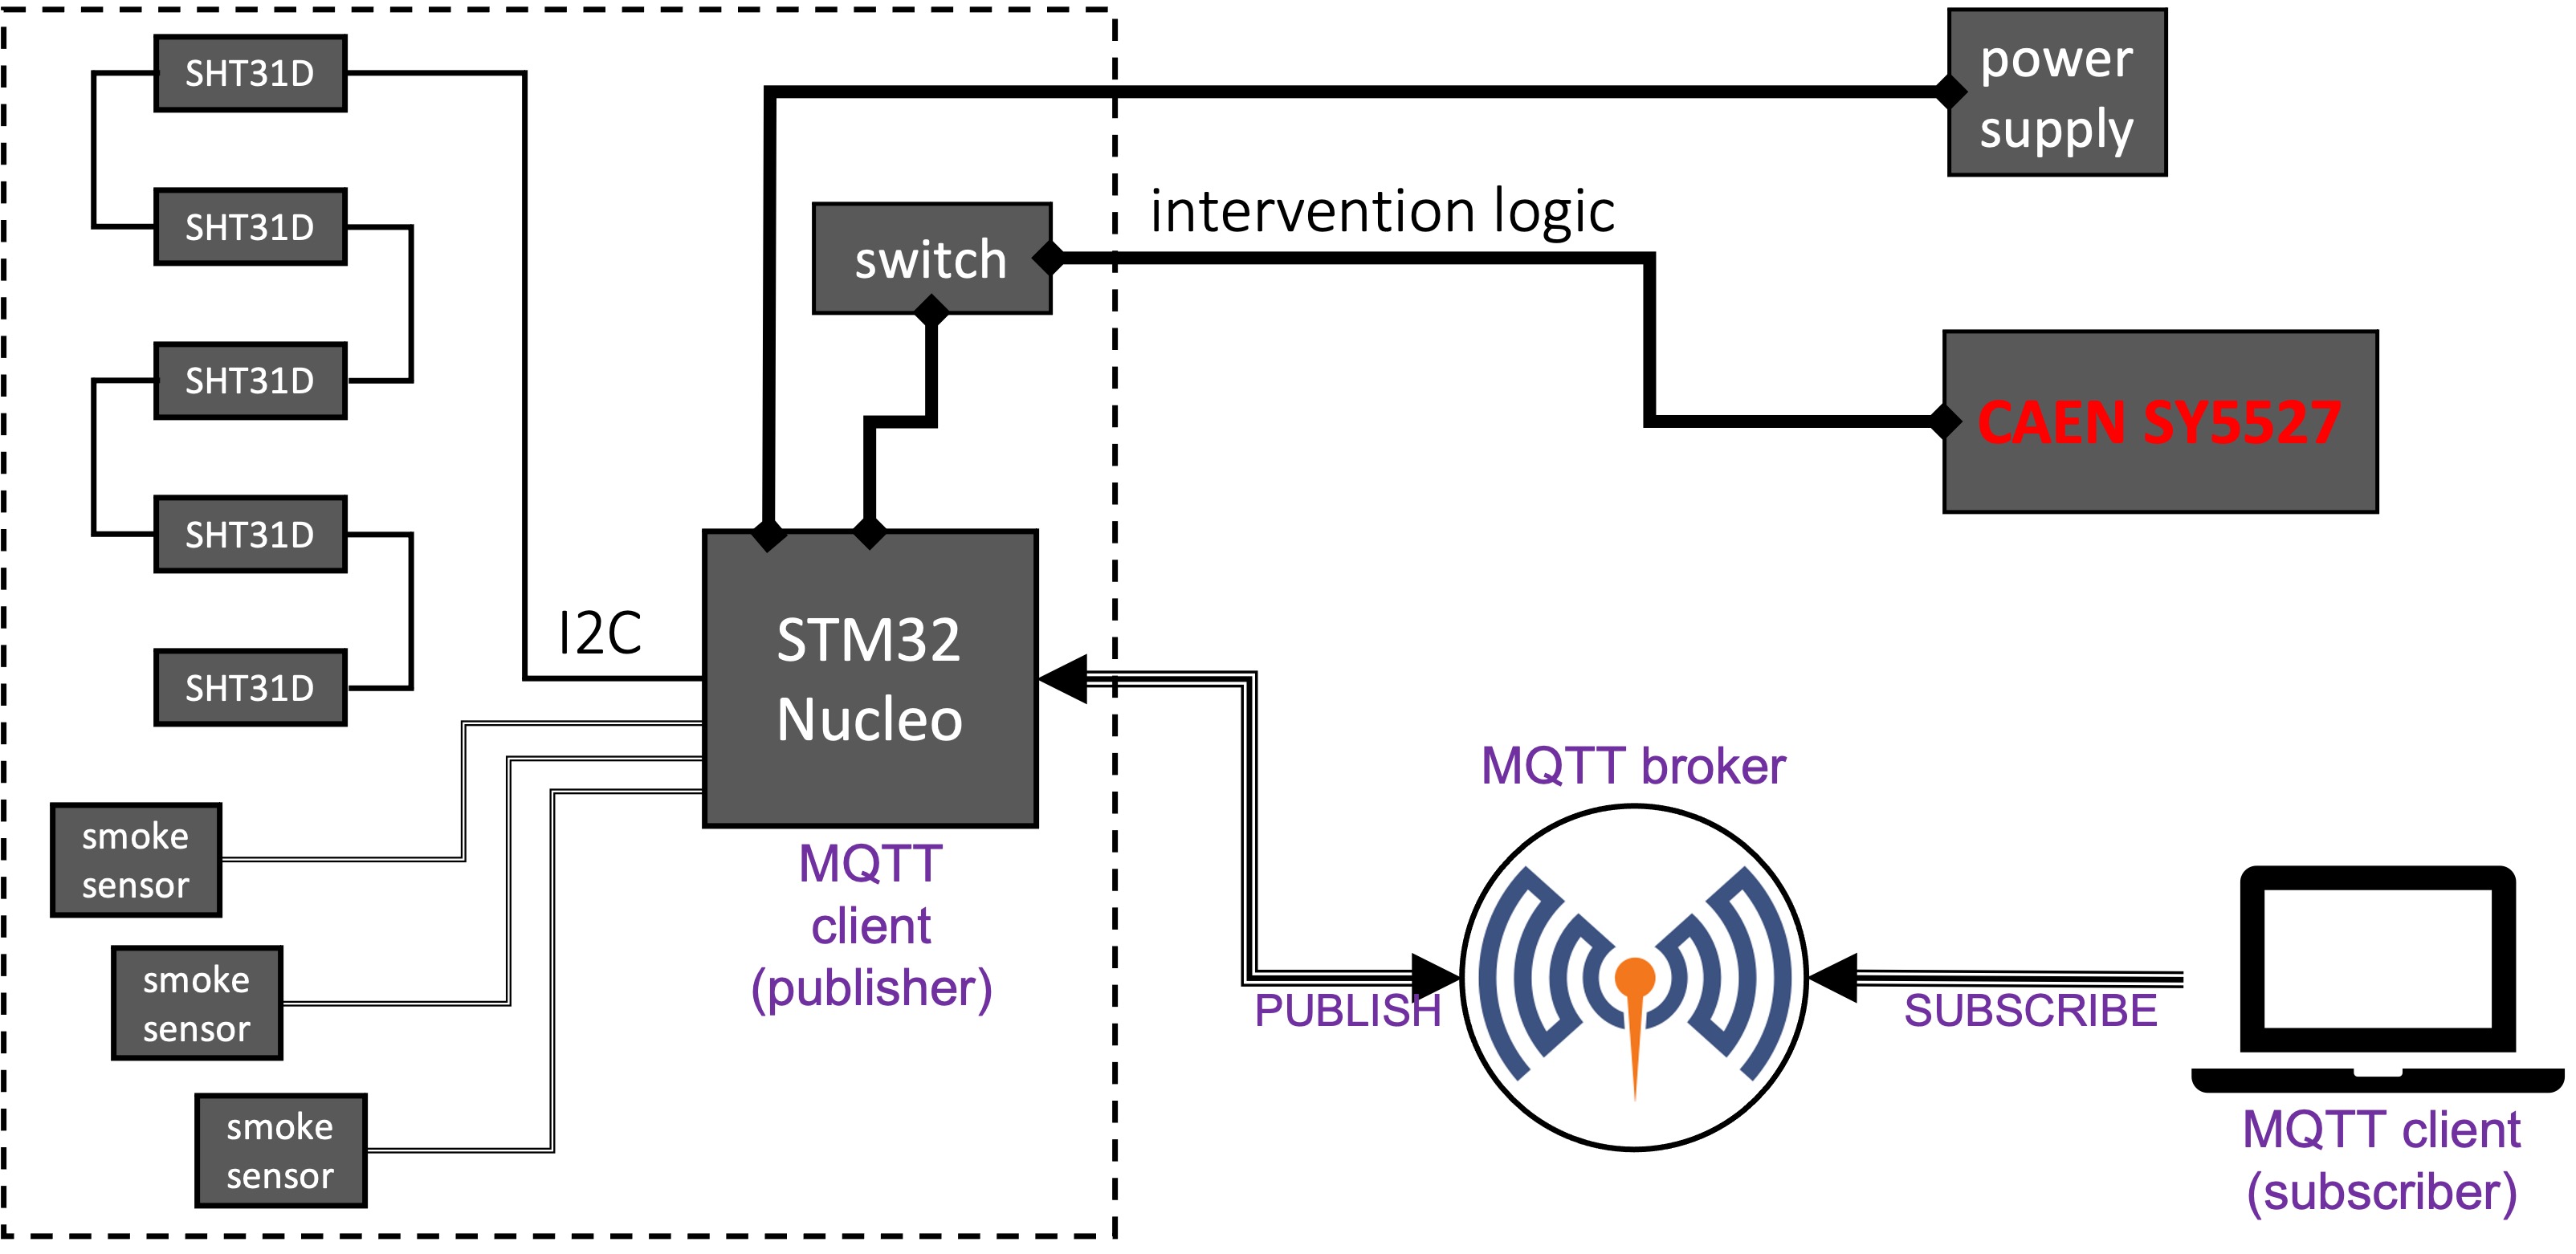
Temperature and humidity are measured in five different locations, using digital sensors (Sensirion SHT31 [59]) which guarantee an accuracy of and respectively, and a reliable I2C communication with the host microcontroller. The positions of the sensors have been chosen to minimize the interference with the emulsion replacement procedure. Three of them are positioned on the back metal plane, monitoring the temperature and humidity as close as possible to the emulsion boxes, while the remaining two sensors are placed on the opposite side, facing the cold box. This configuration assures a comprehensive temperature and humidity mapping of the target system.
The SMS is also equipped with three smoke sensors with relay output. They are used for fire and smoke detection and are connected to the microcontroller digital inputs with interrupt capability. In addition, a signal from the cooling system is used to monitor its status.
The microcontroller firmware has been developed using the Mbed OS [60], an ARM Real Time Operating System. It continuously monitors its inputs, evaluates possible alarm conditions, takes the safety actions according to the alarm levels and manages the data communication with the DCS. The MQTT protocol [61] is used to transmit data. The DCS monitors and logs the temperature inside the neutron shield. If it exceeds , an alarm is raised and the power to the DAQ boards is cut, to protect the emulsion films. Alarms are also raised if a failure is detected in the cooling plant, i.e. if it turns off and stays off for more than minutes.
The SMS also acts as an interlock for the CAEN power supplies. If an alarm condition is detected, it can turn them off without relying on the DCS being functional. The control algorithm is designed to classify alarms according to three levels referred to as low, medium and high. A low level alarm occurs when the temperature or humidity readings of one sensor exceeds the set thresholds, or if only one of the three smoke sensors is triggered. An alarm is posted but no further action is taken.
A medium level alarm occurs when the temperature or humidity readings of two or more sensors exceed the set thresholds or if the cooling system has been turned off for more than 10 minutes. An alarm is posted and the power supplies are immediately turned off, to avoid the temperature inside the cold box to raise further and potentially affect the emulsion films.
A high level alarm occurs when two or more smoke detectors are triggered. An alarm is posted and the power supplies are immediately turned off. In addition, it could be setup to trigger a response of the fire brigade.
6.2.2 Data processing and quality monitoring
The data quality monitoring (DQM) is fundamental to ensure that useful data is recorded and to verify that all the sub-systems of the experiment operate correctly.
The DQM process runs on the second computer server located at the surface and reads in real-time the data file that is being written by the DAQ server. The process performs the conversion to the offline data format and makes this data available to the DQM agents, which process it and displays the results in the ECS.
Several levels of complexity of the processing have been implemented from simple hit maps to ensure that all detector channels work as expected, to full real-time reconstruction that allows high-lever quantities to be checked, such as efficiencies and resolutions.
6.2.3 Experiment control system
The ECS is the top-level control of the experiment online system, providing a unified framework to control the hardware and software components, and to sequence all data taking operations.
A hierarchical architecture has been implemented in which the ECS is a layer above the other online systems, preserving their autonomy to operate independently. With this architecture, the various online components do not strictly require the ECS to operate, e.g. detector calibration and data taking are stand-alone processes. The ECS also performs the logging of the relevant detector information, either in ELOG or in databases depending on the type of information.
The ECS consists of two main software components: the ECS Process Manager (EPM) and the ECS Graphical User Interface (GUI). The software is written in C++ and the inter-communication with the DAQ and the DCS system is done with Python scripts.
The EPM is a process which runs on the main server and acts as the communication link between the different online system components. It takes care of starting them and continuously monitoring their status. The EPM process is kept alive by a cron-based watchdog. The status of the process is monitored at fixed time intervals, and restarted if it is not running. The EPM and its slave processes are associated with state machines that are driven by the status of the process activities. The information of these state machines is stored in a shared memory supervised by the EPM.
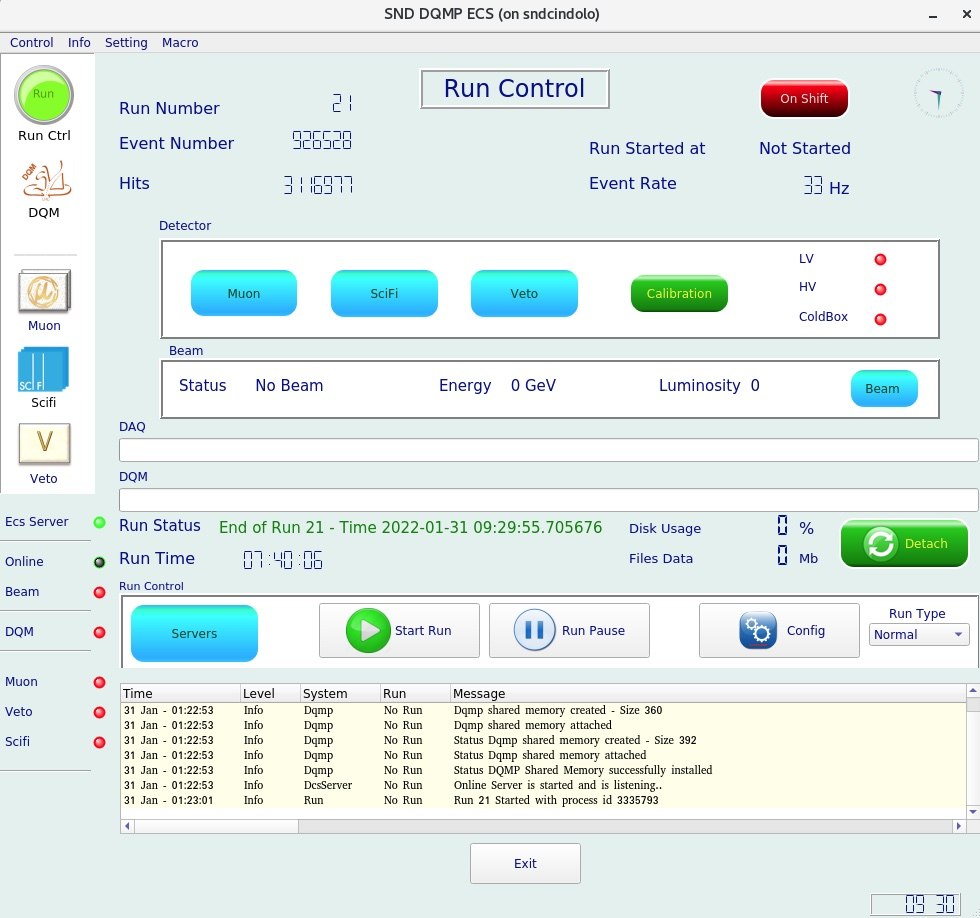
The ECS GUI has been designed to ensure a simple and compact view of the run control, status of the sub-detector and of the peripheral systems. The main windows of the ECS GUI is shown in Figure 28.
The ECS is designed to operate the online system automatically, controlled by a global finite-state machine that receives the status of the LHC and of the detector to perform predefined actions in order to run the data taking and recover from errors. The accelerator states are received from the LHC Data Interchange Protocol system, the power supply and environment conditions from the DCS, and the data acquisition status from the DAQ boards and the DAQ server. As an example, the ECS automatically starts the data acquisition when the LHC declares stable beams, stops it when the beams are dumped, and logs any event that can be useful to analyse the data. Furthermore, it can reboot a board that has become unresponsive, stop the DAQ and cut the power to the boards in the neutron-shielded box if the temperatures rises above the thresholds, try to restore a tripped SiPM bias channel, etc.
7 Offline software and simulation
The offline software framework, sndsw, is based on the FairRoot framework [62], and makes use of the experience gained with the FairShip software suite, developed within the SHiP collaboration [63]. The reconstruction and analysis tools developed by the SHiP collaboration had been successfully applied to the SND@LHC use cases and further improved.
The offline software is developed, maintained, and distributed on Github. sndsw and its dependencies are built from source and are configured using the AliBuild tool, developed within the ALICE Collaboration for their upgrade software. The recipes for the dependencies are shared with ALICE and SHiP, where possible, to reduce the maintenance of the framework. Specific patches and recipes for software uniquely used by SND@LHC are added, where required. Container images with the dependencies as well as an installation on the CVMFS are provided for various use cases. Raw and reconstructed data from testbeam and TI18 commissioning are available on EOS for analysis.
7.1 Detector geometry
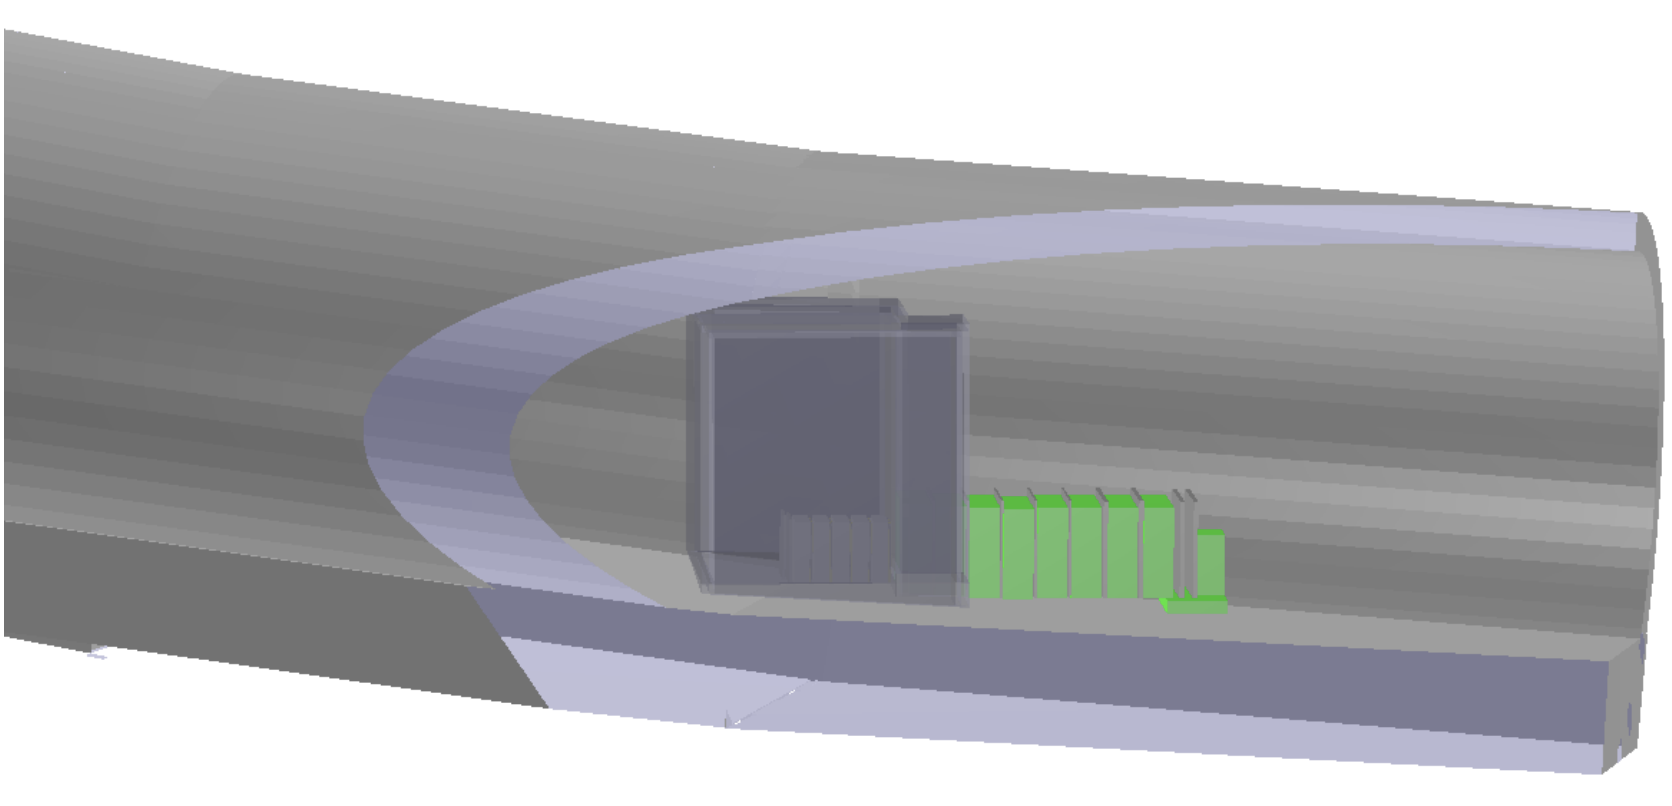
The detector geometry is implemented using the TGeo package of ROOT and used in the simulation by Geant4 as well as in the reconstruction. A model of the detector, the neutron shield and the surrounding tunnel can be seen in Figure 29. Electronic detectors and emulsion films are implemented as sensitive volumes. For the electronic detectors, the full granularity is implemented, from scintillator bars to individual scintillating fibres. The Geant4 simulation stops with the deposition of energy in the sensitive detectors. The digitisation step takes this energy and simulates an electronic signal, taking into account the transformation to photons, the light propagation and absorption along the scintillating fibre or bar, the photodetection efficiency of the SiPMs and the response of the front-end.
7.2 Simulation
Several simulation engines are available. Muons from IP1 simulated by FLUKA [20, 21] and transported through the detector by Geant4 [64], muon deep inelastic scattering using Pythia6 [65], DPMJET3 (Dual Parton Model, including charm) [22] or Pythia8 [66] for neutrino production at IP1 and GENIE [25] for the neutrino interactions in the detector target. In addition, Geant4 had been used to investigate the neutron shielding performance of various materials.
7.3 Data reconstruction
The event reconstruction is performed in two phases: the first one is performed during the data taking using the response of the electronic detectors. The second phase incorporates the emulsion data, that will be available about six months after the exposure.
First data became available from the testbeam campaign in H8 for the hadronic calorimeter and muon system, using a pion beam with different energies for the energy calibration studies. Data from a parasitic run in H6 with in addition the SciFi and Veto detector installed is also available. Theis data was used to make a first internal space alignment of the SciFi detector, with a subsequent alignment of the other detectors with respect to the SciFi. This will be repeated with the first data in TI18. The data was also used to determine the light propagation speed in the scintillator bars as well as the absorption length, as reported in Section 8.
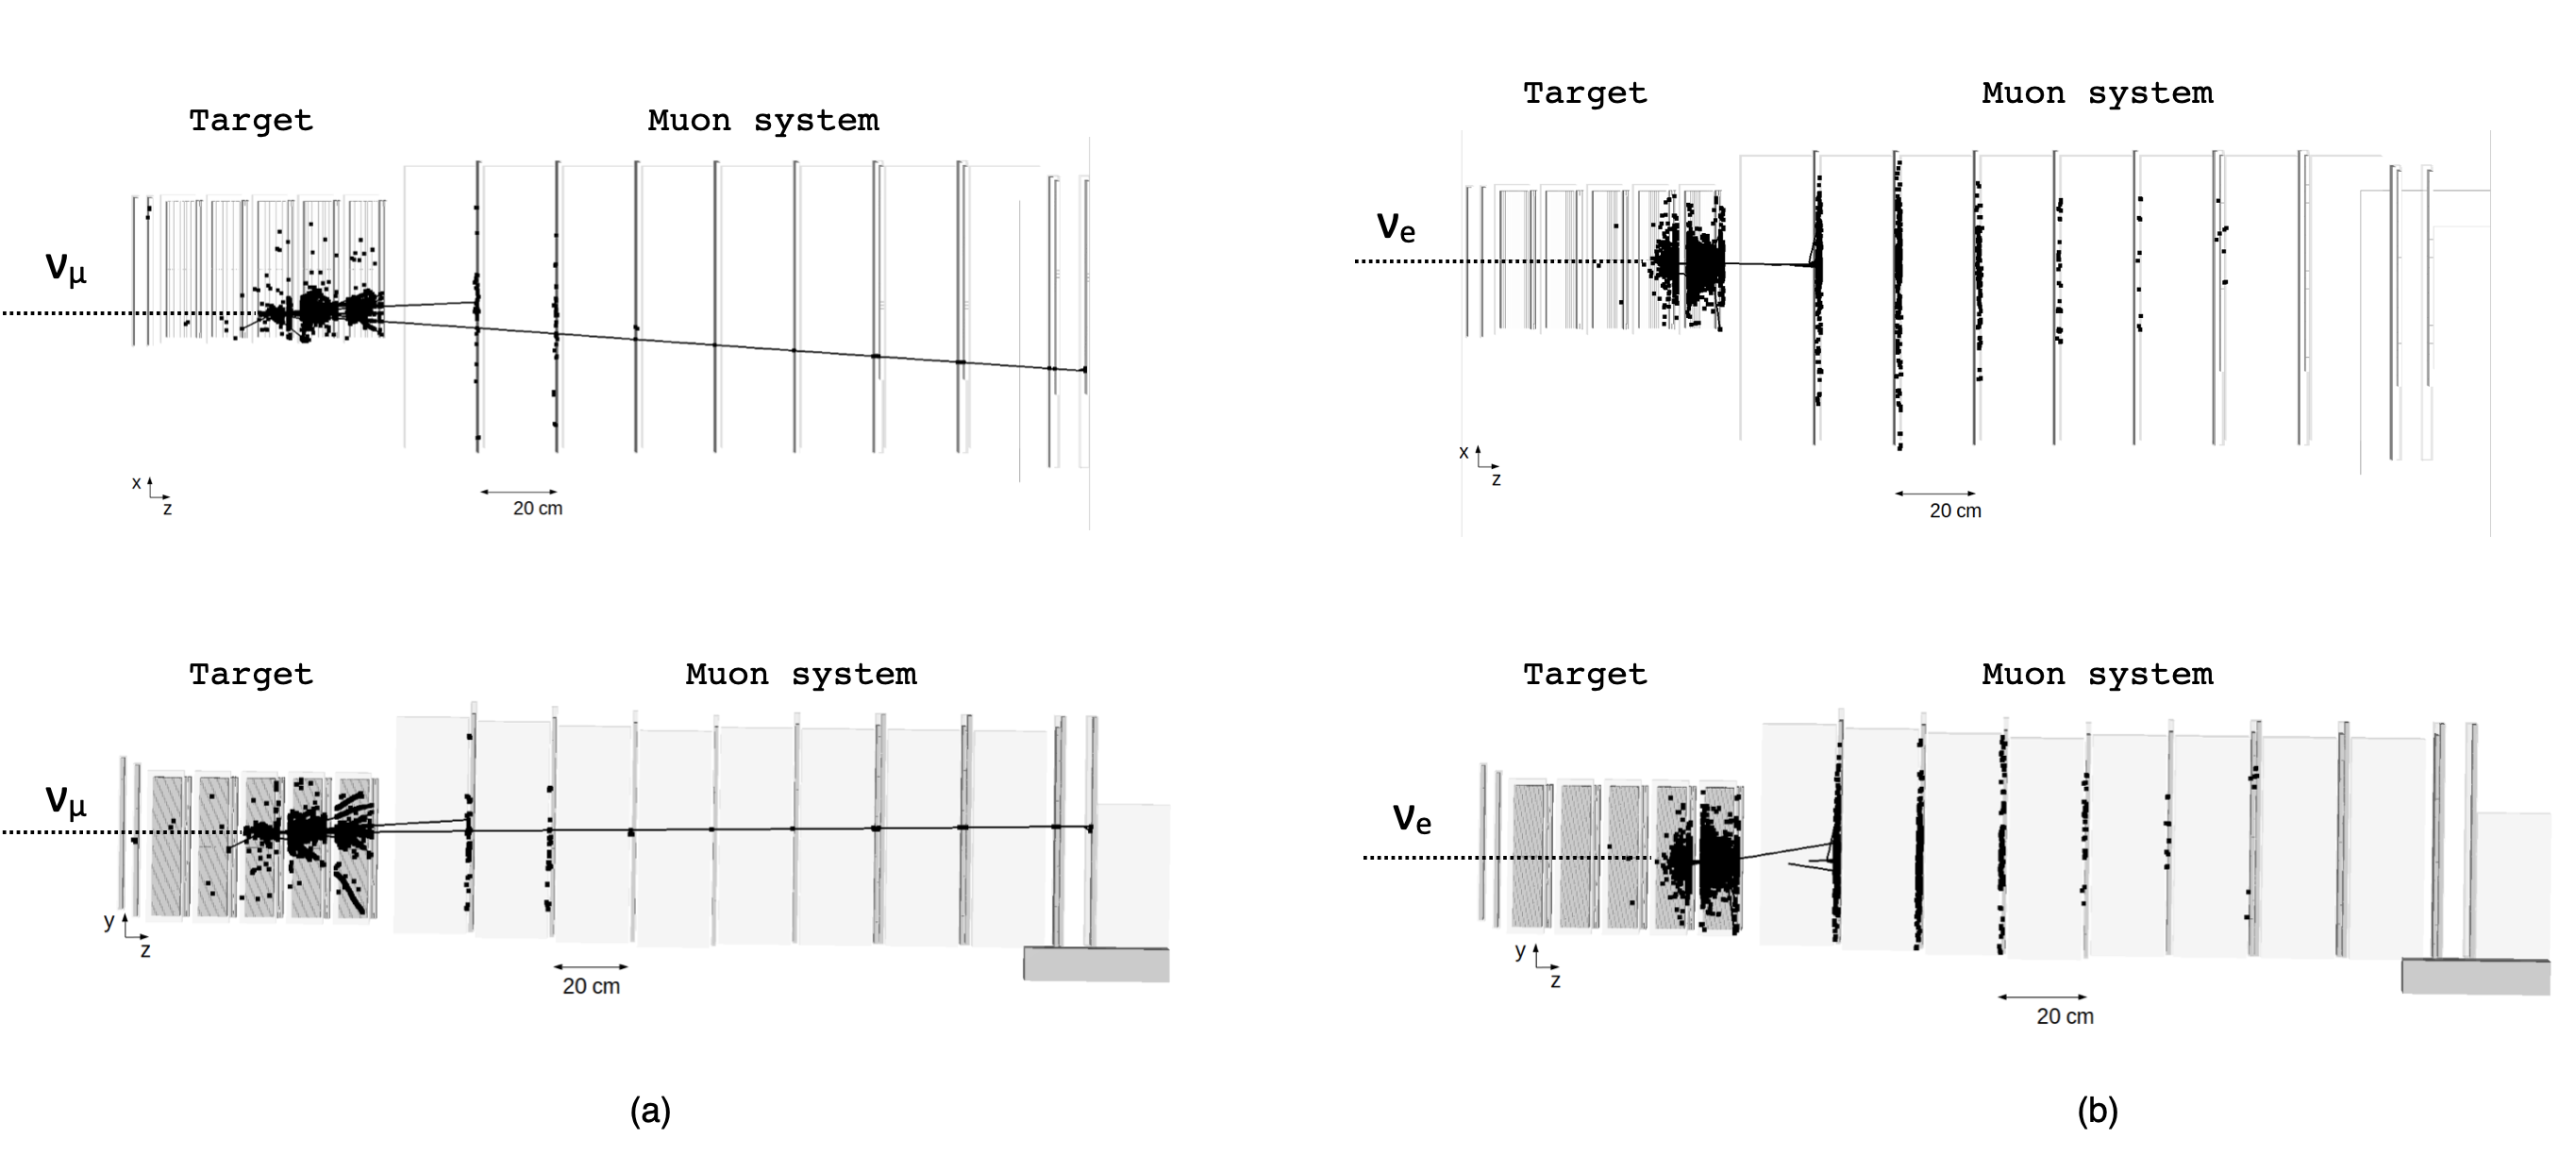
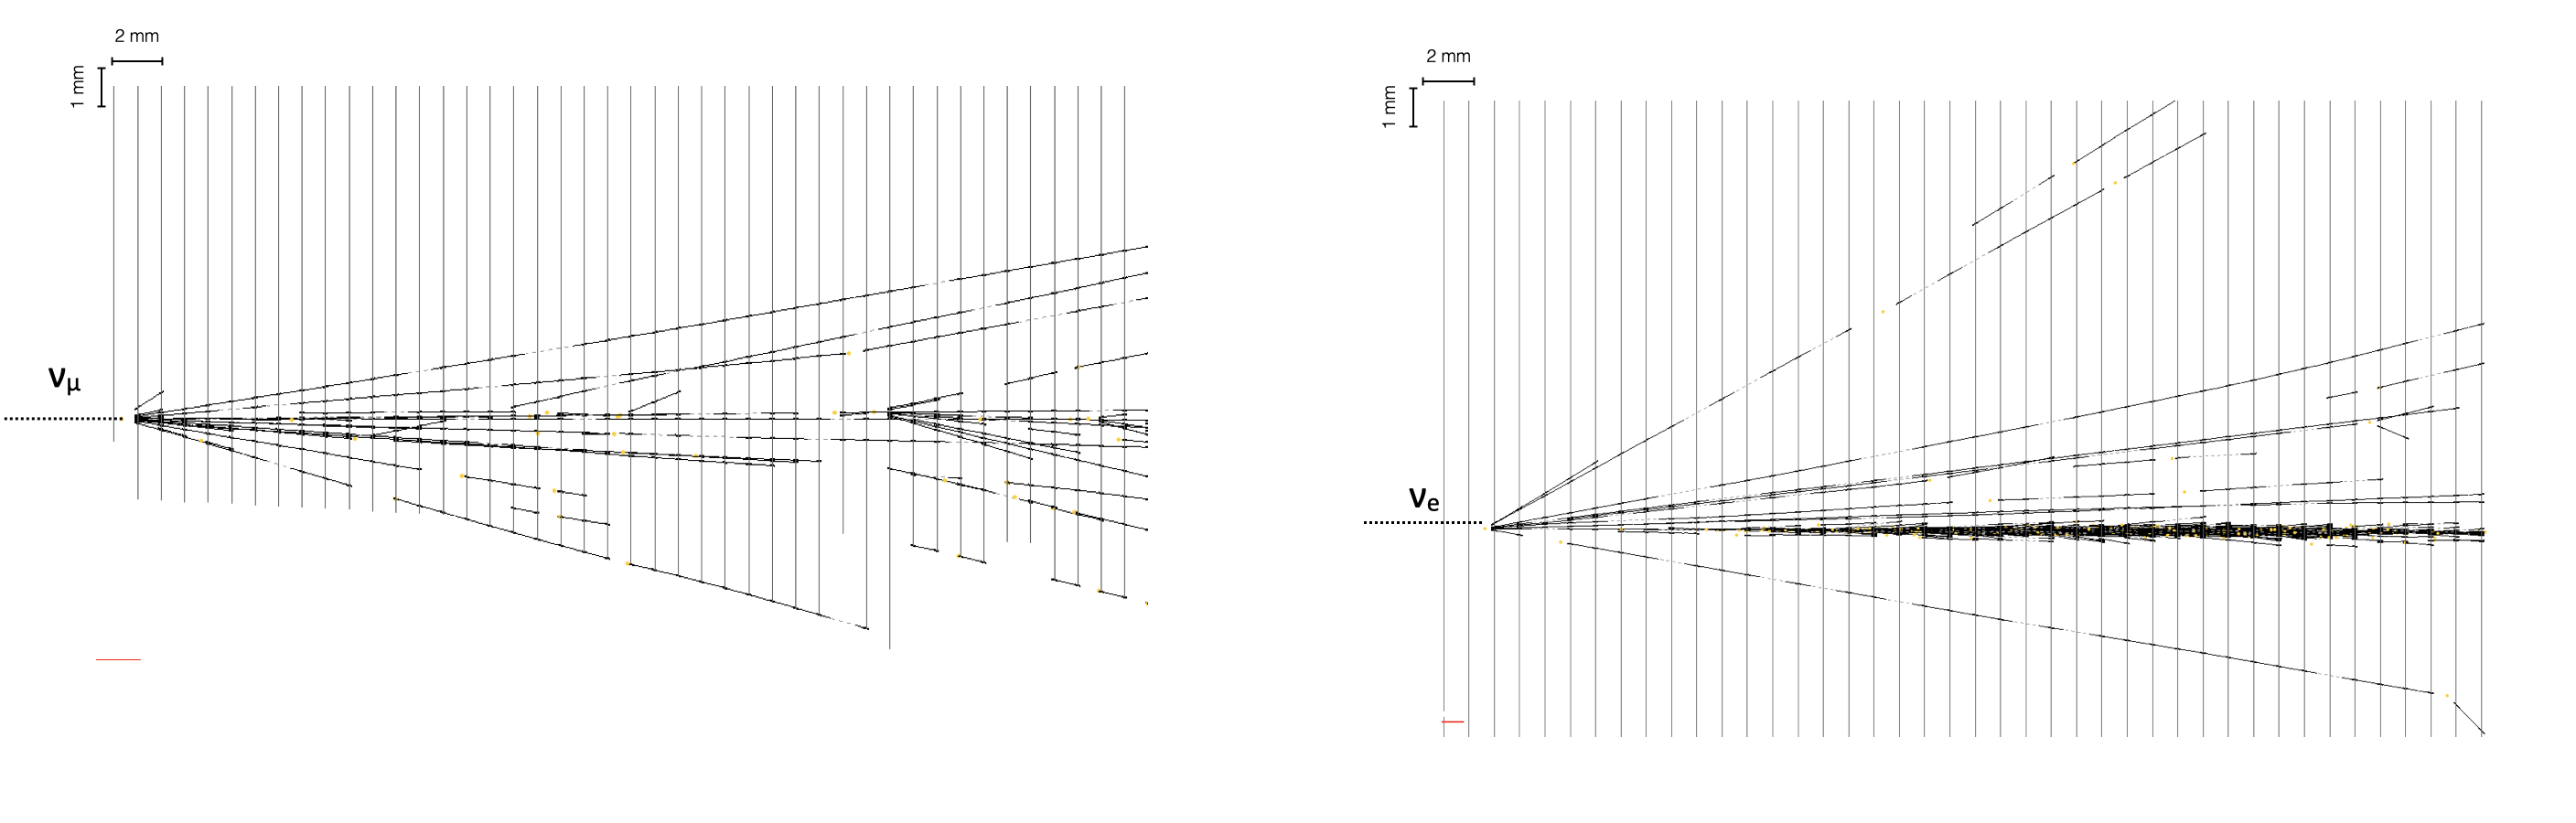
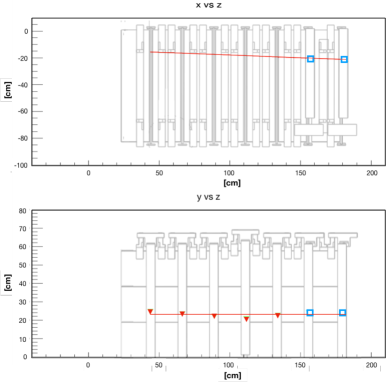
During Run 3 operation, the upstream veto planes will tag incoming muons that will be used for fine alignment between detector planes. The occurrence of a neutrino interaction or a FIP scattering will be first detected by the target tracker and the muon system. Electromagnetic showers are expected to be absorbed within the target region and will therefore be identified by the target tracker, while muons in the final state will be reconstructed by the muon system. In addition, the detector as a whole acts as a sampling calorimeter. The combination of data taken from both systems will be used to measure the hadronic and the electromagnetic energy of the event. A schematic representation of a and a charged-current interaction in the SND@LHC detector is shown in Figure 30.
The reconstruction of the emulsion data begins during the scanning procedure. Optical microscopes [50, 49, 51] analyse the whole thickness of the emulsion, acquiring tomographic images at equally spaced depths. After digitizing the acquired images an image processor recognizes the grains as clusters, i.e. groups of pixels of a given size and shape. Thus, the track in the emulsion layer (usually referred to as micro-track) is obtained by connecting clusters belonging to different levels. Since an emulsion film is formed by two emulsion layers, the connection of the two micro-tracks through the plastic base provides a reconstruction of the particle’s trajectory in the emulsion film, called base-track. The reconstruction of particle tracks in the full volume requires connecting base-tracks in consecutive films. In order to define a global reference system, a set of affine transformations has to be computed to account for the different reference frames used for data taken in different films. Muons coming from the IP will be used for fine film-to-film alignment. Once all emulsion films are aligned, volume-tracks (i.e., charged tracks which crossed several emulsion films) can be reconstructed. The offline reconstruction tools currently used for track finding and vertex identification are based on the Kalman Filter algorithm and are developed in FEDRA (Frame-work for Emulsion Data Reconstruction and Analysis) [67], an object-oriented tool based on C++ and developed in the ROOT [68] framework.
The topologies of some signal events that can be reconstructed in the SND@LHC brick are illustrated in Figure 31.
.
About twenty neutrino interactions are expected in each brick, given the replacement at every 25fb-1. The matching with the adjacent target tracker plane will be performed by aligning the centre-of-gravity of events reconstructed in the two detectors, thus assigning timing information to interactions reconstructed in the brick. The emulsion data will be also used to complement the target tracker system for the energy measurement of electromagnetic showers.
7.4 Emulsion scanning system
The emulsion readout is performed in dedicated laboratories equipped with automated optical microscopes, as the one shown in the left panel of Figure 32. The system analyses the whole thickness of the emulsion, acquiring tomographic images at equally spaced depths by moving the focal plane along the vertical axis.
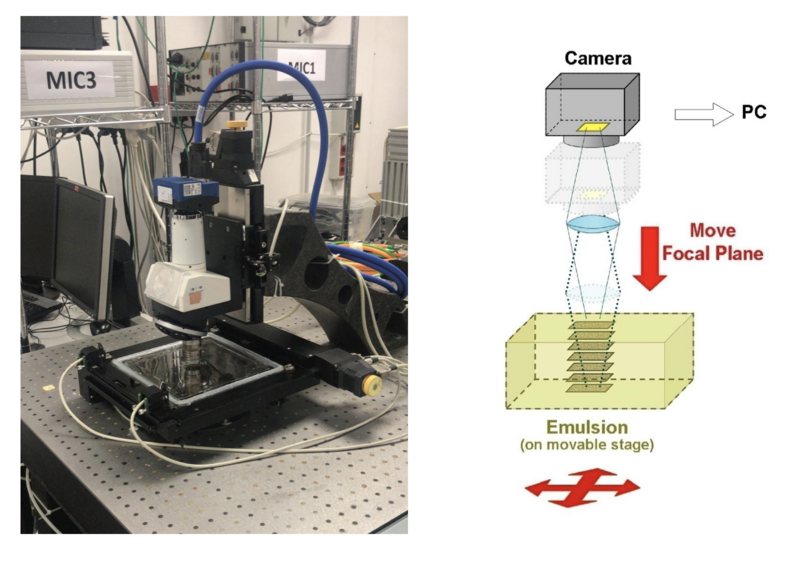
A recently developed upgrade of the European Scanning System (ESS) [48, 47, 69] combines the use of a faster camera with smaller sensor pixels and a higher number of pixels, a lower-magnification objective lens and a new software LASSO [50, 49], allowing to increase the scanning speed to 180 cm2/h [51], more than a factor ten faster than before. The lens of the microscope guarantees a sub-micron resolution and, having a working distance longer than 300 m in the direction perpendicular to the film, allows for a scan of both sides of the emulsion film. In order to make the optical path homogeneous in the film, an immersion lens in an oil with the same refraction index of the emulsion is used. A single field of view is 800600 m2. Larger areas are scanned by repeating the data acquisition on a grid of adjacent fields of view. The images grabbed by the digital camera are sent to a vision processing board in the control workstation to suppress noise.
The total emulsion-film surface to be scanned in SND@LHC is expected to be about m2 every four months, thus requiring at least ten scanning systems fully devoted to this activity in order for the readout time to be approximately equal to the exposure time.
8 Commissioning
Commissioning of electronic detectors and target mechanics largely took place in the autumn of 2021 in the North Area of the SPS. These tests included a test beam campaign of the hadronic calorimeter and muon system with hadrons using the H8 beamline as well as commissioning of all the electronics detectors with parasitic muons using the H6 beamline.
The first is necessary to tune Monte Carlo simulations for accurate shower reconstruction.
The commissioning in H6 was used to evaluate the performance of all electronic sub-detectors when read out together. In addition, part of the floor in the H6 beamline was inclined to reproduce the angle of the floor in TI18, to allow the commissioning of the mechanical support.
8.1 Pion test beam in H8
During test beam campaign in H8, all five US station and two DS stations, including passive iron blocks, were tested. A wall of iron wide, tall and thick was placed upstream of the first US iron block, reproducing the target region in terms of hadronic interaction lengths.


Besides an energy calibration measurement, the test beam served to investigate the appropriate DAQ settings for data taking. Three different gain settings of the QDC were investigated, , and . Calibration was performed for each gain setting before the beginnings of data taking. Subsequent tests on a spare PCB with a tuneable laser found that a gain setting of provided the most linear behavior of the recorded signal as a function of injected charge.
The system, shown in Figure 33, was exposed to 140 and positive pions and 240 and negative pions. Additional runs were taken with cosmic muons when the SPS beam was off and with halo muons when a beam dump was placed upstream to obstruct the beamline. During both test beam campaigns, the beam spot was about in diameter and the particle rate ranged from to .
Analysis of the test beam results is ongoing, with initial studies focusing on signal distributions, light attenuation lengths of the bars, detection efficiency, spatial and time resolution, timing calibration, signal propagation speed in the bar, event displays, saturation effects of the SiPMs, MC/data comparison, background estimation and hadronic shower evolution.
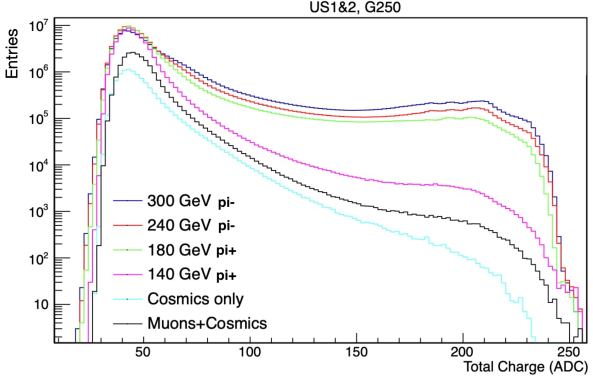
Some preliminary results from the test beams are presented here. The average signal size (in ADC counts) in each SiPM follows the distribution of a Landau distribution convoluted with a Gaussian one, as seen in Figure 34. A comparison of the total charge (expressed in QDC units) in the first two US stations for different energies is shown in Figure 35: a significant increase is noticeable in the step from to . This is not fully understood and will be investigated with a follow-up testbeam. Example event displays at and at a QDC gain setting of are displayed in Figure 36.
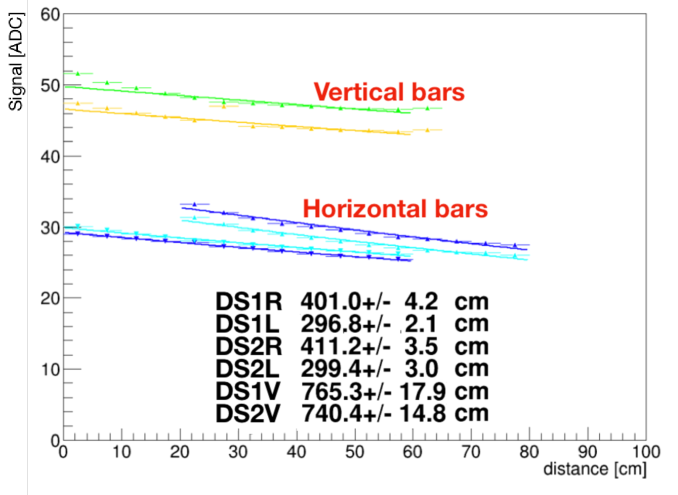
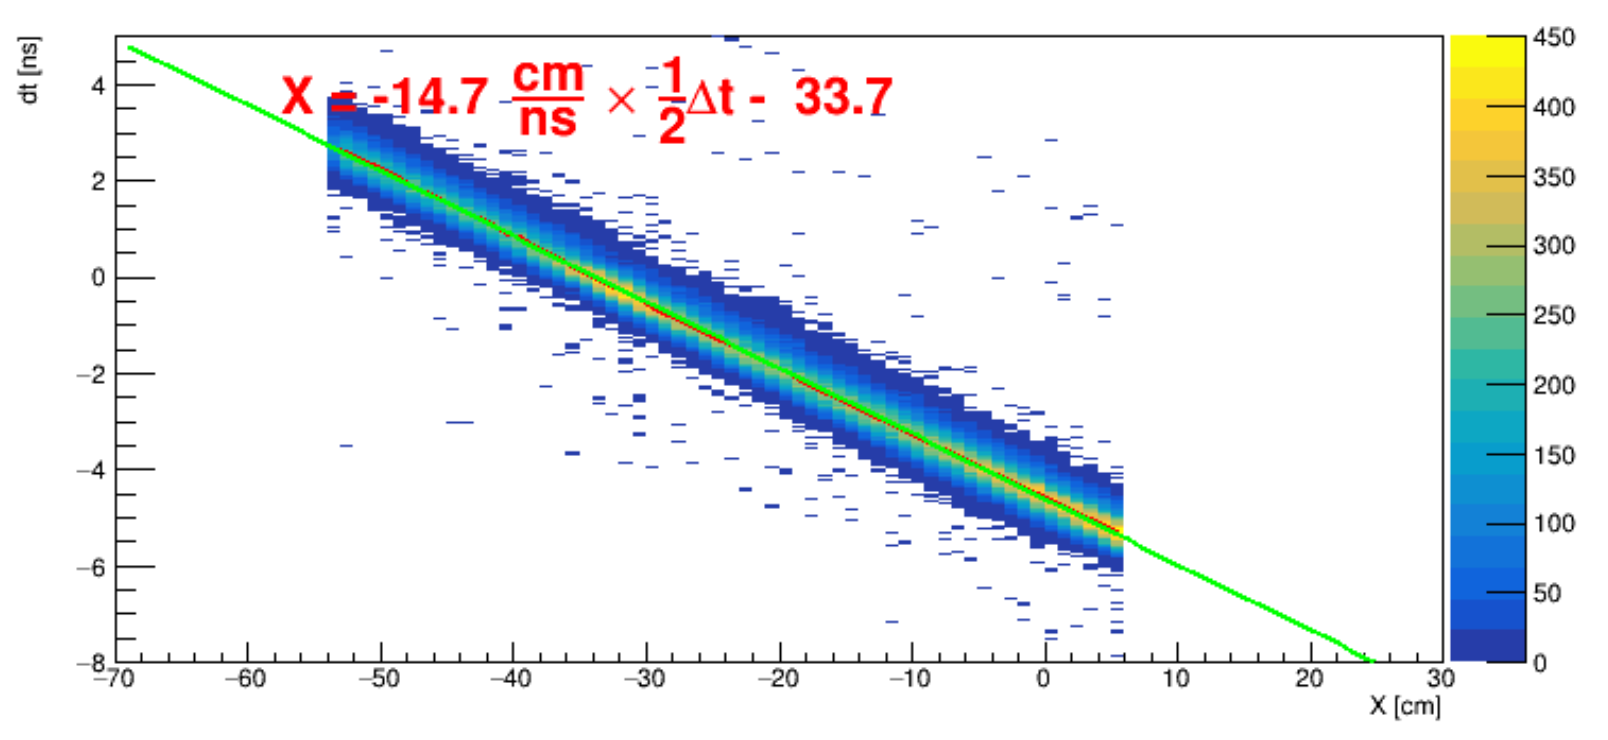
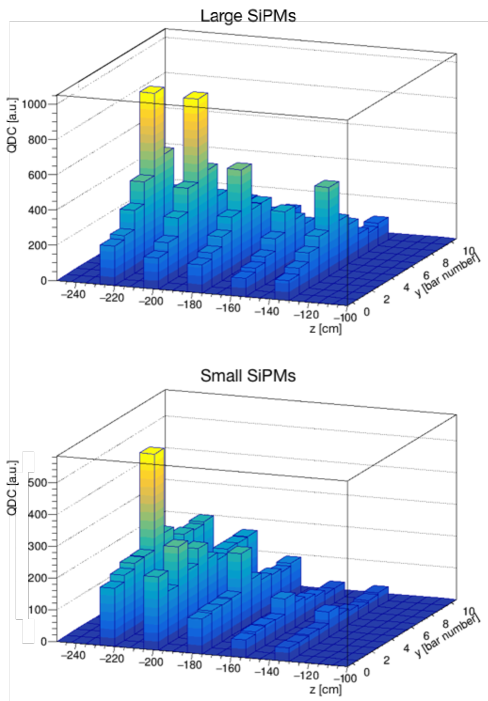
The signal as a function of position along the DS bars is shown in Figure 37 and the measured attenuation length of , obtained from the average of the listed values (with the values of the vertical bars taken as half the listed value, due to the presence light reflected off the bottom), is consistent with the value given by the manufacturer () [37]. The time difference between signals collected on opposite ends of a bar, as seen for a DS horizontal plane in Figure 38, can be used to calculate signal propagation speed along the bar which, at about , closely matches the literature value [70]. The response of the different SiPM types at and the highest gain setting for the US can be seen in Figure 39, with the small SiPM response indicating that hadronic showers are mainly contained in the first three layers. The drop seen in Figure 39 for the large SiPMs of the fourth US station is presumed to be due to dead channels on the PCB, although this is still under investigation.
8.2 Muon test beam in H6
All electronic detectors have been accurately tested before being installed in the TI18 tunnel. An important part of these tests has been performed in the H6 beamline of the CERN SPS, where all electronic subdetectors have been operated together for the first time.
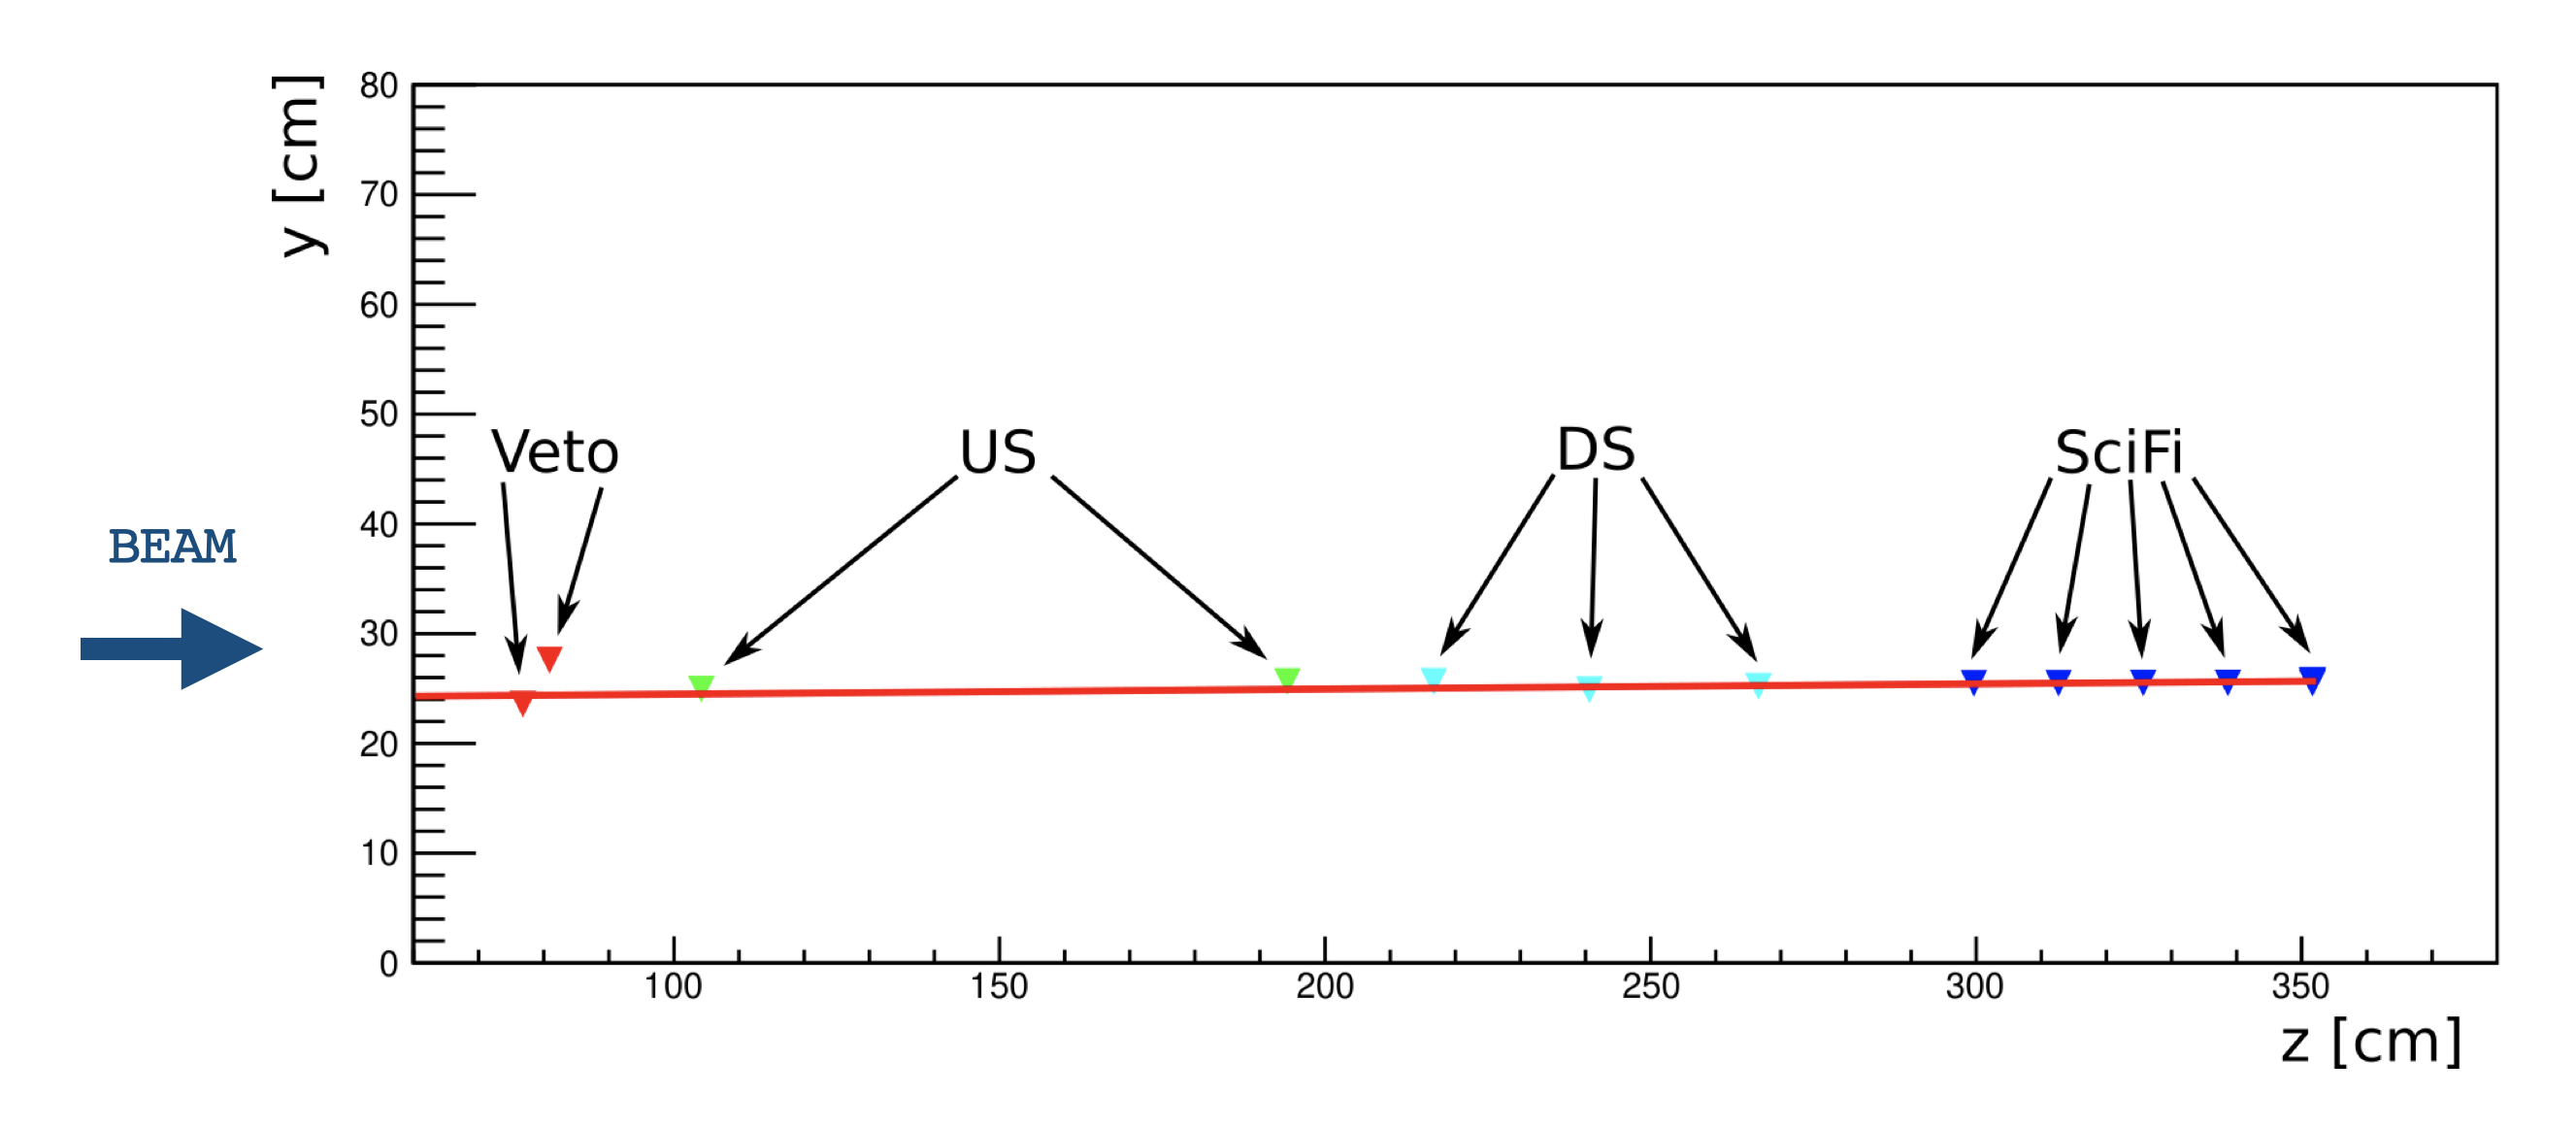
A picture of the setup installed in H6 is shown in Figure 40. Due to space constraints, the order of the detectors was not the same as in its TI18 configuration: the veto is placed right in front of the hadronic calorimeter, while the SciFi is located behind the hadronic calorimeter and muon system.
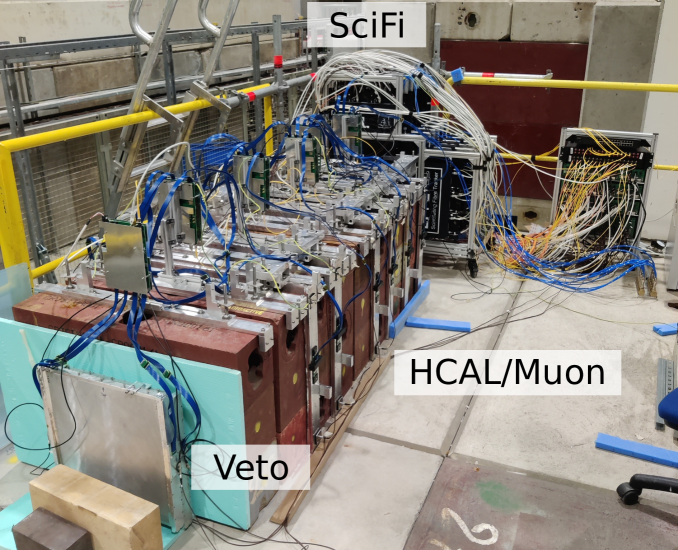
The measurements performed in H6 focused on the study of the performance and alignment of all subsystems. Several runs at different settings have been collected. The details for each sub-system are given in the following sections.
8.2.1 Veto, hadronic calorimeter and muon system results
Commissioning of the veto and muon systems were carried out in two phases, before and after the test beam in H8. The commissioning tests in H6 represented the first test of the veto and its electronics.
During the first commissioning phase, five US and two DS stations of the hadronic calorimeter and muon system were tested along with the SciFi. Ground loops were also discovered, leading to a significant noise increase and difficulties with DAQ calibration. This led to the introduction of a grounding cable between the ground of the HV and ground of LV, which were ready in the second phase of commissioning. During this phase, dimensions and spacing of the veto system within the target structure mechanics were also checked.
In the second phase, the target structure mechanics was removed and the veto was placed directly in front of the muon system, with the SciFi placed further downstream. A third DS station was also added. It was discovered that PCBs on three US stations and two DS stations displayed a number of missing channels, which were then removed from the experimental hall for repair. The remaining stations were then tested along with the veto and SciFi, with the addition of grounding cables to the veto and muon system as mentioned before. An example of an event display including all electronic sub-systems is shown in Figure 41. Preliminary analysis of the data also indicated missing channels in two PCBs of the veto system, which were sent for repair at the end of the commissioning phase.
8.2.2 SciFi results
Several runs in different conditions were collected: the T1 and T2 thresholds, described in Section 6.1.2, were varied, while the E threshold was not used. T1 is lower and determines the timestamp of the hit, so its influence on the time resolution was studied, while T2 is higher, and determines whether a hit is collected or not. It was studied to find the optimal compromise between dark-count rate and efficiency. In addition, data were collected at three different QDC gain values: , and .
The alignment of the SciFi stations, both their relative position and the inner degrees of freedom within one station, were studied by performing track reconstruction using four of the five stations, extrapolating the reconstructed tracks on the fifth one and minimizing the residuals, i.e. the difference between the track extrapolation and the corresponding cluster position.
Results obtained for one station are shown in Figure 42. They show that the alignment procedure works as expected, as the residuals distribution is peaked at 0 and that the spatial resolution of the SciFi system is below .


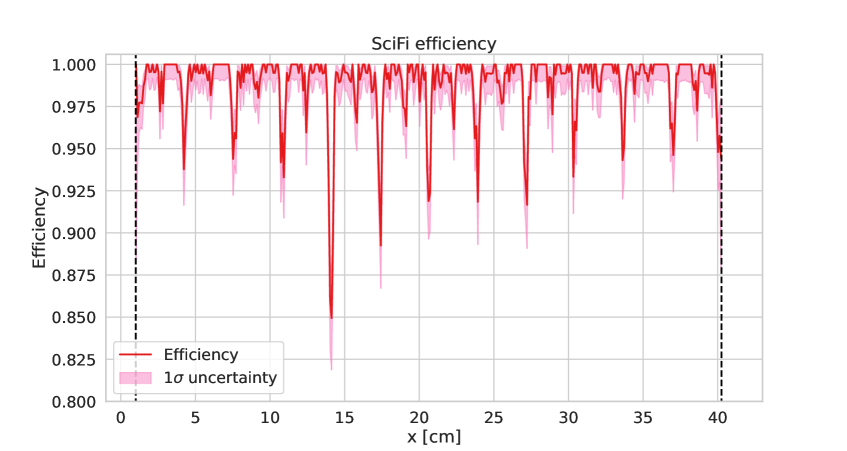
The particle detection efficiency of the SciFi detector was studied at two different T2 thresholds (a higher one, producing of dark rate per channel and a lower one, producing ). The efficiency was studied similarly to the alignment, by reconstructing tracks using four stations, extrapolating them to the fifth one and looking for an associated cluster within a radius of . The efficiency is calculated as the ratio between the tracks with associated cluster (in the plane, plane or both) and the total number of tracks.
At low threshold, the efficiency is over the whole station, while it drops down to at the higher threshold. This result, in combination with the maximum hit rate allowed by the DAQ server (see Section 6.1.4) lead to the decision of running the detector an even lower T2 threshold, producing of dark rate per channel. The efficiency of a representative SciFi layer at this threshold is shown in Figure 43. All layers show a consistent efficiency of , which raises to if the gaps between SiPMs are excluded from the computation.
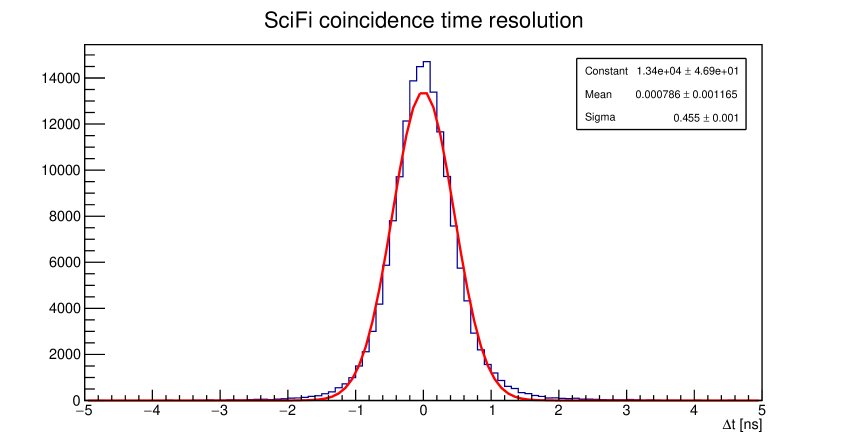
The time resolution of the SciFi tracker is limited by the number of detected photons and the scintillator decay time. It has been measured by calculating the coincidence time resolution (CTR) between two fibre layers, correcting for the light propagation delay in the fibres. The results are shown in Figure 44: each fibre layer has a time resolution of , which translates in per plane or for the whole target tracker
8.2.3 Commissioning of the target structure
In order to perform the commissioning of the target mechanical structure, the upstream section of the floor in H6 was inclined by to reproduce the floor inclination in the TI18 tunnel. The whole structure was assembled and installed on the three alignment feet, as shown in Figure 45.
A test of the transportation along the slope of the wall box with the trolley, of the insertion and extraction of the wall box inside the structure, as well as of the fixation of the SciFi plane was successfully performed.
8.3 Target wall commissioning
The commissioning of the target wall was performed in November 2021 at the Emulsion Facility at CERN. A test with a first batch of emulsion films was conducted in order to test the chemical compatibility of tungsten plates with emulsions, the light tightness of the wall box, the uniformity of track reconstruction in different bricks and in different positions within the brick.
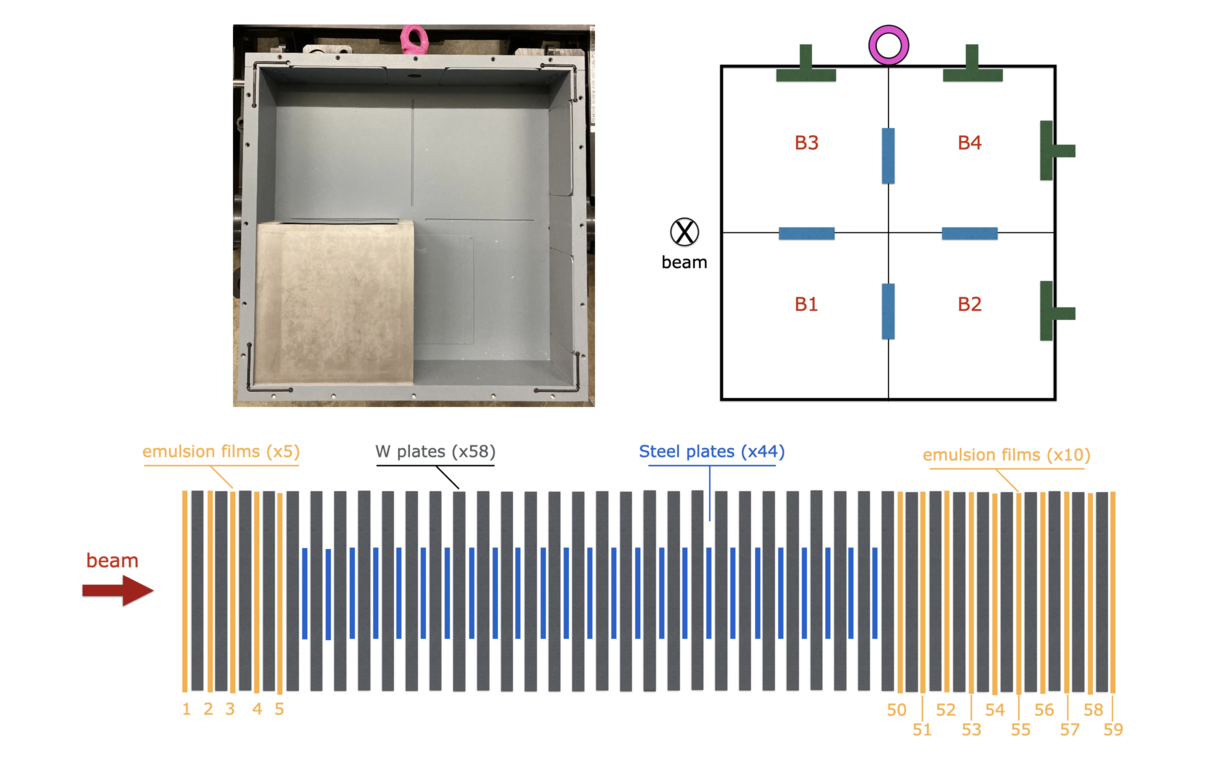
A full wall made of four bricks, each consisting of 58 tungsten plates, was assembled in dark room conditions. A stack of 30 emulsion films were used for the test, disposed in two bricks (B1 and B4) as reported in the schematic drawings in Figure 46. Steel plates with a surface of and a thickness of were used to replace emulsion films in the remaining part of the walls.
After the assembly, the wall box was exposed to cosmic radiation for without any dedicated shielding. Then emulsion films were developed and scanned with automated optical microscopes in one of the emulsion scanning laboratories of the Collaboration. During the scanning, aligned grains in adjacent emulsion layers are recorded by a camera and stored as digital pixels. After the scanning, an image processor recognized aligned clusters, formed by groups of pixels. These clusters need to be separated from a background of thermally excited grains, which get developed even if not exposed to radiation. This background is usually referred to as fog, and its density was measured by counting the number of grains per unit volume in both emulsion layers. An average grain density of per was measured, compatible with that of reference ( not exposed) emulsion films, showing that contact of the films with neither the tungsten plates nor the internal coating of the wall had chemically contaminated the emulsion. The grain density was measured in different points of the emulsion surface and for different positions of emulsion films within the brick, demonstrating the light tightness of the wall box.
After the scanning, the reconstruction process was performed, as described in Section 7. The position and angular distributions of reconstructed base-tracks in an emulsion film are shown in Figure 47. A good alignment between consecutive films was obtained, proving that the distortion of the emulsion films is negligible. The tracks are distributed uniformly on the surface, as expected. Since the target was placed horizontally during the exposure, the cosmic rays crossed the emulsion films perpendicularly to their surface, leading to a peak of reconstructed tracks at low angles.
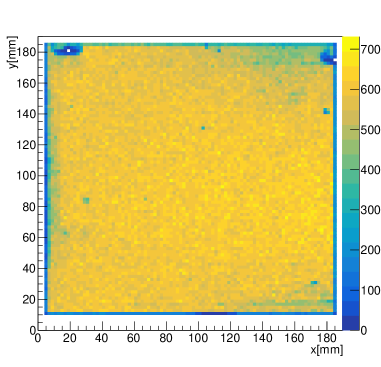
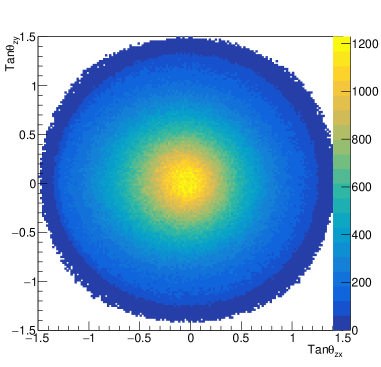
Finally, track reconstruction in the whole target is performed, with a Kalman filter seeded on the base-tracks recorded in the single emulsion films. Comparing the position and angle of each base-track with a linear fit on the and planes leads to an estimation of the tracking resolution. The results are reported in Figure 48, with Gaussian fits leading to for the position and for the slope as the tangent of track angle in the plane ().


The average surface density amounts to tracks/cm2, reconstructed in the angular range from 0 to 1 rad. Over a total exposure time of 48 hours, this density corresponds to a flux of muons//min. The expected cosmic-ray in the same angular acceptance amounts to about 0.73 muons//min. The discrepancy can be attributed to the energy threshold for reconstructed tracks, which are required to pass through the Tungsten layers.
Track reconstruction was performed on both the upstream section (five emulsion films) and downstream section (ten emulsion films) of the two exposed ECC bricks. As an example, a display of the reconstructed tracks in the downstream section of one brick is reported in Figure 49.

9 Infrastructure and detector installation in TI18
The TI18 tunnel, shown in Figure 50, was initially constructed for injection of positrons from the SPS to the LEP accelerator. It is long and has mostly a steep slope of about , but levels out as it enters the LHC ring via the junction cavern UJ18 in the LHC Sector 12, about from the ATLAS interaction point. The LEP machine elements in TI18 were removed during the preparatory works for the LHC but the tunnel was left unused. All but the last short section of about before entering UJ18 has been closed off. At the level of the floor, this short section crosses the collision axis of IP1, making the location particularly suitable for the high pseudo-rapidity region sought by the experiment. At this location, the tunnel has a slope of and a -wide floor.
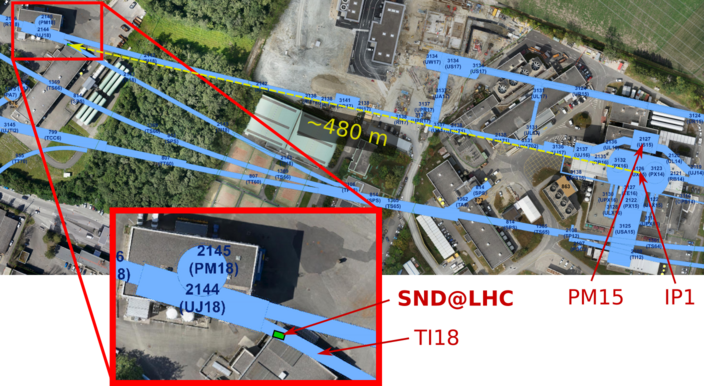
Detailed integration studies showed that the detector could be constructed on the floor without any modification to the tunnel structure. Yet, the use of TI18 presented a number of challenges. Firstly, TI18 is on the outside of the LHC ring while the transport path from the access shaft PM15 at IP1 to UJ18 is on the inside, requiring preparation of dedicated transport paths above and under the machine for the infrastructure and detector components. The transport path had to be made compatible with the machine cryogenics under helium pressure. Secondly, TI18 was lacking all services in terms of ambient lighting, power, cooling and safety as required by the experiment.
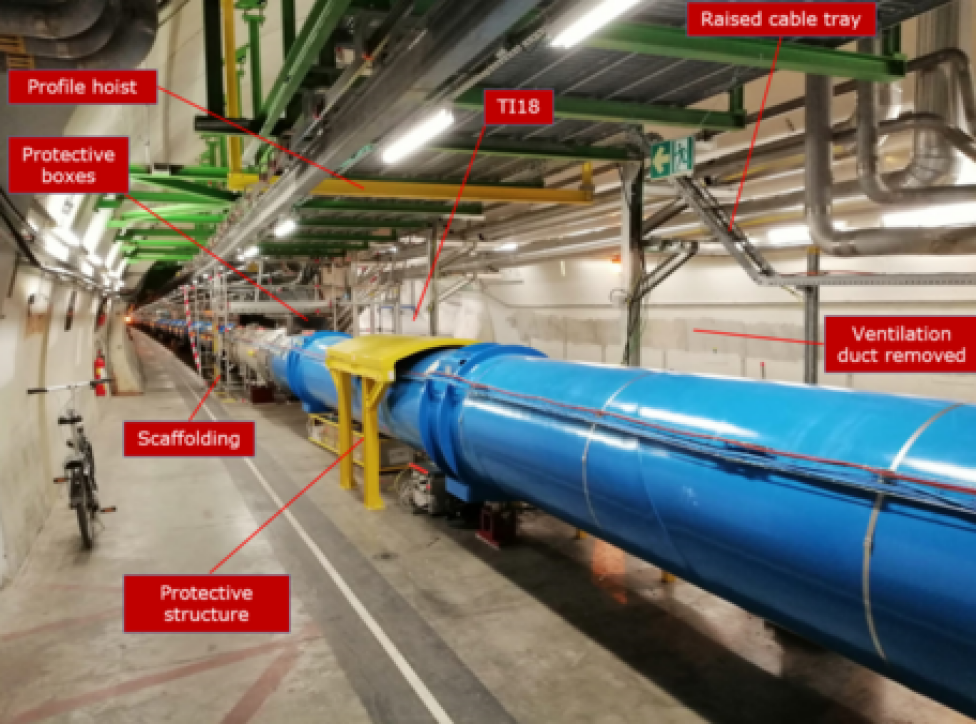
Figure 51 shows the main modifications in UJ18. The transport path over the machine is ensured by an added rail fixed to the UJ18 ceiling and carrying a manual hoist with a capacity. A protective table, capable of resisting against a fall of an object of up to , was produced and installed under the hoist and over the cryostat. A transport volume of was opened up by modifying the location of the existing cable trays. Space below the machine was also freed to guarantee a path for transporting smaller objects with the help of low-profile trolleys. The passage will also be used to pass the trolley for the exchange of the emulsion walls during the run (Figure 13b).
Space for storage of detector components and assembly was freed by removing obsolete ventilation ducts in UJ18. This allowed for detector components and infrastructures items to be brought in batches to avoid transport bottlenecks in the LHC access system. The required detector electrical power of could be provided from the existing electrical grid in UJ18. A dedicated circuit with an electrical box and associated emergency stop buttons were installed in TI18.
Figure 52 shows an overview of the service and detector integration in TI18, together with detailed images of the experimental area. To free additional space for the detector installation in TI18, a -long and obsolete ventilation duct was removed.
The neutron-shielded box that surrounds the target region has dimensions of and is shown in Figure 53. In order to provide the required shielding, the walls of the box are made of acrylic and borated polyethylene panels, having a thickness of and , respectively. The whole structure is sustained by a skeleton of aluminium profiles. Doors on the upstream side and the corridor side of the detector provide easy access for maintenance and for emulsion wall replacements. The neutron-shielded box is equipped with a closed circuit cooling system that guarantees a stable ambient relative humidity and temperature of and , respectively, as required in order to prevent fading of the emulsion films.
Two racks were installed in TI18 to house the detector power supplies and readout system, and dedicated optical fibre tubes were installed over in the LHC tunnel in order to connect with existing fibres up to the surface rack that is hosting the timing system, and the DAQ and control computer servers.
The eight iron walls of the muon system, each with dimension and a weight of , rest on horizontal steel base plates which were positioned at an accuracy of and grouted against the floor to compensate for the tunnel slope. Together with a smaller iron block at the end, the walls are by themselves providing the support for the mechanical structure holding the eight muon detector planes. The emulsion walls and the SciFi planes are carried by the target system structure that is grouted to the existing floor with custom-made wedges. All detector components were aligned with an accuracy of .
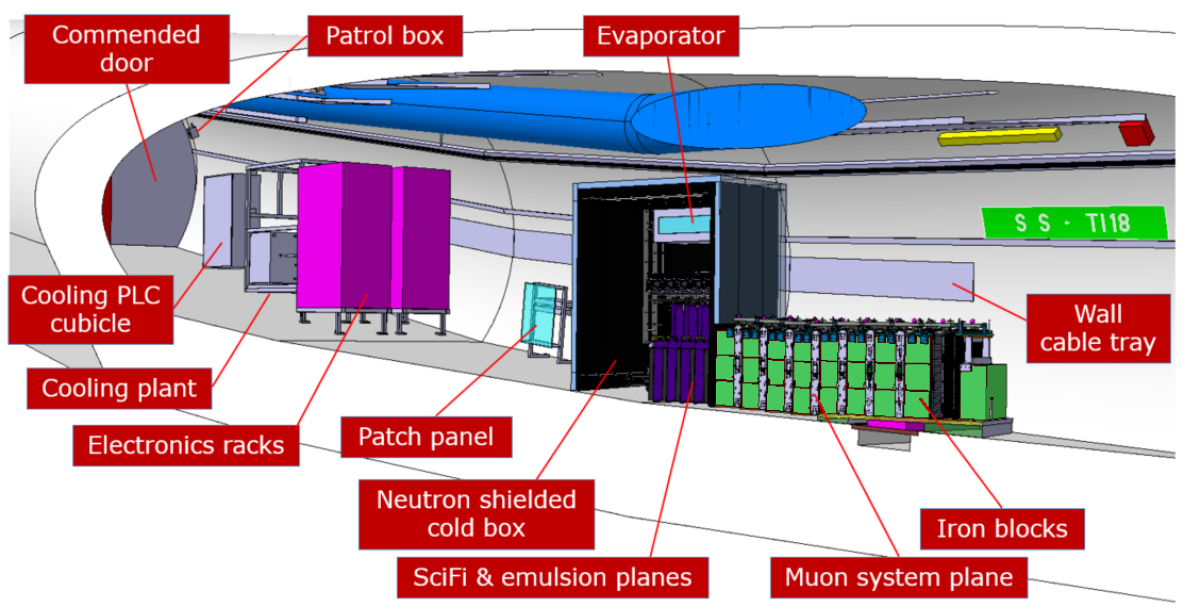
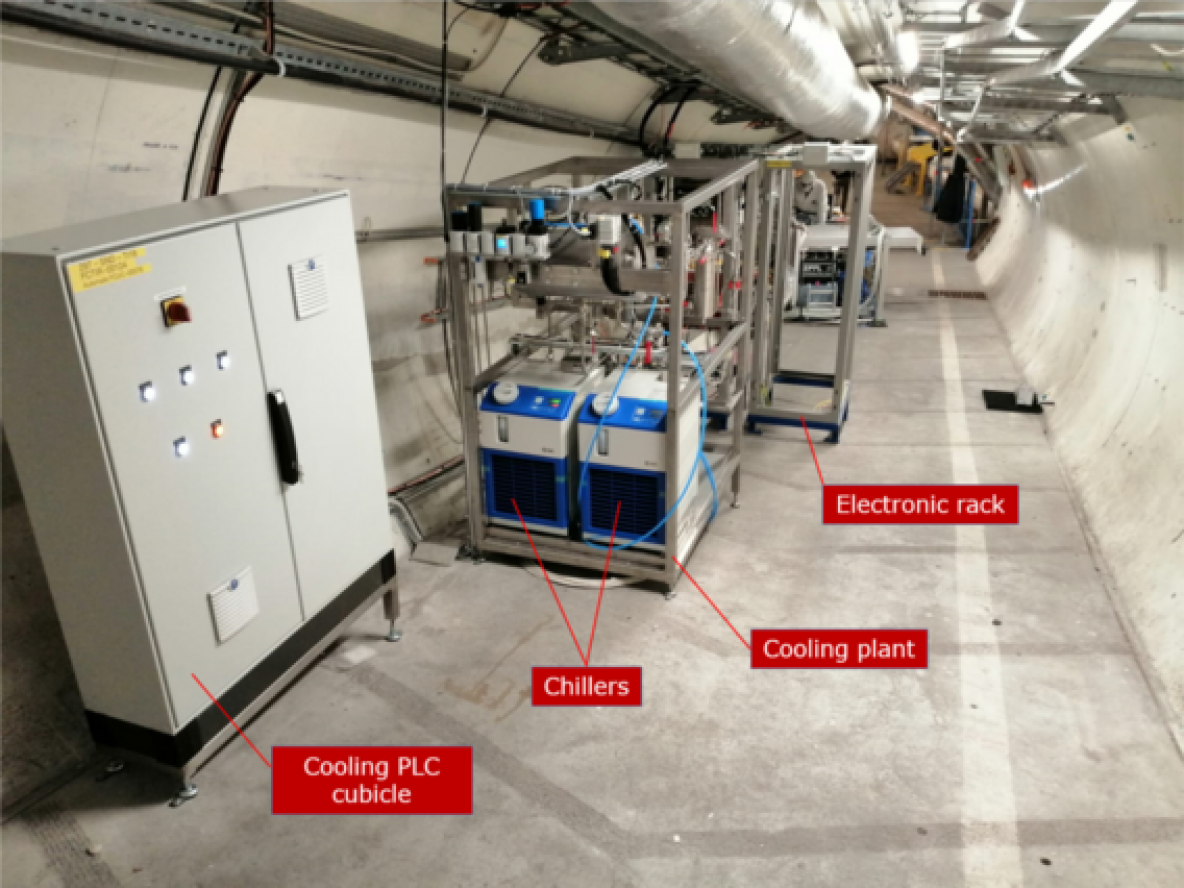
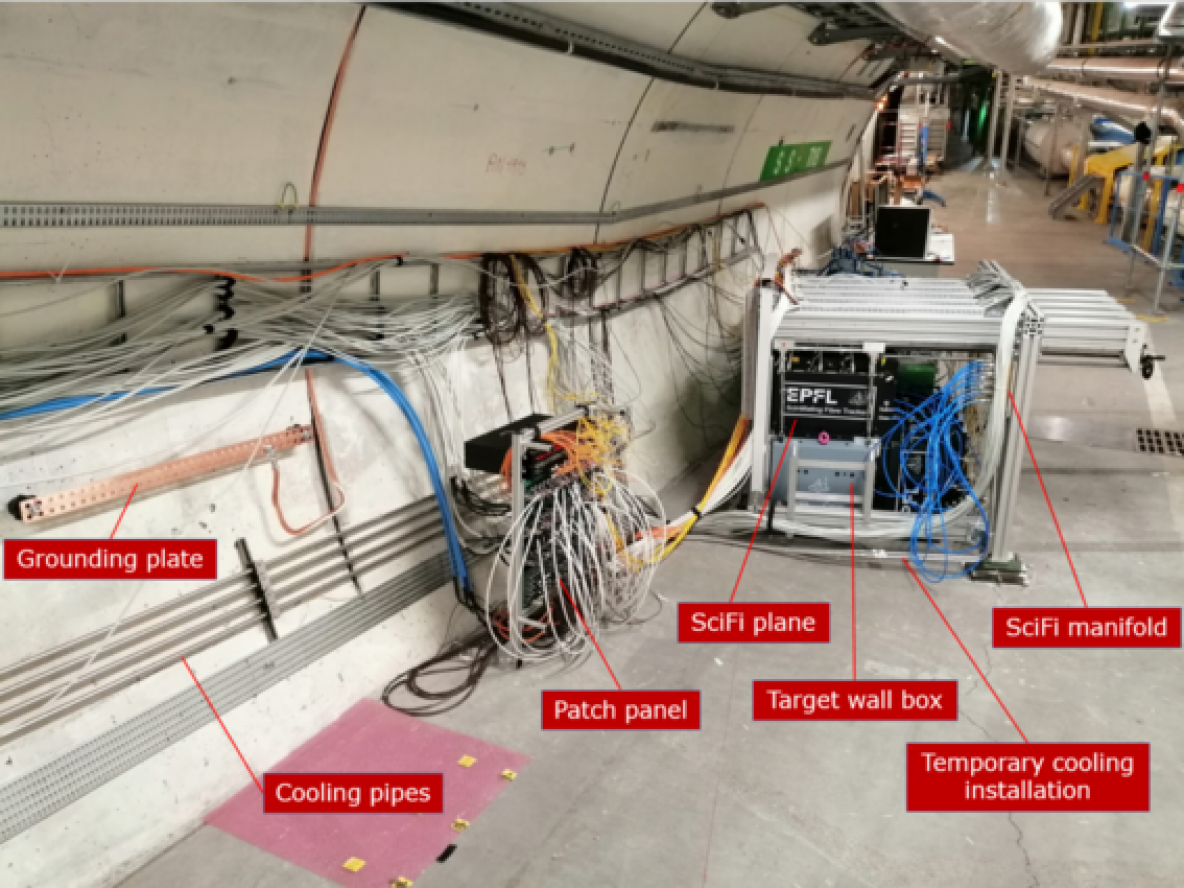
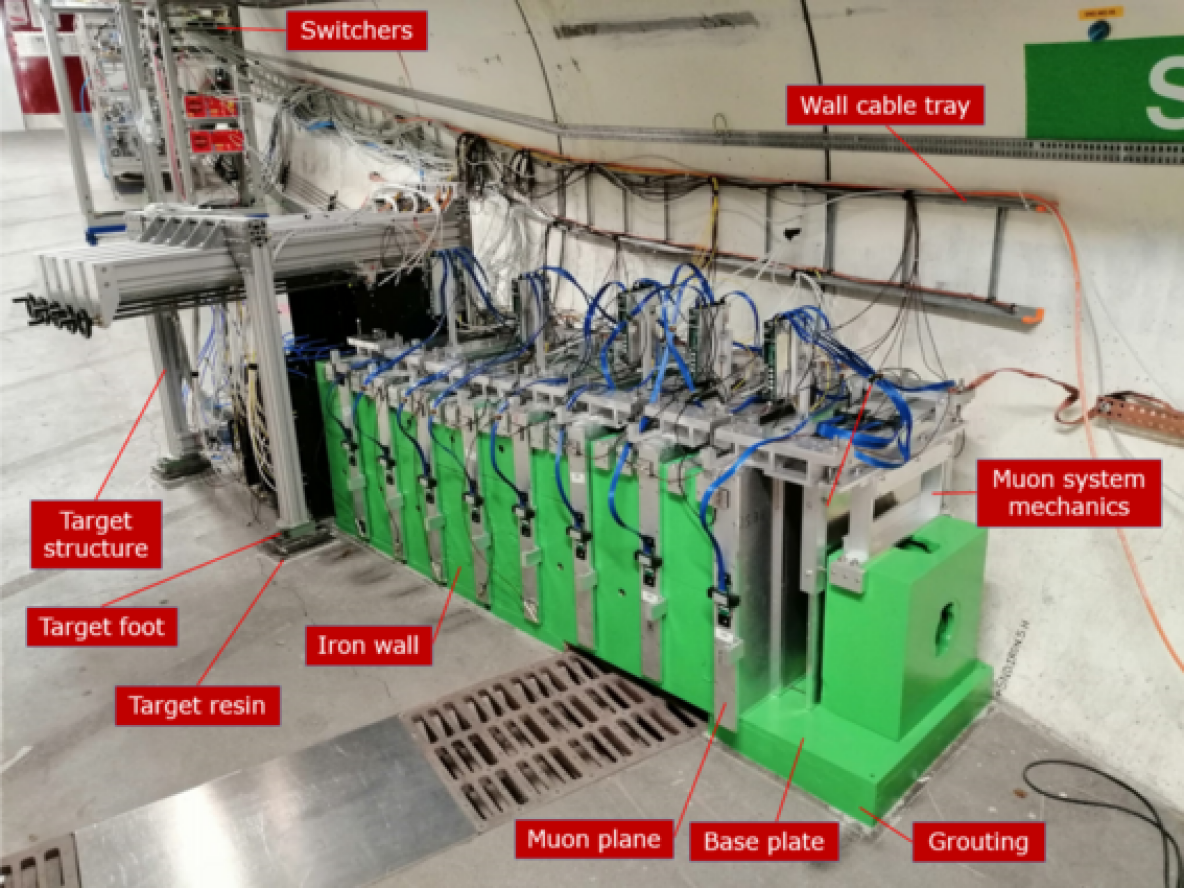
The goal of being ready for data taking at the start of the LHC Run 3 in 2022 limited the entire schedule for the infrastructure, detector installation and commissioning to nine months. The final phase of the LHC Long Shutdown 2 and the preparation of the machine for startup in 2022 set additional strict constraints on the planning. A large part of the works had to be done with the LHC dipoles cooled to , requiring further attention on the procedures. The main infrastructure modifications in UJ18 and TI18 were performed between the end of June and September 2021. September and October were dedicated to detector assembly and beam tests on the surface in the North Area Hall EHN1, while LHC was closed for the pilot run.
The detector installation, including the iron blocks, cooling plants and the related electronics, was successfully carried out in November and December, allowing the start of global commissioning by the end of December 2021. The neutron shield surrounding the target region was constructed in January and February 2022 and completed underground by March 15th. A picture of the full detector installed in TI18 is shown in Figure 53.
On April 7, one-fifth of the target region was partially instrumented with emulsion films, together with a few independent small emulsion bricks to check machine-induced background during the LHC commissioning, as the very final step of the detector installation. On May 24, SND@LHC registered the first muons from pp collisions and at the beginning of July the first ever events at a centre-of-mass record energy of were recorded. The first target fully equipped with emulsions was installed on July 26 and emulsion were replaced three times during the 2022 run, integrating a total of .
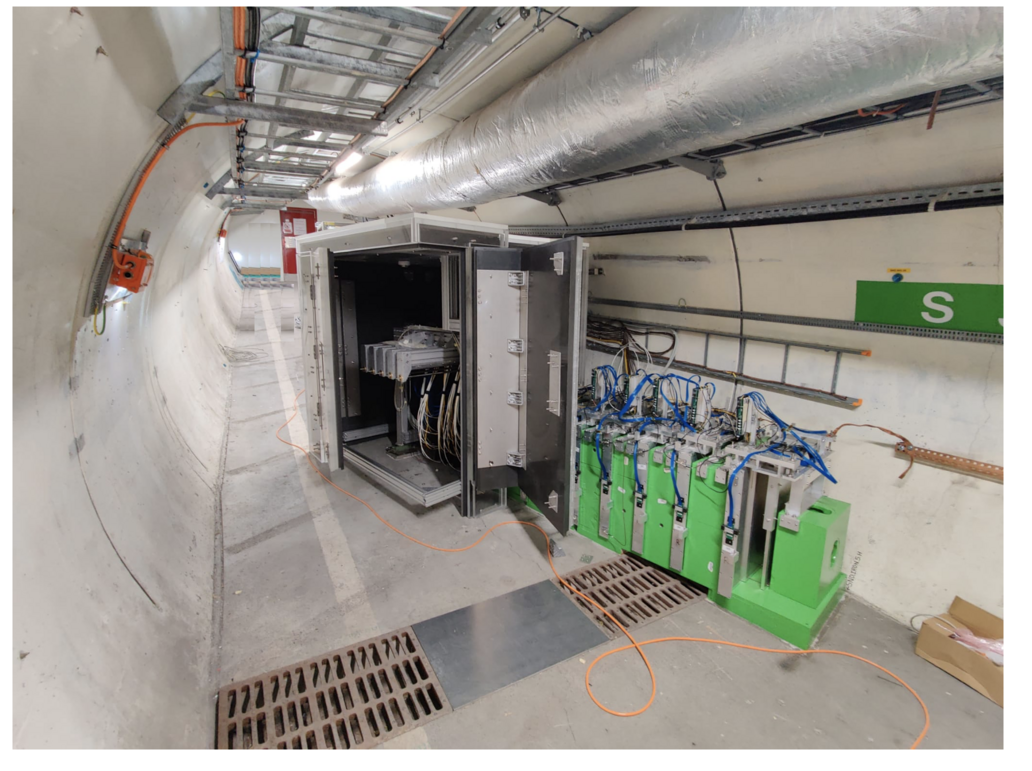
10 Ideas for an HL-LHC upgrade
An advanced version of the SND@LHC detector is envisaged for the HL-LHC. It will consist of two detectors: one placed in the same region as SND@LHC, and the other one in the region . The first apparatus will have a similar angular acceptance as for the SND@LHC and will perform the charm production measurement and lepton flavour universality tests with neutrinos at the percent level; the second detector will benefit from the overlap with LHCb to reduce systematic uncertainties and will perform neutrino cross-section measurements. In order to increase the azimuth angle coverage of the second detector, the idea is to search for a location in existing caverns, closer to the interaction point. We consider this second module as a near detector meant for systematic uncertainty reduction.
Each detector will be made of three elements. The upstream one is the target region for the vertex reconstruction and the electromagnetic energy measurement with a calorimetric approach. It will be followed downstream by a muon identification and hadronic calorimeter system. The third and most downstream element will be a magnet for the muon charge and momentum measurement, thus allowing for neutrino/anti-neutrino separation for and for in the muonic decay channel of the lepton.
The target will be made of thin sensitive layers interleaved with tungsten plates, for a total mass of 5 tons. The use of nuclear emulsion at the HL-LHC is prohibitive due to the very high intensity that would make the replacement rate of the the target incompatible with technical stops. The Collaboration is investigating the use of compact electronic trackers with high spatial resolution fulfilling both tasks of vertex reconstruction with micrometric accuracy and electromagnetic energy measurement. The hadronic calorimeter and the muon identification system will be larger than 10 which will bring the average length of the hadronic calorimeter above 11.5 , thus improving the muon identification efficiency and energy resolution. The magnetic field strength is assumed to be about 1 T over a 2 m length.
The configuration of the detectors allows efficiently distinguishing between all three neutrino flavours and measure their energy. The SND@LHC upgrade will open a unique opportunity to probe physics of heavy flavour production at the LHC in a region inaccessible to other experiments.
11 Acknowledgements
The support from the ANID–Millennium Program–ICN2019_044 is acknowledged. The support from the Marie Sklodowska-Curie Innovative Training Network Fellow-ship of the European Commissions Horizon 2020 Programme under contract number 765710 INSIGHTS is acknowledged. This research was carried out in the frame of Programme STAR Plus, financially supported by UniNA and Compagnia di San Paolo.
References
- [1] N. Beni et al., Physics Potential of an Experiment using LHC Neutrinos, J. Phys. G 46 (2019) 115008 [1903.06564].
- [2] C. Ahdida, R. Albanese, A. Alexandrov, M. Andreini, A. Anokhina, A. Bay et al., SND@LHC - Scattering and Neutrino Detector at the LHC, Tech. Rep. CERN-LHCC-2021-003, LHCC-P-016, CERN, Geneva (Jan, 2021).
- [3] FASER collaboration, Detecting and Studying High-Energy Collider Neutrinos with FASER at the LHC, Eur. Phys. J. C 80 (2020) 61 [1908.02310].
- [4] C. Pérez de los Heros, Status, challenges and directions in indirect dark matter searches, Symmetry 12 (2020) .
- [5] CTEQ collaboration, Handbook of perturbative QCD: Version 1.0, Rev. Mod. Phys. 67 (1995) 157.
- [6] J.M. Conrad, M.H. Shaevitz and T. Bolton, Precision measurements with high-energy neutrino beams, Rev. Mod. Phys. 70 (1998) 1341 [hep-ex/9707015].
- [7] J.A. Formaggio and G.P. Zeller, From eV to EeV: Neutrino Cross Sections Across Energy Scales, Rev. Mod. Phys. 84 (2012) 1307 [1305.7513].
- [8] G. De Lellis, P. Migliozzi and P. Santorelli, Charm physics with neutrinos, Phys. Rept. 399 (2004) 227.
- [9] D. Marfatia, D.W. McKay and T.J. Weiler, New physics with ultra-high-energy neutrinos, Phys. Lett. B 748 (2015) 113 [1502.06337].
- [10] C.A. Argüelles, A.J. Aurisano, B. Batell, J. Berger, M. Bishai, T. Boschi et al., New opportunities at the next-generation neutrino experiments I: BSM neutrino physics and dark matter, Reports on Progress in Physics 83 (2020) 124201.
- [11] M. Ackermann et al., Astrophysics Uniquely Enabled by Observations of High-Energy Cosmic Neutrinos, Bull. Am. Astron. Soc. 51 (2019) 185 [1903.04334].
- [12] PDG, P.A. Zyla et al., Review of Particle Physics, PTEP 2020 (2020) 083C01.
- [13] M. Bustamante and A. Connolly, Extracting the Energy-Dependent Neutrino-Nucleon Cross Section above 10 TeV Using IceCube Showers, Phys. Rev. Lett. 122 (2019) 041101.
- [14] A. De Rújula and R. Ruckl, Neutrino and muon physics in the collider mode of future accelerators, in SSC Workshop: Superconducting Super Collider Fixed Target Physics, pp. 571–596, 5, 1984, DOI.
- [15] A. De Rújula, E. Fernandez and J. Gomez-Cadenas, Neutrino fluxes at future hadron colliders, Nucl. Phys. B 405 (1993) 80.
- [16] F. Vannucci, Neutrino physics at LHC/SSC, Tech. Rep. LPNHE-93-03, Paris 6. Lab. Phys. Nucl. Théor. Hautes Enérg., Paris (Aug, 1993).
- [17] G. Jarlskog and D. Rein, Large Hadron Collider Workshop: Aachen, Germany 4 - 9 Oct 1990. Large Hadron Collider Workshop, v.2, (Geneva), CERN, 1990. 10.5170/CERN-1990-010-V-2.
- [18] S. Buontempo, G.M. Dallavalle, G. De Lellis, D. Lazic and F.L. Navarria, CMS-XSEN: LHC Neutrinos at CMS. Experiment Feasibility Study, Tech. Rep. CERN-CMS-NOTE-2018-001, CERN, Geneva (Mar, 2018).
- [19] N. Beni et al., Further studies on the physics potential of an experiment using LHC neutrinos, J. Phys. G 47 (2020) 125004 [2004.07828].
- [20] T.T. Böhlen, F. Cerutti, M.P.W. Chin, A. Fassò, A. Ferrari, P.G. Ortega et al., The FLUKA Code: Developments and Challenges for High Energy and Medical Applications, Nucl. Data Sheets 120 (2014) 211.
- [21] C. Ahdida et al., New Capabilities of the FLUKA Multi-Purpose Code, Front. in Phys. 9 (2022) 788253.
- [22] S. Roesler, R. Engel and J. Ranft, The Monte Carlo event generator DPMJET-III, in Advanced Monte Carlo for radiation physics, particle transport simulation and applications. Proceedings, Conference, MC2000, Lisbon, Portugal, October 23-26, 2000, p. 1033, 2000, DOI [hep-ph/0012252].
- [23] A. Fedynitch, Cascade equations and hadronic interactions at very high energies, CERN-THESIS-2015-371 https://cds.cern.ch/record/2231593 (27/11/2015) .
- [24] V. Boccone et al., Beam-machine Interaction at the CERN LHC, Nucl. Data Sheets 120 (2014) 215.
- [25] C. Andreopoulos et al., The GENIE Neutrino Monte Carlo Generator, Nucl. Instrum. Meth. A 614 (2010) 87 [0905.2517].
- [26] ZEUS collaboration, Measurement of high Q2 charged current cross-sections in e+p deep inelastic scattering at HERA, Eur. Phys. J. C 32 (2003) 1 [hep-ex/0307043].
- [27] H1 collaboration, First measurement of the charged current cross-section at HERA, Phys. Lett. B 324 (1994) 241.
- [28] T. Gleisberg, S. Hoeche, F. Krauss, A. Schalicke, S. Schumann and J.-C. Winter, SHERPA 1. alpha: A Proof of concept version, JHEP 02 (2004) 056 [hep-ph/0311263].
- [29] FCC collaboration, FCC Physics Opportunities: Future Circular Collider Conceptual Design Report Volume 1, Eur. Phys. J. C 79 (2019) 474.
- [30] A. Bhattacharya, R. Enberg, Y.S. Jeong, C.S. Kim, M.H. Reno, I. Sarcevic et al., Prompt atmospheric neutrino fluxes: perturbative QCD models and nuclear effects, JHEP 11 (2016) 167 [1607.00193].
- [31] Y.S. Jeong, W. Bai, M. Diwan, M.V. Garzelli, F.K. Kumar and M.H. Reno, Neutrinos from charm: forward production at the LHC and in the atmosphere, PoS ICRC2021 (2021) 1218 [2107.01178].
- [32] S. Alekhin et al., A facility to Search for Hidden Particles at the CERN SPS: the SHiP physics case, Rept. Prog. Phys. 79 (2016) 124201 [1504.04855].
- [33] A. Boyarsky, O. Mikulenko, M. Ovchynnikov and L. Shchutska, Searches for new physics at SND@LHC, JHEP 03 (2022) 006 [2104.09688].
- [34] R. Acquafredda et al., The OPERA experiment in the CERN to Gran Sasso neutrino beam, JINST 4 (2009) P04018.
- [35] OPERA collaboration, Observation of a first candidate in the OPERA experiment in the CNGS beam, Phys. Lett. B 691 (2010) 138 [1006.1623].
- [36] OPERA collaboration, Final Results of the OPERA Experiment on Appearance in the CNGS Neutrino Beam, Phys. Rev. Lett. 120 (2018) 211801 [1804.04912].
- [37] ELJen, “EJ-200.” https://eljentechnology.com/products/plastic-scintillators/ej-200-ej-204-ej-208-ej-212, accessed January 22, 2022.
- [38] AlFiPa, “Pet-met.” https://alfipa.com, accessed January 22, 2022.
- [39] Hamamatsu, “S14160-6050HS.” https://www.hamamatsu.com/eu/en/product/optical-sensors/mppc/mppc_mppc-array/S14160-6050HS.html.
- [40] Wacker, “Waker SilGel.” https://www.wacker.com/h/en-us/silicone-rubber/silicone-gels/wacker-silgel-612-ab/p/000007546, accessed January 22, 2022.
- [41] LHCb Collaboration, LHCb Tracker Upgrade Technical Design Report, Tech. Rep. CERN-LHCC-2014-001, LHCB-TDR-015 (Feb, 2014).
- [42] PETsys electronics, “PETsys TOFPET2 ASIC.” https://www.petsyselectronics.com/web/public/products/1.
- [43] D. Schug, V. Nadig, B. Weissler, P. Gebhardt and V. Schulz, Initial Measurements with the PETsys TOFPET2 ASIC Evaluation Kit and a Characterization of the ASIC TDC, IEEE Transactions on Radiation and Plasma Medical Sciences 3 (2019) 444.
- [44] V. Nadig, D. Schug, B. Weissler and V. Schulz, Evaluation Of The PETsys TOFPET2 ASIC In Multi-Channel Coincidence Experiments, EJNMMI Physics (2021) [1911.08156].
- [45] OPERA collaboration, Procedure for short-lived particle detection in the OPERA experiment and its application to charm decays, Eur. Phys. J. C 74 (2014) 2986 [1404.4357].
- [46] OPERA collaboration, Final results of the search for oscillations with the OPERA detector in the CNGS beam, JHEP 06 (2018) 151 [1803.11400].
- [47] L. Arrabito et al., Hardware performance of a scanning system for high speed analysis of nuclear emulsions, Nucl. Instrum. Meth. A 568 (2006) 578 [physics/0604043].
- [48] N. Armenise et al., High-speed particle tracking in nuclear emulsion by last-generation automatic microscopes, Nucl. Instrum. Meth. A 551 (2005) 261.
- [49] A. Alexandrov et al., A new fast scanning system for the measurement of large angle tracks in nuclear emulsions, JINST 10 (2015) P11006.
- [50] A. Alexandrov et al., A new generation scanning system for the high-speed analysis of nuclear emulsions, JINST 11 (2016) P06002.
- [51] A. Alexandrov et al., The Continuous Motion Technique for a New Generation of Scanning Systems, Sci. Rep. 7 (2017) 7310.
- [52] A. Alexandrov et al., A Novel Optical Scanning Technique with an Inclined Focusing Plane, Sci. Rep. 9 (2019) 2870.
- [53] Hamamatsu, “S14160-3010PS.” https://www.hamamatsu.com/eu/en/product/optical-sensors/mppc/mppc_mppc-array/S14160-3010PS.html.
- [54] Baron, S. and others, “The TTC Website.” https://ttc.web.cern.ch/.
- [55] “TTC website.” http://ttc.web.cern.ch/intro.html, accessed January 12, 2022.
- [56] PETsys electronics, “TOFPET2 ASIC Datasheet.” https://www.petsyselectronics.com/web/website/documentation/TOFPET2%20Downloads/Documentation/PETsys%20TOFPET%202C%20ASIC%20-%20Datasheet%20(rev%2014).pdf, accessed January 12, 2022.
- [57] Enclustra, “Mercury SA1.” https://www.enclustra.com/en/products/system-on-chip-modules/mercury-sa1/, accessed January 12, 2022.
- [58] STMicroelectronics, “NUCLEO-H743ZI.” https://www.st.com/en/evaluation-tools/nucleo-h743zi.html.
- [59] Sensirion, “SHT31-DIS-F.” https://sensirion.com/products/catalog/SHT31-DIS-F/, 2022 (accessed March 8, 2022).
- [60] Mbed, “Mbed OS.” https://os.mbed.com/mbed-os/, 2022 (accessed March 8, 2022).
- [61] “MQTT.” https://mqtt.org/, accessed April 21, 2022.
- [62] M. Al-Turany, D. Bertini, R. Karabowicz, D. Kresan, P. Malzacher, T. Stockmanns et al., The FairRoot framework, J. Phys. Conf. Ser. 396 (2012) 022001.
- [63] SHiP collaboration, A facility to Search for Hidden Particles (SHiP) at the CERN SPS, 1504.04956.
- [64] GEANT4 collaboration, GEANT4: A Simulation toolkit, Nucl. Instrum. Meth. A 506 (2003) 250.
- [65] T. Sjostrand, S. Mrenna and P.Z. Skands, PYTHIA 6.4 Physics and Manual, JHEP 05 (2006) 026 [hep-ph/0603175].
- [66] T. Sjöstrand, S. Ask, J.R. Christiansen, R. Corke, N. Desai, P. Ilten et al., An Introduction to PYTHIA 8.2, Comput. Phys. Commun. 191 (2015) 159 [1410.3012].
- [67] V. Tyukov, I. Kreslo, Y. Petukhov and G. Sirri, The FEDRA Framework for emulsion data reconstruction and analysis in the OPERA experiment, Nucl. Instrum. Meth. A 559 (2006) 103.
- [68] R. Brun, F. Rademakers and S. Panacek, ROOT, an object oriented data analysis framework, in CERN School of Computing (CSC 2000), pp. 11–42, 2000, DOI.
- [69] N. Armenise et al., High-speed particle tracking in nuclear emulsion by last-generation automatic microscopes, Nucl. Instrum. Meth. A 551 (2005) 261.
- [70] C. Betancourt et al., Application of large area SiPMs for the readout of a plastic scintillator based timing detector, JINST 12 (2017) P11023 [1709.08972].
The SND@LHC Collaboration
G. Acampora9,c, C. Ahdida23, R. Albanese9,c,g, C. Albrecht25, A. Alexandrov9,18,20,c, M. Andreini23, A. Anokhina21,i, T. Asada9,c, N. Auberson24, C. Baldanza7, C. Battilana7,b, A. Bay24, F. Bernard24, P. Bestmann23, C. Betancourt25, A. Blanco29,M. Bogomilov1, D. Bonacorsi7,b, W.M. Bonivento8, P. Bordalo29, A. Boyarsky17,d, G. Breglioc, A. Buonaura25, S. Buontempo9, V.D. Cafaro7, M. Callignon23, T. Camporesi23, M. Campanelli28, V. Canale9,c, F. Cassese9, A. Castro7,b, D. Centanni9,l, S.A. Cepeda Godoy30,31, F. Cerutti23, N. Charitonidis23, M. Chernyavskiy18, K.-Y. Choi16, S. Cholak24, V. Cicero7,b, F. Cindolo7, M. Climescu5, A.P. Conaboy3, L. Congedo6,a, O. Crespo23, M. Cristinziani4, A. Crupano7, G.M. Dallavalle7, N. D’Ambrosio10, J. De Carvalho Saraiva29, P.T. De Bryas Dexmiers D’Archiac24, G. De Lellis9,c,20, M. de Magistris9,l, A. De Roeck23, A. De Rújula23, M. De Serio6,a, D. De Simone25, L. Dedenko21, A. Di Crescenzo9,c,23111antonia.di.crescenzo@cern.ch, L. Di Giulio23, A. Dolmatov19, L. Dreyfus24, O. Durhan26, F.Fabbri7, D. Fasanella7,b, F. Fedotovs28, M. Ferrillo25, M. Ferro-Luzzi23, F. Fiengac, R.A. Fini6, A. Fiorillo9,c, P. Fonte29,R. Fresa9,c, R. Frei24, W. Funk23, G. Galati6,a, V. Galkin21,i, F. Garay Walls30,32, R. Garcia Alia23, A. Gerbershagen23, V. Giordano7, A. Golovatiuk9,c, A. Golutvin27,20, M. Gorshenkov20, E. Graverini24, J.-L. Grenard23, A.M. Guler26, V. Gulyaeva21,i, G.J. Haefeli24, J.C. Helo30,33, E.van Herwijnen20, P. Iengo9, S. Ilieva A. Infantino23, A. Iracec, A. Iuliano9,c, R. Jacobsson23, M. Jacquart24, C. Kamiscioglu26,f, E. Khalikov21, Y.G. Kim14, S.H. Kim13, M. Komatsu11, N. Konovalova18,20, S. Kovalenko30,31, I. Krasilnikova20, S. Kuleshov30,31, H.M. Lacker3, O. Lantwin20, F. Lasagni Manghi7, A. Lauria9,c, K.S. Lee15, K.Y. Lee13, N. Leonardo29, M.P. Liz Vargas30,31, S. Lo Meo7,k, C. Lemettais24, V.P. Loschiavo9,g, L. Lopes29, B. Lussi25, S. Marcellini7, A. Margiotta7,b, A. Magnan27, R. Maier25, M. Maietta23, A. Malinin19, V.R. Marrazzoc, Y. Maurer23, A.K. Managadze21, A. Mascellani24, A. Miano9,c, A. Mikulenko17, F. Minelli24, A. Montanari7, M.C. Montesi9,c, T. Naka12, F.L. Navarria7, S. Ogawa12, N. Okateva18,20, N. Owtscharenko4, M. Ovchynnikov17, B.D. Park13, G. Passeggio9, A. Pastore6, M. Patel27,20, L. Patrizii7, A. Perrotta7, A. Petrov19, D. Podgrudkov21,i, A. Polini7, N. Polukhina18,20,e, A. Prota9,c, F. Queiroz34, A. Quercia9,c, S. Ramos29, F. Ratnikov22, A. Reghunath3, M. Riccioc, A.B. Rodrigues Cavalcante24, T. Roganova21,i, T. Rovelli7,b, O. Ruchayskiy2, T. Ruf23, M. Sabate Gilarte23, F. Sanchez Galan23, P. Santos Diaz23, M. Schaffner25, O. Schneider24, G. Sekhniaidze9, N. Serra25, T. Shchedrina18,20, L. Shchutska24, V. Shevchenko19,20, H. Shibuya12,h, S. Shirobokov27, E. Shmanin20, S. Simone6,a, G.P. Siroli7,b, L. Sitoc, G. Sirri7,b, J. Schmidt3, G. Soares29,J.Y. Sohn13, O.J. Soto Sandoval30,33, M. Spurio7,b, N. Starkov18,20, J.L. Tastet2, I. Timiryasov2, V. Tioukov9, N. Tosi7, C. Trippl24, P.A. Ulloa Poblete30,33, E. Ursov21,i, A. Ustyuzhanin9,22, G. Vankova-Kirilova1, C. Vendeuvre23, C. Visone9,c, A. Vollhardt25, R. Wanke5, C.S. Yoon13, J. Zamora Saa30,31, E. Zaffaroni24777ettore.zaffaroni@cern.ch, H.J. Zick3
1Faculty of Physics, Sofia University, Sofia, Bulgaria
2Niels Bohr Institute, University of Copenhagen, Copenhagen, Denmark
3Humboldt-Universität zu Berlin, Berlin, Germany
4Department Physik, Universität Siegen, Siegen, Germany
5Institut für Physik and PRISMA Cluster of Excellence, Johannes Gutenberg Universität Mainz, Mainz, Germany
6Sezione INFN di Bari, Bari, Italy
7Sezione INFN di Bologna, Bologna, Italy
8Sezione INFN di Cagliari, Cagliari, Italy
9Sezione INFN di Napoli, Napoli, Italy
10Laboratori Nazionali dell’INFN di Gran Sasso, L’Aquila, Italy
11Nagoya University, Nagoya, Japan
12Toho University, Funabashi, Chiba, Japan
13Department of Physics Education and RINS, Gyeongsang National University, Jinju, Korea
14Gwangju National University of Education, Gwangju, Korea
15Korea University, Seoul, Korea
16Sungkyunkwan University, Suwon-si, Gyeong Gi-do, Korea
17University of Leiden, Leiden, The Netherlands
18P.N. Lebedev Physical Institute (LPI RAS), Moscow, Russia
19National Research Centre ’Kurchatov Institute’, Moscow, Russia
20National University of Science and Technology ’MISiS’, Moscow, Russia
21Skobeltsyn Institute of Nuclear Physics of Moscow State University (SINP MSU), Moscow, Russia
22National Research University Higher School of Economics, Moscow, Russia
23European Organization for Nuclear Research (CERN), Geneva, Switzerland
24Institute of Physics, Ecole Polytechnique Fédérale de Lausanne (EPFL), Lausanne, Switzerland
25Physik-Institut, Universität Zürich, Zürich, Switzerland
26Middle East Technical University (METU), Ankara, Turkey
27Imperial College London, London, United Kingdom
28University College London, London, United Kingdom
29Laboratory of Instrumentation and Experimental Particle Physics (LIP), Lisbon, Portugal
30Millennium Institute for Subatomic physics at high energy frontier-SAPHIR, Fernandez Concha 700, Santiago, Chile
31Center for Theoretical and Experimental Particle Physics, Facultad de Ciencias Exactas, Universidad Andrés Bello, Fernandez Concha 700, Santiago, Chilej
32Pontificia Universidad Católica de Chile, Santiago, Chilej
33Departamento de Física, Facultad de Ciencias, Universidad de La Serena, Avenida Cisternas 1200, La Serena, Chilej
34International Institute of Physics at the Federal University of Rio Grande do Norte, Rio Grande do Norte, Brazil
aUniversità di Bari, Bari, Italy
bUniversità di Bologna, Bologna, Italy
cUniversità di Napoli “Federico II”, Napoli, Italy
dTaras Shevchenko National University of Kyiv, Kyiv, Ukraine
eNational Research Nuclear University (MEPhI), Moscow, Russia
fAnkara University, Ankara, Turkey
gConsorzio CREATE, Napoli, Italy
hPresent address: Faculty of Engineering, Kanagawa University, Yokohama, Japan
iAlso at: Lomonosov Moscow State University, Faculty of Physics, Moscow, Russia
jAssociated to: Millennium Institute for Subatomic physics at high energy frontier-SAPHIR, Fernandez Concha 700, Santiago, Chile
kENEA Research Centre E. Clementel, Bologna, Italy
lUniversità di Napoli Parthenope, Napoli, Italy
mUniversità del Sannio, Benevento, Italy