Towards Better Semantic Understanding of Mobile Interfaces
Abstract
Improving the accessibility and automation capabilities of mobile devices can have a significant positive impact on the daily lives of countless users. To stimulate research in this direction, we release a human-annotated dataset with approximately 500k unique annotations aimed at increasing the understanding of the functionality of UI elements. This dataset augments images and view hierarchies from RICO, a large dataset of mobile UIs, with annotations for icons based on their shapes and semantics, and associations between different elements and their corresponding text labels, resulting in a significant increase in the number of UI elements and the categories assigned to them. We also release models using image-only and multimodal inputs; we experiment with various architectures and study the benefits of using multimodal inputs on the new dataset. Our models demonstrate strong performance on an evaluation set of unseen apps, indicating their generalizability to newer screens. These models, combined with the new dataset, can enable innovative functionalities like referring to UI elements by their labels, improved coverage and better semantics for icons etc., which would go a long way in making UIs more usable for everyone.
1 Introduction
Mobile devices like phones and tablets have become ubiquitous and indispensable to carry out our daily activities. It is not an exaggeration to say that usage of mobile devices is becoming a requirement for full participation in society. Recent reports from the WHO and others Organization (2021); Peter Ackland and Bourne (2017) estimate that around 2.2 billion people across the world have some form of vision impairment, out of which 36 million people are blind. Accessibility of mobile devices is necessary for these visually impaired users to carry out their daily tasks and is an important tool for their social integration Ladner (2015).
Accessibility of mobile apps has improved significantly over the past few years aided by developments on two main fronts: Firstly, the development of screen readers, like VoiceOver Apple (2021c) on iOS and TalkBack Accessibility (2021e) on Android, enable visually impaired users to control their phone in an eyes-free manner. Secondly, development tools and standards to enhance accessibility, such as the Accessibility guidelines for iOS and Android Accessibility (2021a); Apple (2021b), Android Accessibility Scanner Accessibility (2021b), and iOS Accessibility Inspector Apple (2021a), have helped developers identify and fix accessibility issues for applications. Among most of these utilities, the main source of accessibility data is the accessibility labels Accessibility (2021d) provided by app developers. These labels are specified as attributes on a structured representation such as View Hierarchy, for the different UI elements on the screen and are available to screen readers Accessibility (2021c); Apple (2018). Despite the growth in accessibility tools, recent studies Ross et al. (2020, 2017); Chen et al. (2020a) have found that even the most widely used apps have large gaps in accessibility. For instance, a study by Chen et al. (2020a) of more than 7k apps and 279k screens revealed that around 77% of the apps and 60% of the screens had at least one element without explicit labels. Similarly, Ross et al. (2020) found that, in a population of 10k apps, 53% of the Image Button elements were missing labels.
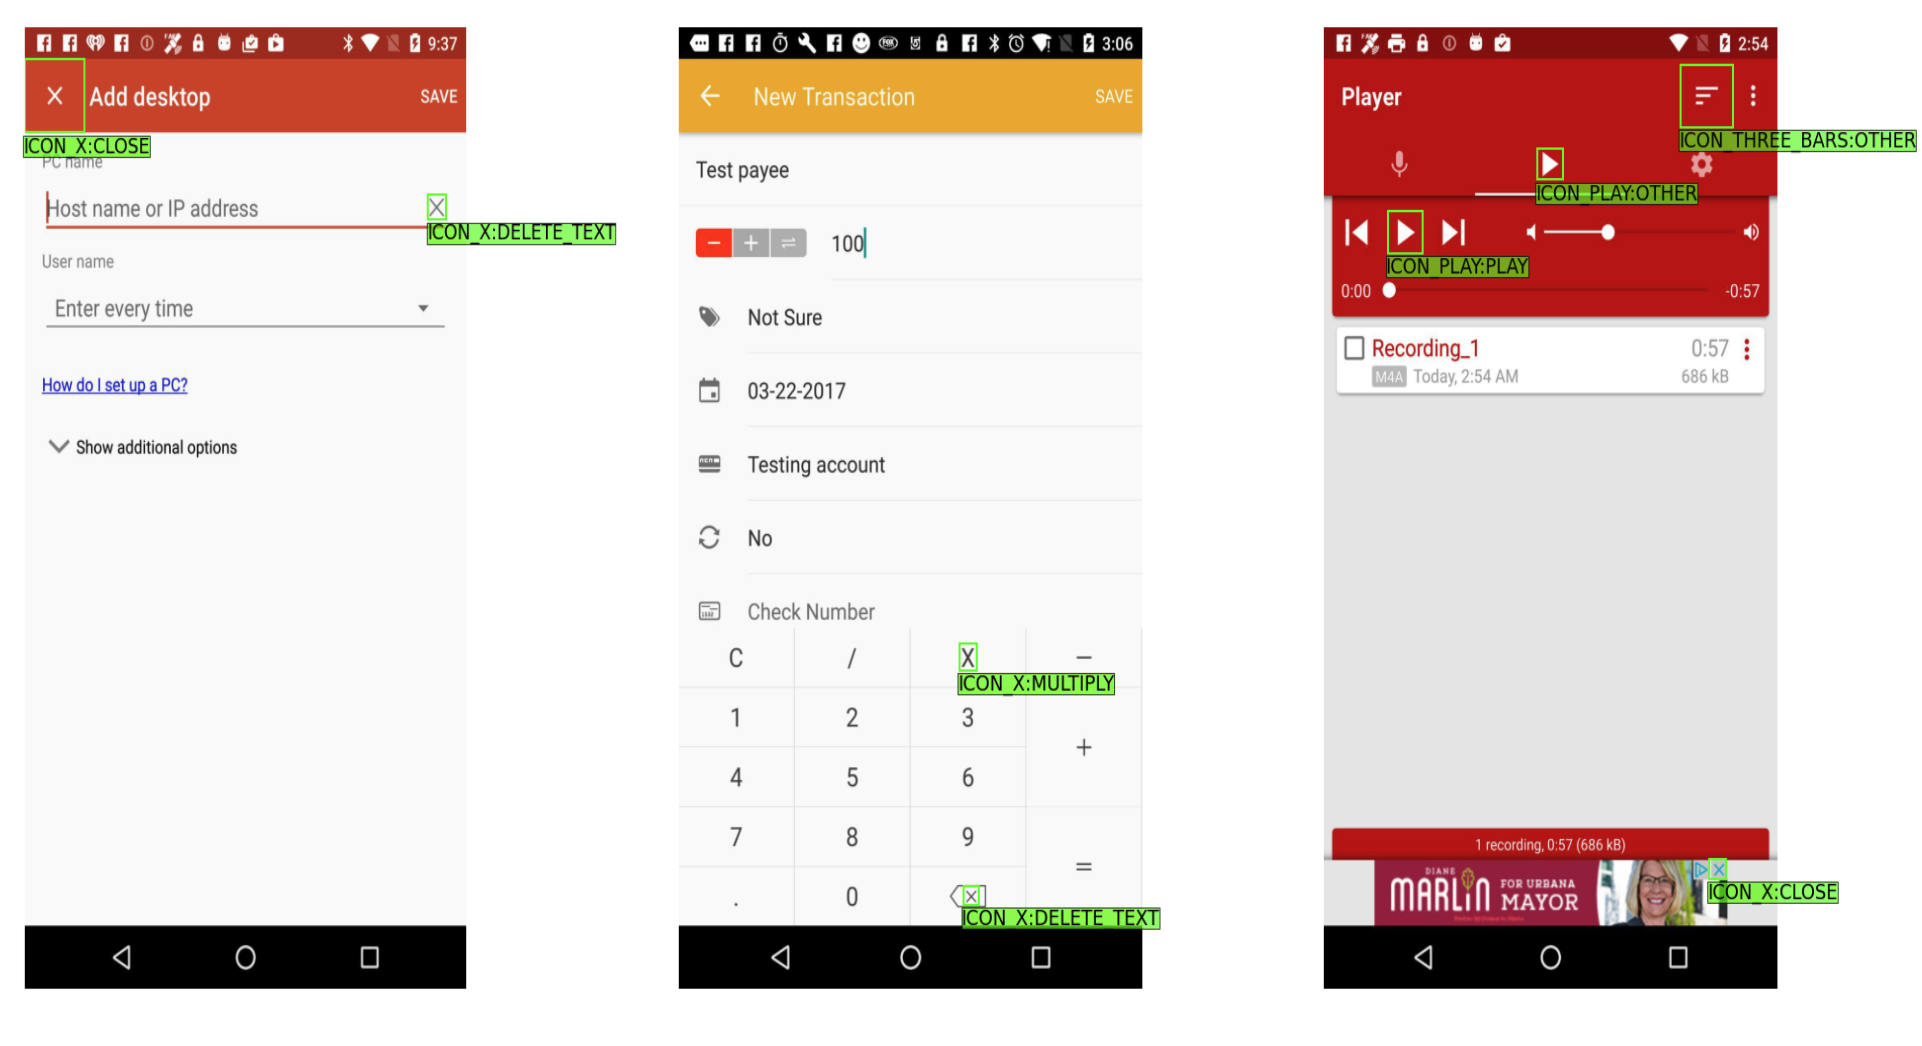
In this paper, we attempt to encourage further research into improving mobile device accessibility and increasing device automation by releasing an enhanced version of the RICO dataset Deka et al. (2017) with high-quality human annotations aimed at semantic understanding of various UI elements. Firstly, following a study by Ross et al. (2020) where missing labels for Image Button instances was found to be the primary accessibility barrier, we focus on creating annotations useful for identifying icons. In particular, we annotated the most frequent 77 classes of icons based on their appearance. We refer to this task as the Icon Shape task. Secondly, we identified icon shapes which can have multiple semantic meanings and annotated each such icon with its semantic label. This task is called Icon Semantics. Some examples of such icons can be seen in Figure 1(b). Finally, we annotate UI elements, like icons, text inputs, checkboxes etc., and associate them with their text labels. These associations can help us identify meaningful labels for the long tail of icons and UI elements not present in our schema, but having a textual label associated with them. We refer to this task as the Label Association task. The main contributions of this paper are as follows:
-
•
A large scale dataset111The datasets are released at https://github.com/google-research-datasets/rico-semantics. of human annotations for 1) Icon Shape 2) Icon Semantics and 3) selected general UI Elements (icons, form fields, radio buttons, text fields) and their associated text labels on the RICO dataset.
-
•
Strong benchmark models222Benchmark models and code are released at https://https://github.com/google-research/google-research/tree/master/rico-semantics based on state of the art models He et al. (2016); Carion et al. (2020); Vaswani et al. (2017) using image-only and multimodal inputs with different architectures. We present an analysis of these models evaluating the benefits of using View Hierarchy attributes and optical character recognition (OCR) along with the image pixels.
2 Related Work
2.1 Datasets
Large scale datasets like ImageNet Deng et al. (2009) played a crucial part in the development of Deep Learning models Krizhevsky et al. (2012); He et al. (2016) for Image Understanding. Similarly, the release of the RICO dataset Deka et al. (2017) enabled data driven modeling for understanding user interfaces of mobile apps. RICO is, to the best of our knowledge, the largest public repository of mobile app data, containing 72k UI screenshots and their View Hierarchies from 9.7k Android apps spanning 27 categories. Apart from RICO, other datasets include ERICA Deka et al. (2016) with sequences of user interactions with mobile UIs and LabelDROID Chen et al. (2020a) which contains 13.1k mobile UI screenshots and View Hierarchies.
There have been a few efforts to provide additional annotations on RICO. SWIRE Huang et al. (2019) and VINS Bunian et al. (2021) added annotations for UI retrieval, Enrico Leiva et al. (2020) added annotations for 20 design topics. Liu et al. (2018) automatically generated semantic annotations for UI elements using a convolutional neural network trained on a subset of the data. Recently Li et al. (2022) released UI element labels on view hierarchy boxes including identifying boxes which do not match to any elements in the UI. Even though some of these works are similar in spirit to the dataset presented in this paper, there are two major differences: 1) The icon and UI element labels are inferred on the boxes extracted from the View Hierarchy, whereas, in our work, we add human annotated bounding boxes directly on the image. Due to noise in the view hierarchies like missing and misaligned bounding boxes for UI elements Li et al. (2020a, 2022), we observe that human annotation increases the number of icons labelled by 47%. 2) The semantic icon labels in Liu et al. (2018) conflate appearance and functionality. For example “close” and “delete,” “undo” and “back,” “add” and “expand” are mapped to the same class, even though they represent different functionalities. The Icon Semantics annotations in our dataset specifically try to distinguish between icons with the same appearance but differences in functionality.

2.2 Models
Pixel based methods for UI understanding have been studied for a long time. They have been used for a variety of applications like GUI testing Yeh et al. (2009); Chang et al. (2010), identifying similar products across screens Bell and Bala (2015), finding similar designs and UIs Behrang et al. (2018); Bunian et al. (2021), detecting issues in UIs Liu (2020), generating accessibility metadata Zhang et al. (2021) and generating descriptions of elements Chen et al. (2020a). A recent study by Chen et al. (2020b) compares traditional image processing methods and Deep Learning methods to identify different UI elements. The image-only baseline models studied in this paper are based on Object Detection methods presented in Chen et al. (2020b), Zhang et al. (2021), Chen et al. (2020a), and Carion et al. (2020).
Extending to other modalities beyond pixels, Banovic et al. (2012) use video tutorials to understand UIs and annotate them with additional information. Li et al. (2021) use only the screen information for identifying embeddings of UI elements. Hurst et al. (2010) use both the screen and accessibility API information to identify interaction targets in UIs and Chang et al. (2011) use similar inputs to detect and identify certain UI elements and Nguyen et al. (2018) use it for identifying similar UI designs. Multimodal inputs have also been used for understanding screen contents like generating element descriptions Li et al. (2020b), training UI embeddings for multiple downstream tasks He et al. (2021); Bai et al. (2021) and, denoising data, predicting bounding box types Li et al. (2022).
3 Datasets, taxonomy and annotation
To enable accessible hands-free experience for mobile users, it is necessary for the system to understand the functionality of the different screen UI elements. For learning data driven models to enable these functionalities, we use the RICO dataset Deka et al. (2017). RICO spans >9K apps and >72K UIs, each with a screenshot and information regarding the structure of the UI in the form of a View Hierarchy (VH). Besides the bounding boxes of the different UI elements, the VH contains useful attributes like the content description and resource id which provide information regarding the functionality of the different UI elements. However, Li et al. (2020a) found that only 35% of the unique screens in RICO contain a matching View Hierarchy and screenshot. In the next few sections, we describe how we overcome the mismtach issue and describe the different type of annotations.
3.1 Icon Shape
As the study by Ross et al. (2020) found that one of the main accessibility barriers on mobile devices are missing labels for ImageButton elements, in the icon shape and semantics tasks we focus on creating annotations useful for identifying icons. Liu et al. (2018) attempted to provide semantic labels for the icons in the RICO dataset by identifying different concepts represented by the ImageButton elements on a subset of the data. Using these concepts and models trained on a subset of the data they identified semantic labels over the entire dataset. They inferred labels for more than 100 icons types, 25 UI element types and 197 text button types. However, due to the presence of view hierarchies with bounding boxes missing and misaligned for UI elements Li et al. (2020a, 2022), these labels miss several UI elements. By comparing with manually labeled data, we found that the annotations in Liu et al. (2018) did not identify around 32% of all icon instances captured by manual labeling. For improving the coverage of icons, in our dataset we asked raters to manually annotate all the bounding boxes. We created a schema of the 77 most commonly used icon classes, reusing many of the classes identified in Liu et al. (2018). Examples of these icon classes and images are shown in Figure 1(a).
3.2 Icon Semantics
To support voice driven usage of mobile devices, we identify icons not only based on their shape and appearance but also functionality and semantic meaning. For example, an “X” shaped icon can mean “close,” “remove an option/entry,” “delete/clear text,” or “multiply.” One way to enable users to refer to the various semantics is to map the multiple semantics to the same class in the Icon Shape schema. This approach has two limitations: 1) Mapping each icon shape to multiple semantics can lead to confusion for applications like Screen Readers. 2) We noticed that there are many instances of icons with different semantics but same shape occurring in the same screen. In particular 11% of all images with ICON_PLAY, 4.9% with ICON_X and 4.8% with ICON_CHAT have icons with multiple semantics.
We identified a list of common icons which have more than one semantic meaning associated with them by the following steps: 1) Manually inspect a variety of the icon annotations and list the functionality of each icon instance, 2) Use the plurality of words matching to the same icon shape in the RICO icon labels in Liu et al. (2018) as an indicator of multiple semantics, and 3) Recognize confusing app logos. For example, the logo for WhatsApp contains a Phone icon but it is most natural for a user to say, “open WhatsApp”.
After these steps, we arrived at a list of 12 shape icons which were further classified into 38 semantic shapes. For icons with semantic meanings not covered by our schema, we assign the semantic type OTHER as the default label. Out of the 101,625 annotated icons 15,640 (around 15%) are labeled as OTHER. We observed that it is difficult to cover all of the tail semantics classes with a schema. Thus, we also obtained annotations for the text labels associated with UI elements, described in the section below.
3.3 Label Association
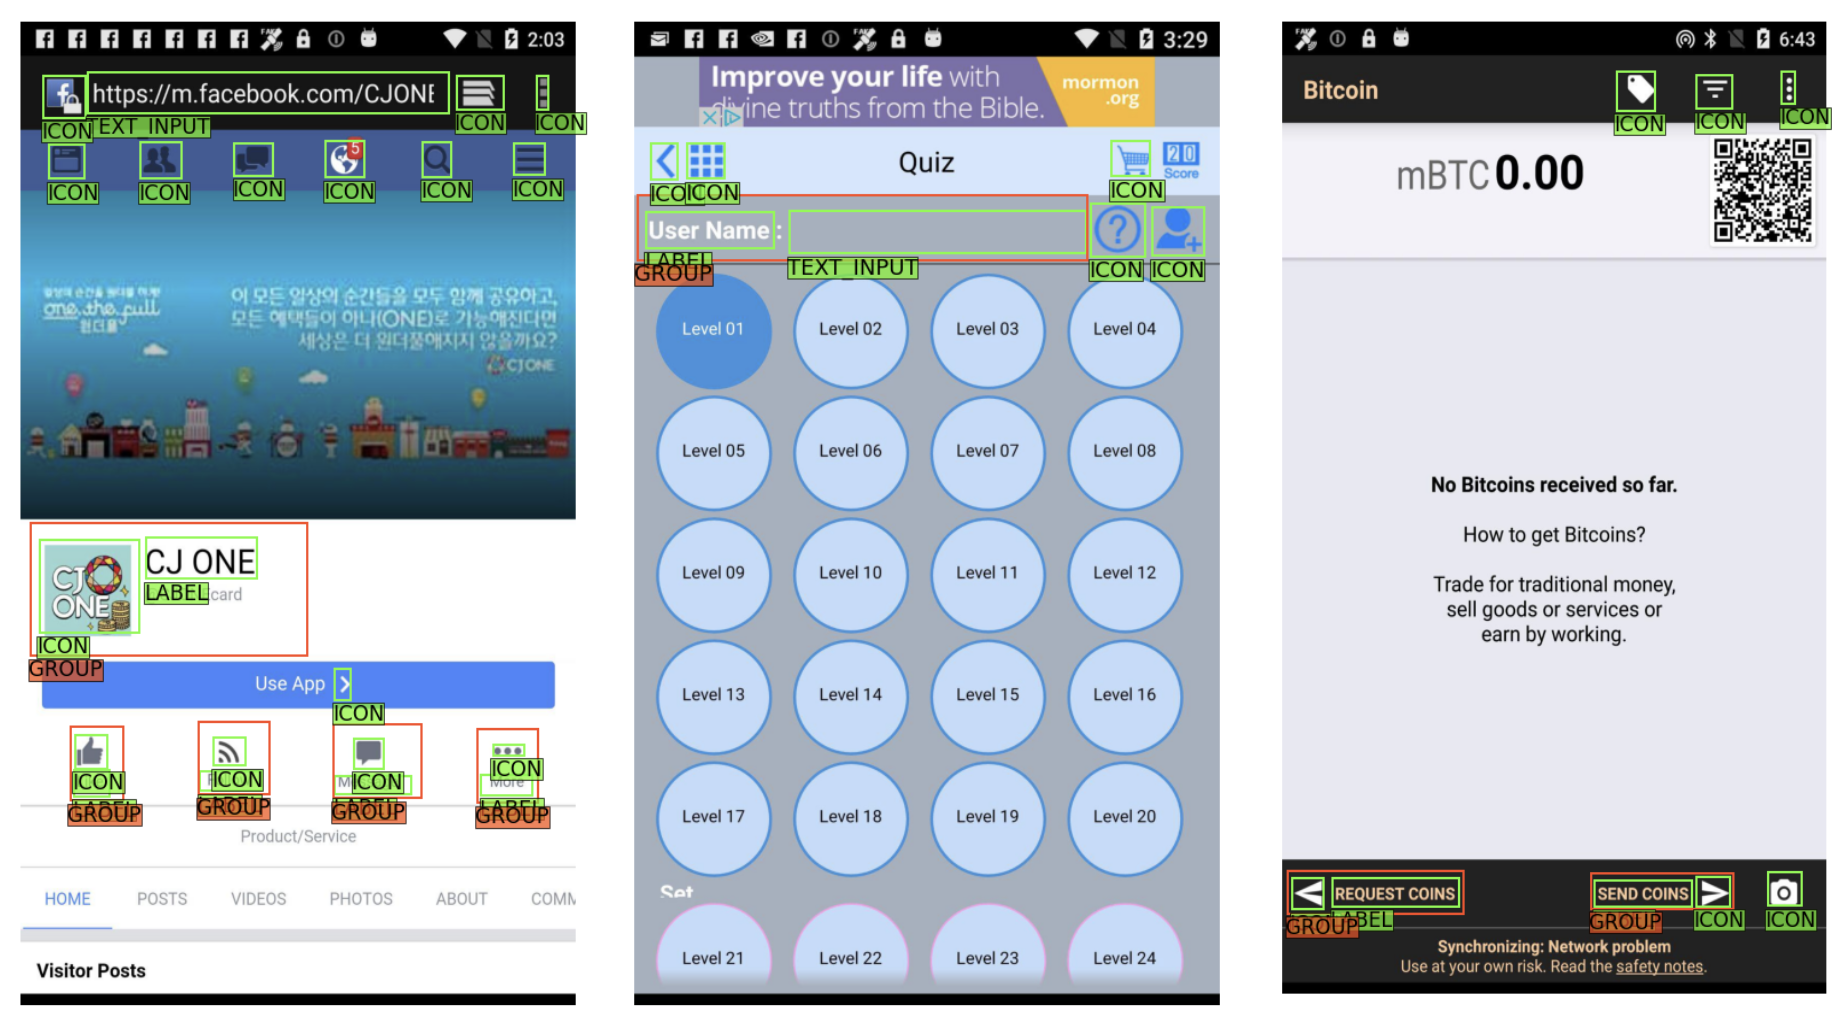
Many UI elements have an associated text labels that best describes UI elements. Our data analysis showed that 24.6% of icons, form fields, check boxes and radio buttons have an associated label. However, we found that these labels are commonly neither syntactically associated within view hierarchies nor visually aligned in screenshot pixels. First, we attempted to identify labels associated with UI elements by using heuristics relying on the View Hierarchy, like searching the siblings and parent node’s siblings for axis aligned text elements for each of the UI elements. We found that only 40% of UI elements with labels could be correctly associated using such heuristics with a significant number of false positive associations. Next, we attempted to match UI element bounding boxes with line boxes detected by OCR. We matched each UI element bounding box with the OCR text box nearest to the top left corner with a maximum distance threshold. This method achieved 29.5% accuracy. These empirical studies indicated that, like many machine perception tasks, this Label Association task may in fact be non-trivial despite appearing straightforward to humans. Some examples can be seen in figure 2. We believe this novel task can help address the limitation of annotations with a fixed set of classes by making use of the text label information present in the UI.
3.4 Annotation Procedure
For the three tasks described above, we follow the annotation procedure below to collect annotated data. We used a team of 40 trained human raters with single replication to annotate the screenshots. The raters were initially provided with example image patches for each icon or UI element type similar to Figure 1(a) and then followed the annotation procedure below:
-
•
Round 1: Each rater is presented with a screenshot and is asked to draw a bounding box around every icon and UI element on the screen. For each icon box, they can specify an icon shape class if it is included in the schema and otherwise they classify it as a general icon class. Once an icon shape class is identified, if there are multiple semantics associated with that shape, the raters choose one semantic class among the different options for that class. These options also include the OTHER class to capture semantics not in the icon semantics schema. For the label association task, we ask raters to identify the icons, form fields, radio buttons, and check boxes first, followed by the text labels, by drawing their bounding boxes and assigning the respective classes. Then the raters group the text labels with their associated UI element if it exists.
-
•
Round 2: To improve the annotation quality, we send the datasets for a second round of cleaning where the raters can adjust the bounding box or the classes assigned.
-
•
Round 3: After round 2, if we still find some classes are poorly labeled by manual inspection, we use trained models to identify potential incorrect labels. We train Object Detection models on the entire dataset, and use the model to predict labels for the train, validation and test sets. If there are any differences between the model predictions and the human annotations, we identify these instances as potentially error-prone and send these images back to the raters to re-annotate them.
Using the above procedure, we annotated all of the screenshots in RICO with icon shape, semantics and label association classes. The distribution of top labels for the icon tasks can be seen in figures 3, 4. The entire taxonomy and exact counts are in Appendix A.
4 Baseline Models
We conducted several experiments to investigate the effectiveness of various deep learning approaches for solving the tasks presented in Section 3. The overall goal of these experiments is to: 1) provide good baseline models to be used for image-only and image+VH settings 2) study the effect of using multi-modal inputs v/s only the screenshot for these tasks.
4.1 Problem Setup
For the three tasks, we distinguish two different approaches: 1) the Object Detection (OD) approach using only the image and, 2) the bounding box classification (BB-CLS) approach using image, OCR and view hierarchy. We describe these two approaches in the following sections. We split the data into 80% train, 10% validation and 10% test by package name to avoid data leakage and use the same split for all experiments.
4.1.1 Object Detection (OD)
In this setup, the models take the screenshot as input and output bounding box, class label and score for each object found. We used object detection models based on the widely used and better performing Chen et al. (2020b) Faster R-CNN Ren et al. (2015) and Centernet Zhou et al. (2019) architectures. We train these models with various backbones Szegedy et al. (2017); He et al. (2016); Lin et al. (2017); Newell et al. (2016) and report results for the best performing ones. Finally, we experimented with Object Detection models based on Transformer Vaswani et al. (2017) architecture like DETR Carion et al. (2020); Zhu et al. (2020) to verify the hypothesis that for the Icon Semantics and the Label Association tasks, the models need more information from their context compared to the Icon Shape task. We use standard Object Detection metrics like mAP@0.5IOU to compare the model performance.
4.1.2 Bounding box classification (BB-CLS)
For this setup, we train models to classify bounding boxes extracted from the view hierarchy (VH) and assign them labels among the candidate classes. The groundtruth (GT) set contains boxes that have been created and labeled by crowd workers. These two sets of boxes are greedily matched as follows. 1) Each GT box is matched to at most one VH box and vice versa. 2) For every GT box, we find the VH box with maximum Intersection over Union (IoU). Only the matches for which the IoU value is greater than the threshold of 0.5 are kept. 3) Once a VH box is matched with a GT, it is not considered for future matches. After this matching procedure is complete, we assign a background class to the unmatched VH boxes. We use a Transformer Vaswani et al. (2017) based network as described in UIBert Bai et al. (2021) for the Icon Shape, Semantics tasks framed as a classification problem and compare models based on Macro F-1 score.
For the Label Association task, we compute an embedding of each UI element following Bai et al. (2021) and perform clustering on projected embeddings to identify UI elements which belong to a group. We use F-1 score of the associated elements as the metric of comparison. For every set of elements predicted to be a group, it is considered a True Positive if the same group is present in the groundtruth, and considered a False Positive if it is not. All groundtruth groups which are not in predictions count as False Negatives and the F-1 score is computed based on these counts.
Compared to OD models the BB-CLS models have an advantage as they do not need to predict the bounding boxes for UI elements. To enable a comparison between the two approaches, we add the unmatched GT boxes as inputs by setting all the other VH attributes to be empty values. To use this in a real-world setting, this procedure assumes the existence of a good VH without missing boxes. We study BB-CLS models here as it helps us validate the potential benefit of using VH attributes from the UI elements on the screen and consequently can motivate improving the view hierarchies for various apps and web-sites.
4.2 Model Configurations and Training Details
For the Centernet model, we used the hourglass-104 backbone Zhou et al. (2019) with an input size of 10241024. For the DETR model Carion et al. (2020), each image is proportionally resized and padded to the shape 12801280. We use a ResNet-50 He et al. (2016) pretrained on ImageNet Deng et al. (2009) as the backbone with frozen batch normalization layers for training stability. We add position embedding and object queries to each layer. The DETR models are trained on cloud TPUs with a batch size of 256 and reduce learning rate from to after 120k steps.
For classification and clustering models based on UIBert Bai et al. (2021), we use an EfficientNet-B0 Tan and Le (2019) model for encoding the image patches and use ALBERT text encoder Lan et al. (2019) for encoding OCR and VH attributes. We use a Transformer layer with 6 layers, 16 heads and a intermediate size of 512. We train these models on cloud TPUs with a batch size of 128 using the Adam optimizer Kingma and Ba (2014) with a warmup over 10k steps and reduce learning rate from by a factor of 3 for every 50k steps . All the models were implemented using Tensorflow Abadi et al. (2015) and converged within two days.
| Model Type | mAP | mAP@0.5IOU |
|---|---|---|
| Faster R-CNN | 34.60 | 70.24 |
| CenterNet Hourglass | 37.50 | 72.50 |
| DETR | 39.28 | 77.94 |
| Inputs | F-1 score | 95% CI |
|---|---|---|
| Image + OCR + VH | 83.38 | [83.23 - 83.53] |
| Image + OCR | 82.75 | [82.54 - 82.95] |
| Image only | 82.08 | [81.71 - 82.44] |
| Model Type | mAP | mAP@0.5IOU |
|---|---|---|
| Faster R-CNN | 25.33 | 53.59 |
| CenterNet Hourglass | 25.70 | 54.00 |
| DETR | 26.69 | 55.74 |
| Inputs | F-1 score | 95% CI |
|---|---|---|
| Image + OCR + VH | 67.16 | [66.74 - 67.58] |
| Image + OCR | 64.52 | [63.98 - 65.05] |
| Image only | 63.66 | [63.15 - 64.16] |
| Model Type | mAP | F-1 score |
|---|---|---|
| Faster R-CNN | 36.90 | 75.75 |
| CenterNet Hourglass | 38.00 | 75.65 |
| DETR | 40.71 | 79.17 |
| Inputs | F-1 score | 95% CI |
|---|---|---|
| Image + OCR + VH | 87.23 | [86.40 - 88.05] |
| Image + OCR | 85.29 | [84.78 - 85.79] |
| Image only | 84.33 | [83.30 - 85.36] |
4.3 Results and Analysis
In this section, we report our model performance for each problem setup. For all model variants, we choose the model with the best performance on the validation set and report the numbers on the test set. Overall, we observe that for BB-CLS models using Image + VH + OCR perform better than models using Image + OCR and Image only. For OD models, we report the results from the best performing Faster R-CNN model, the best performing CenterNet model, and DETR, the overall best model for each task. We report both these results as it allows us to compare the performance of CNN based architectures with Transformer based ones. Also CenterNet models enable fast inference Duan et al. (2019) on mobile phones compared to DETR models, making the baseline models directly usable on mobile phones. Results for all the different architectures we experimented with can be found in the Appendix A. For BB-CLS models, we estimate the 95% Confidence Intervals based on 5 model runs with the same configuration.
4.3.1 Icon Shape and Semantics
Among OD models, we observe that models based on DETR Carion et al. (2020) which uses Transformers + Convolutions outperform CNN-based object detection models. DETR models achieve an mAP@0.5IOU of 77.94% on the test set vs 72.50% for CenterNet models on Icon Shape task and achieve an mAP@0.5IOU of 55.74% vs 54% for CenterNet models for Icon Semantics task. The performance of all of the models is weaker for Icon Semantics vs Icon Shape task. We believe this is due to Icon Semantics being a harder task as objects of similar shape can belong to different classes based on the rest of the screenshot or other assumptions. Additionally, since semantic labels are a sub-classification of shape labels, this dataset has fewer labeled examples per class.
For the BB-CLS models, we observe that models which take the VH as input outperform models without VH for both tasks. Models with Image + VH + OCR outperform models with Image + OCR by 0.63% and 2.6% for the Shape and Semantics tasks respectively. We believe this could be a result of information regarding the elements being present in VH attributes like content description. However, adding OCR does not seem to improve model performance significantly over using only the image as input. Detailed results for these tasks can be found in Tables 1, 2.
4.3.2 Label Association
For the Label Association task, DETR-based models also outperform CenterNet models in terms of F-1 score of 79.17% vs 75.65%. For BB-CLS models, we observe that models using VH attributes outperform models not using VH with an F-1 score of 87.23% vs 85.29%. Detailed results can be found in Table 3. We observe a significant gap in the F1-score achieved by BB-CLS models v/s OD models.
5 Applications and Future Work
This dataset and models built on it to predict the icon and text association labels can be used to improve the label coverage for various accessibility applications like VoiceOver Apple (2021c), TalkBack Accessibility (2021e), Voice Access Accessibility (2022) etc. In addition, these labels can be used to improve the accessibility labels for various other platforms like web browsers and desktop applications. The models can also be used to automatically suggest accessibility labels for UI elements based on their appearance in various developer platforms XCode (2022); AndroidStudio (2021) so that developers can improve the accessibility of their apps easily. Along with improving accessibility, we believe this dataset is a step towards enabling new features like voice control, screen summarization and others.
The baseline models presented in this paper can be improved in a number of ways like training multitask models for a single model to output the different labels, bridge the gap between the models which use only the image and models which use view hierarchy, improve the ability of multimodal models to handle missing view hierarchy elements and their attributes. Other directions of research include inferring labels for the long tail icon classes using the ICON class annotations from the label association task, inferring semantic labels for general UI elements. This supervised data can also be used to improve the performance of self-supervised methods for UI elements like ActionBert He et al. (2021), UIBert Bai et al. (2021) etc.
6 Conclusions
In this paper, we presented an enhanced version of the RICO dataset with three new sets of annotations aimed at improving the semantic understanding of mobile screens, namely icon shape, icon semantics, and label association. We outlined the benefits of human annotated data over automatically labeled data and released strong baseline models using image and view hierarchy for each of these tasks. Our dataset, benchmark models and experiments lay the groundwork for future research on building better models for semantic understanding of UIs. We observe that using pre-trained models and view hierarchy attributes is a promising direction for improving these models. These models can be combined with other techniques like heuristic rules to infer the multitude of labels useful for driving improvements in accessibility and automation of mobile devices.
References
- Abadi et al. (2015) Martín Abadi, Ashish Agarwal, Paul Barham, Eugene Brevdo, Zhifeng Chen, Craig Citro, Greg S. Corrado, Andy Davis, Jeffrey Dean, Matthieu Devin, Sanjay Ghemawat, Ian Goodfellow, Andrew Harp, Geoffrey Irving, Michael Isard, Yangqing Jia, Rafal Jozefowicz, Lukasz Kaiser, Manjunath Kudlur, Josh Levenberg, Dandelion Mané, Rajat Monga, Sherry Moore, Derek Murray, Chris Olah, Mike Schuster, Jonathon Shlens, Benoit Steiner, Ilya Sutskever, Kunal Talwar, Paul Tucker, Vincent Vanhoucke, Vijay Vasudevan, Fernanda Viégas, Oriol Vinyals, Pete Warden, Martin Wattenberg, Martin Wicke, Yuan Yu, and Xiaoqiang Zheng. 2015. TensorFlow: Large-scale machine learning on heterogeneous systems. Software available from tensorflow.org.
- Accessibility (2021a) Android Accessibility. 2021a. Accessibility guidelines.
- Accessibility (2021b) Android Accessibility. 2021b. Accessibility scanner.
- Accessibility (2021c) Android Accessibility. 2021c. Accessibilitynodeprovider.
- Accessibility (2021d) Android Accessibility. 2021d. Make apps more accessible.
- Accessibility (2021e) Android Accessibility. 2021e. Talkback.
- Accessibility (2022) Android Accessibility. 2022. Voice access on android.
- AndroidStudio (2021) AndroidStudio. 2021. Androidstudio.
- Apple (2018) Apple. 2018. View hierarchy.
- Apple (2021a) Apple. 2021a. Accessibility inspector.
- Apple (2021b) Apple. 2021b. Accessibility overview.
- Apple (2021c) Apple. 2021c. Voiceover.
- Bai et al. (2021) Chongyang Bai, Xiaoxue Zang, Ying Xu, Srinivas Sunkara, Abhinav Rastogi, Jindong Chen, and Blaise Agüera y Arcas. 2021. Uibert: Learning generic multimodal representations for ui understanding. In Proceedings of the Thirtieth International Joint Conference on Artificial Intelligence, IJCAI-21, pages 1705–1712. International Joint Conferences on Artificial Intelligence Organization. Main Track.
- Banovic et al. (2012) Nikola Banovic, Tovi Grossman, Justin Matejka, and George Fitzmaurice. 2012. Waken: Reverse engineering usage information and interface structure from software videos. In Proceedings of the 25th Annual ACM Symposium on User Interface Software and Technology, UIST ’12, page 83–92, New York, NY, USA. Association for Computing Machinery.
- Behrang et al. (2018) Farnaz Behrang, Steven P. Reiss, and Alessandro Orso. 2018. Guifetch: Supporting app design and development through gui search. In Proceedings of the 5th International Conference on Mobile Software Engineering and Systems, MOBILESoft ’18, page 236–246, New York, NY, USA. Association for Computing Machinery.
- Bell and Bala (2015) Sean Bell and Kavita Bala. 2015. Learning visual similarity for product design with convolutional neural networks. ACM Trans. Graph., 34(4).
- Bunian et al. (2021) Sara Bunian, Kai Li, Chaima Jemmali, Casper Harteveld, Yun Fu, and Magy Seif Seif El-Nasr. 2021. Vins: Visual search for mobile user interface design. In Proceedings of the 2021 CHI Conference on Human Factors in Computing Systems, CHI ’21, New York, NY, USA. Association for Computing Machinery.
- Carion et al. (2020) Nicolas Carion, Francisco Massa, Gabriel Synnaeve, Nicolas Usunier, Alexander Kirillov, and Sergey Zagoruyko. 2020. End-to-end object detection with transformers. In European Conference on Computer Vision, pages 213–229. Springer.
- Chang et al. (2011) Tsung-Hsiang Chang, Tom Yeh, and Rob Miller. 2011. Associating the visual representation of user interfaces with their internal structures and metadata. In Proceedings of the 24th Annual ACM Symposium on User Interface Software and Technology, UIST ’11, page 245–256, New York, NY, USA. Association for Computing Machinery.
- Chang et al. (2010) Tsung-Hsiang Chang, Tom Yeh, and Robert C. Miller. 2010. GUI Testing Using Computer Vision, page 1535–1544. Association for Computing Machinery, New York, NY, USA.
- Chen et al. (2020a) Jieshan Chen, Chunyang Chen, Zhenchang Xing, Xiwei Xu, Liming Zhut, Guoqiang Li, and Jinshui Wang. 2020a. Unblind your apps: Predicting natural-language labels for mobile gui components by deep learning. In 2020 IEEE/ACM 42nd International Conference on Software Engineering (ICSE), pages 322–334.
- Chen et al. (2020b) Jieshan Chen, Mulong Xie, Zhenchang Xing, Chunyang Chen, Xiwei Xu, Liming Zhu, and Guoqiang Li. 2020b. Object detection for graphical user interface: Old fashioned or deep learning or a combination? ESEC/FSE 2020, page 1202–1214, New York, NY, USA. Association for Computing Machinery.
- Deka et al. (2017) Biplab Deka, Zifeng Huang, Chad Franzen, Joshua Hibschman, Daniel Afergan, Yang Li, Jeffrey Nichols, and Ranjitha Kumar. 2017. Rico: A mobile app dataset for building data-driven design applications. In Proceedings of the 30th Annual Symposium on User Interface Software and Technology, UIST ’17.
- Deka et al. (2016) Biplab Deka, Zifeng Huang, and Ranjitha Kumar. 2016. Erica: Interaction mining mobile apps. In Proceedings of the 29th Annual Symposium on User Interface Software and Technology, UIST ’16, pages 767–776, New York, NY, USA. ACM.
- Deng et al. (2009) Jia Deng, Wei Dong, Richard Socher, Li-Jia Li, Kai Li, and Li Fei-Fei. 2009. Imagenet: A large-scale hierarchical image database. In 2009 IEEE Conference on Computer Vision and Pattern Recognition, pages 248–255.
- Duan et al. (2019) Kaiwen Duan, Song Bai, Lingxi Xie, Honggang Qi, Qingming Huang, and Qi Tian. 2019. Centernet: Keypoint triplets for object detection. In Proceedings of the IEEE/CVF international conference on computer vision, pages 6569–6578.
- He et al. (2016) Kaiming He, Xiangyu Zhang, Shaoqing Ren, and Jian Sun. 2016. Deep residual learning for image recognition. In Proceedings of the IEEE conference on computer vision and pattern recognition, pages 770–778.
- He et al. (2021) Zecheng He, Srinivas Sunkara, Xiaoxue Zang, Ying Xu, Lijuan Liu, Nevan Wichers, Gabriel Schubiner, Ruby Lee, and Jindong Chen. 2021. Actionbert: Leveraging user actions for semantic understanding of user interfaces. Proceedings of the AAAI Conference on Artificial Intelligence, 35(7):5931–5938.
- Huang et al. (2019) Forrest Huang, John F. Canny, and Jeffrey Nichols. 2019. Swire: Sketch-Based User Interface Retrieval, page 1–10. Association for Computing Machinery, New York, NY, USA.
- Hurst et al. (2010) Amy Hurst, Scott E. Hudson, and Jennifer Mankoff. 2010. Automatically identifying targets users interact with during real world tasks. In Proceedings of the 15th International Conference on Intelligent User Interfaces, IUI ’10, page 11–20, New York, NY, USA. Association for Computing Machinery.
- Kingma and Ba (2014) Diederik P Kingma and Jimmy Ba. 2014. Adam: A method for stochastic optimization. arXiv preprint arXiv:1412.6980.
- Krizhevsky et al. (2012) Alex Krizhevsky, Ilya Sutskever, and Geoffrey E Hinton. 2012. Imagenet classification with deep convolutional neural networks. Advances in neural information processing systems, 25:1097–1105.
- Ladner (2015) Richard E. Ladner. 2015. Design for user empowerment. Interactions, 22(2):24–29.
- Lan et al. (2019) Zhenzhong Lan, Mingda Chen, Sebastian Goodman, Kevin Gimpel, Piyush Sharma, and Radu Soricut. 2019. Albert: A lite bert for self-supervised learning of language representations. arXiv preprint arXiv:1909.11942.
- Leiva et al. (2020) Luis A. Leiva, Asutosh Hota, and Antti Oulasvirta. 2020. Enrico: A dataset for topic modeling of mobile ui designs. In 22nd International Conference on Human-Computer Interaction with Mobile Devices and Services, MobileHCI ’20, New York, NY, USA. Association for Computing Machinery.
- Li et al. (2022) Gang Li, Gilles Baechler, Manuel Tragut, and Yang Li. 2022. Learning to denoise raw mobile ui layouts for improving datasets at scale.
- Li et al. (2021) Toby Jia-Jun Li, Lindsay Popowski, Tom Mitchell, and Brad A Myers. 2021. Screen2Vec: Semantic Embedding of GUI Screens and GUI Components. Association for Computing Machinery, New York, NY, USA.
- Li et al. (2020a) Yang Li, Jiacong He, Xin Zhou, Yuan Zhang, and Jason Baldridge. 2020a. Mapping natural language instructions to mobile UI action sequences. In Proceedings of the 58th Annual Meeting of the Association for Computational Linguistics, pages 8198–8210, Online. Association for Computational Linguistics.
- Li et al. (2020b) Yang Li, Gang Li, Luheng He, Jingjie Zheng, Hong Li, and Zhiwei Guan. 2020b. Widget captioning: Generating natural language description for mobile user interface elements. In Proceedings of the 2020 Conference on Empirical Methods in Natural Language Processing (EMNLP), pages 5495–5510, Online. Association for Computational Linguistics.
- Lin et al. (2017) Tsung-Yi Lin, Piotr Dollár, Ross Girshick, Kaiming He, Bharath Hariharan, and Serge Belongie. 2017. Feature pyramid networks for object detection. In Proceedings of the IEEE conference on computer vision and pattern recognition, pages 2117–2125.
- Liu et al. (2018) Thomas F. Liu, Mark Craft, Jason Situ, Ersin Yumer, Radomir Mech, and Ranjitha Kumar. 2018. Learning design semantics for mobile apps. In Proceedings of the 31st Annual ACM Symposium on User Interface Software and Technology, UIST ’18, page 569–579, New York, NY, USA. Association for Computing Machinery.
- Liu (2020) Zhe Liu. 2020. Discovering ui display issues with visual understanding. In Proceedings of the 35th IEEE/ACM International Conference on Automated Software Engineering, ASE ’20, page 1373–1375, New York, NY, USA. Association for Computing Machinery.
- Newell et al. (2016) Alejandro Newell, Kaiyu Yang, and Jia Deng. 2016. Stacked hourglass networks for human pose estimation. In Computer Vision – ECCV 2016, pages 483–499, Cham. Springer International Publishing.
- Nguyen et al. (2018) Tam The Nguyen, Phong Minh Vu, Hung Viet Pham, and Tung Thanh Nguyen. 2018. Deep learning ui design patterns of mobile apps. In Proceedings of the 40th International Conference on Software Engineering: New Ideas and Emerging Results, ICSE-NIER ’18, page 65–68, New York, NY, USA. Association for Computing Machinery.
- Organization (2021) World Health Organization. 2021. Blindness and vision impairment.
- Peter Ackland and Bourne (2017) Serge Resnikoff Peter Ackland and Rupert Bourne. 2017. World blindness and visual impairment: despite many successes, the problem is growing. community eye health. Community Eye Health, 30(100):71–73.
- Ren et al. (2015) Shaoqing Ren, Kaiming He, Ross Girshick, and Jian Sun. 2015. Faster r-cnn: Towards real-time object detection with region proposal networks. Advances in neural information processing systems, 28:91–99.
- Ross et al. (2017) Anne Spencer Ross, Xiaoyi Zhang, James Fogarty, and Jacob O. Wobbrock. 2017. Epidemiology as a framework for large-scale mobile application accessibility assessment. In Proceedings of the 19th International ACM SIGACCESS Conference on Computers and Accessibility, ASSETS ’17, page 2–11, New York, NY, USA. Association for Computing Machinery.
- Ross et al. (2020) Anne Spencer Ross, Xiaoyi Zhang, James Fogarty, and Jacob O. Wobbrock. 2020. An epidemiology-inspired large-scale analysis of android app accessibility. ACM Trans. Access. Comput., 13(1).
- Szegedy et al. (2017) Christian Szegedy, Sergey Ioffe, Vincent Vanhoucke, and Alexander A Alemi. 2017. Inception-v4, inception-resnet and the impact of residual connections on learning. In Thirty-first AAAI conference on artificial intelligence.
- Tan and Le (2019) Mingxing Tan and Quoc Le. 2019. Efficientnet: Rethinking model scaling for convolutional neural networks. In International Conference on Machine Learning, pages 6105–6114. PMLR.
- Vaswani et al. (2017) Ashish Vaswani, Noam Shazeer, Niki Parmar, Jakob Uszkoreit, Llion Jones, Aidan N Gomez, Ł ukasz Kaiser, and Illia Polosukhin. 2017. Attention is all you need. In Advances in Neural Information Processing Systems, volume 30. Curran Associates, Inc.
- XCode (2022) XCode. 2022. Xcode.
- Yeh et al. (2009) Tom Yeh, Tsung-Hsiang Chang, and Robert C. Miller. 2009. Sikuli: Using gui screenshots for search and automation. In Proceedings of the 22nd Annual ACM Symposium on User Interface Software and Technology, UIST ’09, page 183–192, New York, NY, USA. Association for Computing Machinery.
- Zhang et al. (2021) Xiaoyi Zhang, Lilian de Greef, Amanda Swearngin, Samuel White, Kyle Murray, Lisa Yu, Qi Shan, Jeffrey Nichols, Jason Wu, Chris Fleizach, Aaron Everitt, and Jeffrey P Bigham. 2021. Screen recognition: Creating accessibility metadata for mobile applications from pixels. In Proceedings of the 2021 CHI Conference on Human Factors in Computing Systems, CHI ’21, New York, NY, USA. Association for Computing Machinery.
- Zhou et al. (2019) Xingyi Zhou, Dequan Wang, and Philipp Krähenbühl. 2019. Objects as points. arXiv preprint arXiv:1904.07850.
- Zhu et al. (2020) Xizhou Zhu, Weijie Su, Lewei Lu, Bin Li, Xiaogang Wang, and Jifeng Dai. 2020. Deformable detr: Deformable transformers for end-to-end object detection. arXiv preprint arXiv:2010.04159.
Appendix A Appendix: Data distribution and experiment results
This section contains more details on the datasets. Section A.1 contains the definitions used for attributing the detailed data distribution for each of the tasks. Table 4 contains the data distribution for the 76 icon shape classes. Table 5 contains the shape classes and their semantic classification along with counts for each class and table 6 contains the data distribution for the label association classes.
In addition Table 7 contains results for object detection models based on Faster R-CNN on the 3 tasks discussed in the paper.
A.1 Semantic class definitions
As mentioned in section 3.2 the shape icons are further sub-divided into various categories based on their functionality. The definitions of the various semantic types are given below. Each semantic icon name is prefixed by the corresponding shape name. We exclude the OTHER category for each icon shape as it is used to capture all other functionalities not covered by the mentioned semantics.
-
•
ICON_X:CLOSE Close windows or tabs or exit a window.
-
•
ICON_X:DELETE TEXT Delete entries, items, text, suggestions etc.
-
•
ICON_X:MULTIPLY Mathematical operation of multiplication.
-
•
ICON_ARROW_UPWARD:CAPITALIZE Caps Lock icon to toggle upper case and lower case letters in the keyboard.
-
•
ICON_MAGNIFYING_GLASS:SEARCH Search in the current app or website.
-
•
ICON_MAGNIFYING_GLASS:ZOOM IN Zoom-in to a picture, document etc.
-
•
ICON_MAGNIFYING_GLASS:ZOOM OUT Zoom-out of a picture, document etc.
-
•
ICON_UNDO:REPLY Reply to a message, mail etc.
-
•
ICON_UNDO:UNDO Undo the previous action.
-
•
ICON_UNDO:BACK Go back to the previous screen or state.
-
•
ICON_REDO:SHARE Share this item.
-
•
ICON_REDO:REDO Redo the previous action.
-
•
ICON_THREE_BARS:MENU Icon to display menu options.
-
•
ICON_PHONE:CALL Start a phone call.
-
•
ICON_PHONE:CHAT APP Icon for a chat app.
-
•
ICON_PHONE:PHONE APP Open the phone app.
-
•
ICON_PHONE:END CALL End a phone or video call.
-
•
ICON_PLAY:PLAY Playing video, audio, games, etc.
-
•
ICON_PLAY:PLAY STORE Icon for the Google Play Store.
-
•
ICON_PLAY:YOUTUBE Icon for the YouTube app.
-
•
ICON_CHAT:CHAT Send a message to someone or view comments.
-
•
ICON_CHAT:WHATSAPP Icon for the WhatsApp app.
-
•
ICON_CHAT:FACEBOOK MESSENGER Icon for the Facebook Messenger app.
-
•
ICON_TAKE_PHOTO:INSTAGRAM Icon for the Instagram app.
-
•
ICON_THREE_DOTS:MORE For “more” options, contents, etc. It could also refer to menu.
-
•
ICON_PLUS:ADD ITEM Add a new item to an existing list.
-
•
ICON_PLUS:EXPAND Expand a UI element to show more details.
Shape Class Count ICON V BACKWARD 46,431 ICON NAV BAR CIRCLE 41,551 ICON NAV BAR RECT 41,449 ICON STAR 17,890 ICON THREE DOTS 15,194 ICON V FORWARD 14,131 ICON ARROW BACKWARD 13,767 ICON THREE BARS 13,659 ICON X 11,058 ICON MAGNIFYING GLASS 10,911 ICON PLUS 9,971 ICON PLAY 7,576 ICON V DOWNWARD 7,447 ICON PERSON 6,648 ICON CHECK 6,583 ICON HEART 6,274 ICON CHAT 5,483 ICON SETTINGS 4,909 ICON SHARE 4,871 ICON ARROW FORWARD 3,463 ICON LOCATION 3,398 ICON INFO 3,287 ICON HOME 3,172 ICON TIME 3,123 ICON REFRESH 2,987 ICON CLOUD 2,436 ICON EDIT 2,280 ICON QUESTION 2,263 ICON TAKE PHOTO 2,110 ICON SHOPPING CART 1,900 ICON CALENDAR 1,851 ICON NOTIFICATIONS 1,817 ICON CLOUD 2,436 ICON EDIT 2,280 ICON QUESTION 2,263 ICON TAKE PHOTO 2,110 ICON SHOPPING CART 1,900 ICON CALENDAR 1,851 ICON NOTIFICATIONS 1,817 ICON FACEBOOK 1,700 ICON ENVELOPE 1,659 ICON PEOPLE 1,658 Shape Class Count ICON LOCK 1,622 ICON GALLERY 1,535 ICON CALL 1,488 ICON V UPWARD 1,392 ICON VOLUME STATE 1,359 ICON LIST 1,346 ICON DOWNLOAD 1,344 ICON THUMBS UP 1,335 ICON SUN 1,327 ICON ARROW DOWNWARD 1,317 ICON LAUNCH APPS 1,136 ICON ARROW UPWARD 1,094 ICON MIC 1,016 ICON HAPPY FACE 955 ICON PAUSE 864 ICON TWITTER 860 ICON SHOPPING BAG 776 ICON MOON 719 ICON SEND 711 ICON COMPASS 691 ICON DELETE 665 ICON REDO 546 ICON VIDEOCAM 521 ICON HISTORY 447 ICON UNDO 441 ICON HEADSET 412 ICON THUMBS DOWN 382 ICON EXPAND 356 ICON GOOGLE 334 ICON UPLOAD 328 ICON SAD FACE 239 ICON STOP 204 ICON CAST 150 ICON PAPERCLIP 139 ICON VOLUME MUTE 77 ICON END CALL 65 ICON VOLUME DOWN 21 ICON CONTRACT 19 ICON VOLUME UP 14 ICON MIC MUTE 13 ICON ASSISTANT 4 TOTAL 353,171
| Shape Class | Semantic Class | Count |
|---|---|---|
| ICON X | CLOSE | 8,899 |
| DELETE TEXT | 1,163 | |
| MULTIPLY | 50 | |
| OTHER | 840 | |
| ICON ARROW UPWARD | CAPITALIZE | 154 |
| OTHER | 915 | |
| ICON MAGNIFYING GLASS | SEARCH | 10,243 |
| ZOOM IN | 142 | |
| ZOOM OUT | 92 | |
| OTHER | 331 | |
| ICON UNDO | REPLY | 113 |
| UNDO | 109 | |
| BACK | 101 | |
| OTHER | 115 | |
| ICON REDO | SHARE | 354 |
| REDO | 63 | |
| OTHER | 117 | |
| ICON THREE BARS | MENU | 11,929 |
| OTHER | 1,329 | |
| ICON PHONE | CALL | 729 |
| CHAT APP | 530 | |
| PHONE APP | 89 | |
| END CALL | 12 | |
| OTHER | 571 | |
| ICON CHAT | CHAT APP | 530 |
| 120 | ||
| FACEBOOK MESSENGER | 61 | |
| OTHER | 4,663 | |
| ICON CAMERA | 192 | |
| OTHER | 1,884 | |
| ICON PLAY | PLAY | 4,452 |
| PLAY STORE | 782 | |
| YOUTUBE | 356 | |
| OTHER | 1,846 | |
| ICON THREE DOTS | MORE | 14,285 |
| OTHER | 785 | |
| ICON PLUS | ADD ITEM | 7,170 |
| EXPAND | 396 | |
| OTHER | 2,244 | |
| TOTAL | - | 78,756 |
| Class name | Count | # with text labels | % with text labels | |
|---|---|---|---|---|
| Icon | 252,342 | 57,716 | 22.87% | |
| Text Field | 16,131 | 3,292 | 20.41% | |
| Check Box | 5,958 | 3,723 | 62.49% | |
| Radio Button | 2,558 | 1,659 | 64.86% | |
| Total | 276,989 | 66,390 | 23.96% |
| Icon Shape | Icon Semantics | Label Association | ||||
|---|---|---|---|---|---|---|
| Backbone | mAP | mAP@0.5IOU | mAP | mAP@0.5IOU | mAP | mAP@0.5IOU |
| ResNet-101 | 32.07 | 65.72 | 25.33 | 53.59 | 34.70 | 73.37 |
| Inception ResNet | 31.61 | 70.14 | 25.17 | 53.36 | 36.63 | 75.19 |
| ResNet-101 with FPN | 34.60 | 70.24 | 25.34 | 53.17 | 36.90 | 75.75 |