Quashing a suspected selection bias in galaxy samples having dynamically-measured supermassive black holes
Abstract
Local early-type galaxies with directly-measured black hole masses, , have been reported to represent a biased sample relative to the population at large. Such galaxies with Spitzer Space Telescope imaging have been purported to possess velocity dispersions, , at least 0.1 dex larger for a given galaxy stellar mass, , than is typically observed among thousands of early-type galaxies imaged by the Sloan Digital Sky Survey. This apparent offset led Shankar et al. to reduce the normalisation of the observed relation by at least 0.5 dex to give their “intrinsic relations”, including -based modifications to the – relation. These modifications were based on the untested assumption that the stellar masses had been derived consistently between the two samples. Here, we provide the necessary check using galaxies common to the Spitzer Survey of Stellar Structure in Galaxies (S4G) and the Sloan Digital Sky Survey (SDSS). We find that the stellar masses of galaxies with and without directly measured black holes had appeared offset from each other due to the use of inconsistent stellar mass-to-light ratios, , for the optical and infrared data. We briefly discuss the “intrinsic relations” and why some of these will at times appear to have had partial success when applied to data based on similarly inconsistent values of . Finally, we reiterate the importance of the (lower-case ) term, which we previously introduced into the – relations to help avoid -related mismatches.
keywords:
galaxies: bulges – galaxies: elliptical and lenticular, cD – galaxies: structure – galaxies: interactions – galaxies: evolution – (galaxies:) quasars: supermassive black holes1 Introduction
The consensus regarding the presence of a supermassive black hole (SMBH) at the centre of almost every galaxy (local/quiescent or distant/active) stems from multiple pioneering studies, e.g., Baade & Minkowski (1954); Hoyle & Fowler (1963); Burbidge et al. (1963); Salpeter (1964); Zel’dovich (1964); Schmidt (1965); Sandage (1965); Lynden-Bell (1969); Lynden-Bell & Rees (1971). Dressler & Richstone (1988) were the first to clearly suggest a correlation between black hole mass () and the host galaxy’s bulge mass (using merely two galaxies). With an ever-increasing number of direct dynamical111Direct SMBH mass measurement methods include stellar and gas dynamical modelling, megamaser kinematics, proper motion (for Sgr A∗) and direct imaging (for M87). SMBH mass measurements — tabulated in, for example, Ferrarese & Ford (2005), Kormendy & Ho (2013), and Sahu et al. (2019b) —, the study of BH–galaxy correlations has been actively pursued (Dressler, 1989; Yee, 1992; Kormendy & Richstone, 1995; Magorrian et al., 1998; Laor, 1998; Wandel, 1999; Salucci et al., 2000; Laor, 2001; Ferrarese, 2002; Häring & Rix, 2004; Ferrarese & Ford, 2005; Graham, 2007a; Gültekin et al., 2009; Sani et al., 2011; Beifiori et al., 2012; Graham, 2012; Kormendy & Ho, 2013; McConnell & Ma, 2013; Graham & Scott, 2013, 2015; Läsker et al., 2014; Saglia et al., 2016; Savorgnan et al., 2016; Davis et al., 2019; Sahu et al., 2019b). Although an evolving field, it is now quite clear that spheroids built from mergers which have folded in the progenitor galaxies’ disc mass form an offset sequence in the – diagram, possessing lower ratios (Sahu et al., 2019a; Graham & Sahu, 2022).222A review of how the perception of the existence of SMBHs has evolved can be found in Shields (1999) and Genzel (2021), while developments in the observed BH-galaxy correlations (until 2015) are additionally reviewed in Graham (2016).
Bernardi et al. (2007, their Figure 1), see also Yu & Tremaine (2002), claimed that the sample of galaxies with directly measured black hole masses had overly-large velocity dispersions at a given bulge magnitude relative to a larger SDSS sample of ETGs. That claim, explored in the Appendix of Graham (2007b), was based on applying a single, two-parameter de Vaucouleurs’ model fit to the ETGs in the SDSS sample, potentially overestimating the brightness of the actual bulge component. A similar claim that the sample of galaxies with directly measured black hole masses is biased, such that they have overly-large velocity dispersions at a given galaxy stellar mass, relative to the SDSS sample, was made by Shankar et al. (2016, Sh16 hereafter) but this time armed with improved Sérsic-bulge plus exponential-disc decompositions for the SDSS sample. The benefit was that the five-parameter fits to the SDSS data provided a better estimate of the total galaxy magnitude. This claim was based upon an offset seen between samples with and without SMBH mass measured directly/dynamically in the (stellar velocity dispersion: )–(galaxy stellar mass: ) diagram. They suggested it occurred due to a resolution-limited selection effect in the dynamically-measured black hole sample.
We investigate this apparent offset in the – diagram, which may have significant ramifications for SMBH scaling relations and their application. Some important applications include calibration of the virial factor for the reverberation mapping of (distant) active galaxies, insights into SMBH–galaxy coevolution theories, tests for galaxy simulations, derivation of the SMBH mass function, estimation of SMBH merger timescales, SMBH merger rate, and the expected amplitude of the long-wavelength gravitational wave (GW) signals333See Sahu et al. (2022) for details on how the latest SMBH scaling relations can obtain SMBH merger timescales, merger rate estimates and significantly improve the modelling of the expected long-wavelength GWs. looked for by pulsar timing arrays and future space interferometers.
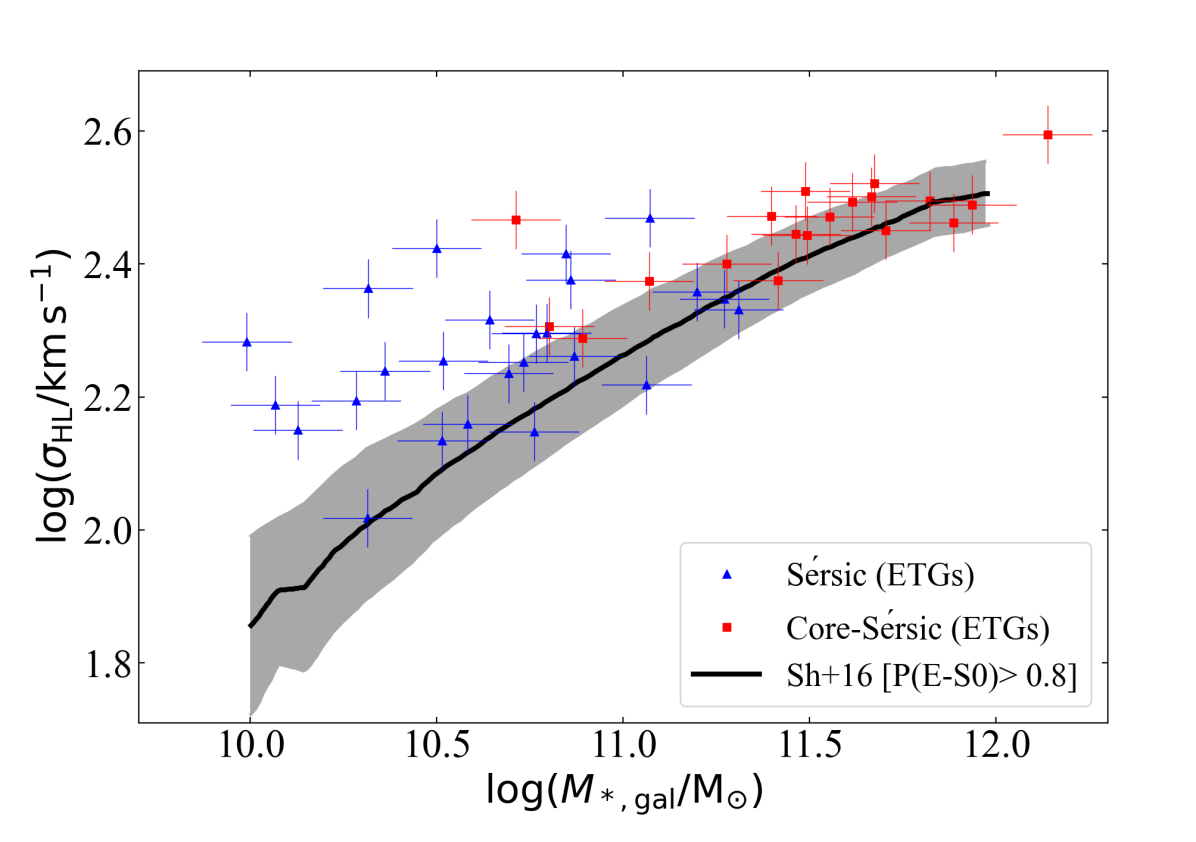
Sh16 their Figure 1 compared local early-type galaxies (ETGs) which have dynamical SMBH mass measurement, specifically, the BH samples from four different studies (Beifiori et al., 2012; McConnell & Ma, 2013; Läsker et al., 2014; Savorgnan et al., 2016) with a sample of ETGs from Data Release 7 (DR7) of the Sloan Digital Sky Survey (hereafter SDSS-DR7, Abazajian et al., 2009). They showed an offset in all four cases, the latest of which is presented in Figure 1, where the – curve formed by the SDSS-DR7 ETG sample is compared with 44 ETGs (with direct SMBH mass measurement) from Savorgnan et al. (2016). Here, the galaxy morphology class “ETG" refers to elliptical (E), ellicular (ES)444Ellicular (ES-type) refers to ETGs with intermediate-scale rotating stellar disks within their dominant spheroidal component. Such galaxies have been known since Liller (1966). The term “ellicular” combines elliptical and lenticular, and ES-type galaxies are placed between the E- and S0-types in the morphology classification grid presented by Graham (2019)., and lenticular (S0) galaxies, whereas the late-type galaxy (LTG) refers to spiral (S) and irregular (Irr) galaxies.
The velocity dispersions for the Savorgnan et al. (2016) SMBH sample were taken from the HyperLeda database555http://leda.univ-lyon1.fr/ (Paturel et al., 2003; Makarov et al., 2014), which are homogenised at an aperture (radius) size of R=0.595 kpc. Often referred to as the central velocity dispersion, it is denoted here as . The black curve shown in Figure 1 is directly taken from Sh16 (top right panel of their Figure 1). It represents the mean – relation defined by the ETGs from the SDSS-DR7 sample, and the grey shaded regions mark the 68 per cent scatter of the distribution around the mean (black) curve. The SMBH sample shown in Figure 1 has seven extra ETGs from the Savorgnan et al. (2016) sample for whom is now available from the HyperLeda database.
Sh16 selected the ETGs from the SDSS-DR7 sample using a Bayesian automated morphological classifier (Huertas-Company et al., 2011), where galaxies with a probability of greater than 0.8 for being E- or S0-types, denoted by , were placed in the ETG bin. The classifier algorithm in Huertas-Company et al. (2011) assigned a probability to each galaxy for belonging to four different morphological types: E (elliptical); S0 (lenticular); Sab (early LTG); and Scd (late LTG). Sahu et al. (2019b, in their Section 6) argued that implied that at least 10 per cent of the SDSS-DR7 ETGs selected by Sh16 using the above criteria were misclassified and may be LTGs (Sab or Scd). Sahu et al. (2019b) noted that the apparent offset of the SMBH sample from the SDSS-DR7 ETG – curve seems higher at the low-mass end () than at the high masses due to at least 10 per cent contamination by LTGs in the supposed ETG sample of Sh16. This is because the LTGs (spiral) define a different – relation than ETGs and reside below ETGs in the – diagram (see Figure 15 in Sahu et al., 2019b). This may be a reason behind a fraction of the offset between the ETG SMBH sample and the SDSS-DR7 ETG sample. However, Sahu et al. (2019b) did not thoroughly investigate this offset which is now done here.666In 2019, we were aware of the results presented herein; however, pandemic-related delays have meant that we are only reporting them now.
Importantly, from the SDSS-DR7 spectroscopic galaxy sample without a direct-dynamical SMBH mass measurement, Sh16 used the ETGs within the redshift range of . The distance of their sample meant that they had no galaxies in common with the sample containing direct dynamical SMBH mass measurements. This prohibited them from checking if the stellar masses were being derived consistently between the two samples. Sh16 interpreted the offset seen in the – diagram in terms of the SMBH sample having a higher velocity dispersion compared to the majority of galaxies with a similar galaxy mass but which do not have their central SMBH mass directly dynamically measured. However, another potential reason behind this apparent offset is a discrepancy in galaxy stellar mass.
For our investigation of a mass discrepancy between the SMBH sample and the larger SDSS sample, we use i) a sample of local galaxies (without SMBH mass measurement but) with SDSS imaging, analysed with the same techniques as the SMBH sample, and ii) data from the Spitzer Survey of Stellar Structure in Galaxies (, Sheth et al., 2010), both of which we can use as a reference sample for mass comparison. Essentially, we have now performed the same (consistent) galaxy image analysis/decomposition on a sample of 100 local galaxies from the SDSS and 100 local galaxies (having directly measured SMBH masses) imaged with the Spitzer Space Telescope. Cross comparison with each other, with the larger SDDS sample, and the sample, enables us to establish if the stellar masses have been determined consistently.
In Section 2, we describe the data used for our test. Section 3 compares the SDSS-DR7 – curve with the – relations defined by the updated SMBH sample before we resolve the reason behind the current apparent offset in the – diagram. Section 4 discusses the implication of our investigation for the alleged bias in the SMBH scaling relations defined by the dynamically-measured SMBH sample, and Section 5 summarises the findings and the broader implications of this investigation.
2 Data
We calculate the stellar masses of our local SDSS sample of 100 galaxies following the same stellar mass-to-light ratio prescription used in Sh16 for the larger SDSS-DR7 sample. The stellar mass-to-light ratio used for the SMBH sample with m imaging is similar to that used for the sample. By comparing the stellar masses of the two samples with the values independently obtained from the survey for the same galaxies, we can establish if there is an offset in the mass derivation, rather than a biased sample, between the sample with direct SMBH mass measurements and the population at large. A description of these three samples, along with more details on and for the SDSS-DR7 sample, is provided here.
2.1 SMBH sample
The largest-to-date sample of galaxies with dynamically (directly) measured black hole mass currently numbers 150 (145 galaxies are listed in Sahu et al., 2019b). For 127 of these, we have measured the host galaxy properties from careful image analysis, advanced isophotal modelling (in terms of capturing structures and irregularities, Ciambur, 2015), and physically-motivated multicomponent decomposition of the galaxy light. The complete image analysis of the 127 galaxies, primarily (81 per cent) using 3.6 m Spitzer Space Telescope images, was collectively done by Savorgnan & Graham (2016), Davis et al. (2019), and Sahu et al. (2019a), and readers are directed to these parent studies for a detailed description of the galaxy modelling and decomposition procedures, and references to the sources which measured the SMBH mass. There are 73 ETGs and 28 LTGs with Spitzer imaging.
Here, we refer to this reduced Black Hole Sample in ETGs with Spitzer imaging as BHS, and we use the galaxy magnitudes and morphologies in Sahu et al. (2019a) and Savorgnan & Graham (2016). The for the BHS were calculated using a constant stellar mass-to-light ratio of 0.6 (following Meidt et al., 2014) based upon the Chabrier IMF, luminosity distances (provided for the whole BHS in Sahu et al., 2019b, Table 1), and the galaxy magnitudes measured in above studies.
The central velocity dispersion for the BHS is primarily taken from the HyperLeda database, already provided in Sahu et al. (2019b, Table 1), where other sources for a few galaxies are also specified there.
2.2 SDSS-DR7 sample
This is the sample used by Sh16. The galaxy luminosities and effective half-light radii () of the SDSS-DR7 sample come from the two-component (bulge plus disk, SerExp) decompositions of the galaxy light obtained from SDSS -band images analysed in Meert et al. (2015). Following Bernardi et al. (2010, their Equation 6), Sh16 converted the K- and evolution-corrected galaxy luminosity to galaxy stellar mass using a ( colour)-dependent stellar mass-to-light ratio from Bell et al. (2003) based upon the Chabrier (2003) Initial Mass Function (IMF) of stars. Sh16 denoted galaxy stellar mass by ; however, we will denote galaxy stellar mass by for consistency with notation in our previous works and to avoid ambiguity between bulge and galaxy stellar mass.
SDSS provides stellar velocity dispersions measured at an aperture size of for a galaxy. In order to obtain velocity dispersions consistent with the HyperLeda values homogenised at an aperture size of 0.595 kpc, which was/are also used for the SMBH sample, Sh16 applied an empirical mean aperture correction777. provided in Cappellari et al. (2006) for converting the SDSS values to .
2.3 SDSS- sample
This sample of about 100 local galaxies, which we refer to as the “SDSS- sample" throughout this paper, uses galaxy magnitudes measured by Hon et al. (2022) from -band images taken from the SDSS Data Release 8 (DR8). Similar to the SDSS-DR7 sample, they do not yet have a direct SMBH measurement. Hon et al. (2022) used the same image analysis techniques as was done for the sample with black hole measurements (Section 2.1). Hon et al. (2022) also performed two-component decomposition for their sample and found that the galaxy luminosity obtained from their multicomponent and two-component decompositions are similar (Hon et al. 2022, PhD thesis work in preparation for publication).
We applied the following ( colour)-dependent stellar mass-to-light ratio prescription from Bell et al. (2003, based upon a Chabrier IMF) to the (Galactic extinction888Galactic extinction is obtained from Schlafly & Finkbeiner (2011), available at the NASA/IPAC Extragalactic Database. and -corrected999We obtained -corrections for the SDSS- sample using a -correction script (Chilingarian et al., 2010; Chilingarian & Zolotukhin, 2012) based upon the colour. These are however tiny given that the SDSS- sample resides within 100 Mpc.) galaxy luminosities of the SDSS- sample to obtain the galaxy stellar mass.
| (1) |
As was also done in Sh16, and thus with the SDSS-DR7 sample above, the subtraction of 0.093 dex — following Bernardi et al. (2010, their Equation 6) (see also Taylor et al., 2011; Mitchell et al., 2013) — brings the diet-Salpeter IMF used in Bell et al. (2003) in line with the Chabrier IMF.
The velocity dispersions for the SDSS- sample are taken from the HyperLeda database.
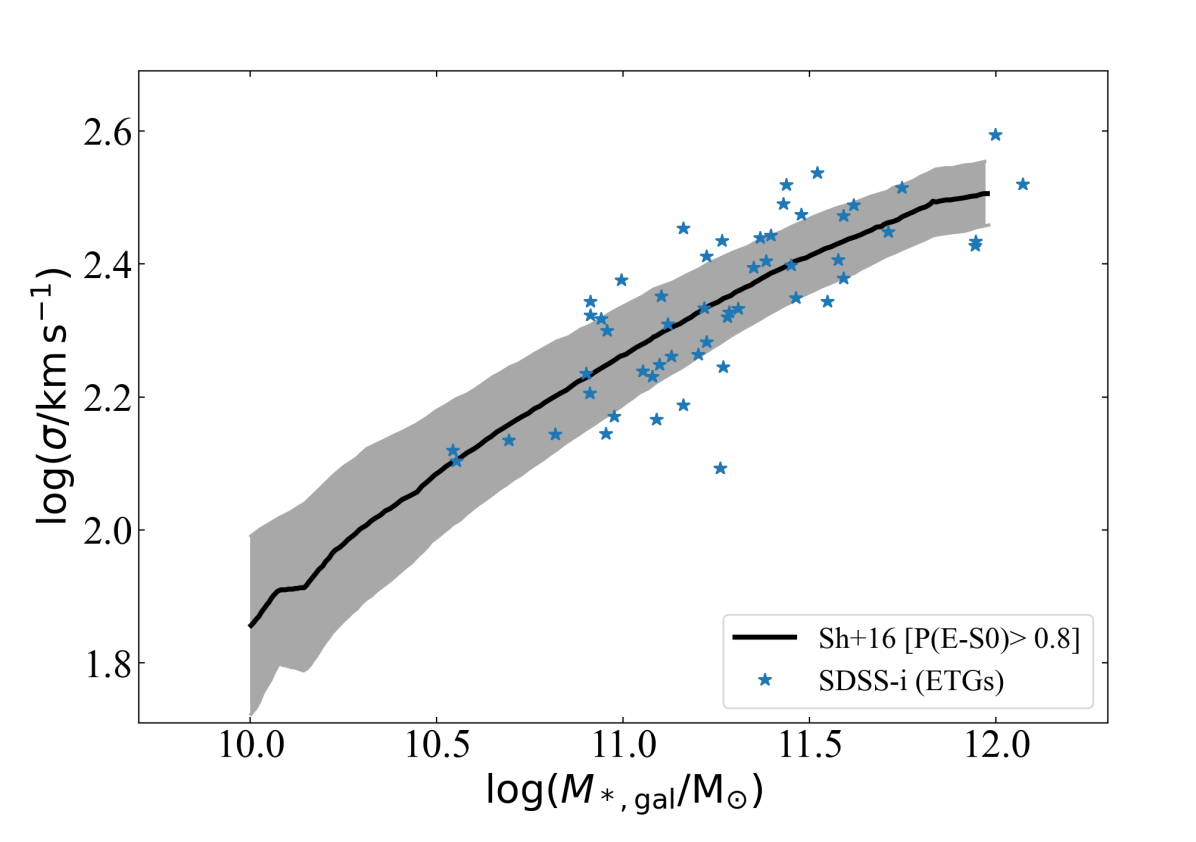
Figure 2 shows the 53 ETGs from this SDSS- sample plotted along with the curve for the SDSS-DR7 ETGs from Sh16. While in Figure 1, we saw the ETGs from the BHS offset from the SDSS-DR7 distribution, here we see that the SDSS- (ETGs) are uniformly distributed about the – curve from Sh16. Given this agreement between the SDSS-DR7 and SDSS- samples, we can use the SDSS- ETG sample from Hon et al. (2022) to investigate the offset between the SMBH sample and the SDSS-DR7 sample in the – diagram. To do so, we simply require a calibrator sample.
2.4 sample
We used the S4G catalogue of local galaxies (Sheth et al., 2010) as our reference sample for galaxy stellar mass comparison. The is a catalogue of nearby (distance ) galaxies imaged by the Infra-Red Array Camera (IRAC: Fazio et al., 2004) onboard the Spitzer Space Telescope. The S4G provided galaxy images in m and m bands with outer galaxy isophotes traced out to . The two IRAC band images are thought to provide the best estimates of the stellar mass of a galaxy. This is because the galaxy images/light profiles in these bands are unaffected by young star bias (which is prominent in optical images) or by dust obscuration (although LTGs can have glowing warm dust: Querejeta et al., 2015). The (3.6-4.5 m) colour is almost constant with radius and independent of the stellar population age and mass function, suggesting a stable stellar mass-to-light ratio in these bands (Jun & Im, 2008; Meidt et al., 2014).
We use two samples of 37 and 43 ETGs from the catalogue comprising the galaxies in common with the BHS (of 73 ETGs) and the SDSS- sample (of 53 ETGs), respectively. The galaxy stellar mass, galaxy magnitude, and distance information for these galaxies are taken from the publicly available catalogue.101010https://cdsarc.unistra.fr/viz-bin/nph-Cat/html?J/PASP/122/1397/s4g.dat.gz The galaxy stellar mass for the sample is derived using the 3.6 m magnitudes, obtained from four-component (bulge, disk, bar, and nuclear component, where required) fits to the galaxy light, and a (m) colour-dependent mass-to-light ratio with a mean (median and mode) value of , consistent with the BHS (Section 2.1), based upon the Chabrier IMF. The central velocity dispersions for the samples used here are also taken from the HyperLeda database.
3 Analysis
3.1 Galaxies with and without dynamically measured SMBHs in the – diagram
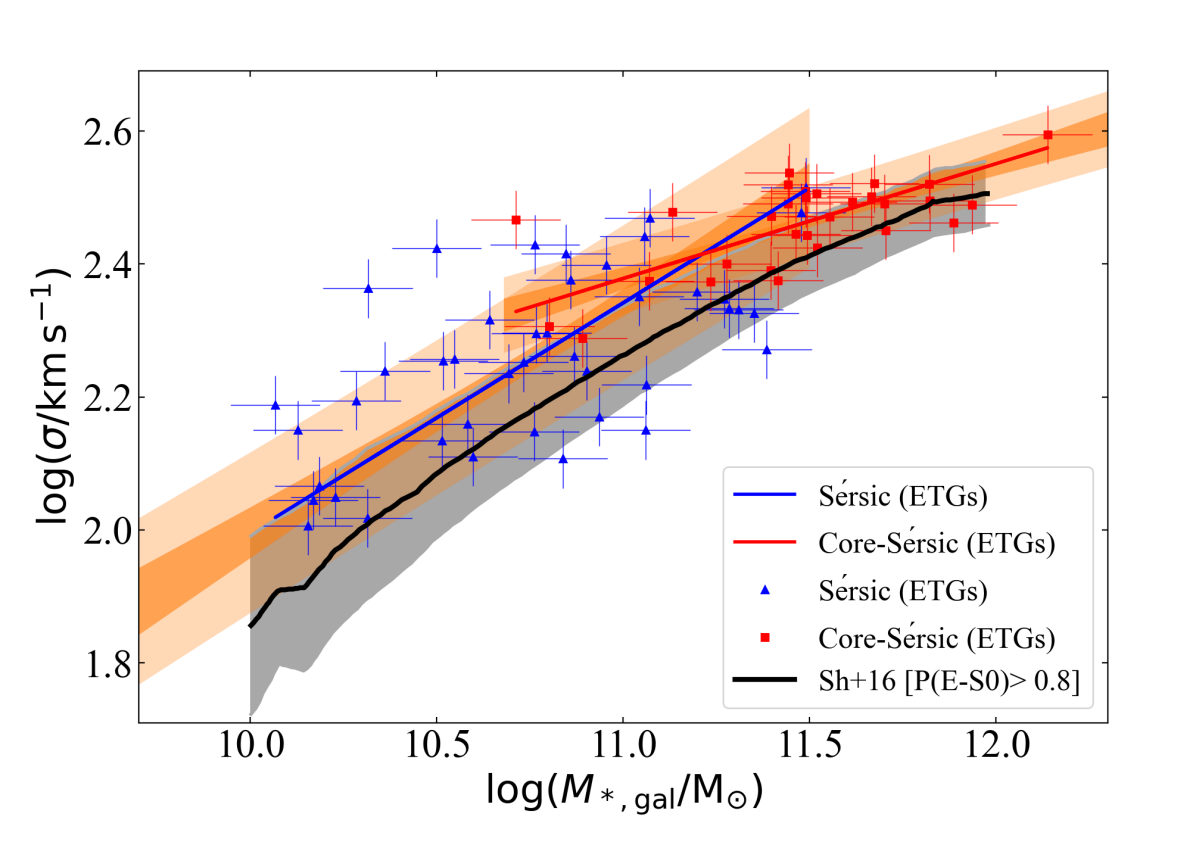
Figure 3 shows the latest (bent) – relations obtained using the ETGs in the BHS (Section 2.1), where Sérsic111111Sérsic galaxies likely grow through gas abundant mergers/accretion, and their bulge/spheroid light profile is aptly described using a Sérsic (1968) function. ETGs (blue triangles) and core-Sérsic121212Core-Sérsic galaxies, unlike the Sérsic galaxies, have a depleted central bulge/spheroid light profile which is described using the core-Sérsic function (Graham et al., 2003). The deficit of stellar light is caused during dry (gas-poor) merger-driven evolution, where the inspiral of the central SMBHs of the merging galaxies scours out stars from the centre by orbital angular momenta transfer (Begelman et al., 1980). galaxies (red squares), all of which are ETGs, define distinct relations. This – diagram is adapted from Sahu et al. (2019b, their Figure 15) with the best-fits obtained using the symmetric Bivariate Correlated Errors and Intrinsic Scatter (bces) linear regression (Akritas & Bershady, 1996). We continue using the symmetric bces (aka, bces(bisector)) regression for all the fits shown in this paper. We checked each fit by performing a symmetrical analysis of the data using two additional routines: linmix (Kelly, 2007) and mfitexy (Tremaine et al., 2002). While these are asymmetrical regression routines which assume that one variable is dependent on the other, swapping the order of the two variables input into these codes provides a second relation that can be combined with the first to yield a symmetrical bisector regression. In doing so, we obtained consistent results from all three codes.
The relations defined by the Sérsic ETGs (blue line) and core-Sérsic ETGs (red line) galaxies are, respectively:
| (2) |
with a total root-mean-square (rms) scatter in the vertical direction () of 0.16 dex, and
| (3) |
with =0.05 dex. Here, we used a 0.12 dex uncertainty on and a 10 per cent uncertainty on (following Sahu et al., 2019a, b). The dark orange shaded regions around the blue and red lines shown in Figure 3 mark the 68 per cent certainty on the slopes and intercepts, and the light orange shaded regions enclose 68 per cent of the data distributed about these lines. The meaning of the dark and light-shaded regions around the best-fit line remains the same throughout the paper.
Although the bend or curvature in the – (or –) diagram has been known for a long time (e.g., Davies et al., 1983; Farouki et al., 1983; de Rijcke et al., 2005; Matković & Guzmán, 2005; Lauer et al., 2007; Graham & Soria, 2019), the size of the SMBH sample used for the comparison in Sh16 was not large enough to see this bend within the SMBH sample. We can now see that the bent – relation defined by the BHS is almost parallel to the curvature defined by the larger SDSS-DR7 sample. One can fit a curve to describe the distribution of the BHS in the – diagram (Figure 3); however, we will continue using two power-law fits for BHS as it does not affect the outcome of this investigation.
Compared to Figure 1, Figure 3 (which uses the current expanded BHS) shows a mildly reduced offset between the BHS and the SDSS-DR7 sample, i.e., galaxies without a direct SMBH mass measurement. The – (black) curve defined by the SDSS-DR7 sample lies within the 68 per cent () scatter bound (i.e., the light orange shaded region) of the BHS. The scatter (grey) region of the SDSS-DR7 curve also partially overlaps with the uncertainty (dark orange shaded) region about the best-fit relations for the BHS. However, there is still a noticeable offset between the best-fit relations for the BHS and the mean – curve defined by the SDSS-DR7 sample.
In the following subsections, we explore if this offset is because of a discrepancy in the stellar mass calculation, primarily due to the stellar mass-to-light ratio used to convert galaxy luminosity into galaxy stellar mass. We investigate the offset in stellar mass by comparing the BHS and SDSS- samples (and thus the BHS and SDSS-DR7 samples, given the agreement between the SDSS- and SDSS-DR7 samples in Figure 2) using the sample as a reference.
3.2 Comparison between the SMBH sample and the sample
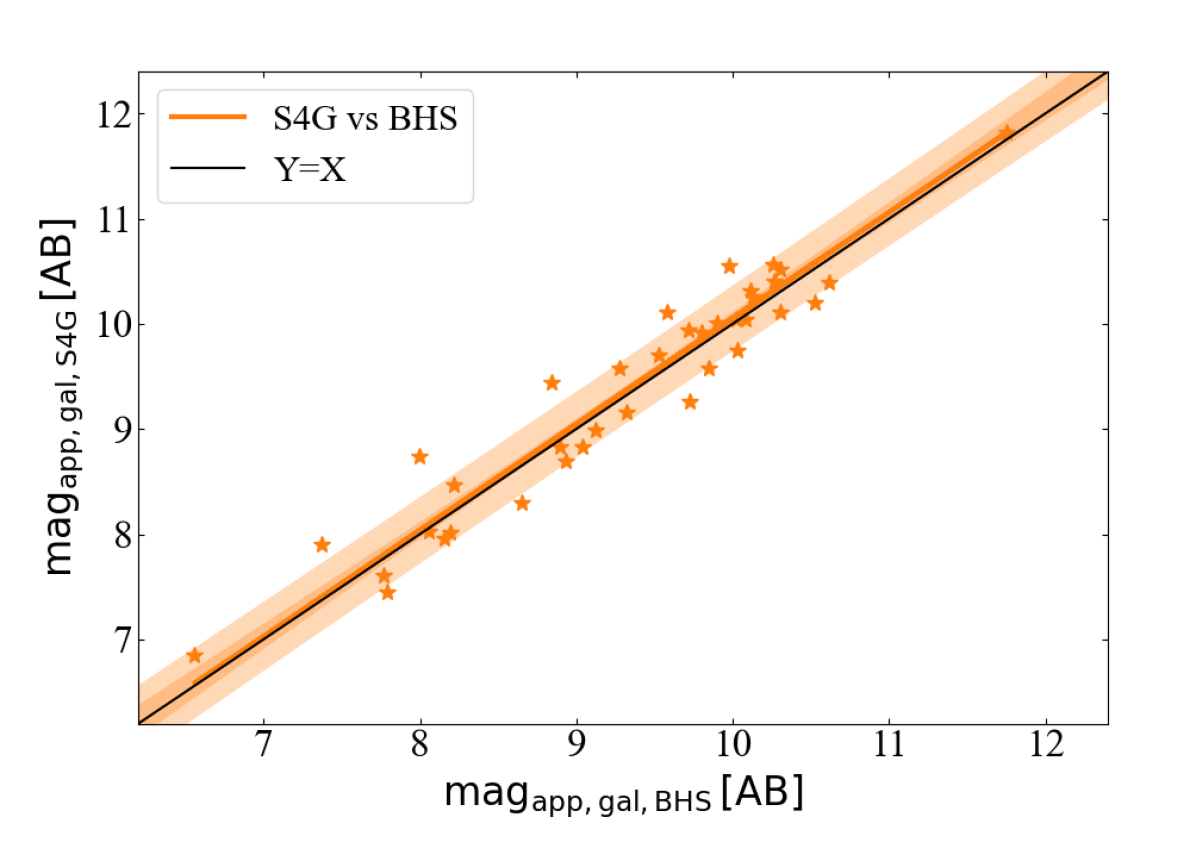
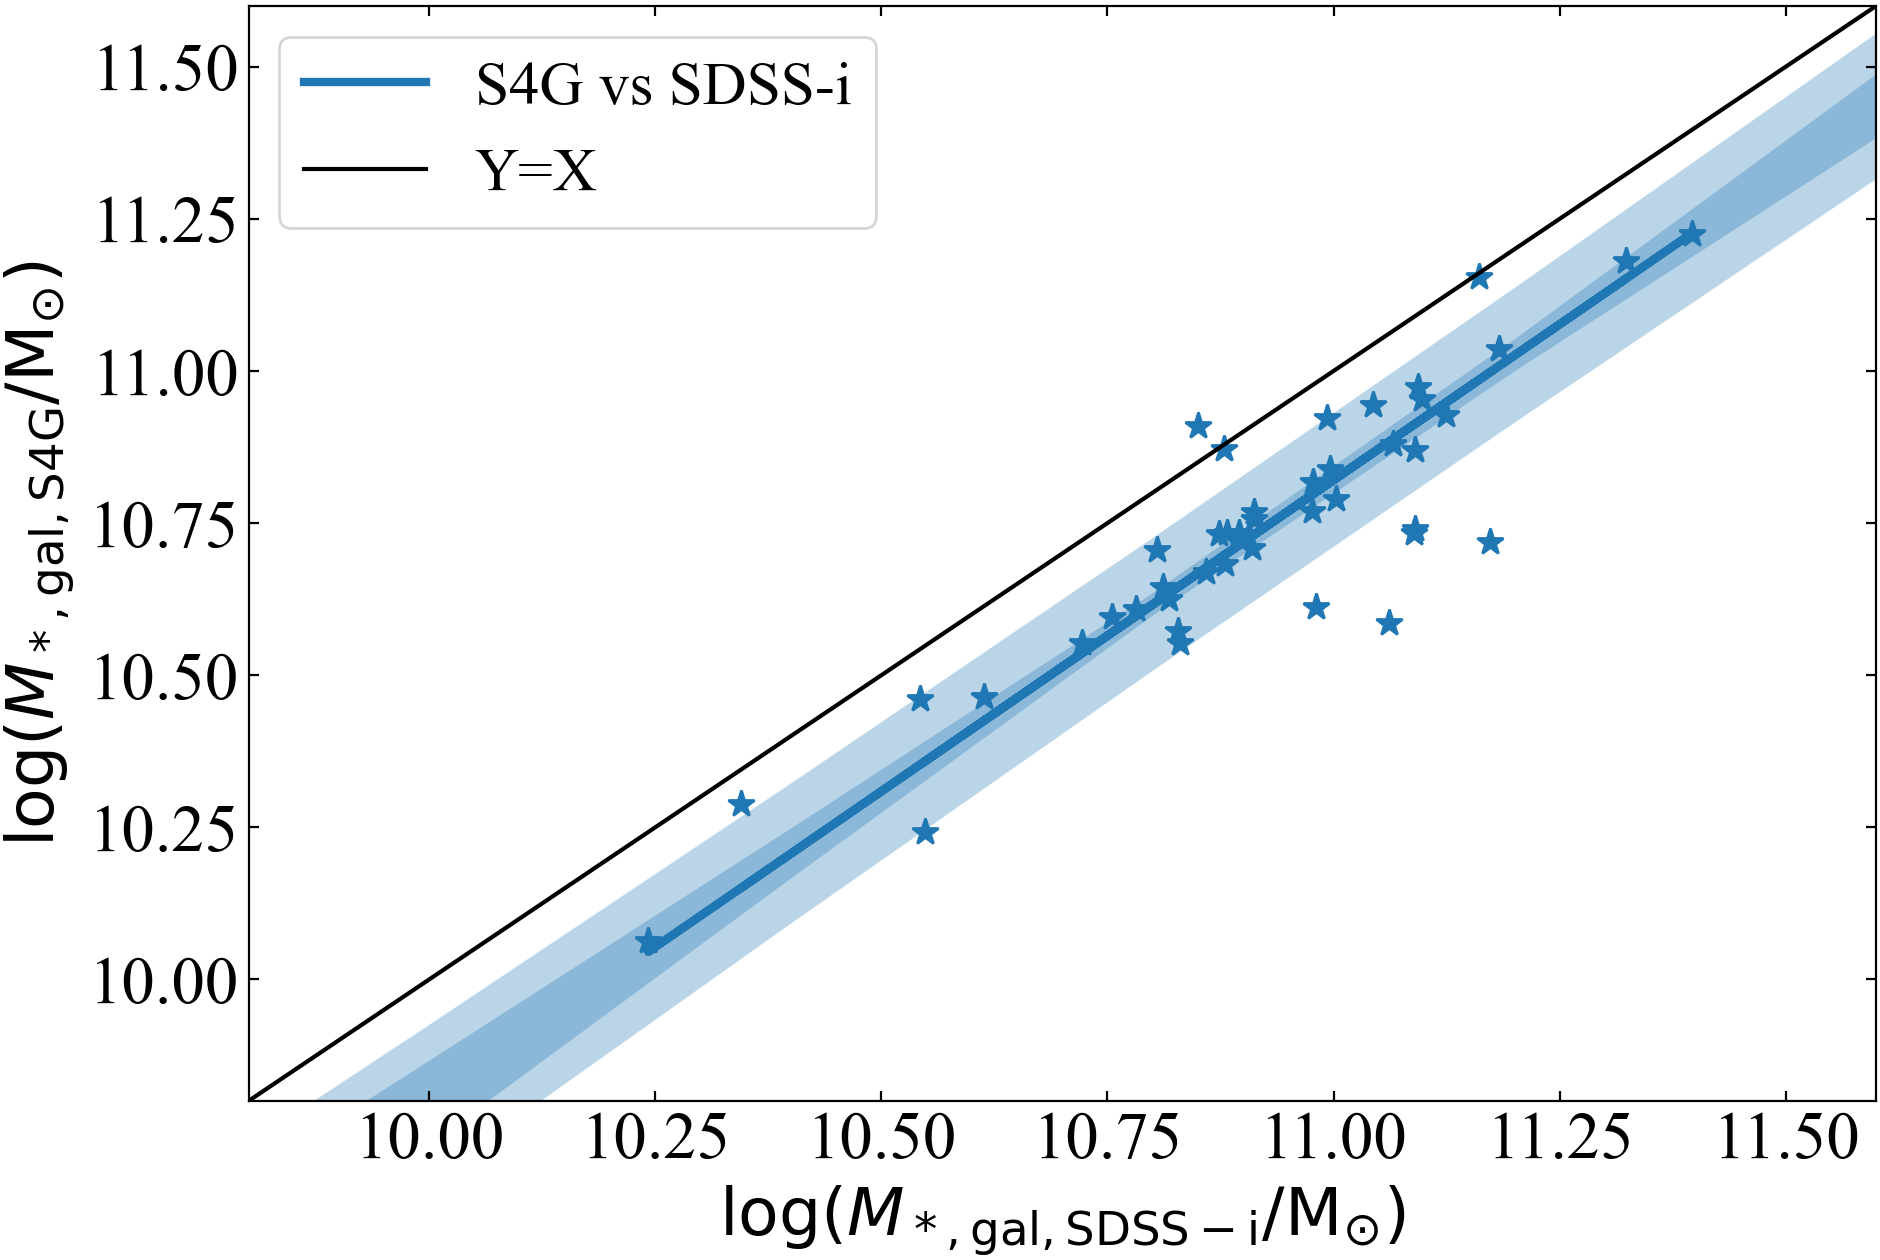
Figure 4 compares the BHS and the reference sample using 37 galaxies common to the two samples. As both samples have m-band imaging, we can directly compare the galaxy’s apparent magnitudes, shown in the top panel of Figure 4. The (black) line and the orange bces(bisector) line fit131313For an appropriate comparison of galaxy properties (mass, magnitude) from different samples, the bces(bisector) regression is preferred here because this symmetric regression offers equal treatment of both variables. to the distribution in Figure 4 are provided to quickly assess the one-to-one correspondence between the measured galaxy magnitudes, and thus stellar masses, of galaxies in common with the two samples.
3.3 Comparison between SDSS- sample and the sample
Figure 5 compares the galaxy stellar masses between the and SDSS- samples using 43 galaxies in common to both samples. The X-axis shows the galaxy stellar mass based upon the SDSS -band galaxy magnitudes from Hon et al. (2022), and the ( colour)-based mass-to-light ratio (Equation 1), and the Y-axis shows the stellar mass of the same galaxies based upon the 3.6 m galaxy magnitudes and . Given the agreement in Figure 4, this will yield stellar masses for the S4G sample that are consistent with the BHS. Given the agreement in Figure 2, it will also yield SDSS- stellar masses that are consistent with SDSS-DR7 from Sh16. Here, for both and , we adopted the galaxy distances from Hon et al. (2022).
Figure 5 shows that the SDSS- sample has a higher galaxy stellar mass than the sample. In Figure 3, we saw that the SDSS-DR7 sample masses used in Sh16, which agree with the SDSS- sample (Figure 2), are offset from the BHS. At the same time, the galaxy stellar masses from the sample and the BHS (Figure 4) agree well; thus, this offset between the stellar masses from SDSS- and was expected.
Given that we are comparing the entire galaxy stellar mass rather than the mass of a galaxy component, and both Hon et al. (2022, for the SDSS- sample) and Sheth et al. (2010, for the sample) performed multicomponent decomposition, rather than single Sérsic fits, a discrepancy in galaxy magnitude should not be the dominant reason behind this offset. This suggests that the significant offset between the stellar masses for the SDSS- and masses is because of an inconsistency in the stellar mass-to-light ratio prescriptions used.
To quantify the offset between the SDSS- and stellar masses, we perform a symmetric regression providing the best-fit (blue) line shown in Figure 5. This line can be expressed as
| (4) | |||||
The mean horizontal offset () of the blue line in Figure 5 as a function of the (SDSS-)-based mass is
| (5) |
3.4 Correcting the – curve
Discrepancies in stellar mass-to-light ratio have been frequently discussed in the literature (e.g., Kannappan & Gawiser, 2007; Taylor et al., 2011; Zhang et al., 2017; Graham et al., 2019; Schombert et al., 2019; Lower et al., 2020), including Davis et al. (2019) and Sahu et al. (2019a). Using an inconsistent stellar mass in the observed – relation will predict an erroneous SMBH mass. Thus, Davis et al. (2019) introduced a mass correction coefficient (), defined as a ratio of the stellar mass-to-light ratio used to construct the SMBH scaling relations and to measure the mass of a new target of interest. Essentially, this correction coefficient brings stellar masses calculated using another mass-to-light ratio prescription into consistency with the scaling relations.
Sahu et al. (2019a, in their Section 3.4) generalised this mass correction coefficient to accommodate stellar masses based upon luminosity measured in different bands and as a function of the stellar mass. The derived here can be thought of as the correction coefficient , which should be added to the SDSS- stellar masses (SDSS- magnitude + Bell et al. (2003) mass-to-light ratio Chabrier (2003) IMF) to bring them into consistency with the stellar masses. This approach of using in the SMBH scaling relations involving stellar mass to resolve the stellar mass discrepancy is not yet widespread, given the challenge of estimating for all possible filters plus mass-to-light ratio combinations. However, it is crucial.
From the above investigations, we found the following.
-
•
Our SDSS- and the SDSS-DR7 masses agree in the – diagram (Figure 2).
-
•
Both SDSS- and SDSS-DR7 masses are offset towards higher or lower from the BHS in the – diagram (Figure 3).
-
•
There is a good agreement of BHS galaxy magnitudes, and thus stellar masses, with the reference sample (Figure 4).
- •
-
•
This offset in the galaxy stellar mass likely originates from the inconsistency in the adopted (stellar mass)-to-light ratio prescriptions.
The offset of the SDSS- masses (which agrees with the SDSS-DR7 masses) from the reference sample (which agrees with the BHS), is also a measure of the offset between the SDSS-DR7 and BHS masses. Thus, the use of Equation 5 enables us to correct for the differing/inconsistent derivations of the stellar mass, which may explain the offset seen in the – diagram (Figure 3) between the relations defined by the BHS and Sh16 curve formed by the SDSS-DR7 ETG sample.
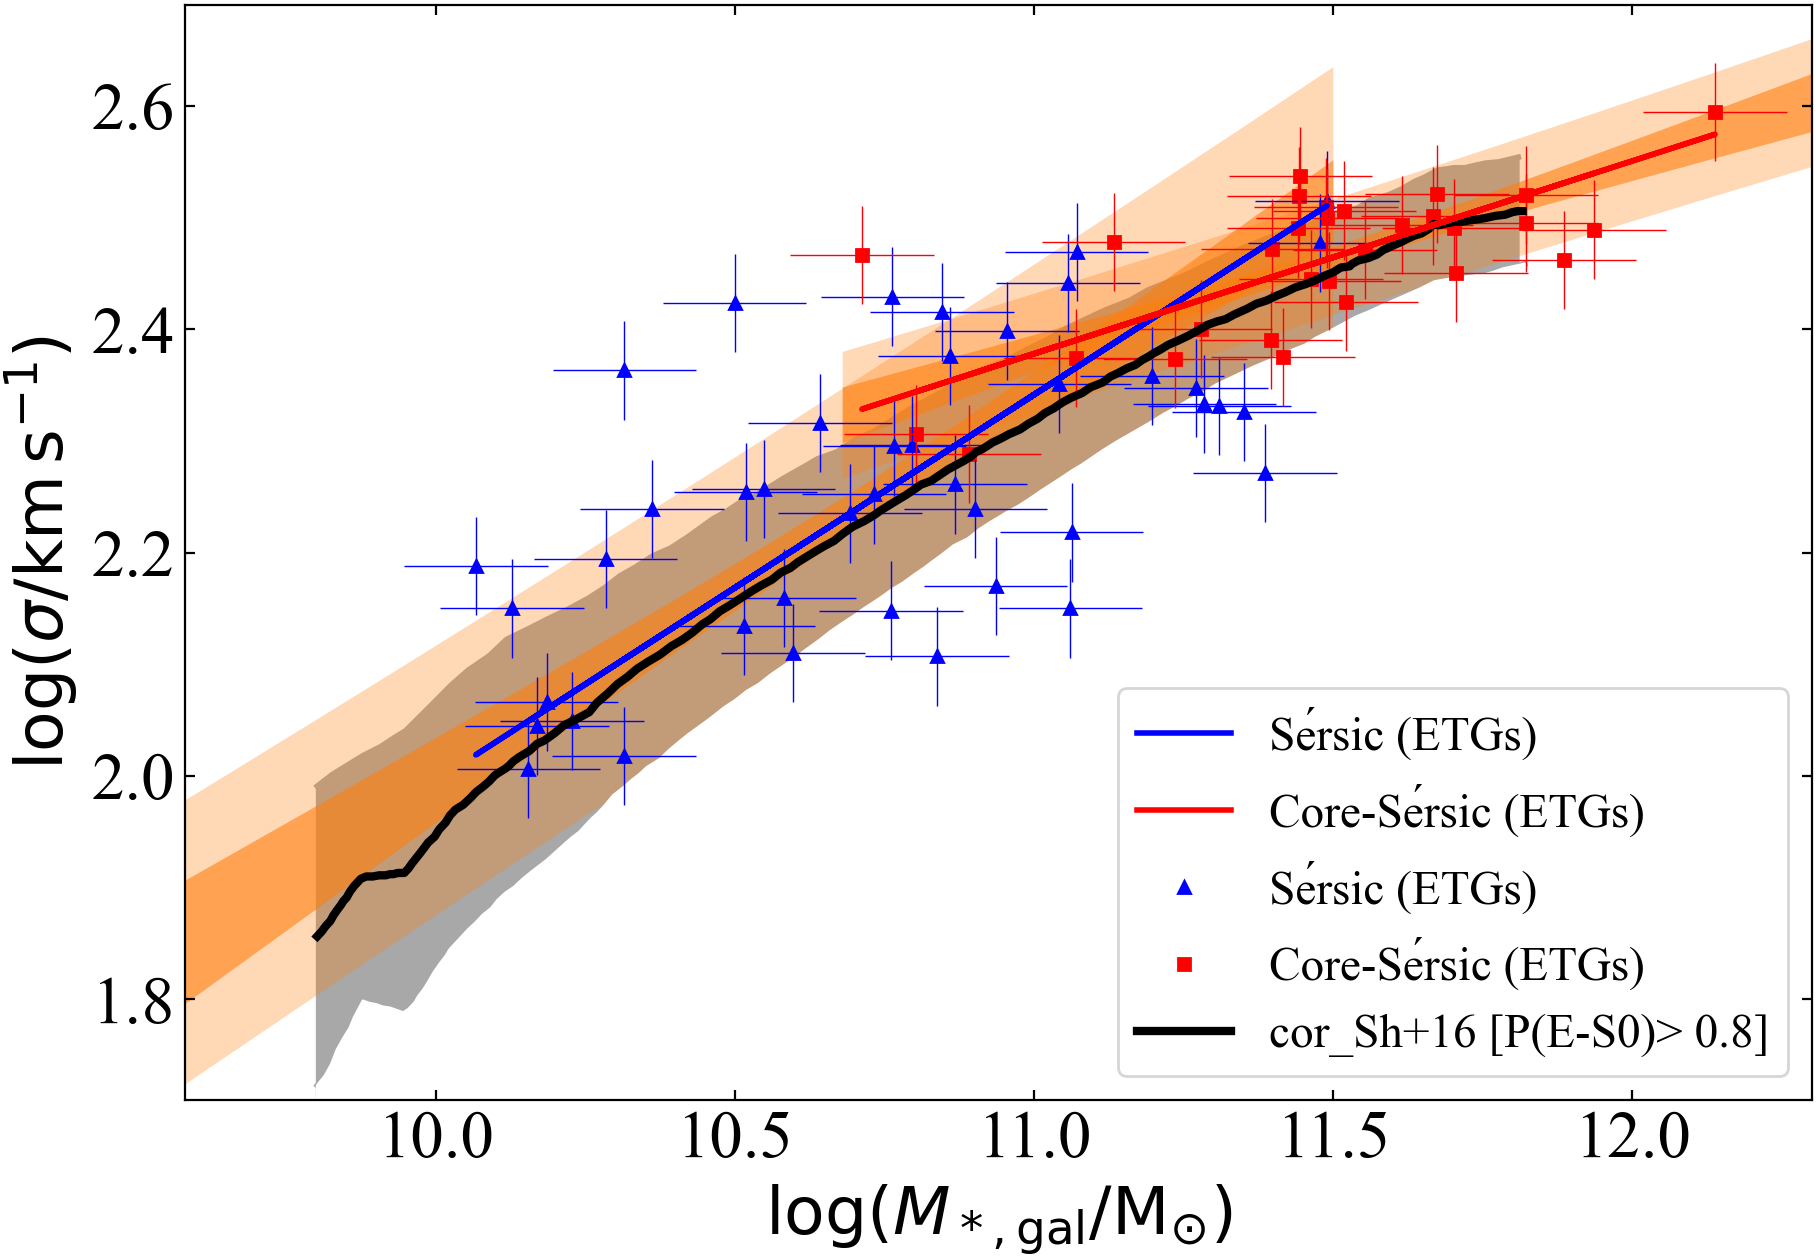
Figure 6 presents the – diagram with the systematic stellar mass correction (i.e., the addition of the mean logarithmic offset , Equation 5) applied to the SDSS-DR7 galaxy masses. Evidently, the corrected black curve defined by the SDSS-DR7 ETG sample now matches very well with the bent – relations defined by Sérsic and core-Sérsic ETGs in the BHS. The correction provided by Equation 5 translates into a 0.1 dex shift in in the – diagram. For a slope of 5 in the – diagram, this maps to a shift of 0.5 dex in the SMBH mass.
4 Implications for the Sh16 “intrinsic models”
Sh16 believed that the offset initially seen in the – diagram is natural and occurs because, for the same galaxy stellar mass, the BHS has a higher relative to the broader SDSS-DR7 sample. That is, they thought that the SMBH scaling relations are selection biased as they are based on a sample of local galaxies with massive SMBHs having higher than the population at large. To obtain what they thought was the unbiased SMBH scaling relation (that they refer to as the “intrinsic" relation) using their Monte Carlo simulation, Sh16 used SMBH predictor models, e.g., , based upon the available SMBH scaling relations at the time. Additionally, what is important to note is that they reduced the normalisation (intercept, ) of their SMBH predictor models by 0.4-0.6 dex (see their Section 4.1) due to the offset seen in Figure 1 but explained in Figure 5. This played an important role in producing their “intrinsic" SMBH scaling relation, which had lower normalisation than the (original) directly observed SMBH scaling relations, i.e., the relations based upon a galaxy sample with SMBH masses directly measured using stellar or gas dynamical modelling or megamaser kinematics.
Sh16 did not specifically mention the exact reference for their SMBH predictor models. Based on the description and references in their Section 4.1, the coefficients () of their SMBH predictor models are taken from the parameters of concurrent SMBH scaling relations (e.g., Kormendy & Ho, 2013; McConnell & Ma, 2013). For example, their Model-II () is essentially a linear combination of the and relations from McConnell & Ma (2013) and Kormendy & Ho (2013), respectively, accompanied by a normalisation () reduction of dex. This linear combination is also very similar to the plane provided by Hopkins et al. (2007), another reference mentioned in Sh16. In their Model-I, they doubled the coefficient of the term to obtain a stronger intrinsic dependence on .
The reduction in the normalisation, , of their SMBH predictor models by 0.4-0.6 dex was to account for an average offset of dex in (that they noticed in the – diagram), coupled with a slope of 5 for the – relation. This is because dex corresponds to dex based upon (that is, ). This artificial normalisation reduction in the Sh16 SMBH predictor models fully explains the offset seen (in -direction) when comparing their predicted – relation with the relation obtained using the directly-dynamically measured SMBH sample in Savorgnan & Graham (2015), de Nicola et al. (2019), and Sahu et al. (2019b). Moreover, this normalisation reduction explains a significant part of the offset seen (e.g., Shankar et al., 2020a, b; Allevato et al., 2021) when comparing their predicted – (or ) curve with the directly observed – relations based upon the dynamically measured SMBH sample (Kormendy & Ho, 2013; Savorgnan et al., 2016; Davis et al., 2018; Sahu et al., 2019a).
A simple increment of 0.4-0.6 dex (reversing what Sh16 subtracted) in the normalisation of their Monte-Carlo generated – relation (Equation 7 in Sh16, based upon their Model-I with stronger intrinsic dependence on ), places it directly on top of the observed – relations in, for example, McConnell & Ma (2013), Savorgnan & Graham (2015), and the latest morphology-dependent – relations presented in Sahu et al. (2019b), where normal Sérsic galaxies yield – and the core-Sérsic galaxies yield – (as also seen in Bogdán et al., 2018; Dullo et al., 2020).
In the – diagram, simply removing the normalisation adjustment of 0.4-0.6 dex from the Sh16 “intrinsic" relation will bring it closer to the current, directly observed – relations based on the BHS (Sahu et al., 2019a), but not exactly match. This is because, first, the Sh16 was predicted using models based upon the previously current, i.e., contemporaneous, – relation plus a linear – relation (with an artificially reduced normalisation). However, the – relation was incorrectly used as an –(total galaxy) stellar mass (, or ) relation for ETGs, which are not only comprised of purely spheroidal elliptical galaxies but also include ellicular/lenticular (ES/S0-type) galaxies with discs. The second reason is the inconsistency in the calculated galaxy stellar mass (as revealed here between the BHS and SDSS-DR7 sample), which was used in their models to predict the SMBH mass and to generate their “intrinsic” SMBH relation.
Although a moot exercise now, an alternative approach would have been to acquire velocity dispersions for the ETGs in the S4G. This approach would have enabled the construction of the – relation using the same infrared luminosities as done with the sample of galaxies having directly-measured black hole masses, bypassing the (as it turned out, biased) masses in the SDSS.
In passing, we note that one ought to use the morphology-dependent – relations — see Sahu et al. (2019a) and Graham & Sahu (2022) — to construct the predictor model when involving galaxy stellar mass () as one of the independent/input parameters. While the conclusion in Sh16 is not correct, and the sample of galaxies with directly measured SMBH masses is not biased, the misperceived offset in the – diagram has seen some partial success in subsequent works. This is because of the way the “intrinsic” model from Sh16 sometimes effectively readjusts the observed SMBH scaling relation for consistency with samples whose stellar masses were derived inconsistently with the – scaling relations. However, in application, it is not always as straight forward as this, and past work based on the biased “intrinsic” – relation should be revisited using the observed SMBH scaling relations.
5 Summary
We have investigated the offset Sh16 observed in the – diagram between galaxies with dynamical SMBH mass measurements and a sample of galaxies (SDSS-DR7, Section 2.2) without dynamical SMBH mass measurements (see Figure 1). As seen in Figure 3, while the current sample of ETGs with dynamical SMBH mass measurements (BHS: Section 2.1) has more data points overlapping with the SDSS-DR7 sample than compared to a subset from Savorgnan et al. (2016), the distinct – relations defined by the Sérsic and core-Sérsic galaxies from the BHS are offset and almost parallel to the – curve defined by the SDSS-DR7 sample of ETGs. At odds with the assumption in Sh16, our investigation has revealed that this offset in the – diagram is in the horizontal direction; that is, the offset is due to a discrepancy in the derived galaxy stellar mass rather than different the velocity dispersions.
The – diagram shows no natural offset/discrepancy between the BHS and galaxies without dynamical SMBH mass measurements. The SMBH scaling relations defined by galaxies with dynamically measured SMBH masses are not biased. The initial offset seen by Sh16 and, further, in Figure 3, is artificial and caused by an inconsistency in the derivation of the stellar mass. This stellar-mass offset is quantified in Equation 5, which can be used as a mass correction equation to bring the SDSS-DR7 galaxy masses into agreement with the masses and thus the BHS masses.
We conclude that one does not have to account for a bias/offset when correctly applying various directly observed BH–galaxy correlations. For example, to predict in other galaxies, to calibrate the virial factor required to convert the virial product of an active galactic nucleus (AGN) into an SMBH mass via the reverberation mapping technique (Bennert et al., 2011; Bentz & Katz, 2015), to estimate the SMBH mass function of the Universe (McLure & Dunlop, 2004; Graham & Driver, 2007; Kelly, 2007), and to estimate the detectable/expected long gravitational-wave background (GWB) strain and event rate (Shannon et al., 2015; Sesana et al., 2016). However, to correctly use the SMBH scaling relations for the above purposes, one should account for the possible discrepancy in the derivation of the stellar mass (or other input parameters) and also note the galaxy morphology when using the latest morphology-dependent SMBH scaling relations.
Our conclusion further suggests that the correction in the expected GWB amplitude estimated in Sesana et al. (2016), accounting for the bias in SMBH scaling relations claimed by Sh16, was not required. However, we strongly recommend revising the expected GWB models using the latest morphology-dependent SMBH scaling relations. These can significantly modify the previous estimates based upon the old linear – relation and an assumed constant bulge-to-total stellar mass ratio (e.g., Shannon et al., 2015). Sahu et al. (2022, Section 5) provide more details on applying the latest SMBH scaling relations for an improved GWB strain model. Similarly, the morphology-dependent SMBH scaling relations can now provide improved morphology-aware virial factors, morphology-aware SMBH mass functions, better SMBH mass estimates for galaxies with known morphology, and improved tests for simulations hoping to form realistic galaxies with central SMBHs.
Acknowledgements
We thank the astrophysics group at the University of Queensland for hosting N.S. for over a year during the covid-19 pandemic. Some of this research was conducted within the Australian Research Council’s Centre of Excellence for Gravitational Wave Discovery (OzGrav), through project number CE170100004. This project was also supported under the Australian Research Council’s funding scheme DP17012923. This work has made use of the NASA/IPAC Infrared Science Archive and the NASA/IPAC Extragalactic Database (NED), which are funded by NASA and operated by the California Institute of Technology. Funding for the SDSS was provided by the Alfred P. Sloan Foundation, the Participating Institutions, the National Science Foundation, the U.S. Department of Energy, the National Aeronautics and Space Administration, the Japanese Monbukagakusho, the Max Planck Society, and the Higher Education Funding Council for England. This research has made use of NASA’s Astrophysics Data System Bibliographic Services and the HyperLeda database (http://leda.univ-lyon1.fr). After completing the analysis for this paper just prior to the pandemic and extensive lockdowns in Melbourne, we discovered that Schombert et al. (2022) also offers a self-consistent prescription for and [3.6] colour-dependent stellar mass to light ratios which will be useful for some readers.
Data Availability
The imaging data can be found from the sources referenced in Section 2, and includes SDSS-DR8 (https://www.sdss3.org/dr8/), S4G (https://irsa.ipac.caltech.edu/data/SPITZER/S4G/), and the Spitzer Heritage Archive (SHA: http://sha.ipac.caltech.edu). Concise data tables can also be requested from N.S.
References
- Abazajian et al. (2009) Abazajian K. N., et al., 2009, ApJS, 182, 543
- Akritas & Bershady (1996) Akritas M. G., Bershady M. A., 1996, ApJ, 470, 706
- Allevato et al. (2021) Allevato V., Shankar F., Marsden C., Rasulov U., Viitanen A., Georgakakis A., Ferrara A., Finoguenov A., 2021, ApJ, 916, 34
- Baade & Minkowski (1954) Baade W., Minkowski R., 1954, ApJ, 119, 206
- Begelman et al. (1980) Begelman M. C., Blandford R. D., Rees M. J., 1980, Nature, 287, 307
- Beifiori et al. (2012) Beifiori A., Courteau S., Corsini E. M., Zhu Y., 2012, MNRAS, 419, 2497
- Bell et al. (2003) Bell E. F., McIntosh D. H., Katz N., Weinberg M. D., 2003, ApJS, 149, 289
- Bennert et al. (2011) Bennert V. N., Auger M. W., Treu T., Woo J.-H., Malkan M. A., 2011, ApJ, 726, 59
- Bentz & Katz (2015) Bentz M. C., Katz S., 2015, PASP, 127, 67
- Bernardi et al. (2007) Bernardi M., Sheth R. K., Tundo E., Hyde J. B., 2007, ApJ, 660, 267
- Bernardi et al. (2010) Bernardi M., Shankar F., Hyde J. B., Mei S., Marulli F., Sheth R. K., 2010, MNRAS, 404, 2087
- Bogdán et al. (2018) Bogdán Á., Lovisari L., Volonteri M., Dubois Y., 2018, ApJ, 852, 131
- Burbidge et al. (1963) Burbidge G. R., Burbidge E. M., Sandage A. R., 1963, Reviews of Modern Physics, 35, 947
- Cappellari et al. (2006) Cappellari M., et al., 2006, MNRAS, 366, 1126
- Chabrier (2003) Chabrier G., 2003, Publ. Astron. Soc. Australia, 115, 763
- Chilingarian & Zolotukhin (2012) Chilingarian I. V., Zolotukhin I. Y., 2012, MNRAS, 419, 1727
- Chilingarian et al. (2010) Chilingarian I. V., Melchior A.-L., Zolotukhin I. Y., 2010, MNRAS, 405, 1409
- Ciambur (2015) Ciambur B. C., 2015, ApJ, 810, 120
- Davies et al. (1983) Davies R. L., Efstathiou G., Fall S. M., Illingworth G., Schechter P. L., 1983, ApJ, 266, 41
- Davis et al. (2018) Davis B. L., Graham A. W., Cameron E., 2018, ApJ, 869, 113
- Davis et al. (2019) Davis B. L., Graham A. W., Cameron E., 2019, ApJ, 873, 85
- Dressler (1989) Dressler A., 1989, in Osterbrock D. E., Miller J. S., eds, IAU Symp. Vol. 134, Active Galactic Nuclei. Kluwer Academic Publishers, Dordrecht, p. 217
- Dressler & Richstone (1988) Dressler A., Richstone D. O., 1988, ApJ, 324, 701
- Dullo et al. (2020) Dullo B. T., Gil de Paz A., Knapen J. H., 2020, arXiv e-prints, p. arXiv:2012.04471
- Farouki et al. (1983) Farouki R. T., Shapiro S. L., Duncan M. J., 1983, ApJ, 265, 597
- Fazio et al. (2004) Fazio G. G., et al., 2004, ApJS, 154, 10
- Ferrarese (2002) Ferrarese L., 2002, ApJ, 578, 90
- Ferrarese & Ford (2005) Ferrarese L., Ford H., 2005, Space Sci. Rev., 116, 523
- Genzel (2021) Genzel R., 2021, arXiv e-prints, p. arXiv:2102.13000
- Graham (2007a) Graham A. W., 2007a, MNRAS, 379, 711
- Graham (2007b) Graham A. W., 2007b, MNRAS, 379, 711
- Graham (2012) Graham A. W., 2012, ApJ, 746, 113
- Graham (2016) Graham A. W., 2016, in Laurikainen E., Peletier R., Gadotti D., eds, Astrophysics and Space Science Library Vol. 418, Galactic Bulges. p. 263 (arXiv:1501.02937), doi:10.1007/978-3-319-19378-6_11
- Graham (2019) Graham A. W., 2019, MNRAS, p. 1547
- Graham & Driver (2007) Graham A. W., Driver S. P., 2007, MNRAS, 380, L15
- Graham & Sahu (2022) Graham A. W., Sahu N., 2022, MNRAS, accepted (arxiv:2209.14526)
- Graham & Scott (2013) Graham A. W., Scott N., 2013, ApJ, 764, 151
- Graham & Scott (2015) Graham A. W., Scott N., 2015, ApJ, 798, 54
- Graham & Soria (2019) Graham A. W., Soria R., 2019, MNRAS, 484, 794
- Graham et al. (2003) Graham A. W., Erwin P., Trujillo I., Asensio Ramos A., 2003, AJ, 125, 2951
- Graham et al. (2019) Graham A. W., Soria R., Davis B. L., 2019, MNRAS, 484, 814
- Gültekin et al. (2009) Gültekin K., et al., 2009, ApJ, 698, 198
- Häring & Rix (2004) Häring N., Rix H.-W., 2004, ApJ, 604, L89
- Hon et al. (2022) Hon D. S. H., Graham A. W., Davis B. L., Marconi A., 2022, MNRAS,
- Hopkins et al. (2007) Hopkins P. F., Hernquist L., Cox T. J., Robertson B., Krause E., 2007, ApJ, 669, 67
- Hoyle & Fowler (1963) Hoyle F., Fowler W. A., 1963, MNRAS, 125, 169
- Huertas-Company et al. (2011) Huertas-Company M., Aguerri J. A. L., Bernardi M., Mei S., Sánchez Almeida J., 2011, A&A, 525, A157
- Jun & Im (2008) Jun H. D., Im M., 2008, ApJ, 678, L97
- Kannappan & Gawiser (2007) Kannappan S. J., Gawiser E., 2007, ApJ, 657, L5
- Kelly (2007) Kelly B. C., 2007, ApJ, 665, 1489
- Kormendy & Ho (2013) Kormendy J., Ho L. C., 2013, Annual Review of Astronomy and Astrophysics, 51, 511
- Kormendy & Richstone (1995) Kormendy J., Richstone D., 1995, ARA&A, 33, 581
- Laor (1998) Laor A., 1998, ApJ, 505, L83
- Laor (2001) Laor A., 2001, ApJ, 553, 677
- Läsker et al. (2014) Läsker R., Ferrarese L., van de Ven G., Shankar F., 2014, ApJ, 780, 70
- Lauer et al. (2007) Lauer T. R., et al., 2007, ApJ, 662, 808
- Liller (1966) Liller M. H., 1966, ApJ, 146, 28
- Lower et al. (2020) Lower S., Narayanan D., Leja J., Johnson B. D., Conroy C., Davé R., 2020, ApJ, 904, 33
- Lynden-Bell (1969) Lynden-Bell D., 1969, Nature, 223, 690
- Lynden-Bell & Rees (1971) Lynden-Bell D., Rees M. J., 1971, MNRAS, 152, 461
- Magorrian et al. (1998) Magorrian J., et al., 1998, AJ, 115, 2285
- Makarov et al. (2014) Makarov D., Prugniel P., Terekhova N., Courtois H., Vauglin I., 2014, A&A, 570, A13
- Matković & Guzmán (2005) Matković A., Guzmán R., 2005, MNRAS, 362, 289
- McConnell & Ma (2013) McConnell N. J., Ma C.-P., 2013, ApJ, 764, 184
- McLure & Dunlop (2004) McLure R. J., Dunlop J. S., 2004, MNRAS, 352, 1390
- Meert et al. (2015) Meert A., Vikram V., Bernardi M., 2015, MNRAS, 446, 3943
- Meidt et al. (2014) Meidt S. E., et al., 2014, ApJ, 788, 144
- Mitchell et al. (2013) Mitchell P. D., Lacey C. G., Baugh C. M., Cole S., 2013, MNRAS, 435, 87
- Paturel et al. (2003) Paturel G., Petit C., Prugniel P., Theureau G., Rousseau J., Brouty M., Dubois P., Cambrésy L., 2003, A&A, 412, 45
- Querejeta et al. (2015) Querejeta M., et al., 2015, The Astrophysical Journal Supplement Series, 219, 5
- Saglia et al. (2016) Saglia R. P., et al., 2016, ApJ, 818, 47
- Sahu et al. (2019a) Sahu N., Graham A. W., Davis B. L., 2019a, ApJ, 876, 155
- Sahu et al. (2019b) Sahu N., Graham A. W., Davis B. L., 2019b, ApJ, 887, 10
- Sahu et al. (2022) Sahu N., Graham A. W., Davis B. L., 2022, ApJ, 927, 67
- Salpeter (1964) Salpeter E. E., 1964, ApJ, 140, 796
- Salucci et al. (2000) Salucci P., Ratnam C., Monaco P., Danese L., 2000, MNRAS, 317, 488
- Sandage (1965) Sandage A., 1965, ApJ, 141, 1560
- Sani et al. (2011) Sani E., Marconi A., Hunt L. K., Risaliti G., 2011, MNRAS, 413, 1479
- Savorgnan & Graham (2015) Savorgnan G. A. D., Graham A. W., 2015, MNRAS, 446, 2330
- Savorgnan & Graham (2016) Savorgnan G. A. D., Graham A. W., 2016, ApJS, 222, 10
- Savorgnan et al. (2016) Savorgnan G. A. D., Graham A. W., Marconi A., Sani E., 2016, ApJ, 817, 21
- Schlafly & Finkbeiner (2011) Schlafly E. F., Finkbeiner D. P., 2011, ApJ, 737, 103
- Schmidt (1965) Schmidt M., 1965, in Robinson I., Schild A., Schucking E. L., eds, Quasi-Stellar Sources and Gravitational Collapse. p. 455
- Schombert et al. (2019) Schombert J., McGaugh S., Lelli F., 2019, MNRAS, 483, 1496
- Schombert et al. (2022) Schombert J., McGaugh S., Lelli F., 2022, AJ, 163, 154
- Sérsic (1968) Sérsic J. L., 1968, Technical report, Atlas de Galaxias Australes - English Translation of the chapter “Photometric Analysis”, https://doi.org/10.5281/zenodo.2562394. Cordoba, doi:10.5281/zenodo.2562394, https://doi.org/10.5281/zenodo.2562394
- Sesana et al. (2016) Sesana A., Shankar F., Bernardi M., Sheth R. K., 2016, MNRAS, 463, L6
- Shankar et al. (2016) Shankar F., et al., 2016, MNRAS, 460, 3119
- Shankar et al. (2020a) Shankar F., et al., 2020a, Nature Astronomy, 4, 282
- Shankar et al. (2020b) Shankar F., et al., 2020b, MNRAS, 493, 1500
- Shannon et al. (2015) Shannon R. M., et al., 2015, Science, 349, 1522
- Sheth et al. (2010) Sheth K., et al., 2010, Publications of the Astronomical Society of the Pacific, 122, 1397
- Shields (1999) Shields G. A., 1999, PASP, 111, 661
- Taylor et al. (2011) Taylor E. N., et al., 2011, MNRAS, 418, 1587
- Tremaine et al. (2002) Tremaine S., et al., 2002, ApJ, 574, 740
- Wandel (1999) Wandel A., 1999, ApJ, 519, L39
- Yee (1992) Yee H. K. C., 1992, in Filippenko A. V., ed., Astronomical Society of the Pacific Conference Series Vol. 31, Relationships Between Active Galactic Nuclei and Starburst Galaxies. p. 417
- Yu & Tremaine (2002) Yu Q., Tremaine S., 2002, MNRAS, 335, 965
- Zel’dovich (1964) Zel’dovich Y. B., 1964, Soviet Physics Doklady, 9, 195
- Zhang et al. (2017) Zhang H.-X., Puzia T. H., Weisz D. R., 2017, ApJS, 233, 13
- de Nicola et al. (2019) de Nicola S., Marconi A., Longo G., 2019, MNRAS, 490, 2130
- de Rijcke et al. (2005) de Rijcke S., Michielsen D., Dejonghe H., Zeilinger W. W., Hau G. K. T., 2005, A&A, 438, 491