An extreme blue nugget, UV-bright starburst at with ninety per cent of Lyman continuum photon escape
Abstract
We present the discovery and analysis of J13162614 at , a UV-bright star-forming galaxy () with large escape of Lyman continuum (LyC) radiation. J13162614 is a young ( Myr) star-forming galaxy with yr-1 and a starburst mass of log(. It shows a very steep UV continuum, , consistent with residual dust obscuration, . LyC emission is detected with high significance () down to Å, for which a very high relative (absolute) LyC escape fraction () is inferred. The contribution of a foreground or AGN contamination to the LyC signal is discussed, but is unlikely. J13162614 is the most powerful ionizing source known among the star-forming galaxy population, both in terms of production ( s-1) and escape of ionizing photons (). Nebular emission in Ly, H, and other rest-frame optical lines are detected, but these are weak (Å), with their strengths reduced roughly by . J13162614 is the first case known where the effect of large escape of ionizing photons on the strength of nebular lines and continuum emission is clearly observed. Gas inflows are detected in J13162614 from the blue-dominated peak Ly emission (with a blue-to-red peak line ratio ) and redshifted ISM absorption ( km s-1). Our results suggest that J13162614 is undergoing a gas compaction event, possibly representing a short-lived phase in the evolution of massive and compact galaxies, where strong gas inflows have triggered an extreme star formation episode and nearly 100% LyC photons are escaping.
keywords:
galaxies: formation – galaxies: evolution – galaxies: high-redshift1 Introduction
One of the key questions of modern observational cosmology is to identify the sources responsible for the ionization of the neutral intergalactic medium (IGM) in the first Gyr of cosmic time – the Epoch of Reionization (EoR). It is widely recognized from various observations that the EoR happened at (e.g., Bañados et al., 2018; Mason et al., 2018; Planck Collaboration et al., 2020), yet the sources that were responsible for the majority of ionizing photons (with 13.6 eV; hereafter Lyman continuum, LyC) remain elusive.
Faint star-forming galaxies are thought to be the main drivers for reionization (see: e.g., Robertson et al., 2015; Finkelstein et al., 2019) due to their high number density. Also, these sources may have higher ionizing photon production efficiency (, e.g., Schaerer et al. 2016; Maseda et al. 2020) compared to UV-bright, massive counterparts. However, LyC surveys of faint star-forming galaxies at , where LyC radiation can be directly observed and measured, have revealed relatively low or negligible LyC escape fractions on average (; e.g., Marchi et al. 2017; Rutkowski et al. 2017; Fletcher et al. 2019; Bian & Fan 2020; Flury et al. 2022a). Only for a few individual galaxies LyC is detected with high significance and large LyC escape fractions are inferred (; e.g., Vanzella et al. 2016; de Barros et al. 2016; Izotov et al. 2018a; Izotov et al. 2018b; Steidel et al. 2018; Fletcher et al. 2019; Flury et al. 2022a).
Dedicated surveys have been also carried out to investigate the properties of these sources and understand the main mechanisms for LyC leakage (e.g., Steidel et al., 2018; Fletcher et al., 2019; Flury et al., 2022a). Despite these huge observational efforts, the connection between LyC leakage and different galaxy properties is still not fully understood. Some properties appear to correlate with LyC leakage. UV compact morphologies and large star-formation surface densities (), low dust attenuation, low covering fraction of gas and high ionization parameters among others, appear to be common in strong LyC emitters (e.g., Jaskot & Oey, 2013; Alexandroff et al., 2015; Sharma et al., 2016; Izotov et al., 2018a; Flury et al., 2022b; Saldana-Lopez et al., 2022). On the other hand, other properties appear to not correlate at all or show weak correlation only, including the stellar mass, metallicity or spectral hardness (e.g., Flury et al., 2022b; Marques-Chaves et al., 2022; Saxena et al., 2022). Motivated by these findings and other empirical trends, indirect tracers of LyC leakage have been proposed, tested, and some of them successfully established (e.g., Zackrisson et al. 2013; Nakajima & Ouchi 2014; Verhamme et al. 2015; Sharma et al. 2017; Chisholm et al. 2018; Izotov et al. 2018b; Chisholm et al. 2022; Saldana-Lopez et al. 2022; Schaerer et al. 2022; Xu et al. 2022). These can be used at all redshifts including in the EoR, where the detection of LyC is statistically unlikely due to the opacity of the IGM (Inoue et al., 2014).
On the opposite side of the UV luminosity function are the more rare, UV-bright star-forming galaxies. By definition, these sources probe intense star-formation and, therefore, high production of ionizing photons. Recent works have found remarkably luminous star-forming galaxies at (e.g., Hashimoto et al., 2019; Morishita et al., 2020; Endsley et al., 2021; Bouwens et al., 2022a), including the highest spectroscopically and photometrically redshift sources known, leading to important implications (Oesch et al., 2016; Harikane et al., 2022b). The volume density inferred for these luminous sources is much higher than that predicted by models (e.g., Mason et al., 2018), by factors of . AGN contamination could be a natural explanation for the excess of UV-bright sources in the early Universe, but recent results disfavour such scenario (Finkelstein & Bagley, 2022). Rather than that, higher star-formation efficiency than previously thought at early times and/or lower dust obscuration towards the UV-bright end of luminosity functions are invoked (e.g., Yung et al., 2019; Harikane et al., 2022a). Also, it has been shown that there is little or no evolution in the number density of very bright sources () between and (e.g., Bowler et al., 2020; Harikane et al., 2022a), implying that the relative number of UV-bright to UV-faint sources increases towards higher redshifts. However, the number of UV-bright sources is still scarce and their space density highly uncertain, ranging from Mpc-3 to some Mpc-3 for at (e.g., Calvi et al., 2016; Bowler et al., 2020; Rojas-Ruiz et al., 2020; Leethochawalit et al., 2022), possibly reflecting cosmic variance effects. While a precise determination of the number density of these EoR bright sources can be done with upcoming very wide surveys like Euclid and Nancy Grace Roman Space Telescope, other important questions remain to be answered: what role do these UV-bright sources have to galaxy formation and evolution, and to cosmic reionization?
Recently, we have undertaken a search for very luminous star-forming galaxies at within the deg2-wide extended Baryon Oscillation Spectroscopic Survey (eBOSS Abolfathi et al., 2018) of the Sloan Digital Sky Survey (SDSS: Eisenstein et al., 2011). The first results of this project were presented in Marques-Chaves et al. (2020b), Álvarez-Márquez et al. (2021), and Marques-Chaves et al. (2021), where two UV-bright () star-forming galaxies were analyzed in detail, BOSS-EUVLG1 at and J01210025 at . These sources are very young ( Myr) and compact ( kpc) starbursts with star-formation rates yr-1, but with low dust attenuation (). For example, dust is not detected in BOSS-EVULG1, yielding a dust mass log( and a dust to stellar mass ratio (Marques-Chaves et al., 2020b). While no direct information on the LyC leakage is known for BOSS-EUVLG1, J01210025 shows significant emission below the Lyman edge, compatible with large (Marques-Chaves et al., 2021), implying that that UV-bright galaxies can emit ionizing photons. The spectral energy distribution (SED) of these sources are fully dominated by the young starburst with specific SFR of Gyr-1, and without a relevant old stellar component, possibly indicating that the bulk of their stellar mass () was assembled in a few Myr. All together, these authors speculate that these rare UV-bright starbursts (, Marques-Chaves et al. 2020b) could represent an early and short-lived phase in the evolution of massive galaxies, such as compact ellipticals or dusty star-forming galaxies found at . However, the main mechanism and physical conditions behind the formation of such extreme starbursts are not understood yet.
In this work, we present SDSS J131629.61261407.0 at (, [J2000] = 199.1234∘, 26.2353∘, hereafter J13162614). J13162614 is a very luminous () star-forming galaxy with % LyC leakage and signatures of inflowing gas, shedding further light on the physical mechanism of galaxy formation of these peculiar UV-bright sources. The paper is structured as follows. The discovery and follow-up observations are presented in Section 2. The analysis of the rest-frame UV spectroscopic observations, including the ionizing and non-ionizing spectra of J13162614, is presented in Section 3. In Section 4 we discuss the properties of J13162614 and compare them with those from other sources in the literature. Finally, we present the summary of our main findings in Section 5. Throughout this work, we assume concordance cosmology with , , and km s-1 Mpc-1. Magnitudes are given in the AB system. Absolute magnitudes and luminosities are not corrected by dust.
2 Discovery and Follow-up Observations
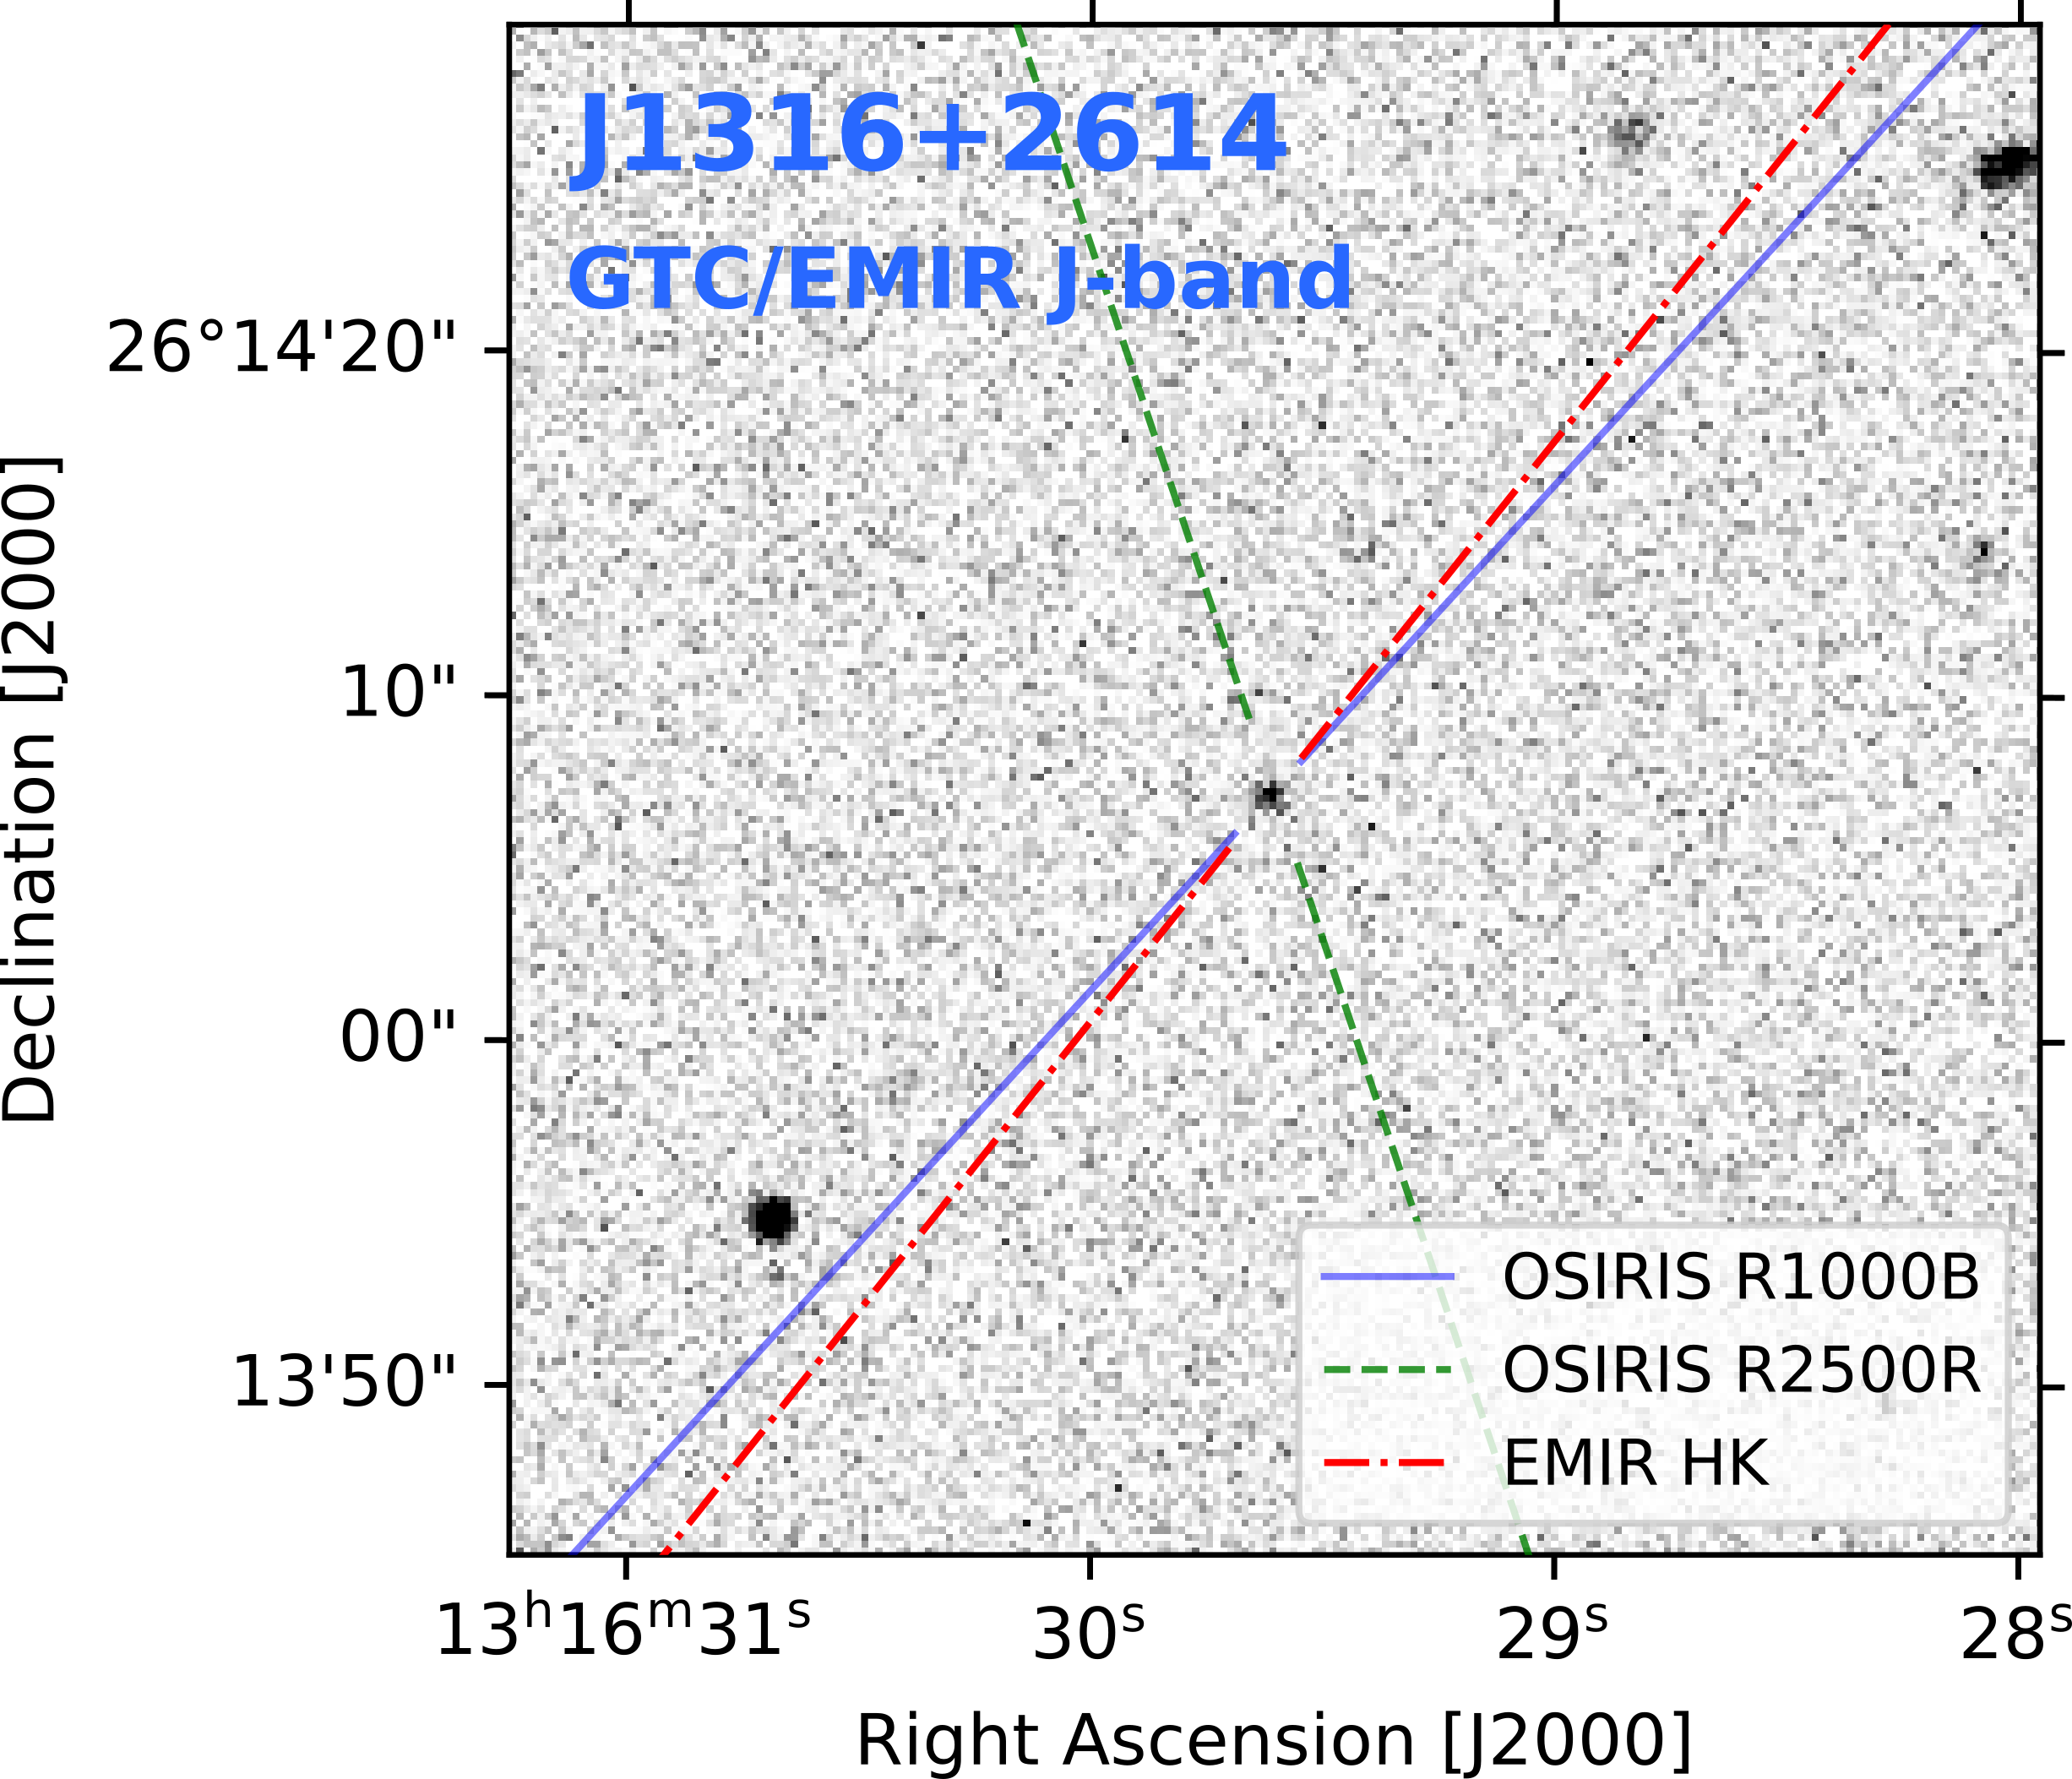
J13162614 at was discovered as part of our search for luminous star-forming galaxies at high redshift () within the deg2-wide eBOSS/SDSS (Eisenstein et al., 2011; Abolfathi et al., 2018). Similar as BOSS-EUVLG1 and J01210025 (Marques-Chaves et al., 2020b, 2021), J13162614 is classified as a QSO in the Data Release 14 Quasar catalog (Pâris et al., 2018), but its BOSS spectrum (plate-mjd-fiberid: 5997-56309-375)111http://skyserver.sdss.org/dr14/en/tools/explore/summary.aspx?id=1237667442439750118 shows features characteristic of a young star-forming galaxy, without any hint of AGN activity. It shows narrow Ly emission (a full width half maximum, FWHM, of km s-1) and P-Cygni features in the wind lines N v 1240Å and C iv 1550Å, that is indicative of a young stellar population. Moreover, J13162614 shows a compact morphology without any evidence of being magnified by gravitational lensing, such as multiple images or arc-like morphologies, or the presence of nearby bright lens (Figure 1).
2.1 Optical observations
We obtained optical spectra of J13162614 with the Optical System for Imaging and low-Intermediate-Resolution Integrated Spectroscopy instrument (OSIRIS)222http://www.gtc.iac.es/instruments/osiris/ on the 10.4m Gran Telescopio Canarias (GTC) telescope as part of the programs GTCMULTIPLE2F-18A and GTC29-21A (PI: R. Marques-Chaves). OSIRIS observations were performed under seeing conditions (FWHM) using the R2500R and R1000B grisms providing spectral resolutions and and coverage of 5580-7700Å and 3600-7600Å, respectively. Long-slits with 1.0′′-width were centered on J13162614 and oriented with the parallactic angle (Figure 1). Total on-source exposure times are 150 min and 60 min for the medium and low-resolution observations, respectively. Table 1 summarizes the GTC spectroscopic observations.
| Instrument | Grism () | Spec. range | Exp. time | Date |
|---|---|---|---|---|
| (m) | (sec) | |||
| OSIRIS | R1000B (700) | 10 April 2018 | ||
| OSIRIS | R2500R (1800) | 20 April 2021 | ||
| EMIR | HK (700) | 8 May 2018 |
Data were reduced following standard reduction procedures using Iraf. These include subtraction of the bias and further correction of the flat-field. The wavelength calibration is done using HgAr+Ne+Xe arc lamps data. 2D spectra are background subtracted using sky regions around J13162614. Individual 1D spectra are extracted, stacked and corrected for the instrumental response using observations of the standard star Ross 640. We use the extinction curve of Cardelli et al. (1989) and the extinction map of Schlafly & Finkbeiner (2011) to correct for the reddening effect in the Galaxy. Finally, the flux of the spectrum is matched to that obtained from photometry in the -band to account for slit-losses, and corrected for telluric absorption using the Iraf telluric routine.
2.2 Near-IR observations
Near-IR spectra were obtained with the Espectrógrafo Multiobjeto Infra-Rojo (EMIR)333http://www.gtc.iac.es/instruments/emir/ on the GTC under good seeing conditions ( FWHM). The grism with a -width was used with a total observing time of 43 min with a standard 10′′ ABBA dither, providing a spectral resolution and coverage of 1.45-2.41m. Reduction of the near-IR spectrum was performed using the official EMIR pipeline444https://pyemir.readthedocs.io/en/latest/index.html. Spectra were flux calibrated using a standard star observed in that night, and fluxes matched to those obtained from photometry. We also obtained near-IR imaging with EMIR using the , , , and filters (Figure 1). Total exposure times range from min to min. Images were also reduced using the EMIR pipeline and were flux calibrated against 2MASS stars in the field. J13162614 is detected with high significance in all near-IR bands and appears unresolved in these images with seeing conditions FWHM.
3 Results
3.1 Rest-frame UV spectrum and young stellar population
The OSIRIS/GTC medium-resolution spectrum of J13162614 is shown in Figure 2. It shows a blue UV continuum with a slope, , measured using two spectral windows of 30Å-width at 1300Å and 1600Å rest-frame and assuming that . This is steeper, but consistent within the uncertainties, than the slope derived from the photometry using - and -bands, , that probes slightly longer wavelengths of Å to Å (rest-frame), respectively.
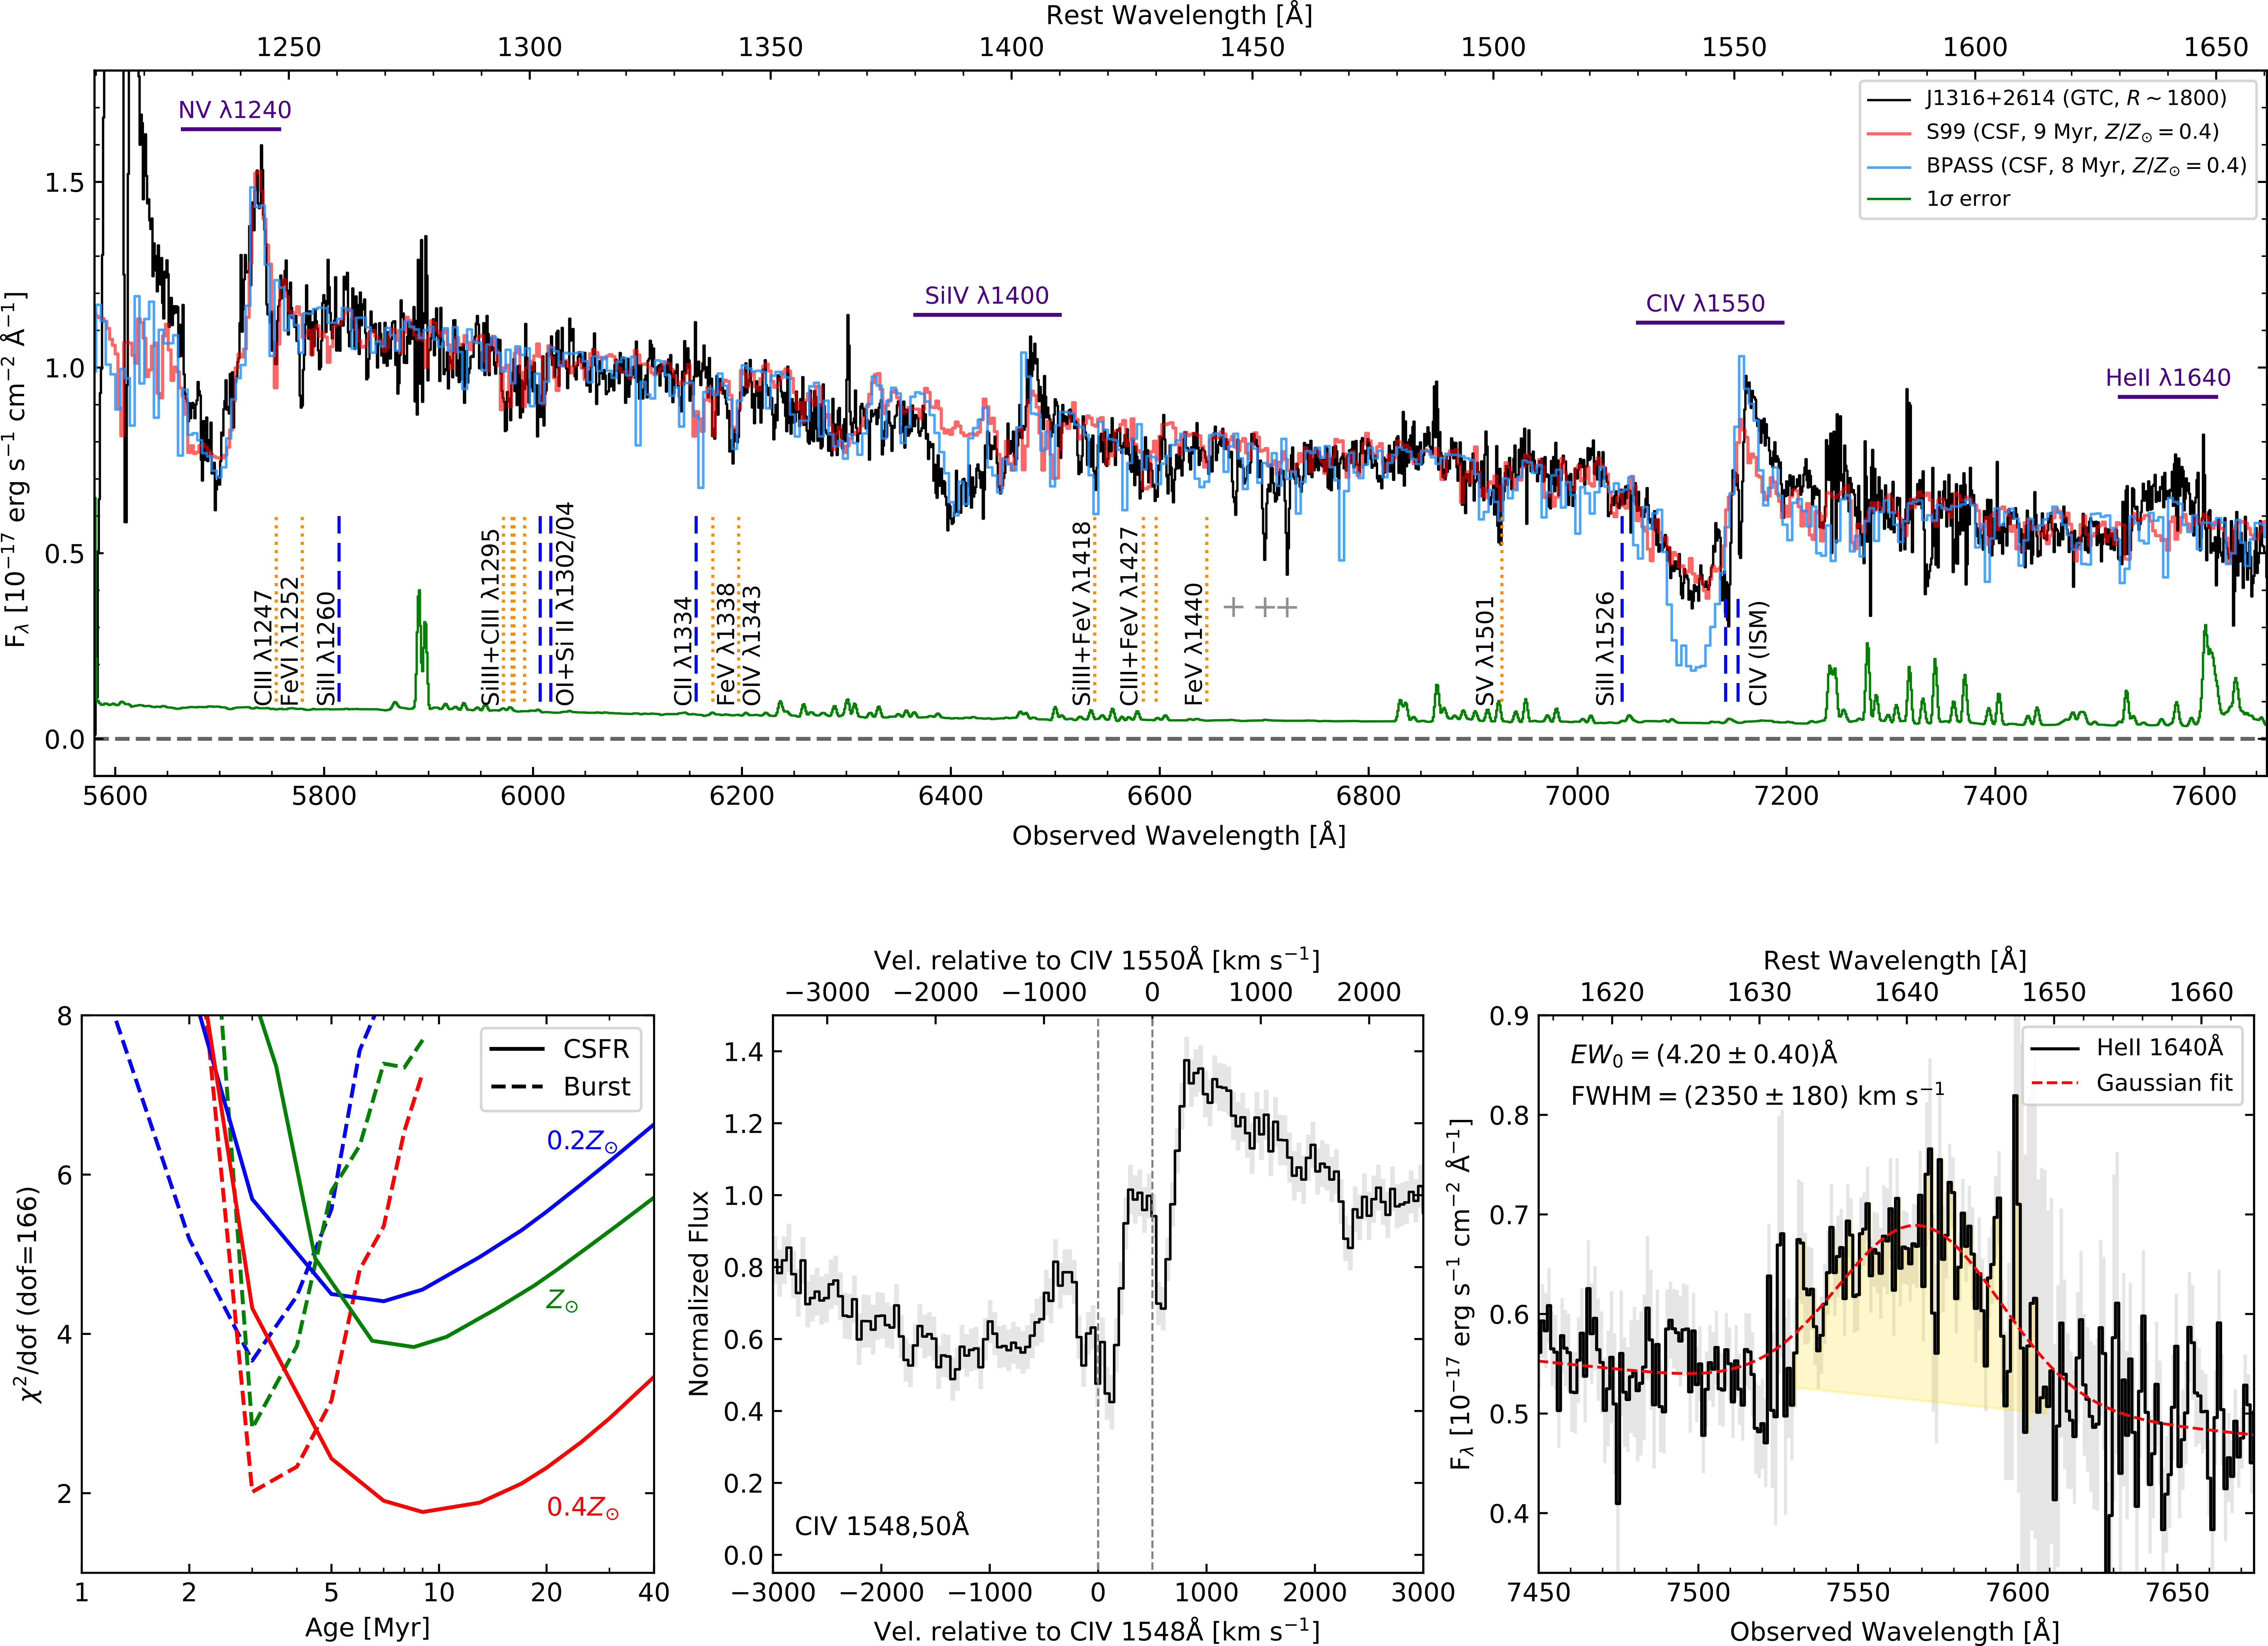
The most prominent features in the UV spectrum of J13162614 are the strong P-Cygni profiles seen in stellar wind lines. In particular, the profiles of N v 1240Å and C iv 1550Å are known to be strongly dependent on the age and metallicity of the stellar population (e.g., Chisholm et al., 2019). To investigate these properties, we compare the observed N v and C iv profiles to those obtained with the spectral synthesis code Starburst99 (S99: Leitherer et al., 1999), following the same methodology described in Marques-Chaves et al. (2018) and Marques-Chaves et al. (2020a). S99 models are preferred in this fit instead of BPASS ones (Stanway et al., 2016), because the shape of the P-Cygni absorption of C iv in the later is difficult to match with observations (see discussion in Steidel et al. 2016). The effect of binary stars contributing to the spectrum of J1316+2614 will be discussed in Section 4.3.
We generate UV spectra using standard Geneva tracks with a grid of metallicities (, where we assume ) of 0.05, 0.2, 0.4 and 1. We assume both continuous and burst star-formation histories and a initial mass function with a power slope index over the mass range . A minimization is performed in the continuum normalized profiles of N v and C iv over the spectral ranges Å and Å, respectively. For C iv, we avoid fitting regions Å as they include the interstellar component of C iv that is redshifted by km s-1 (see Figure 2 and Section 3.2) and possibly nebular emission.
P-Cygni profiles of N v and C iv are best reproduced by a S99 model with a continuous star-formation history with an age of Myr and with a (red in the left bottom panel of Figure 2), where the number of degree of freedom is . S99 models with (and ) over-predict (under-predict) the strength of C iv profile, increasing the by a factor . Similarly, S99 models with ages Myr (and Myr) will over-predicted (under-predicted) the strength of N v profile. On the other hand, if a burst star-formation history is assumed, a fairly good fit is found for a burst age of Myr, but the fit is still worse () than the one assuming a continuous star-formation history. Therefore, we consider from now on a continuous star-formation history with an age of Myr and as the best fit of J13162614. The ionizing production efficiency of this model, defined as the number of ionizing photons produced per unit UV luminosity (), is log(. This is higher than the inferred for typical high- LBGs (log(, e.g., Bouwens et al. 2016), but comparable with that inferred for LAEs (e.g., Matthee et al. 2017).
We also take in consideration the dust attenuation. The observed in J13162614 is similar than the intrinsic UV slope inferred for the best-fit S99 model, , i.e., without considering the effect of dust or the inclusion of nebular continuum. Therefore, the observed slope is consistent with almost zero attenuation, , assuming the Calzetti et al. 2000 extinction curve.
In addition to the N v and C iv P-Cygni profiles, other stellar features are detected and their strengths are relatively well reproduced by the best-fit S99 model. The photospheric absorption in C iii 1247Å, S v 1501Å, and some blends from multiple transitions such as S iii and C iii around 1295Å and by Fe v and O iv around 1340Å are well detected (see Figure 2) and their strengths are consistent with the best-fit S99 model. As these lines arise from stellar atmospheres, we use them to determine the systemic redshift of J13162614 as .
Lastly, we note the poor agreement of the best fit S99 model in two important features, Si iv 1393,1402Å and He ii 1640Å. A strong P-Cygni contribution is detected in Si iv 1393,1402Å, but the best-fit S99 model does not reproduce its strength. Such profiles are usually seen in some early-O type supergiants, Wolf-Rayet (W-R) stars (e.g., Garcia & Bianchi 2004; Crowther et al. 2016) or in metal-rich stars, and might indicate different (lower) effective temperatures. Only S99 models with can show Si iv profiles with similar strength as the one observed in J13162614. However, these high metallicity models are disfavored as they predict much stronger absorption in photospheric lines than the observed ones. It is worth to note that BPASS models with similar metallicity as our best-fit S99 model (i.e., ) can predict relatively well the observed P-Cygni profile in Si iv (shown in blue in Figure 2 for comparison). The best-fit S99 model also fails to reproduce the strength of He ii 1640Å emission in J13162614 (Figure 2). Fitting a Gaussian profile to the He ii line, we measure a line width km s-1 and a rest-frame equivalent width Å. This is much stronger than that found in typical star-forming galaxies (Å, e.g., Shapley et al. 2003), and may indicate a significant contribution of stars with mass (Senchyna et al. 2021; Martins & Palacios 2022) that show very strong and broad He ii emission (e.g., Crowther et al., 2016). A more detailed investigation on the origin of the strong He ii in J13162614 and in other luminous star-forming galaxies will be presented in a forthcoming work (Upadhyaya et al. in prep.).
3.2 ISM absorption lines
Interstellar medium (ISM) absorption lines appear very weak in the spectrum of J13162614. We checked the presence of the main low-ionization ISM (LIS) lines that are typically observed in many other star-forming galaxies (e.g., Shapley et al. 2003). These include Si ii 1260Å, O i+Siii 1302Å, C ii 1334Å, or Si ii 1526Å (blue dashed lines in Figure 2). However, these lines are not detected in the spectrum of J13162614 despite the high SNR of the continuum ( pix-1). We only detect a faint absorption in O i+Si ii at the systemic velocity with Å, but stellar models can explain its strength (Figure 2).
On the other hand, two narrow absorption lines are detected at Å and Å and are consistent to be the ISM components of the C iv doublet (1548Å and 1550Å, see bottom panel of Figure 2). The lines present narrow profiles being almost unresolved (FWHM km s-1). They show Å, although the uncertainties are large given the difficulty to estimate the continuum level within the P-Cygni profile. Interestingly, the C iv ISM absorption lines are redshifted by km s-1 relative to the systemic velocity derived using stellar absorption lines, indicating that the high-ionized ISM is apparently moving towards the young stars.
3.3 Nebular emission
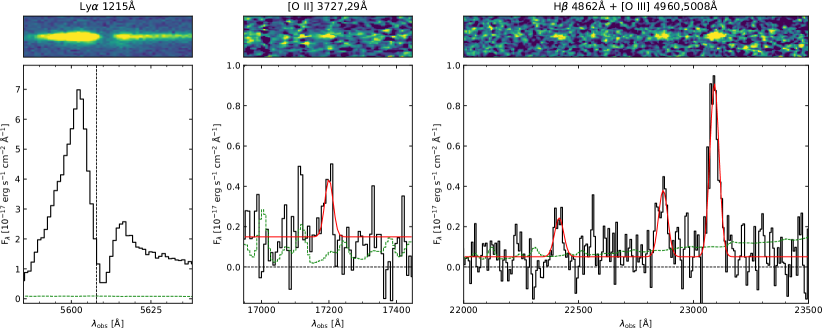
J13162614 shows significant () emission in several nebular lines, such as Ly 1215Å, H 4862Å, and in the [O iii] doublet at 4960Å and 5008Å. These are shown in Figure 3.
The Ly line shows two peaks around the systemic velocity, with the blue peak more intense than the red one. We measure a ratio between the blue and red emission and a velocity peak separation km s-1. Fitting a Gaussian profile to the blue and red emission, we find line widths of km s-1 and km s-1 (FWHM, and corrected for instrumental broadening), respectively. We note, however, that these lines do not show a symmetric profile and, therefore, are not well reproduced by Gaussian profiles. Because the continuum level around Ly is not easy to constrain (due to the IGM absorption and the N v 1240Å P-Cygni profile at shorter and longer wavelengths, respectively), we subtract and divide our spectrum by the best fit S99 model. We then measure respectively the flux and equivalent width of the nebular component of Ly by integrating its flux within the spectral region km s-1 around the systemic velocity. Ly has a total flux of erg s-1 cm-2, and Å, corresponding to a luminosity log10(. These values are consistent with those measured using the BOSS spectrum, which uses a larger aperture (-diameter fiber) than OSIRIS (-width), suggesting that there is little scatter at larger radii.
It is worth to note that Ly profiles like this, i.e., showing the blue peak more intense than the red one, are extremely rare. It has been observed only in a few star-forming galaxies (Wofford et al., 2013; Erb et al., 2014; Trainor et al., 2015; Izotov et al., 2020; Furtak et al., 2022) and in other type of sources, such as AGNs or extended Ly nebulae (Martin et al., 2015; Vanzella et al., 2017; Ao et al., 2020; Daddi et al., 2021; Li et al., 2022). This profile is usually linked to radial infall of gas (Dijkstra et al., 2006). Other scenarios, such as emission from two kinetically different sources (e.g., merger) or disc rotation, are unlikely. In such cases, similar doubled peaked profiles should be present in other nebular lines, which is not the case. As described next, rest-frame optical lines in J13162614 do not show this complex profile and can be well modelled with single Gaussian profiles. We note however that rest-frame optical lines are observed with much lower spectral resolution and SNR than Ly, which makes it difficult a direct comparison of their profiles.
Turning to the rest-frame optical lines, three Gaussian profiles are used to fit simultaneously H and [O iii] 4960,5008Å, and a constant (in ) for the continuum. We measure erg s-1 cm-2, erg s-1 cm-2 and erg s-1 cm-2. The lines appear barely resolved only, with km s-1 after correcting for the EMIR instrumental broadening ( km s-1). The continuum in the -band is detected with a flux density corresponding to mag. We find rest-frame equivalent widths for H and [O iii] 4960Å and [O iii] 5008Å of Å, Å, and Å, respectively. Emission in nebular [O ii] 3727,3729Å is also detected around m, but with low significance () with a flux of erg s-1 cm-2. Table 2 summarizes our measurements.
Assuming case B recombination and , the intrinsic ratio between Ly and H is 24.8. Using the observed fluxes of Ly and H and considering , we infer a Ly escape fraction . We measure the line ratio , for which we measure a nebular abundance 12+log(O/H)= () following Pilyugin & Thuan (2005). This is compatible with the stellar metallicity inferred for the young stellar population. A line ratio [O iii]/[O ii] of is also inferred and will be discussed in more detail in Section 4.2.5. Note that, as discussed in Section 4.2, the high LyC escape fraction in J13162614 (Section 3.5) is reducing the observed intensity of the nebular emission, and the suppression factor might be different for recombination (Ly, H) and forbidden metal lines ([O ii], [O iii]). This means that the nebular abundance inferred using might not be valid and should be treated with caution.
| Line | Flux | |
|---|---|---|
| [Å] | [ erg s-1 cm-2] | |
| Ly 1215Å | ||
| [O II] 3727,3729Å | ||
| H 4862Å | ||
| [O III] 4960Å | ||
| [O III] 5008Å |
3.4 Lyman Continuum emission
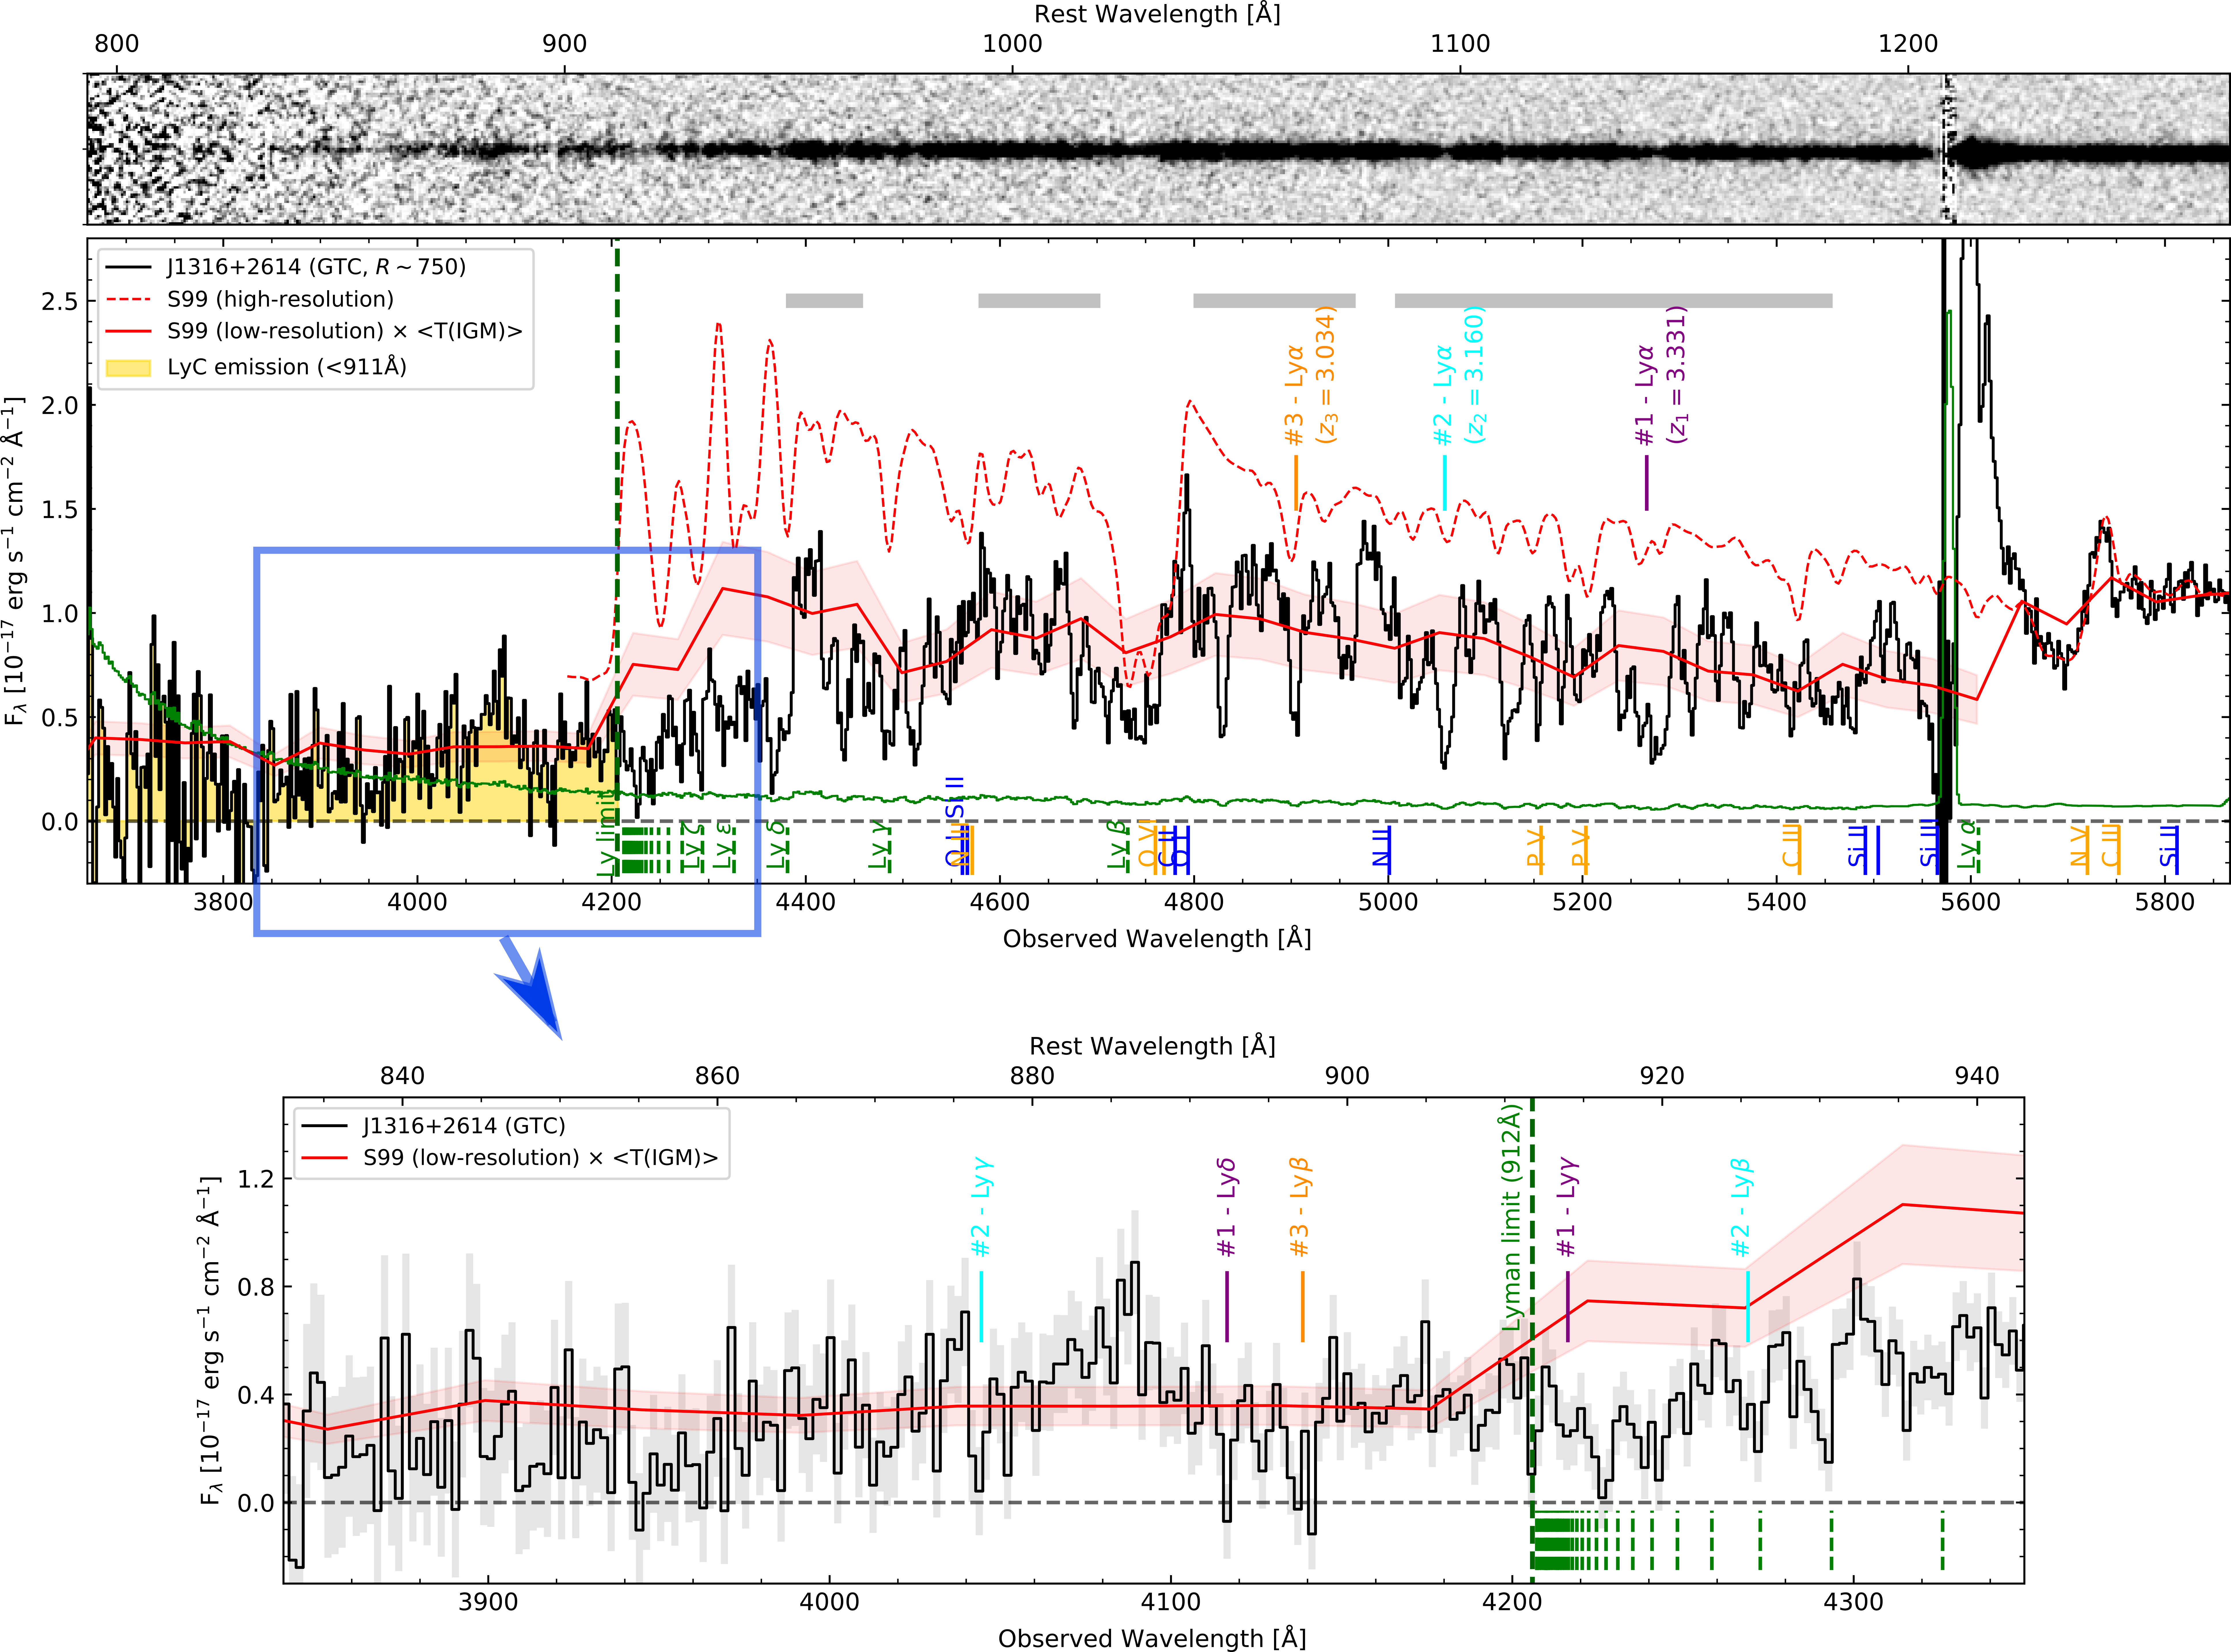
The 40min low-resolution spectrum of J13162614 is shown in Figure 4 and presents significant emission below Å, i.e. Å, that can be associated with LyC leakage. The emission is clearly detected down to rest-frame wavelengths Å (rest) with a total SNR from Å and an average SNR per spectral bin of pix-1. We measure a flux density in the spectral region between 830Å and 910Å (rest) of Jy, corresponding to a magnitude of (AB). This yields a ratio of the ionizing to non-ionizing flux density or (AB).
The relative LyC photon escape fraction along the line of sight, (LyC), is inferred by comparing the observed ratio of the ionizing to non-ionizing flux density of J13162614, ()obs, to that from the best-fit S99 model derived in Section 3.1, ()S99, using the following formulation:
| (1) |
where is the IGM transmission, and flux ratios refer to . Using the same rest-frame spectral windows of Å and Å , we infer . This means that , which implies that should be at least larger than to keep a physical (e.g., Vanzella et al., 2012). This also implies that (LyC) must be , where the most extreme value () stands for a completely transparent IGM ().
A precise estimate of below Å (thus ) is not possible due to the stochastic nature and large fluctuation of the attenuation in one single line-of-sight (e.g., Inoue & Iwata, 2008; Inoue et al., 2014). To overcome this, we infer in the non-ionizing part of the spectrum of J13162614, from Å to Å, and assume that is similar at Å. Following Marques-Chaves et al. (2021), we compare the flux of J13162614 to that of the best-fit S99 model in several spectral regions from Å (marked in Figure 4 as grey horizontal bars), probing only H i absorbers from the Lyman forest. By doing this, we are excluding spectral regions associated with the Lyman series, ISM and CGM from J13162614, which are not included in S99 models. We derive a mean value and standard deviation , and assume this values for Å. The inferred in J13162614 is significantly larger than those obtained by other works using Monte Carlo simulations of the IGM transmission ( at , e.g., Steidel et al. 2018). This suggests that the large flux density observed in J13162614, , is due to the combination of a large (LyC) and a favourable IGM transmission. In Section 4.3 we discuss the implications of a favorable IGM transmission and other uncertainties regarding the adopted stellar model.
Using Equation 1 we infer . We note that this value refers to the LyC escape fraction measured between Å and along the line of sight. The uncertainties on refer to those arising from . Other sources of uncertainty should be less relevant or they are difficult to quantify. For example, the properties of the young stellar population, namely the age and metallicity, are relatively well constrained from the modeling of the stellar wind profiles (see Section 3.1). Their uncertainties should not impact significantly on the inferred (see more discussion in Section 4.3), but we also note they are model dependent. On the observational side, uncertainties due to the flux calibration or differential slit-losses between Å and Å are difficult to constrain. Nevertheless, the low-resolution GTC spectrum matches very well to that of BOSS spectrum, where LyC is also detected.
Assuming , the absolute LyC escape fraction is . Given this, we estimate the number of ionizing photons escaping from J13162614, , by:
| (2) |
where s-1 is the intrinsic ionizing photon production rate from the best-fit S99 model scaled to the absolute magnitude of J13162614. We infer s-1.
3.5 Multi-wavelength Spectral Energy Distribution
In this Section we perform analysis to the multi-wavelength photometry and Spectral Energy Distribution (SED) of J13162614. Optical photometry in , , , and bands are retrieved from SDSS using the model photometry. For the near-IR images (, , , and ) we use aperture photometry with a diameter of 2.5FWHM. J13162614 is not resolved in the optical (SDSS) nor near-IR (EMIR/GTC) with seeing conditions FWHM. J13162614 is not detected in the mid-IR in the WISE2020 Catalog (Marocco et al., 2021) at 3.4m () and 4.6m (), with and at . Table 3 summarizes the optical to mid-IR photometry of J13162614.
| Band | Magnitude | Telescope | |
|---|---|---|---|
| (m) | (AB) | ||
| 0.47 | SDSS | ||
| 0.61 | SDSS | ||
| 0.77 | SDSS | ||
| 0.89 | SDSS | ||
| 1.01 | EMIR/GTC | ||
| 1.25 | EMIR/GTC | ||
| 1.61 | EMIR/GTC | ||
| 2.14 | EMIR/GTC | ||
| 3.35 | (5) | WISE | |
| 4.60 | (5) | WISE |
Figure 5 (left) shows the inferred photometry of J13162614. It shows a blue SED with optical to mid-IR color . This is much bluer than the typical colors measured in type-I/II AGNs at similar redshift, (Selsing et al., 2016; Pâris et al., 2018). This is another evidence of the lack of a strong/dominant AGN component in J13162614.
To investigate the SED properties of J13162614, we perform SED-fitting with CIGALE code (Burgarella et al., 2005; Boquien et al., 2019) using the available photometry covering a rest-frame wavelength m. The fit also includes flux measurements of the H+[O iii] emission lines (Table 3). We assume a star-formation history (SFH) with two components, a young stellar component with a continuous SFR with age Myr (see Section 3.1), and an exponentially declining SFH with age of Myr to probe the old stellar population. Stellar population models from Bruzual & Charlot (2003), Chabrier (2003) IMF, and the Calzetti et al. (2000) dust attenuation law are considered. We fix the metallicity based on our analysis in Section 3.1, and the escape of ionizing photons is set as a free parameter (i.e., ).
The best-fit model obtained for J13162614 is shown in the left panel of Figure 5 (black). The young stellar population is characterized by an age of Myr and yr-1, consistent with the far-UV analysis in Section 3.1. We infer a burst mass and dust attenuation . The LyC escape fraction is . On the other hand, the mass of the old stellar population (age Myr) is not well constrained and we provide a limit of (in red in Figure 5, left). The SED properties derived from the multi-wavelength photometry agree well with those inferred from the UV fitting.
Our results indicate that the rest-frame UV to near-IR SED of J13162614 is dominated by the young stellar population, and if an old stellar population is present it should be less massive than (5). Considering the stellar mass of the young stellar population, we infer a high specific SFR (sSFR=SFR/) of Gyr-1. The right panel of Figure 5 shows the position of J13162614 in the SFR vs. diagram and a comparison with main-sequence (MS) star-forming galaxies at similar redshifts (Santini et al., 2017). J13162614 is offset of the MS by 1.5 dex. The other few star-forming galaxies known brighter than at also show similar Gyr-1 (green in Figure 5, Marques-Chaves et al. 2020b, 2021). Even considering the mass of the old stellar population, J13162614 () will be still located above the MS by dex.
4 Discussion
J13162614 is one of the most luminous star-forming galaxies in the UV and Ly discovered so far, with and log10(Ly / erg s-1) = , and in addition, one of the strongest LyC emitters known. In this section, we discuss its properties, compare with those of other strong LyC emitters, and discuss the implications of such discovery. Table 4 summarizes the main properties of J13162614.
| Value | Uncertainty | |
| R.A. (J2000) | 13:16:29.61 | |
| Dec. (J2000) | 26:14:07.05 | |
| 3.6130 | ||
| (AB) | ||
| log(L[Ly / erg s-1]) | 44.09 | |
| log(L[H / erg s-1]) | 43.18 | |
| (Å) | 20.5 | 1.9 |
| (Å) | 34.7 | 6.8 |
| 0.4 | [0.2 - 1.0] | |
| (O/H) | 8.45 | 0.12 |
| Age (Myr) [young] | ||
| log() [young] | 9.67 | |
| log() [old] | — | |
| E(B-V) | ||
| SFR ( yr-1) | 497 | 92 |
| sSFR (Gyr-1) | 105 | 49 |
| SFR ( yr-1 kpc-2) | — | |
| log() | ||
| (Ly) | 0.43 | 0.12 |
| (LyC) | 0.92 | [, ] |
| (LyC) | 0.87 | [, ] |
| log( / s-1) | 55.86 | 0.11 |
Notes. — (a) Age of the young stellar population and dust attenuation obtained with different methods: using UV spectral features and from the best-fit model of the SED using CIGALE, respectively.
4.1 AGN contamination or low-z interloper?
We start investigating the possible contribution of an AGN or a low redshift contaminant to the flux detected below Å.
The rest-frame UV spectrum of J13162614 shows a wealth of absorption lines that are originated in the photospheres of hot stars. Figure 6 shows a zoom-in of the GTC spectrum around Å and Å, where some of these lines are clearly detected. The detection of these intrinsically weak photospheric lines indicates that the UV continuum of J13162614 is dominated by stellar emission, rather than an AGN, otherwise these absorption lines would be washed-out. For illustration, Figure 6 also shows the spectrum of a O8.5 Iaf type star from the Large Magellanic Cloud observed with HST/STIS (LH 9-34, obtained as part of the ULLYSES program Roman-Duval et al. 2020). In addition we also show the composite spectrum of bright QSOs of Selsing et al. (2016) obtained with X-Shooter. As clearly seen in the figure, photospheric lines (highlighted in yellow) are detected both in the spectra of J13162614 and the LH 9-34 star, but are not present in the spectra of QSOs.
Other spectral features, such as the P-Cygni profiles in wind lines of N v 1240Å and C iv 1550Å, can be well explained by a young stellar population (Section 3.1), that is consistent with the multi-wavelength SED (Section 3.5). J13162614 shows a blue color between UV and near-IR (rest-frame) of , that is difficult to explain by a type-I/II AGN component. AGNs show typically much redder colors ( Pâris et al. 2018) than the observed ones. J13162614 also shows a very blue UV slope , much steeper than those commonly observed in QSOs ( to , Lusso et al. 2015; Selsing et al. 2016; Liu et al. 2022, but see Lin et al. 2022). Lastly, the nebular emission in J13162614 presents narrow profiles without any hint for a broad component (FWHM > 1000 km s-1).
Our results clearly indicate that the large luminosity of J13162614 is being powered by massive star-formation. These do not discard the presence of a low luminosity AGN (e.g., Seyfert 2 or LINER), but rather indicate that a possible contribution of an AGN to the UV emission should be minimal. The same should be applied to the LyC emission. To quantify this, we consider conservatively a significant contribution of an AGN to the UV continuum of J13162614 of , which is compatible with an AGN with an absolute magnitude . Assuming that the observed LyC flux arises from the AGN, this yields . AGNs with LyC detection at similar redshift and luminosities show much lower values (; Lusso et al. 2015; Cristiani et al. 2016; Micheva et al. 2017), even noting that the in these AGNs can be as high as 100%. Therefore, a large contribution of an AGN to the LyC emission of J13162614 is highly unlikely.
Another source of contamination to the observed LyC emission could arise from a low- interloper. J13162614 appears unresolved in optical and near-IR images, but the poor spatial resolution from these observations ( FWHM) prevents us to rule out the presence of a low- interloper close to J13162614. From the low-resolution 2D spectrum, the spatial profiles of the emission observed below and above the Lyman edge at Å (i.e., Å) are similar, both unresolved and co-spatial. This means that, if a low- interloper is present, it should be co-spatial with J13162614.
Considering the presence of a contaminant source at , the emission seen Å would correspond to rest-frame UV radiation and, therefore, strong emission would be expected from the main rest-frame optical lines (e.g., [O ii], [O iii], H or H). However, we do not detect any other emission line within the spectral range covered by our optical and near-IR spectra (0.36m to 1.00m with GTC/OSIRIS and SDSS, and 1.45m to 2.41m with GTC/EMIR), rather than those originated from J13162614 at . A high redshift contaminant () is also unlikely, because the flux density measured below Å is already very large (Jy or AB). Lyman break galaxies or Ly emitters at are much fainter in the UV with typical aparent magnitudes at of (, e.g., Reddy & Steidel 2009). Finally, the GTC spectrum of J13162614 shows absorption features in the LyC spectral range, that are consistent with Lyman series at redshifts between and (systems #1, #2, and #3 in Figure 4). This suggests that the emission observed at Å arises from the LyC emission of J13162614.
4.2 Intrinsically high LyC leakage from indirect tracers
In the previous section we shown that an AGN or a lower- interloper should not contribute significantly to the flux observed below Å (i.e., the Lyman limit at ). Here we discuss the evidence towards a high LyC leakage in J13162614 using indirect methods (summarized in Table 5).
| Method | (LyC) | Section | |
|---|---|---|---|
| Direct LyC obs. | 0.87 | 3.4 | |
| Multi-wav. SED | 0.65 | 3.5 | |
| vs. | 4.2.1 | ||
| 0.82 | 4.2.2 | ||
| ISM abs. lines | > | 4.2.3 | |
| ) | 0 | — | 4.2.4 |
4.2.1 Weak nebular lines and continuum emission: and plane
One evidence for high leakage is the weak nebular lines and continuum emission in J13162614. For a young stellar population of Myr old, strong nebular emission would be expected. Assuming a 9 Myr stellar population with a continuous star-formation history, an IMF with an upper mass limit of , and , models predict equivalent widths in the Ly and H recombination lines of Å and Å, respectively (Schaerer & de Barros, 2009). The predicted s are a factor of larger than the ones observed in J13162614 (Table 2). The weak nebular emission also affects the SED of J13162614 (Figure 5), making the observed fluxes in the and WISE 3.6m bands much weaker than expected if , due to the contribution of H[O iii] and H, respectively. In addition, the measured in spectrum of J13162614 is similar to the intrinsic (best-fit) S99 stellar model, , i.e., without considering the inclusion of nebular continuum or dust attenuation. This clearly suggests that the contribution of the nebular continuum and dust attenuation should be residual in J13162614.
Since the escape of ionizing photons into the IGM/CGM should not contribute to photoionization in the ISM, a large LyC leakage would explain the weak nebular contributions in J13162614. To demonstrate this, Figure 7 shows the relation between and as a function of (LyC) following the predictions of Zackrisson et al. (2013) and Zackrisson et al. (2017). For this, we assume S99 models with a continuous star-formation history with ages between 1-50 Myr, and a metallicity . For H, we use the models of Schaerer & de Barros (2009) matched to the same stellar properties. Nebular continuum and emission are reduced by a factor of ((LyC)). No dust attenuation is considered, since this effect is expected to be residual in J13162614. As seen in this figure, the observed and in J13162614 (red square) is well explained by an at the age of 9 Myr. The figure also shows that can be ruled out. This is compatible with the inferred in Section 3.4 using direct observations of the LyC emission.
To our knowledge, this is the first observational confirmation that large escape of ionizing photons strongly affects the strength of nebular lines and continuum emission in a star-forming galaxy, thereby its global SED, as predicted by Zackrisson et al. (2013). For the few LyC emitters known with (de Barros et al., 2016; Izotov et al., 2018b; Flury et al., 2022b), all of them show a combination of (Å) and that, according to the and plane, are incompatible with the inferred (e.g., see Figure 21 in Flury et al. 2022b). An exception could be Ion2 (Vanzella et al., 2016) that shows a very steep UV slope (de Barros et al., 2016) and Å (Vanzella et al., 2020), that according to Figure 9 is compatible with very high , although with large uncertainties. It is known that the predicted tracks of in the and plane can be affected by different sources of uncertainty, such as the effect of dust, stellar properties, star-formation histories (Zackrisson et al., 2017), and ultimately by an inhomogeneous LyC leakage. For J13162614, these appear well constrained.
Finally, noting that J13162614 remains the only source known showing this behaviour (but see also J0121+0025 with and Å; Marques-Chaves et al. 2021, or Ion1 with no Ly emission at all; Ji et al. 2020), our results highlight that at least some weak emission line galaxies with steep UV slopes could be potentially very strong LyC leakers. Our results do not contradict previous findings where is found to correlate with the strength of nebular emission lines (e.g., , , e.g., Izotov et al. 2016a; Flury et al. 2022b), at least up to moderately high . It rather indicates that the number of ionizing photos produced by the stellar population should be balanced with those contributing to the photoionization of H ii regions and those escaping the galaxy, which can be critical at very high ().
4.2.2 Luminosity
Another straightforward way to test is to use the H luminosity. Since H is a recombination line and has little dependence on the metallicity and electron temperature () (e.g., Charlot & Longhetti, 2001), it is basically a direct photons counter. Assuming , the H luminosity () can expressed in terms of the production rate of ionizing photons, , and by:
| (3) | ||||
4.2.3 Null covering fraction of neutral gas
Another piece of evidence for the high is the absence of ISM low-ionization absorption lines (LIS) in the spectrum of J13162614, that probe neutral gas in the line of sight (Gazagnes et al., 2018).
The spectra of typical LBGs or LAEs present typically relatively strong LIS lines, with Å (e.g., Shapley et al., 2003; Shibuya et al., 2014; Marques-Chaves et al., 2020a), but these are very weak or not detected in J13162614, as well as in other strong LyC leakers (Rivera-Thorsen et al., 2017; Chisholm et al., 2017, 2018; Izotov et al., 2018b; Marques-Chaves et al., 2021; Saldana-Lopez et al., 2022). The weakness of LIS lines in J13162614 could arise by a low geometric covering fraction of the gas, , which would indicate a large , as (e.g., Steidel et al., 2018). can be inferred using the residual intensity of the absorption line, , so that , where is the continuum level.555This assumes the optically thick regime and an ionization-bounded ISM with a uniform dust-screen geometry. Assuming a line width of km s-1, we infer and Å at confidence level for Si ii 1260Å and C ii 1334Å. A low geometric covering fraction of the gas is inferred for J13162614, (), that would be consistent with a high . Following the empirical correlation between the residual intensity of ISM LIS lines and of Saldana-Lopez et al. (2022), we infer (). A low ion column density could also explain the weakness of LIS lines, but such scenario is unlikely, because these lines are almost always saturated in the spectra of star-forming galaxies, even in damped-Ly systems with very low metallicities (e.g., Dessauges-Zavadsky et al., 2006).
4.2.4 Ly spectral profile
Another common and well-studied tracer of is the spectral shape and peak separation ()) of the Ly profile (e.g., Verhamme et al., 2015; Verhamme et al., 2017; Izotov et al., 2018b), that depends on the amount and geometry of the neutral gas and dust. Following Verhamme et al. (2015) and assuming a spherical homogeneous shell, the observed km s-1 in J13162614 suggests a large H i column density cm-2, implying (Verhamme et al., 2017; Izotov et al., 2018b). A priori, this is incompatible with the directly measured from the LyC emission itself (Section 3.5). This suggests that J13162614 may have an inhomogeneous ISM geometry (e.g., clumpy) and/or complex gas dynamics.
With the available data it is not possible to draw any definitive conclusion on the connection between the Ly profile and LyC leakage. The lack of low-ionization ISM absorption lines in the spectrum of J13162614 (Section 4.2.3) indicates a low covering fraction of neutral gas in the line-of-sight. This is compatible with large observed in the spectrum of J13162614, and suggests a very low along the LyC source, cm-2 (Verhamme et al., 2017). In such a case, Ly would be preferentially seen at the systemic velocity (e.g., Naidu et al. 2022), but it should be highly suppressed too given the large escape of ionizing photons (similarly as H, see Section 4.2.1). The Ly profile seen in the OSIRIS spectrum (Figure 3) shows already at the systemic redshift, but the emission is faint and the limited resolution prevents us to properly resolve the line. It is thus possible that Ly is being emitted from regions spatially offset from the LyC source, and if so, it could be offset and possible more extended than the UV continuum.
The shape of the observed Ly profile and the properties of the neutral gas inferred from it also depends on the intrinsic nebular profile, which is not well characterized with our data. The non-resonant lines H and [O iii] have relatively low SNR and are observed with low resolution (Figure 5), not enough for a proper study of the intrinsic emission (e.g., to look for broad wings or complex structure of the line).
While higher spectral and spatial resolution observations of Ly and non-resonant lines are required to investigate better the complex Ly profile and its connection to the LyC in J13162614, our results already indicate that large and large ) can co-exist. It is worth noting that similar large ) have been observed in a few sources with evidence of LyC leakage. For example, the local infrared galaxy IRAS 010032238 studied in Martin et al. (2015) shows a remarkably similar Ly profile as the one in J13162614, with a blue-to-red peak line ratio and similar peak separation. Complex kinematics with high velocity wings are found both in Ly and in non-resonant lines (e.g., H), suggesting that scattering merely enhances the wings relative to the line core. Using radiative transfer modeling and assuming a clumpy geometry, Martin et al. (2015) found that the Ly profile can be well explained by a low column density ( cm-2), that is optically thin to LyC. Another example is the LyC emitter Ion2 (; de Barros et al. 2016; Vanzella et al. 2016), whose Ly emission shows a peak separation of km s-1 when observed with relatively low resolution (, de Barros et al. 2016). Higher resolution observations (, Vanzella et al. 2020) reveal a much more complex Ly profile, including a substantial emission at the systemic velocity.
Another important point worth mentioning is the difference between the Ly and LyC escape fractions. While (Ly is usually assumed and predicted (Kimm et al., 2019; Maji et al., 2022), J13162614 shows (Section 3.4), that is lower than . However, we note that the Ly emission represents only a small fraction () of the total LyC photons produced in J13162614, possibly indicating that the regions probed by Ly could not be representative of those where LyC is escaping.
4.2.5 Other properties
Other observational signatures of J13162614 resemble those found in other LyC emitters. J13162614 shows a compact morphology, being not resolved in ground-based imaging. Assuming the FWHM seeing conditions of optical images, we estimate an effective radius in the rest-frame UV kpc. Considering the large yr-1 inferred from the SED in Section 3.5, this implies a large SFR surface density yr-1 kpc-2, that is within the range of inferred in other strong LyC emitters (e.g., Vanzella et al., 2016; Izotov et al., 2018b; Marques-Chaves et al., 2021; Flury et al., 2022b). Such an intense, concentrated star-formation and the expected feedback from stellar winds of massive stars and SN explosions could play a major role in shaping the ISM (e.g, Sharma et al., 2017), favouring the escape of ionizing photons. Although inflows appear to be the dominant kinematic pattern of the gas in J13162614, strong ionized outflows are also expected given the nature of J13162614 (e.g., Álvarez-Márquez et al., 2021). High SNR and high-resolution observations of the main rest-frame optical lines are required to investigate the presence of outflowing gas in J13162614.
On the other hand, J13162614 shows a relatively modest [O iii]/[O ii] line ratio, , at least compared to other strong leakers that show (e.g., de Barros et al., 2016; Izotov et al., 2018b). Using the empirical relation of Izotov et al. (2018a), the observed predicts , which is inconsistent with our observations. However, this relation has been constrained using green pea LyC leakers with very low metallicities (12+log(O/H)). As shown by Bassett et al. (2019), line ratios of can still predict large if higher metallicities and/or lower ionization parameters are considered, which seems to be the case of J13162614 (12+log(O/H)=, see Section 3.3). This is also consistent with the recent results of Flury et al. (2022b), where a large scatter in with is found in low- LyC emitters with a wide range of metallicities (12+log(O/H)=).
Finally, the spectrum of J13162614 shows strong P-Cygni profiles in wind lines (N v 1240Å, C iv 1550Å, and also O vi 1033Å, see Figures 2 and 4) and these are ubiquitous in other strong LyC leakers (e.g., Borthakur et al., 2014; Izotov et al., 2016a; Izotov et al., 2018a; Izotov et al., 2018b; Rivera-Thorsen et al., 2019; Vanzella et al., 2018, 2020; Marques-Chaves et al., 2021). While the presence of these spectral features does not necessarily imply LyC leakage, they indicate very young ages of the stellar population (e.g., Chisholm et al., 2019), where the production of LyC photons from O-type stars and feedback from the strong winds and SN explosions are more efficient.
4.3 Favorable IGM transmission and/or high LyC production efficiency?
From the low-resolution OSIRIS spectrum we measure a ratio between the ionizing to non-ionizing flux density of . This is a factor of x higher than those measured in other strong LyC emitters at (e.g., Fletcher et al., 2019; Pahl et al., 2021; Saxena et al., 2022), despite the fact that they are at lower redshifts and, thereby, they might be less affected by IGM absorption than J13162614. Following Equation 1 and the intrinsic ratio of the best-fit S99 model, , we find that the IGM transmission in the spectral region probed by the LyC emission at Å should be to keep . This is significantly larger than the mean expected at (, e.g., Inoue et al. 2014, Steidel et al. 2018, Bassett et al. 2021). Here we investigate the probability to have such a favorable IGM transmission along the line of sight of J13162614.
We generate 10,000 model sightlines simulating the distribution of H i absorbers using the TAOIST-MC code666http://github.com/robbassett/TAOIST_MC/ (Bassett et al., 2021). functions use the models of Inoue et al. (2014) and account for both intergalactic and circumgalactic medium (IGM+CGM) following the prescriptions of Steidel et al. (2018). For every model sightline, we derive the net transmission over the rest wavelength range Å, the same interval used to measure the LyC flux of J13162614.
Left panel of Figure 8 shows the frequency distribution of these realizations. The bulk () of the simulations have . However, a small fraction of these models (148/10,000) shows a favorable IGM transmission (defined as ) that is compatible with . The mean IGM transmission at Å for the 10,000 models is found to be , while for the favorable sightlines is , that is similar to that measured between Å in Section 3.4 (). Therefore, our results suggest that a favorable IGM transmission is still possible, although such occurrence has low probability ().
A relatively lower IGM transmission is still possible if the intrinsic ratio is higher than the one assumed from the best-fit S99 model (), i.e., an SED with higher LyC production efficiency (). The right panel of Figure 8 shows the behaviour between and as a function of (LyC), following Equation 1. Considering the mean IGM transmission at , , an intrinsic is required to keep , i.e., a source producing at least more ionizing photons than our best-fit S99 model ().
Such high values of are disfavoured for J13162614 as the age and metallicity of the young stellar population are relatively well constrained ( Myr and , Section 3.1). Considering a younger age (4 Myr) and lower metallicity (), would increase only a factor of than our fiducial S99 model. Also, the inclusion of binaries can increase . Considering a BPASS models (v2.2, Stanway et al., 2016) with a continuous star-formation history with the same age (10 Myr), metallicity () and IMF, the increase of is roughly around when binaries are included. Finally, a different slope and a higher upper mass limit of the IMF can increase considerably . Considering the most top-heavy IMF model available in the BPASS library, with a IMF slope of and an upper mass limit of , and a continuous star-formation history with 10 Myr and , we infer a (). In such a case, a is needed to keep (Figure 8, right), i.e., still a factor of x higher than the mean IGM transmission at .
In short, our results suggests that, even considering a stellar population with a higher and than that assumed for J13162614, a favorable IGM transmission and a large (LyC) are required to explain the LyC flux measured in this source.
Finally, the previous discussion on , , and therefore (LyC) relies on the assumption that the observed LyC flux of J13162614 arises from the stellar emission itself, which might not be necessarily true. Models can predict the escape of free-bound emission of hydrogen in ionized nebulae from the radiation energy re-distribution of stellar LyC (Inoue, 2010). Under certain conditions (e.g., high electron temperature and (LyC), hard stellar SED, see details in Inoue 2010), this emission can be strong, producing a "Lyman bump" seen just below of the Lyman edge (Å). If present in J13162614, the (LyC) inferred in Section 3.1 could be overestimated, although it should be high. The limited SNR and spectral coverage of our OSIRIS spectrum in the LyC region, along with the inherent uncertainties due to IGM, prevent us to further investigate the presence of this "Lyman bump" emission in J13162614. Nevertheless, its presence could explain the absence of the Lyman break around Å in the spectrum of J13162614 (see Figure 4), that is expected if only pure stellar models are assumed.
4.4 The most powerful ionizing source known among star-forming galaxies
We now proceed to compare the (LyC) and the UV absolute magnitude of J13162614 with other LyC emitters. Figure 9 shows the (LyC) and of J13162614 (magenta) and other individual LyC emitters with direct detection of LyC radiation. The comparison sample consists of both low redshift (, Izotov et al. 2016a, b; Izotov et al. 2018a; Izotov et al. 2018b; Flury et al. 2022b, open circles) and star-forming galaxies (Vanzella et al. 2016; Shapley et al. 2016; Vanzella et al. 2018; Fletcher et al. 2019; Vanzella et al. 2020; Marques-Chaves et al. 2021; Saxena et al. 2022, solid circles). The figure also includes several statistical results of (LyC) from deep imaging and spectral stacks of LBGs and LAEs (Grazian et al. 2017; Marchi et al. 2017; Rutkowski et al. 2017; Fletcher et al. 2019; Bian & Fan 2020; Pahl et al. 2021; Begley et al. 2022, green diamonds). Most of these stacks show upper limits on (LyC) from to a few percent.
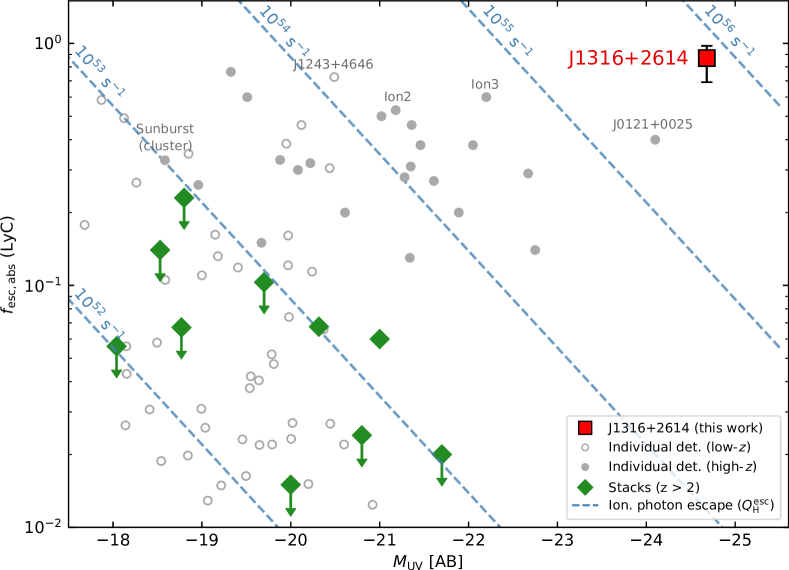
As seen in this figure, the inferred of J13162614 places it among the most powerful LyC emitter known. This result is robust and should not depend significantly with the assumptions on the IGM attenuation. Even assuming a completely transparent (and unrealistic) IGM for J13162614, , we would still infer (Section 3.4), that is larger than in many other LyC emitters. Therefore, our results indicate that large (LyC) can be found in UV-bright star-forming galaxies, and are not restricted to the faintest ones as previously thought, as already discussed in Marques-Chaves et al. (2021). Previous studies have found a possible anti-correlation between (LyC) and Steidel et al. 2018; Pahl et al. 2021; Saldana-Lopez et al. 2022, i.e., (LyC) decreases towards UV-brighter sources, but these works probe relatively faint galaxies with a narrow range of UV absolute magnitudes (). To our knowledge there are no statistical studies probing (LyC) of star-forming galaxies brighter than . The few exceptions are the ones presented in Grazian et al. (2017) where () is found for , but their sample consists of two sources only. Figure 9 clearly shows that several UV-bright sources (, Vanzella et al. 2018; Marques-Chaves et al. 2021; Saxena et al. 2022), including J13162614, are very strong LyC emitters.
It is worth discussing that many properties inferred for J13162614 and in other UV-bright LyC emitters (Vanzella et al. 2018; Marques-Chaves et al. 2021) are remarkably similar as those found in UV-faint leakers (e.g., Izotov et al. 2018b). These include very young ages ( Myr), high ( Gyr-1), compact morphologies and low dust attenuation, among others (e.g., weak UV absorption lines, strong wind lines, etc.). The remarkably difference between them is the magnitudes in the UV, that is related with the strength or amplitude of the burst. The Ly profile of J13162614 also differs from those observed in other LyC leakers, showing typically a red-dominated peak and km s-1 (e.g., Izotov et al., 2018b). It is still unclear if the properties governing the escape of ionizing photons of these UV-bright galaxies are similar to those of UV-faint sources, but should be further explored with larger samples of UV-bright sources.
Another important output from Figure 9 is the ionizing photon escape () predicted for a given and (LyC). This is highlighted by the dashed lines in Figure 9. For simplicity, these lines assume the ionizing photon production efficiency derived for J13162614, log(. We caution that the assumed may differ from source to source depending on galaxy properties (e.g., metallicity, age, SFH). For example, some UV-faint, low-metallicity starbursts at low-, including LyC emitters, present higher (e.g., log(, Schaerer et al. 2016), while more typical LBGs and LAEs show log( (e.g., Bouwens et al. 2016; Matthee et al. 2017). Despite the differences in the assumed , Figure 9 shows that the ionizing photon escape of J13162614 ( s-1, Section 3.5) is orders of magnitude higher than those predicted in UV-faint sources, even those showing large (LyC). The differences are even more extreme if the results from deep stacks of typical LBGs and LAEs are considered, where LyC emission is usually not detected down to (LyC) of a few per cent (Rutkowski et al., 2017; Fletcher et al., 2019). The inferred for J13162614 is higher than that inferred for stacks of LAE/LBG population.
The combination of large production and escape of LyC photons makes J13162614 the most powerful ionizing source known among star-forming galaxies, only comparable to J01210025 at ( and ; Marques-Chaves et al. 2021). Whether or not these UV-luminous star-forming galaxies can contribute to the cosmic reionziation at higher redshifts (), locally or globally, is still unclear and depends fundamentally if such sources are present in the early Universe and on their number density. Recent works have found exceptionally luminous () sources at with properties resemble those seen in strong LyC leakers, such as compact morphologies, steep UV slopes or high sSFRs (e.g., Morishita et al., 2020; Bouwens et al., 2022b; Harikane et al., 2022b). However, the inferred number density of these sources is still largely uncertain, ranging from Mpc-3 to some Mpc-3 for at (e.g., Calvi et al. 2016; Bowler et al. 2020; Rojas-Ruiz et al. 2020; Finkelstein & Bagley 2022; Leethochawalit et al. 2022).
4.5 Massive inflows feeding a UV-luminous starburst
J13162614 is the most luminous star-forming galaxy known in the UV () and Ly (log( s). We have shown that the large luminosity is powered by a young ( Myr) stellar population with and yr-1 (Table 4), without any evidence of AGN activity. This yields a very high Gyr-1 if only the mass of the young stellar population is assumed. Here we discuss possible mechanisms that could explain the intense starburst nature of J13162614.
With the available data we do not find any hint of a major merger that could enhance the SFR observed in J13162614. The morphology of J13162614 appears compact (kpc), and in addition, merger-induced SFRs are usually low, a factor of two at most (e.g., Pearson et al. 2019). Rather than that, the rest-frame UV spectrum of J13162614 shows signs of inflowing gas and these are likely related to its recent SFH. The spectral shape of the Ly emission in J13162614, with a blue peak more intense than the red one (Figure 3), and the redshifted ISM absorption of C iv (Figure 2) suggest gas inflows. Only a few star-forming galaxies are known to show similar Ly profiles (e.g., Trainor et al. 2015, Izotov et al. 2020, Furtak et al. 2022), but with much lower SNR. Redshifted ISM absorption lines have been also found in the spectra of star-forming galaxies at moderately low- (with a detection rates, e.g., Martin et al. 2012, Rubin et al. 2012), but are more elusive at high- (e.g., Falgarone et al. 2017, Marques-Chaves et al. 2018, Herrera-Camus et al. 2020), possibly due to cosmological dimming and low SNR continuum spectra.
Cosmological simulations predict that massive inflows towards a central star-forming region from wet disc compaction may be frequent in high redshift galaxies (Dekel & Burkert, 2014; Zolotov et al., 2015; Dekel et al., 2020). Violent disc instabilities, counter-rotating gas, gas-rich (minor) mergers, recycled gas inflows from galactic fountains, may provoke a dissipative shrinkage of gaseous discs, triggering the star formation in the central part of the galaxy, increasing the and gas density. This event is usually referred to the "blue nugget" phase. At later times, this can eventually lead to central depletion and quenching of the star-formation (e.g., Tacchella et al., 2016b), resulting in a compact quiescent galaxy ("red nugget").
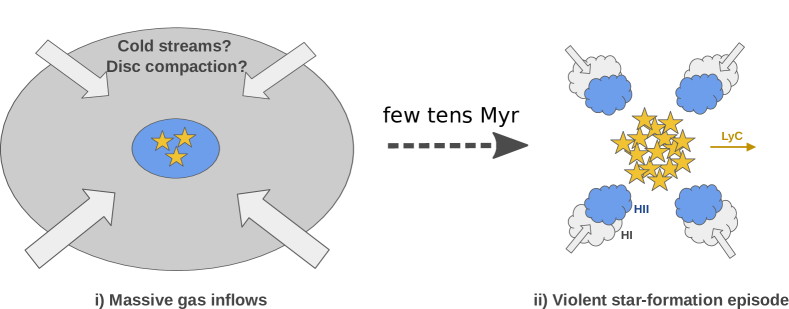
We speculate that a similar mechanism could be responsible for the massive starburst observed in J13162614. Figure 10 shows a schematic illustration of this mechanism that helps to explain and visualize several properties observed in J13162614. Gas contraction or neutral gas inflows in J13162614 (left) would lead to an intense and concentrated star-formation episode, increasing the and in a short period of time of a few Myr (right). This could explain the recent and bursty SFH, large luminosity, SFR, and the overall SED of J13162614 (right). The inflowing gas that we observed in J13162614 could correspond to gas left that has not been converted into stars. Gas in the remaining regions could have been consumed already in the starburst or removed by stellar winds and supernovae feedback. These regions would present low column density of neutral gas, cm-2, where LyC photons are escaping.
Simulations predict that the maximum compaction of the gaseous disc occurs at stellar masses at (Tacchella et al., 2016b), which is broadly consistent with that inferred for J13162614 (). Simulations also predict that the maximum increase of the with respect to the MS is in the compaction phase (Zolotov et al., 2015; Tacchella et al., 2016a), while for J13162614 we infer if only the mass formed in the most recent star-formation history is considered. This suggests the presence of an old stellar population, that according to our results inferred in Section 3.5 should be less massive than (5). If both young and old stellar components are considered, the specific SFR can decrease considerably, down to Gyr-1 or dex above the MS (Figure 5), but still consistent with simulations (Zolotov et al., 2015; Tacchella et al., 2016a).
The violent star-formation episode observed in J13162614 resemble those of some massive and quiescent galaxies found at , where strong ( yr-1) and short ( Myr) events of star formation are invoked (e.g., Glazebrook et al., 2017; Forrest et al., 2020; Valentino et al., 2020). Other works have identified compact star-forming galaxies with morphological properties and colors that are expected in the progenitors of quiescent and massive galaxies (e.g., Barro et al., 2013, 2017; Huertas-Company et al., 2018), but without the information on the gas kinematics. At some extent, similar mechanisms are required to explain the properties of the two star-forming galaxies known brighter than , BOSS-EUVLG1 at (; Marques-Chaves et al. 2020b) and J01210025 at (, also a LyC leaker; Marques-Chaves et al. 2021), both selected in the same way as J13162614 using the public BOSS/SDSS survey. These sources share similar properties as J13162614, characterized by young ( Myr) starbursts with yr-1, Gyr-1, and compact morphologies ( kpc). Nevertheless, neutral and ionized outflows are detected in BOSS-EUVLG1 and J01210025 (Marques-Chaves et al., 2020b; Álvarez-Márquez et al., 2021; Marques-Chaves et al., 2021), without any evidence for the inflowing signatures that we observe in J13162614, but are also expected due to the increase of and in these sources (e.g., Williams et al., 2015).
In short, J13162614 and the other UV-bright star-forming galaxies discovered recently (Marques-Chaves et al., 2020b, 2021) could represent the initial phases ( Myr) in the evolution of massive galaxies. Their fate will depend on the amount of gas available and the efficiency to form new stars, which are still unknown. Star-formation can be quenched by starvation or they can continue to form new stars and dust, possibly reaching the far-IR bright phase. Other physical processes, e.g., major merger, formation of a super massive black hole or its ignition and feedback, could alter their fate as well. In any case, these UV-luminous phases must be shorted lived, lasting some tens to a few hundreds Myr, as already discussed in Marques-Chaves et al. (2020b), but should mark drastic transitions on the properties of these galaxies, on the stellar mass build-up, chemical an dust enrichment, quenching mechanisms, and possibly on LyC leakage.
5 Conclusion
In this work we have presented the discovery and analysis of J13162614 at , a luminous star-forming galaxy with high escape fraction of Lyman continuum radiation. While selected first as a bright QSO within BOSS/SDSS, follow-up observations with the GTC have revealed its true, starburst nature without any signs of AGN activity. From the analysis of these data we arrive at the following main results:
-
•
J13162614 is the most luminous star-forming galaxy known so far in the UV and Ly, with and log( s. The detection of stellar features in the rest-frame UV spectrum, such as photospheric absorption lines and wind lines, narrow nebular emission ( km s-1), and blue SED (, ) discards a dominant AGN contribution to the luminosity of J13162614. We do not find any evidence of J13162614 being magnified by gravitational lensing.
-
•
The rest-frame UV spectrum is well reproduced by a S99 model with a continuous star-formation history with an age of 9 Myr, and little dust obscuration (). The corresponding ionizing photon production efficiency is log(. The optical to mid-IR photometry (m, rest) is dominated by the emission of this young stellar population. Our multi-wavelength best-fit SED model predicts a yr-1 and log( for the young stellar population. The presence of an old stellar population ( Myr) is not well constrained, but should be less massive than log( (5).
-
•
LyC emission (Å) is significantly detected down to Å and with a mean flux density Jy. We infer a relative (absolute) LyC escape fraction () assuming a relatively high IGM transmission (). The contribution of a foreground or AGN contamination to the LyC signal is unlikely. Other indirect tracers also suggest high escape fraction, including high specific SFR ( Gyr-1) and SFR surface density ( yr-1 kpc-2), and weak/non-detected low-ionization ISM lines. J13162614 is the most powerful ionizing source known among the star-forming galaxy population, both in terms of production ( s-1) and escape () of ionizing photons.
-
•
Nebular emission is detected in Ly and in rest-frame optical lines H, [O ii] and [O iii], but these are much weaker (’s of Ly and H of Å) than that expected for the derived star-formation history of J13162614 (Å for Myr age). Our results demonstrate, for the first time, that large escape of ionizing photons affects strongly the strength of nebular lines and continuum emission, roughly by a factor of (), and that only a fraction of ionizing photons will contribute to the photoionization of H ii regions. This suggests that at least some weak emission line galaxies could be potentially very strong LyC leakers. This may help in designing future surveys to detect very strong LyC emitters, which are for now restricted mostly in targeting extreme emission line star-forming galaxies, like green pea-like galaxies.
-
•
The Ly emission in J13162614 shows a double peak profile, with a blue peak more intense than the red one () indicating neutral gas inflows. This is supported by the detection of redshifted ISM components of C iv. We speculate that massive inflows or dissipative compaction of the gas disc have triggered an intense and concentrated star-formation in the central part of the J13162614 and in a short period of time. This would explain its recent star-formation history, as well as many other properties observed in J13162614, such us its large luminosity, SFR, sSFR, , SED, and gas kinematics. J13162614 may represent the first case known of a star-forming galaxy undergoing a "blue nugget" phase, where gas inflows and a massive, compact and young starburst are observed simultaneously.
Acknowledgements
The authors thank the anonymous referee for useful comments that greatly improved the clarity of this work. R.M.C. thanks Fabrice Martins, Benjamin Magnelli and Jorge Sanchez-Almeida for useful discussions. Based on observations made with the Gran Telescopio Canarias (GTC) installed in the Spanish Observatorio del Roque de los Muchachos of the Instituto de Astrofísica de Canarias, in the island of La Palma. J.A.M., L.C., and I.P.F. acknowledge support from the Spanish State Research Agency (AEI) under grant numbers ESP2015-65597-C4-4-R, ESP2017-86852-C4-2-R, PID2021-127718NB-I00, PGC2018-094975-B-C22, and MDM-2017-0737 Unidad de Excelencia ”María de Maeztu”- Centro de Astrobiología (CSIC-INTA). D.C. is a Ramon-Cajal Researcher and is supported by the Ministerio de Ciencia, Innovación y Universidades (MICIU/FEDER) under research grant PID2021-122603NB-C21. A.S.L. acknowledge support from Swiss National Science Foundation. ASL acknowledge support from Swiss National Science Foundation.
Data availability
The data underlying this article will be shared on reasonable request to the corresponding author.
References
- Abolfathi et al. (2018) Abolfathi B., et al., 2018, ApJS, 235, 42
- Alexandroff et al. (2015) Alexandroff R. M., Heckman T. M., Borthakur S., Overzier R., Leitherer C., 2015, ApJ, 810, 104
- Álvarez-Márquez et al. (2021) Álvarez-Márquez J., Marques-Chaves R., Colina L., Pérez-Fournon I., 2021, A&A, 647, A133
- Ao et al. (2020) Ao Y., et al., 2020, Nature Astronomy, 4, 670
- Bañados et al. (2018) Bañados E., et al., 2018, Nature, 553, 473
- Barro et al. (2013) Barro G., et al., 2013, ApJ, 765, 104
- Barro et al. (2017) Barro G., et al., 2017, ApJ, 840, 47
- Bassett et al. (2019) Bassett R., et al., 2019, MNRAS, 483, 5223
- Bassett et al. (2021) Bassett R., Ryan-Weber E. V., Cooke J., Meštrić U., Kakiichi K., Prichard L., Rafelski M., 2021, MNRAS, 502, 108
- Begley et al. (2022) Begley R., et al., 2022, MNRAS, 513, 3510
- Bian & Fan (2020) Bian F., Fan X., 2020, MNRAS, 493, L65
- Boquien et al. (2019) Boquien M., Burgarella D., Roehlly Y., Buat V., Ciesla L., Corre D., Inoue A. K., Salas H., 2019, A&A, 622, A103
- Borthakur et al. (2014) Borthakur S., Heckman T. M., Leitherer C., Overzier R. A., 2014, Science, 346, 216
- Bouwens et al. (2016) Bouwens R. J., Smit R., Labbé I., Franx M., Caruana J., Oesch P., Stefanon M., Rasappu N., 2016, ApJ, 831, 176
- Bouwens et al. (2022a) Bouwens R. J., Illingworth G. D., van Dokkum P. G., Oesch P. A., Stefanon M., Ribeiro B., 2022a, ApJ, 927, 81
- Bouwens et al. (2022b) Bouwens R. J., et al., 2022b, ApJ, 931, 160
- Bowler et al. (2020) Bowler R. A. A., Jarvis M. J., Dunlop J. S., McLure R. J., McLeod D. J., Adams N. J., Milvang-Jensen B., McCracken H. J., 2020, MNRAS, 493, 2059
- Bruzual & Charlot (2003) Bruzual G., Charlot S., 2003, MNRAS, 344, 1000
- Burgarella et al. (2005) Burgarella D., Buat V., Iglesias-Páramo J., 2005, MNRAS, 360, 1413
- Calvi et al. (2016) Calvi V., et al., 2016, ApJ, 817, 120
- Calzetti et al. (2000) Calzetti D., Armus L., Bohlin R. C., Kinney A. L., Koornneef J., Storchi-Bergmann T., 2000, ApJ, 533, 682
- Cardelli et al. (1989) Cardelli J. A., Clayton G. C., Mathis J. S., 1989, ApJ, 345, 245
- Chabrier (2003) Chabrier G., 2003, ApJ, 586, L133
- Charlot & Longhetti (2001) Charlot S., Longhetti M., 2001, MNRAS, 323, 887
- Chisholm et al. (2017) Chisholm J., Orlitová I., Schaerer D., Verhamme A., Worseck G., Izotov Y. I., Thuan T. X., Guseva N. G., 2017, A&A, 605, A67
- Chisholm et al. (2018) Chisholm J., et al., 2018, A&A, 616, A30
- Chisholm et al. (2019) Chisholm J., Rigby J. R., Bayliss M., Berg D. A., Dahle H., Gladders M., Sharon K., 2019, ApJ, 882, 182
- Chisholm et al. (2022) Chisholm J., et al., 2022, arXiv e-prints, p. arXiv:2207.05771
- Cristiani et al. (2016) Cristiani S., Serrano L. M., Fontanot F., Vanzella E., Monaco P., 2016, MNRAS, 462, 2478
- Crowther et al. (2016) Crowther P. A., et al., 2016, MNRAS, 458, 624
- Daddi et al. (2021) Daddi E., et al., 2021, A&A, 649, A78
- Dekel & Burkert (2014) Dekel A., Burkert A., 2014, MNRAS, 438, 1870
- Dekel et al. (2020) Dekel A., et al., 2020, MNRAS, 496, 5372
- Dessauges-Zavadsky et al. (2006) Dessauges-Zavadsky M., Prochaska J. X., D’Odorico S., Calura F., Matteucci F., 2006, A&A, 445, 93
- Dijkstra et al. (2006) Dijkstra M., Haiman Z., Spaans M., 2006, ApJ, 649, 14
- Eisenstein et al. (2011) Eisenstein D. J., et al., 2011, AJ, 142, 72
- Endsley et al. (2021) Endsley R., Stark D. P., Chevallard J., Charlot S., 2021, MNRAS, 500, 5229
- Erb et al. (2014) Erb D. K., et al., 2014, ApJ, 795, 33
- Falgarone et al. (2017) Falgarone E., et al., 2017, Nature, 548, 430
- Finkelstein & Bagley (2022) Finkelstein S. L., Bagley M. B., 2022, arXiv e-prints, p. arXiv:2207.02233
- Finkelstein et al. (2019) Finkelstein S. L., et al., 2019, ApJ, 879, 36
- Fletcher et al. (2019) Fletcher T. J., Tang M., Robertson B. E., Nakajima K., Ellis R. S., Stark D. P., Inoue A., 2019, ApJ, 878, 87
- Flury et al. (2022a) Flury S. R., et al., 2022a, ApJS, 260, 1
- Flury et al. (2022b) Flury S. R., et al., 2022b, ApJ, 930, 126
- Forrest et al. (2020) Forrest B., et al., 2020, ApJ, 890, L1
- Furtak et al. (2022) Furtak L. J., et al., 2022, MNRAS, 516, 1373
- Garcia & Bianchi (2004) Garcia M., Bianchi L., 2004, ApJ, 606, 497
- Gazagnes et al. (2018) Gazagnes S., Chisholm J., Schaerer D., Verhamme A., Rigby J. R., Bayliss M., 2018, A&A, 616, A29
- Glazebrook et al. (2017) Glazebrook K., et al., 2017, Nature, 544, 71
- Grazian et al. (2017) Grazian A., et al., 2017, A&A, 602, A18
- Harikane et al. (2022a) Harikane Y., et al., 2022a, ApJS, 259, 20
- Harikane et al. (2022b) Harikane Y., et al., 2022b, ApJ, 929, 1
- Hashimoto et al. (2019) Hashimoto T., et al., 2019, PASJ, p. 70
- Herrera-Camus et al. (2020) Herrera-Camus R., et al., 2020, A&A, 633, L4
- Huertas-Company et al. (2018) Huertas-Company M., et al., 2018, ApJ, 858, 114
- Inoue (2010) Inoue A. K., 2010, MNRAS, 401, 1325
- Inoue & Iwata (2008) Inoue A. K., Iwata I., 2008, MNRAS, 387, 1681
- Inoue et al. (2014) Inoue A. K., Shimizu I., Iwata I., Tanaka M., 2014, MNRAS, 442, 1805
- Izotov et al. (2016a) Izotov Y. I., Schaerer D., Thuan T. X., Worseck G., Guseva N. G., Orlitová I., Verhamme A., 2016a, MNRAS, 461, 3683
- Izotov et al. (2016b) Izotov Y. I., Orlitová I., Schaerer D., Thuan T. X., Verhamme A., Guseva N. G., Worseck G., 2016b, Nature, 529, 178
- Izotov et al. (2018a) Izotov Y. I., Schaerer D., Worseck G., Guseva N. G., Thuan T. X., Verhamme A., Orlitová I., Fricke K. J., 2018a, MNRAS, 474, 4514
- Izotov et al. (2018b) Izotov Y. I., Worseck G., Schaerer D., Guseva N. G., Thuan T. X., Fricke Verhamme A., Orlitová I., 2018b, MNRAS, 478, 4851
- Izotov et al. (2020) Izotov Y. I., Schaerer D., Worseck G., Verhamme A., Guseva N. G., Thuan T. X., Orlitová I., Fricke K. J., 2020, MNRAS, 491, 468
- Jaskot & Oey (2013) Jaskot A. E., Oey M. S., 2013, ApJ, 766, 91
- Ji et al. (2020) Ji Z., et al., 2020, ApJ, 888, 109
- Kimm et al. (2019) Kimm T., Blaizot J., Garel T., Michel-Dansac L., Katz H., Rosdahl J., Verhamme A., Haehnelt M., 2019, MNRAS, 486, 2215
- Leethochawalit et al. (2022) Leethochawalit N., Roberts-Borsani G., Morishita T., Trenti M., Treu T., 2022, arXiv e-prints, p. arXiv:2205.15388
- Leitherer et al. (1999) Leitherer C., et al., 1999, ApJS, 123, 3
- Li et al. (2022) Li Z., Steidel C. C., Gronke M., Chen Y., Matsuda Y., 2022, MNRAS, 513, 3414
- Lin et al. (2022) Lin Y.-H., Scarlata C., Hayes M., Feltre A., Charlot S., Bongiorno A., Väisänen P., Mogotsi M., 2022, MNRAS, 509, 489
- Liu et al. (2022) Liu C., et al., 2022, ApJS, 261, 24
- Lusso et al. (2015) Lusso E., Worseck G., Hennawi J. F., Prochaska J. X., Vignali C., Stern J., O’Meara J. M., 2015, MNRAS, 449, 4204
- Maji et al. (2022) Maji M., et al., 2022, A&A, 663, A66
- Marchi et al. (2017) Marchi F., et al., 2017, A&A, 601, A73
- Marocco et al. (2021) Marocco F., et al., 2021, ApJS, 253, 8
- Marques-Chaves et al. (2018) Marques-Chaves R., et al., 2018, ApJ, 854, 151
- Marques-Chaves et al. (2020a) Marques-Chaves R., et al., 2020a, MNRAS, 492, 1257
- Marques-Chaves et al. (2020b) Marques-Chaves R., et al., 2020b, MNRAS, 499, L105
- Marques-Chaves et al. (2021) Marques-Chaves R., Schaerer D., Álvarez-Márquez J., Colina L., Dessauges-Zavadsky M., Pérez-Fournon I., Saldana-Lopez A., Verhamme A., 2021, MNRAS, 507, 524
- Marques-Chaves et al. (2022) Marques-Chaves R., et al., 2022, A&A, 663, L1
- Martin et al. (2012) Martin C. L., Shapley A. E., Coil A. L., Kornei K. A., Bundy K., Weiner B. J., Noeske K. G., Schiminovich D., 2012, ApJ, 760, 127
- Martin et al. (2015) Martin C. L., Dijkstra M., Henry A., Soto K. T., Danforth C. W., Wong J., 2015, ApJ, 803, 6
- Martins & Palacios (2022) Martins F., Palacios A., 2022, A&A, 659, A163
- Maseda et al. (2020) Maseda M. V., et al., 2020, MNRAS, 493, 5120
- Mason et al. (2018) Mason C. A., Treu T., Dijkstra M., Mesinger A., Trenti M., Pentericci L., de Barros S., Vanzella E., 2018, ApJ, 856, 2
- Matthee et al. (2017) Matthee J., Sobral D., Best P., Khostovan A. A., Oteo I., Bouwens R., Röttgering H., 2017, MNRAS, 465, 3637
- Micheva et al. (2017) Micheva G., Iwata I., Inoue A. K., 2017, MNRAS, 465, 302
- Morishita et al. (2020) Morishita T., et al., 2020, ApJ, 904, 50
- Naidu et al. (2022) Naidu R. P., et al., 2022, MNRAS, 510, 4582
- Nakajima & Ouchi (2014) Nakajima K., Ouchi M., 2014, MNRAS, 442, 900
- Oesch et al. (2016) Oesch P. A., et al., 2016, ApJ, 819, 129
- Osterbrock & Ferland (2006) Osterbrock D. E., Ferland G. J., 2006, Astrophysics of gaseous nebulae and active galactic nuclei
- Pahl et al. (2021) Pahl A. J., Shapley A., Steidel C. C., Chen Y., Reddy N. A., 2021, MNRAS, 505, 2447
- Pâris et al. (2018) Pâris I., et al., 2018, A&A, 613, A51
- Pearson et al. (2019) Pearson W. J., et al., 2019, A&A, 631, A51
- Pilyugin & Thuan (2005) Pilyugin L. S., Thuan T. X., 2005, ApJ, 631, 231
- Planck Collaboration et al. (2020) Planck Collaboration et al., 2020, A&A, 641, A6
- Reddy & Steidel (2009) Reddy N. A., Steidel C. C., 2009, ApJ, 692, 778
- Rivera-Thorsen et al. (2017) Rivera-Thorsen T. E., et al., 2017, A&A, 608, L4
- Rivera-Thorsen et al. (2019) Rivera-Thorsen T. E., et al., 2019, Science, 366, 738
- Robertson et al. (2015) Robertson B. E., Ellis R. S., Furlanetto S. R., Dunlop J. S., 2015, ApJ, 802, L19
- Rojas-Ruiz et al. (2020) Rojas-Ruiz S., Finkelstein S. L., Bagley M. B., Stevans M., Finkelstein K. D., Larson R., Mechtley M., Diekmann J., 2020, ApJ, 891, 146
- Roman-Duval et al. (2020) Roman-Duval J., et al., 2020, Research Notes of the American Astronomical Society, 4, 205
- Rubin et al. (2012) Rubin K. H. R., Prochaska J. X., Koo D. C., Phillips A. C., 2012, ApJ, 747, L26
- Rutkowski et al. (2017) Rutkowski M. J., et al., 2017, ApJ, 841, L27
- Saldana-Lopez et al. (2022) Saldana-Lopez A., et al., 2022, A&A, 663, A59
- Santini et al. (2017) Santini P., et al., 2017, ApJ, 847, 76
- Saxena et al. (2022) Saxena A., et al., 2022, MNRAS, 511, 120
- Schaerer & de Barros (2009) Schaerer D., de Barros S., 2009, A&A, 502, 423
- Schaerer et al. (2016) Schaerer D., Izotov Y. I., Verhamme A., Orlitová I., Thuan T. X., Worseck G., Guseva N. G., 2016, A&A, 591, L8
- Schaerer et al. (2022) Schaerer D., et al., 2022, A&A, 658, L11
- Schlafly & Finkbeiner (2011) Schlafly E. F., Finkbeiner D. P., 2011, ApJ, 737, 103
- Selsing et al. (2016) Selsing J., Fynbo J. P. U., Christensen L., Krogager J. K., 2016, A&A, 585, A87
- Senchyna et al. (2021) Senchyna P., Stark D. P., Charlot S., Chevallard J., Bruzual G., Vidal-García A., 2021, MNRAS, 503, 6112
- Shapley et al. (2003) Shapley A. E., Steidel C. C., Pettini M., Adelberger K. L., 2003, ApJ, 588, 65
- Shapley et al. (2016) Shapley A. E., Steidel C. C., Strom A. L., Bogosavljević M., Reddy N. A., Siana B., Mostardi R. E., Rudie G. C., 2016, ApJ, 826, L24
- Sharma et al. (2016) Sharma M., Theuns T., Frenk C., Bower R., Crain R., Schaller M., Schaye J., 2016, MNRAS, 458, L94
- Sharma et al. (2017) Sharma M., Theuns T., Frenk C., Bower R. G., Crain R. A., Schaller M., Schaye J., 2017, MNRAS, 468, 2176
- Shibuya et al. (2014) Shibuya T., et al., 2014, ApJ, 788, 74
- Stanway et al. (2016) Stanway E. R., Eldridge J. J., Becker G. D., 2016, MNRAS, 456, 485
- Steidel et al. (2016) Steidel C. C., Strom A. L., Pettini M., Rudie G. C., Reddy N. A., Trainor R. F., 2016, ApJ, 826, 159
- Steidel et al. (2018) Steidel C. C., Bogosavljević M., Shapley A. E., Reddy N. A., Rudie G. C., Pettini M., Trainor R. F., Strom A. L., 2018, ApJ, 869, 123
- Tacchella et al. (2016a) Tacchella S., Dekel A., Carollo C. M., Ceverino D., DeGraf C., Lapiner S., Mandelker N., Primack Joel R., 2016a, MNRAS, 457, 2790
- Tacchella et al. (2016b) Tacchella S., Dekel A., Carollo C. M., Ceverino D., DeGraf C., Lapiner S., Mandelker N., Primack J. R., 2016b, MNRAS, 458, 242
- Trainor et al. (2015) Trainor R. F., Steidel C. C., Strom A. L., Rudie G. C., 2015, ApJ, 809, 89
- Valentino et al. (2020) Valentino F., et al., 2020, ApJ, 889, 93
- Vanzella et al. (2012) Vanzella E., et al., 2012, ApJ, 751, 70
- Vanzella et al. (2016) Vanzella E., et al., 2016, ApJ, 825, 41
- Vanzella et al. (2017) Vanzella E., et al., 2017, MNRAS, 465, 3803
- Vanzella et al. (2018) Vanzella E., et al., 2018, MNRAS, 476, L15
- Vanzella et al. (2020) Vanzella E., et al., 2020, MNRAS, 491, 1093
- Verhamme et al. (2015) Verhamme A., Orlitová I., Schaerer D., Hayes M., 2015, Astronomy and Astrophysics, 578, A7
- Verhamme et al. (2017) Verhamme A., Orlitová I., Schaerer D., Izotov Y., Worseck G., Thuan T. X., Guseva N., 2017, A&A, 597, A13
- Williams et al. (2015) Williams C. C., et al., 2015, ApJ, 800, 21
- Wofford et al. (2013) Wofford A., Leitherer C., Salzer J., 2013, ApJ, 765, 118
- Xu et al. (2022) Xu X., et al., 2022, ApJ, 933, 202
- Yung et al. (2019) Yung L. Y. A., Somerville R. S., Finkelstein S. L., Popping G., Davé R., 2019, MNRAS, 483, 2983
- Zackrisson et al. (2013) Zackrisson E., Inoue A. K., Jensen H., 2013, ApJ, 777, 39
- Zackrisson et al. (2017) Zackrisson E., et al., 2017, ApJ, 836, 78
- Zolotov et al. (2015) Zolotov A., et al., 2015, MNRAS, 450, 2327
- de Barros et al. (2016) de Barros S., et al., 2016, A&A, 585, A51