Dust Echoes from Luminous Fast Blue Optical Transients
Abstract
Luminous fast blue optical transients (LFBOTs) such as AT2018cow form a rare class of engine-powered explosions of uncertain origin. A hallmark feature of these events is radio/millimeter synchrotron emission powered by the interaction of fast ejecta and dense circumstellar material (CSM) extending to large radii cm surrounding the progenitor. Assuming this CSM to be an outflow from the progenitor, we show that dust grains up to in size can form in the outflow in the years before the explosion. This dusty CSM would attenuate the transient’s ultraviolet (UV) emission prior to peak light, before being destroyed by the rising luminosity, reddening the pre-maximum colors (consistent with the pre-maximum red-to-blue color evolution of the LFBOT candidate MUSSES2020J). Re-radiation by the dust before being destroyed generates an near-infrared (NIR) “echo” of luminosity erg s-1 lasting weeks, which is detectable over the transient’s rapidly fading blue continuum. We show that this dust echo is compatible with the previously unexplained NIR excess observed in AT2018cow. The gradual decay of the early NIR light curve can result from CSM which is concentrated in wide-angle outflow or torus, consistent with the highly aspherical geometry of AT2018cow’s ejecta. Pre-maximum optical/UV and NIR follow-up of LFBOTs provide an new probe of their CSM environments and place additional constraints on their progenitors.
1 Introduction
“Fast Blue Optical Transients” (FBOTs; Drout et al. 2014; Arcavi et al. 2016; Pursiainen et al. 2018; Ho et al. 2021a) are UV-bright supernova(SN)-like explosions of debated origin characterized by UV/optical rise times of only days and peak luminosities up to erg s-1. This paper focuses on the most luminous FBOTs (hereafter “LFBOTs”), which are extremely rare ( of the core-collapse SN rate; e.g., Coppejans et al. 2020; Ho et al. 2021a) and likely possess distinct progenitors from the majority of FBOTs (whose properties may form a continuum with previously-identified SN classes; Ho et al. 2021a).
The prototypical LFBOT is AT2018cow, which exhibited multi-wavelength emission spanning radio to gamma-rays (Prentice et al., 2018; Rivera Sandoval et al., 2018; Kuin et al., 2019; Perley et al., 2019; Margutti et al., 2019; Ho et al., 2019; Nayana & Chandra, 2021). AT2018cow’s UV/optical light curve rose over just a few days to a peak luminosity erg s-1 before declining rapidly thereafter. This emission was accompanied by variable non-thermal X-rays present from the first observations days after the explosion (e.g., Rivera Sandoval et al. 2018; Kuin et al. 2019). The X-rays likely originate from a compact object central engine (Perley et al., 2019; Margutti et al., 2019; Pasham et al., 2021) whose spectra (namely time-dependent Fe and Compton-hump emission features) indicate is embedded within the expanding ejecta shell (Margutti et al., 2019). The optical wavelength spectra were initially featureless over the first couple weeks after the explosion, indicating large expansion velocities and high temperatures K. Later spectra revealed the emergence of H and He emission features at significantly lower velocities km s-1 with no evidence for ejecta cooling (e.g., Perley et al. 2019; Margutti et al. 2019; Xiang et al. 2021).
Narrow He emission lines km s-1 were also detected from AT2018cow, pointing to the presence of dense H-depleted circumstellar material (CSM) ahead of the ejecta (e.g., Fox & Smith 2019; Dessart et al. 2021). Indeed, one of the hallmark features of LFBOTs is the presence of luminous radio and millimeter synchrotron emission (Ho et al., 2019; Margutti et al., 2019; Nayana & Chandra, 2021) arising due to shock interaction between the fastest ejecta (velocity c) and CSM of density cm-3 on radial scales cm surrounding the progenitor.
Over the past few years, additional LFBOTs have been discovered which exhibit qualitatively similar multi-wavelength properties to AT2018cow, including CSS161010 (Coppejans et al., 2020), AT2018lug (“Koala”; Ho et al. 2020), AT2020xnd (Bright et al., 2021; Perley et al., 2021; Ho et al., 2021b), and AT2020mrf (Yao et al., 2021), albeit with a wide range of X-ray luminosities and fastest ejecta speeds implied by their radio/mm emissions. An LFBOT-like optical/UV transient, MUSSES2020J, was recently discovered which reached an even higher peak luminosity erg s-1 with the final light curve rise by a factor of captured over just 5 days (Jiang et al., 2022), though the identification of this event as an LFBOT is not certain because of the lack of multi-wavelength data. To summarize the physical picture that has emerged from detailed modeling (e.g., Margutti et al. 2019): AT2018cow and other LFBOTs are engine-powered explosions which generate highly aspherical ejecta spanning a wide range of velocities, propagating into a dense, radially-extended pre-existing CSM. The densest portion of the ejecta, and potentially also of the CSM, is concentrated in an equatorial torus, presumably orthogonal to the rotational or orbital angular momentum axis of the progenitor system.
A large number of progenitor models for LFBOTs have been proposed, including: the SN explosion of a rapidly-rotating massive star with a low total ejecta mass giving birth to a central engine, such as a millisecond magnetar or black hole (Prentice et al. 2018; Perley et al. 2019; Margutti et al. 2019; Fang et al. 2019; Gottlieb et al. 2022); an initially “failed” SN which nevertheless produces an accreting black hole and mass ejection (Quataert et al., 2019; Perley et al., 2019; Margutti et al., 2019; Antoni & Quataert, 2022); the tidal disruption of a star by an intermediate-mass black hole (Kuin et al., 2019; Perley et al., 2019) or a stellar-mass black hole in a dense stellar environment (Kremer et al., 2021); pulsational pair instability SNe (e.g., Leung et al. 2020); and the merger of a helium core with a black hole or neutron star following a common envelope event (Soker et al., 2019; Schrøder et al., 2020; Uno & Maeda, 2020; Soker, 2022; Metzger, 2022).
Here we point out that, regardless of its origin, the CSM surrounding LFBOTs is likely to be sufficiently cool and dense prior to the explosion to facilitate the formation and growth of dust. This dusty CSM would furthermore be opaque to the transient’s early UV emission before peak light, until the dust is destroyed by the rising luminosity. This has two observable consequences: (a) the pre-maxima UV/optical spectra of LFBOTs will be substantially redder than the bluer colors observed near and after peak light; (b) the UV luminosity absorbed during the early rising phase prior to dust destruction, will be re-emitted by the heated dust at near-infrared (NIR) wavelengths, giving rise to a “dust echo” lasting weeks. As we will show, such an echo appears compatible the heretofore mysterious NIR excess observed from AT2018cow by Perley et al. (2019). The discovery of similar and related dust signatures in future LFBOTs offers a new probe of their large-scale progenitor environments complementary to those provided by radio/mm observations.
2 Dust in LFBOTs
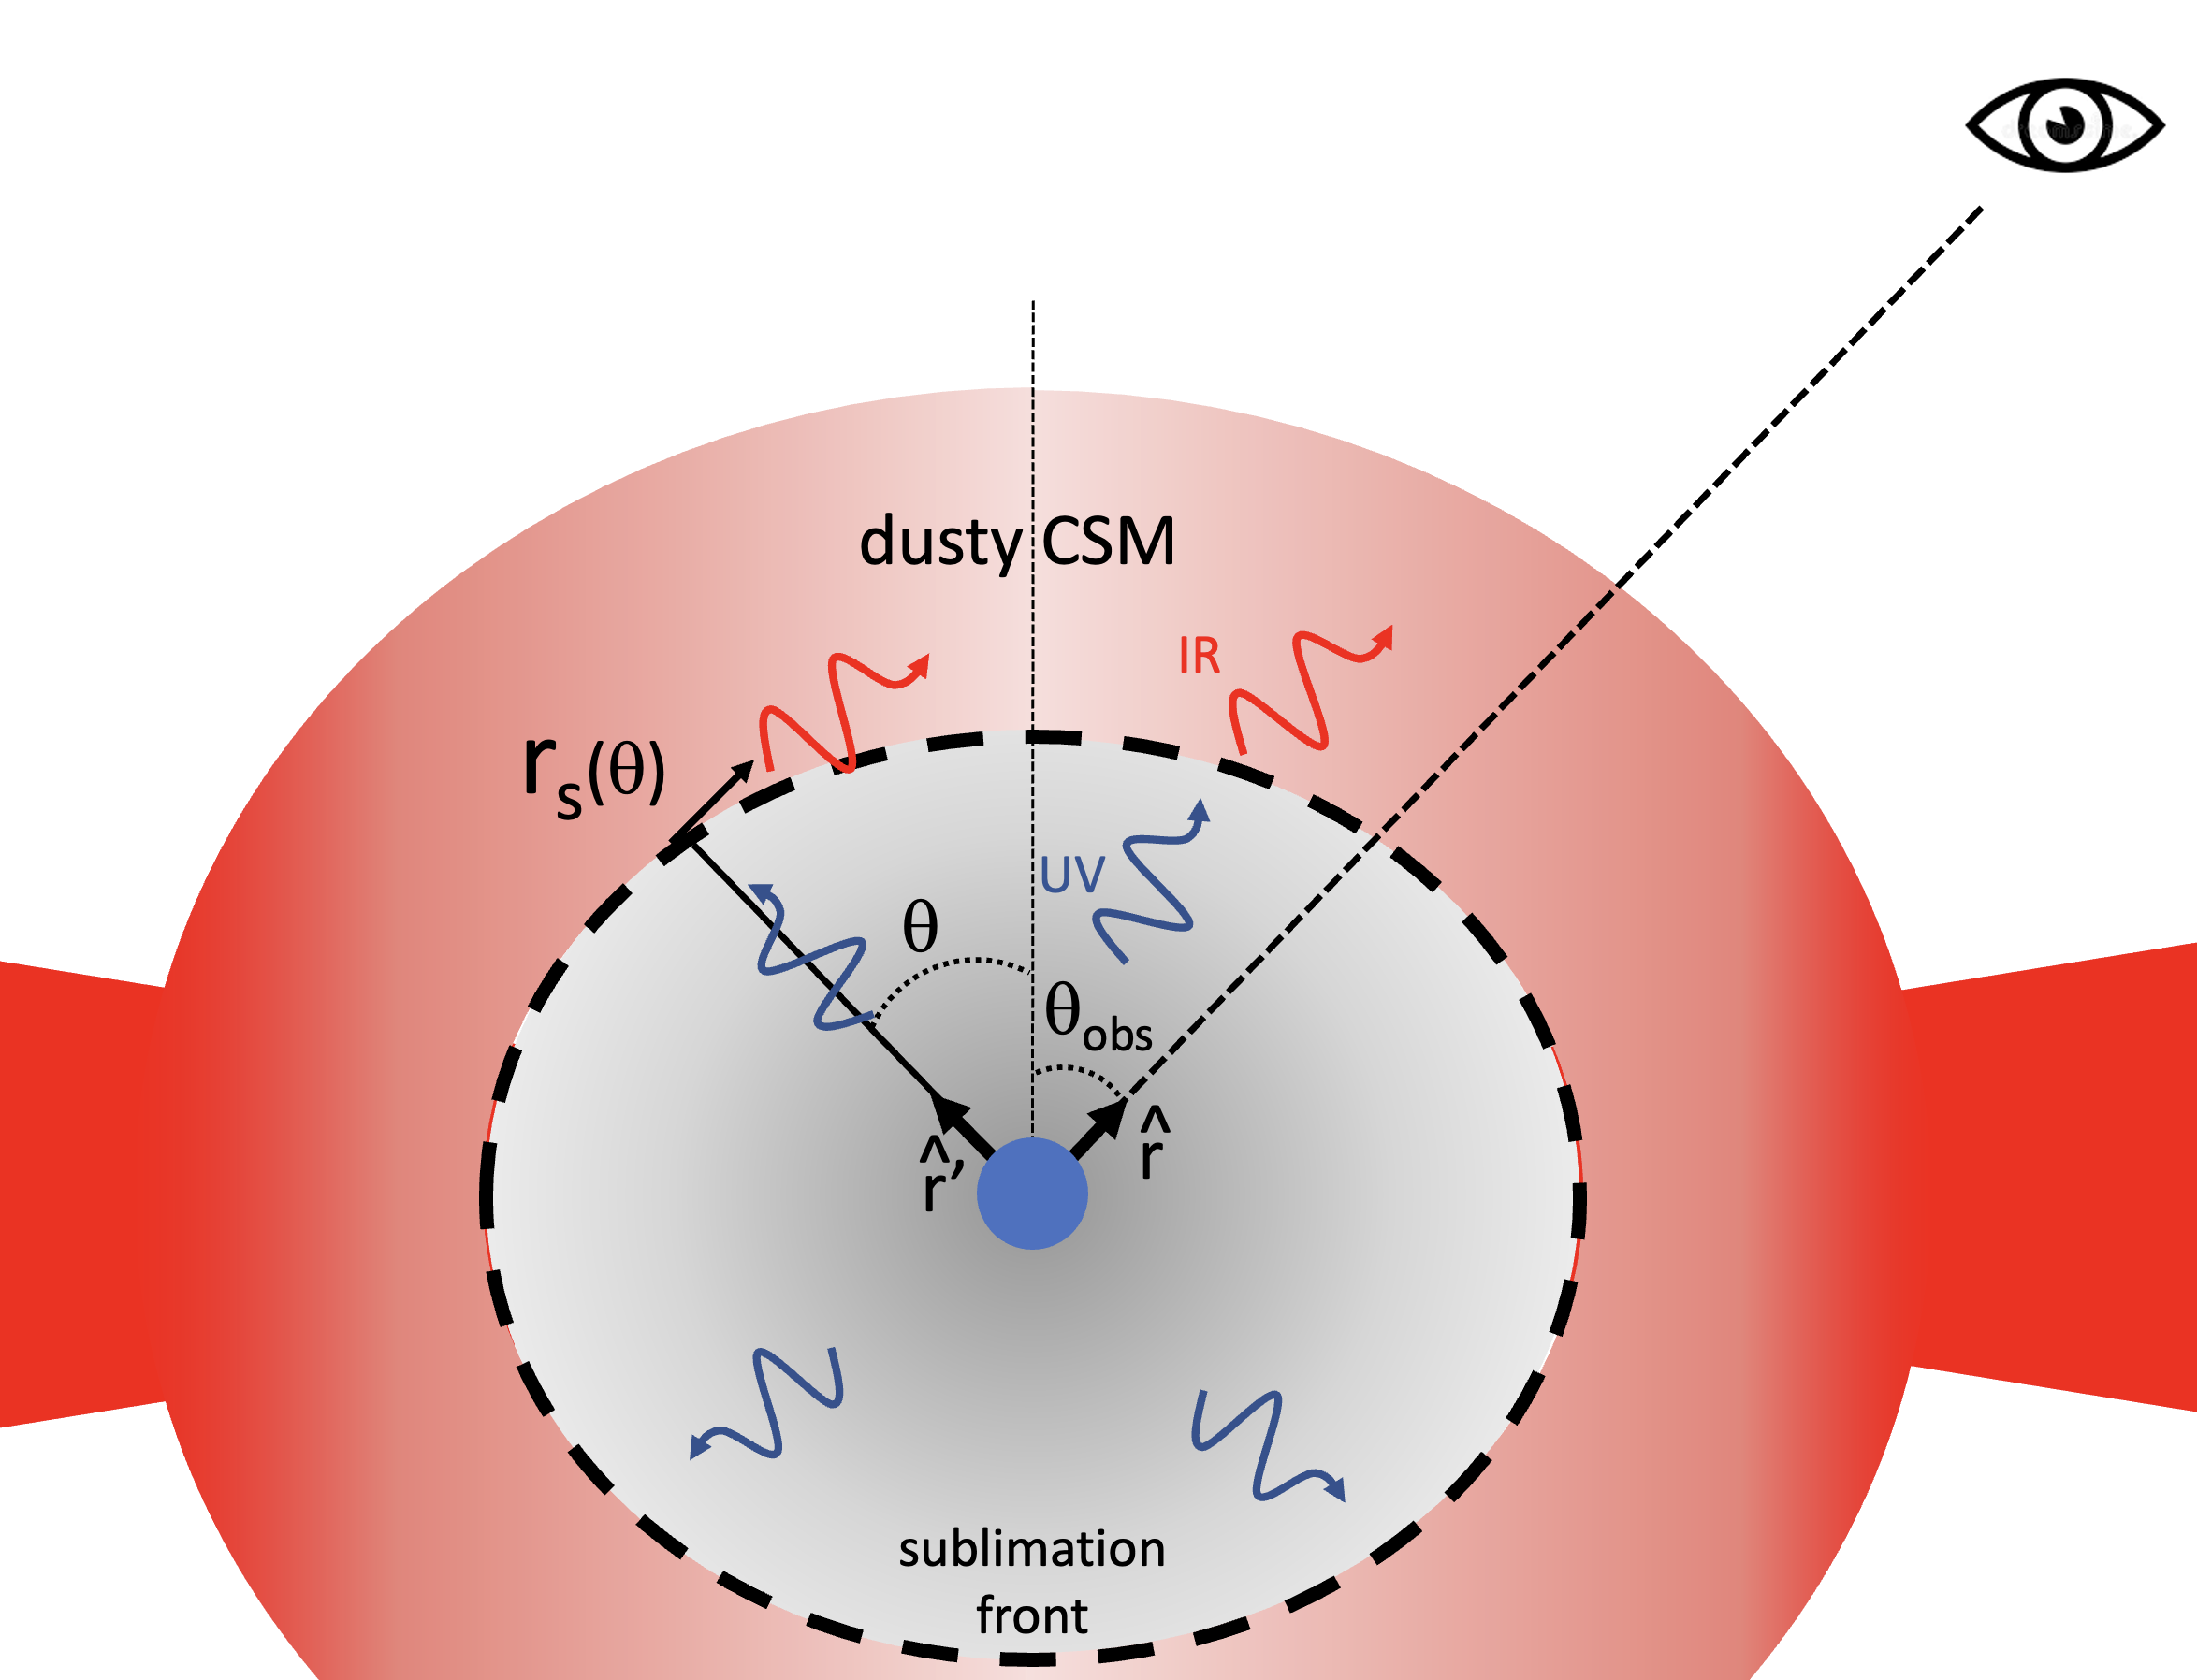
We begin in Sec. 2.1 by summarizing what is known about the CSM properties surrounding LFBOTs and use this information to estimate the dust formation properties in this environment. In Sec. 2.2 we describe the conditions for dust destruction during the LFBOT rise phase, before estimating the properties of the NIR echo in Sec. 2.3. The geometry of the system is illustrated in Fig. 1.
2.1 Dust Formation in the Progenitor CSM
The synchrotron radio/millimeter emission from LFBOTs starting weeks after the explosion is powered by shock interaction of a fast outflow of velocity c with dense CSM (e.g., Ho et al. 2019; Margutti et al. 2019; Coppejans et al. 2020; Nayana & Chandra 2021; Bright et al. 2021; Margalit et al. 2022). Application of standard synchrotron shock models to two well-studied events, AT2018cow and AT2020xnd, found similar CSM density profiles (Bright et al., 2021), which on radial scales cm are roughly approximated as a power-law of the form (Bright et al. 2021; their Fig. 4):
| (1) |
where the precise normalization depends on the shock microphysics (e.g., the fraction of the shock energy placed into magnetic fields, ). Although such a steep density profile is not compatible with that of a steady wind (), its normalization corresponds to a mass-loss rate yr-1 for an assumed wind velocity km s-1 (Fox & Smith, 2019). Modeling the optical/X-ray emission from LFBOTs (e.g., Margutti et al. 2019) indicates the ejecta from the explosion, and potentially also the CSM, is not distributed uniformly surrounding the progenitor, but is instead concentrated in a equatorial outflow or thick torus with a higher density at larger angles (Fig. 1) from the polar axis (along which the explosion ejecta is fastest and the radio/mm emission predominantly originates; see Sec. 2.3 for further discussion).
Stellar objects undergoing high rates of mass-loss in other contexts, such as giant outbursts from luminous blue variables, are observed to generate copious amounts of dust (e.g., Davidson & Humphreys 1997; Kochanek 2011). We now estimate the size of the dust grains that could grow in the outflows of LFBOT progenitors of density profile (1). Motivated by the oxygen-rich composition of massive-star outflows, we focus on silicate grains. However, qualitatively similar results would follow for carbonaceous grains, and when possible we interpret our analytic estimates for dust properties (e.g., sublimation temperatures) spanning both possibilities.
Once the temperature in the progenitor outflow decreases from its initially hot state close to the progenitor to values at radii , solid condensation occurs and grain nucleation can begin (e.g., Cherchneff & Dwek 2009; Nozawa et al. 2014), where for silicate(carbonaceous) grains, respectively.
Assuming that grain growth is dominated by the rate of accumulating monomers, the timescale for a spherical dust grain to grow to radii is given by (e.g., Kwok 1975; see Kochanek 2011, their Eq. 17),
| (2) | |||||
where in the second line we take g cm-3 as the bulk density of the silicate dust grain and is the mass fraction of dust-generating condensible material, normalized to a higher value than for solar metallicity given the hydrogen-depleted nature of the CSM surrounding LFBOTs (e.g., Perley et al. 2019). The effective collisional velocity is assumed to be the thermal velocity,
| (3) |
where K) and we take for the monomer building blocks of silicate grains (Kochanek, 2011).
The radius at which entering Eq. (2) depends on the radiation environments of the LFBOT progenitors, which are uncertain. One clue may come from the luminous UV source ( erg s-1; K) with emission features detected by the Hubble Space Telescope from the location of AT2018cow yrs after the explosion (Sun et al., 2022); the photometric stability of this source over two epochs disfavors an origin associated with the transient itself, instead pointing to an extremely massive stellar binary or cluster companion to AT2018cow’s progenitor. Assuming the progenitor was a massive star of comparable luminosity erg s-1, the radiation temperature in the CSM with energy density at radius in the outflow can be estimated as111One way to understand the factor which enters is because radially-constant energy flux will be established between the location of interest (optical depth ) and the photosphere () at which and is the radial diffusion velocity of the IR photons.
| (4) | |||||
where is the radial optical depth through the CSM to the re-radiated NIR emission of temperature . Assuming the gas and radiation are in equilibrium (), this results in a condensation radius (where ) of
| (5) |
The size to which dust grains can grow is determined by a comparison between the grain growth timescale and the outflow (or inflow) timescale from the condensation radius (e.g., Kochanek 2011). Evaluating Eq. (2) at ,
| (6) |
where is normalized to a value km s-1 close to the narrow spectral-line features in AT2018cow (e.g., Fox & Smith 2019). Comparing with , we see that grain growth to sizes is possible (), for reasonable ranges in the values of , , , .
The dusty outflow at radii will obscure the progenitor at optical/UV wavelengths. The absorption opacity in the geometric optics limit (wavelengths ), is approximately given by
| (7) |
The optical depth of the CSM dust to UV radiation external to a given radius is
| (8) |
where we have used Eqs. (1), (7). Absent dust destruction, the UV emission from LFBOTs should be obscured () by the dusty CSM on the same radial scales cm probed by the transient’s radio/mm emission, contrary to observations taken near and after the optical/UV peak showing blue colors from a high-temperature K continuum.
2.2 Dust Destruction by the Rising UV Transient
As the UV luminosity of the transient rises to its peak, this radiation will heat and sublimate the dust to increasingly large radii, reducing the optical depth (Eq. 8). To estimate the dust sublimation radius, we follow similar considerations in the context of other explosive transients: SNe (e.g., Bode & Evans 1980; Dwek 1983; Maeda et al. 2015), AGN (e.g., Barvainis 1987), gamma-ray bursts (e.g., Waxman & Draine 2000; Waxman et al. 2022) and tidal disruption events (van Velzen et al., 2016). We compute the temperature of the dust by equating the rate a grain of radius at radius absorbs heat,
| (9) |
where is the absorption efficiency at UV wavelengths where the spectral energy distribution (SED) of LFBOT peaks at early times ( K; e.g., Perley et al. 2019), to the rate at which dust radiates
| (10) |
where is the emission efficiency. For silicate grains across a range of sizes the Planck-averaged emissivity at temperatures K is approximately given by (e.g., Draine & Lee 1984, their Fig. 11)
| (11) |
Setting gives the dust temperature,
| (12) | |||||
where . Following Eq. 12 of Waxman & Draine (2000), we estimate that for UV irradiation lasting from hours to days during the transient rise (see below), dust will be destroyed by sublimation above the temperature K, at the radius
| (13) |
A somewhat higher sublimation temperature K would characterize carbonaceous grains. The UV optical depth through the CSM when the luminosity reaches is thus given by (Eq. 8)
| (14) |
As the sublimation radius grows, the value of is reduced to once the luminosity increases to a value
| (15) |
which is notably independent of the grain size. This occurs at a critical radius
| (16) |
2.3 Re-radiated IR Emission
Grains heated by the transient just prior to their destruction will re-radiate the absorbed energy at the temperature of the dust grains. In particular, most of the energy absorbed when () will be emitted as quasi-blackbody emission of temperature K in the NIR. The total UV radiation energy absorbed by the dust on radial scales (Eq. 16) is estimated as that absorbed when ,
| (17) |
where is the time the transient spends during its rise around the luminosity and is the total solid angle subtended by the CSM (we assume the transient’s UV luminosity is isotropic across ).
Until recently, no LFBOT UV/optical light curves were available in the literature which start significantly before maximum light to enable a measurement of the rise. We accordingly adopt a pre-maximum rise motivated by early SN observations (e.g., Olling et al. 2015), i.e.
| (18) |
where is measured from the onset of the explosion and and are the peak luminosity and peak/rise-time of the transient, respectively. This rise law is roughly consistent with that measured for the extremely luminous LFBOT-like transient MUSSES2020J (Jiang et al. 2022), though we caution that early dust attenuation could act to steepen the observed rise compared to the intrinsic one (we return to possible observational evidence for such early attenuation in Sec. 4).
The time spent around a given luminosity is then
| (19) |
Evaluating this for (Eq. 15), Eq. (17) becomes:
| (20) | |||||
where we have normalized erg s-1 and days to typical values for the peak luminosity and decay time222Though not a perfect point of comparison, the u-band light curves of Type Ib/c SNe exhibit similar rise and decay timescales to within a factor (see Taddia et al. 2015; their Table 3)., respectively, of LFBOT light curves (e.g., Prentice et al. 2018).
Because the dust grains are distant from the source of emission, there is a significant time delay before the NIR radiation reaches a distant observer (Fig. 1). If the direction from the center of the explosion to the observer is the polar axis of a system of spherical coordinates, the delay is given by
| (21) |
where is the radial coordinate to a particular location on the dust shell and is its polar angle.333The angle with respect to the observer line of sight is not to be confused with the polar angle relative to the CSM symmetry axis (Fig. 1) Insofar as is emitted from a shell of radius (Eq. 16), this gives a maximal delay ()
| (22) |
The response function of a spherical shell (or a portion of a spherical shell axisymmetric about the line of sight to the observer) which re-radiates light simultaneously is a square-wave, resulting in a flat light curve of luminosity
| (23) | |||||
The plateau of luminosity lasts a duration , depending on the angular extent of the dust shell.
More generally the light curve shape will not be strictly flat, if either (a) the CSM is not distributed in a spherically symmetric manner around the explosion, i.e. the CSM density varies as a function of the polar angle with respect to some symmetry axis; or (b) reprocessed light reaches the observer from only a portion of the total 4 solid angle, for instance if the CSM in the equatorial plane (Fig. 1) blocks reprocessed NIR light from the opposite hemisphere. Both of these effects play a role in our model for AT2018cow’s NIR echo in the next section.
3 Application to AT2018cow
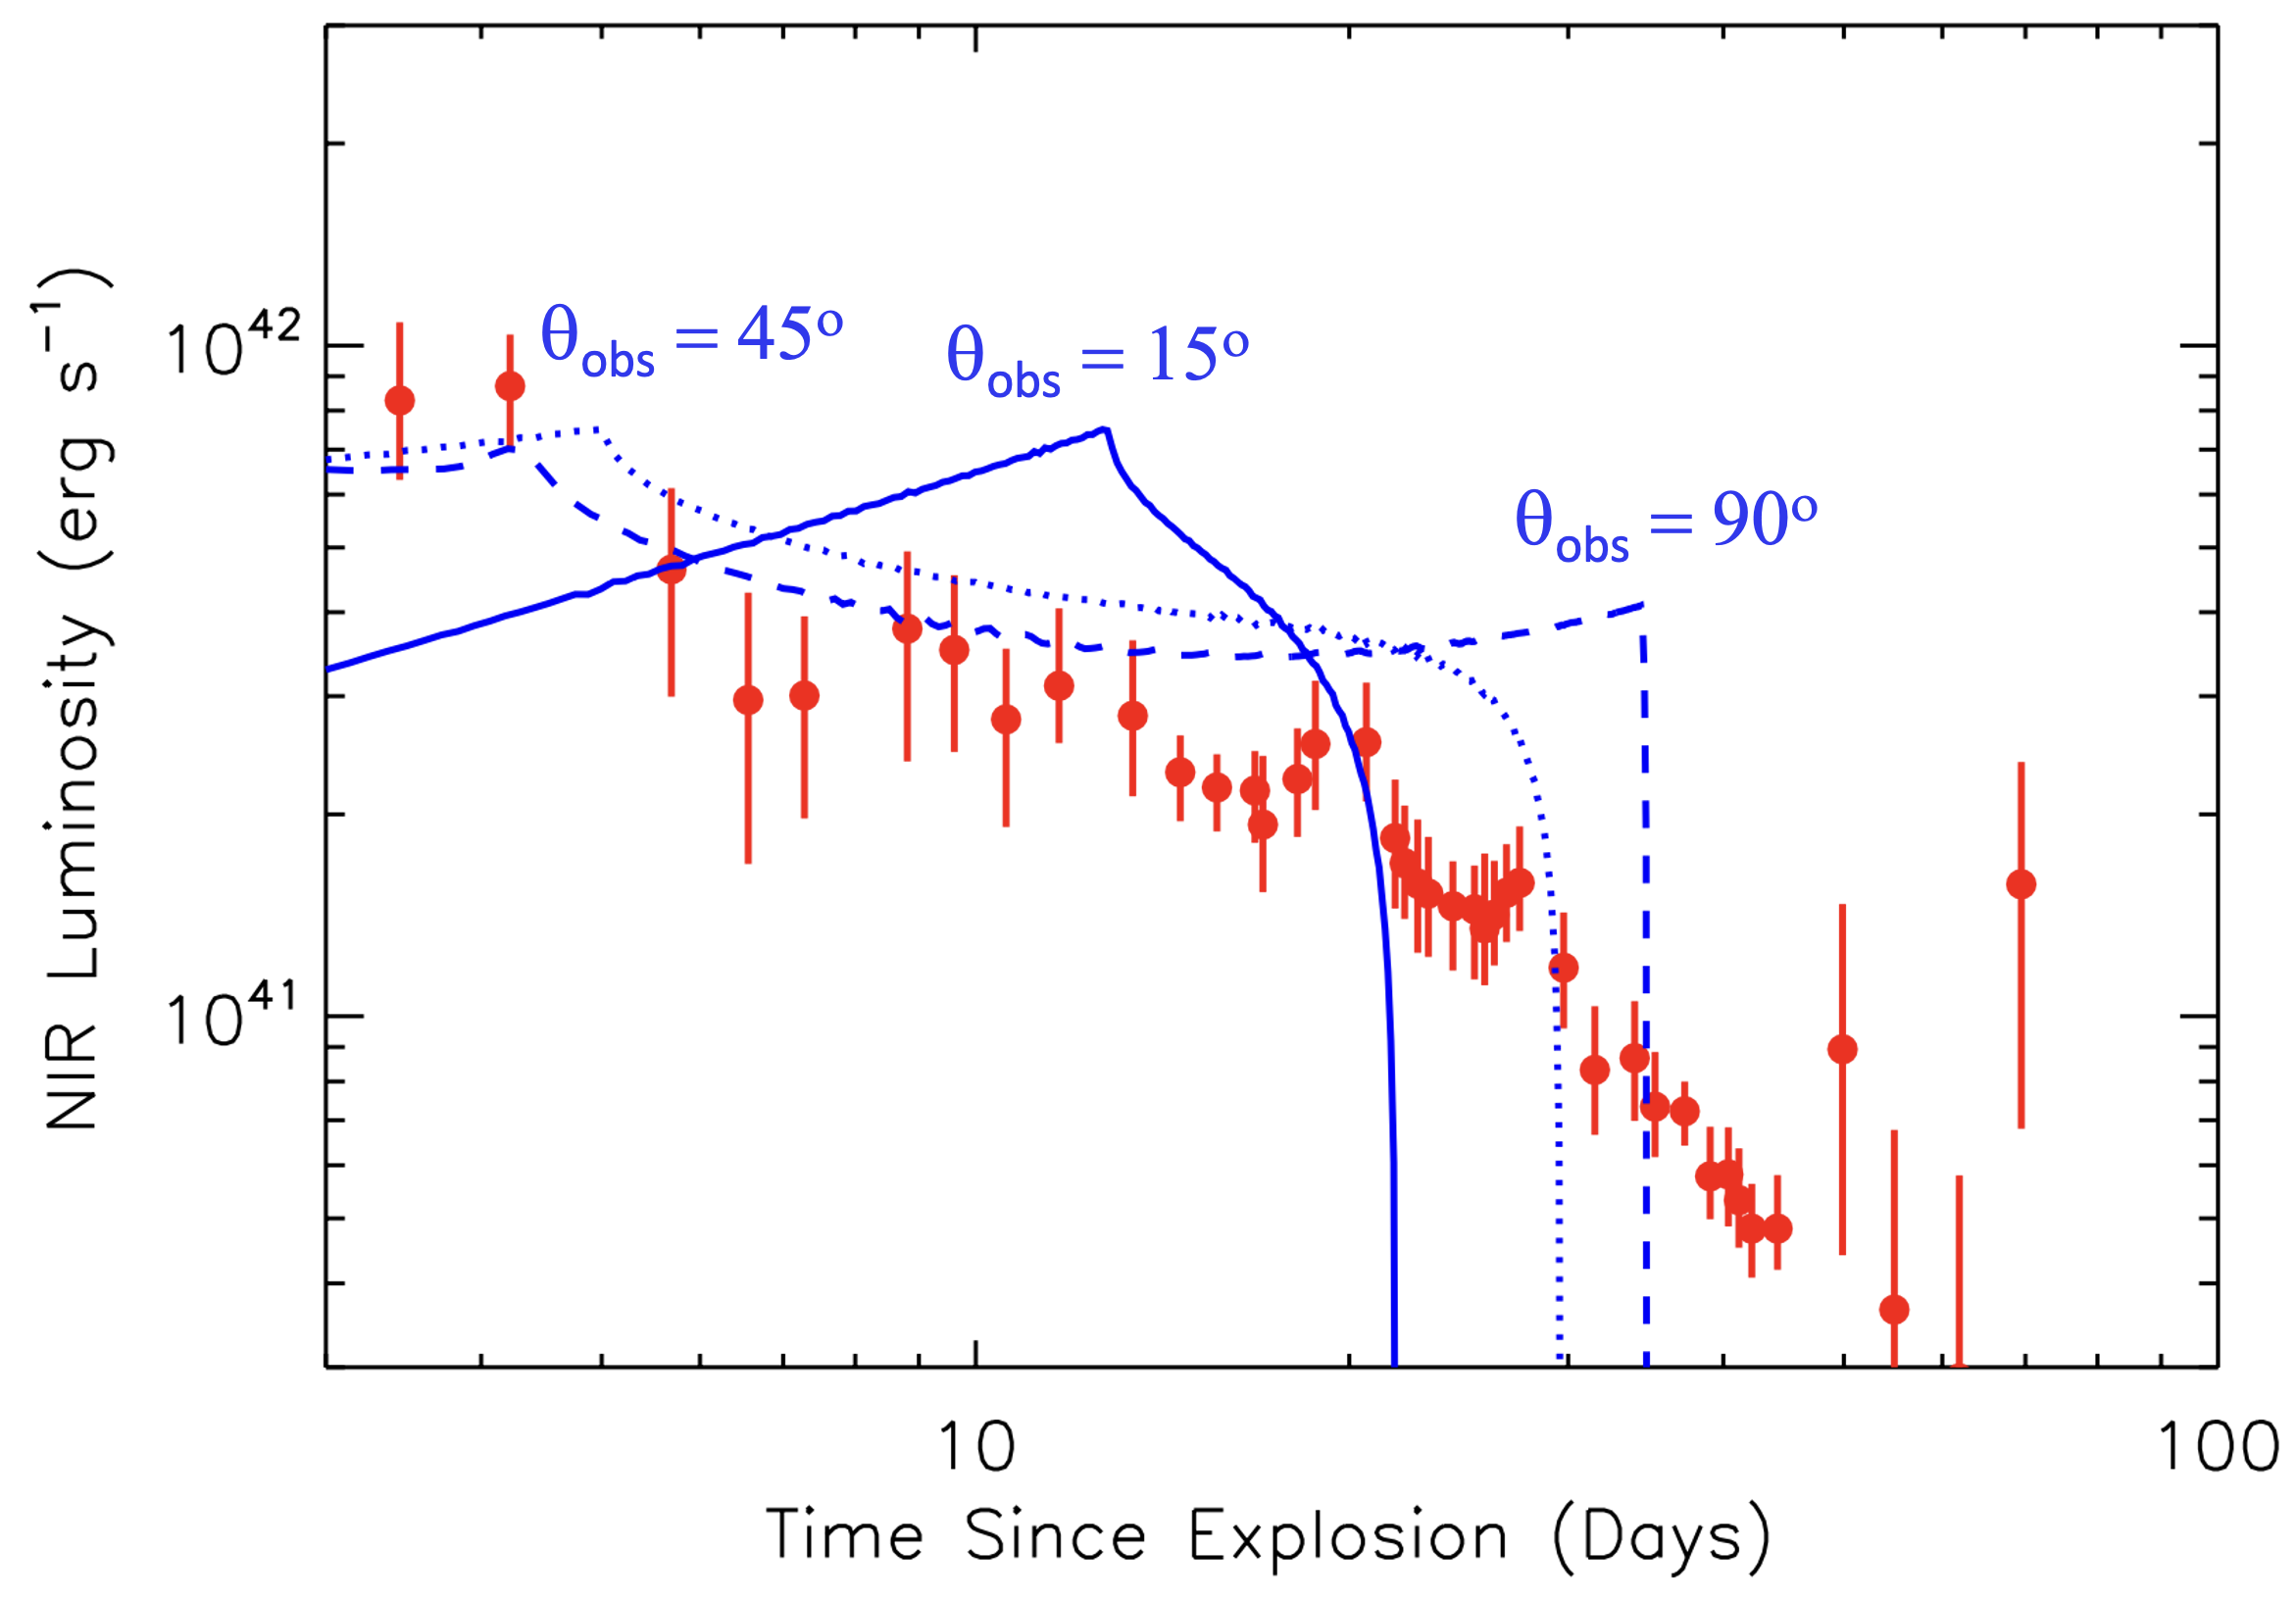
Although most of its luminosity is radiated in the UV and optical bands, Perley et al. (2019) identified in AT2018cow a source of NIR emission in excess of the best-fit blackbody fit to the UV/optical continuum (see their Figs. 7, 8; we reproduce these data here in Figs. 2, 3). This excess shows up in the spectrum most prominently around and possesses a much flatter light curve than the rapidly-fading UV/optical continuum, remaining present for at least 44 days.
Perley et al. (2019) consider a non-thermal origin for this NIR excess, arguing it is part of the same synchrotron emission spectrum responsible for the millimeter band flux. However, Margutti et al. (2019) showed that an extrapolation of the model that best fits the radio observations at GHz severely underpredicts the NIR flux (the NIR band is likely above the synchrotron cooling break). It is thus tempting to identify AT2018cow’s NIR excess as a dust echo similar to those explored here.
Perley et al. (2019) considered the possibility of dust emission for the NIR excess in AT2018cow, but disfavored this explanation on the grounds that: (a) dust emission lacks an physical origin (now provided in this paper); and (b) fitting the UVOIR data with two blackbodies results in best-fit temperature for the NIR component closer to 3000 K, hotter than would be expected for dust. However, the spectrum of the dust echo emission will be that of a modified blackbody of temperature K, where at NIR wavelengths for micron-sized grains (Draine & Lee 1984; their Fig. 5) with a spectral peak at (). We note that if one tries to fit the peak of the spectrum assuming pure blackbody emission (for which ) this would lead to an overestimate of the temperature by a factor of , transforming the 3000 K best-fit blackbody spectrum inferred by Perley et al. (2019) to one with K, closer to the emission temperature of soon-to-be sublimated dust.
In order to explore this issue, we repeated the SED fits using a modified blackbody equation of the type above in place of the nonthermal power-law originally employed in Perley et al. (2019). The temperature was fixed to 2000 K and the blackbody curve was attenuated by an attenuation factor of the form (Beuermann et al., 1999). The break wavelength was set to 1 m, the break sharpness parameter to , and the long-wavelength power-law index . The modified emission curve was then numerically integrated at each epoch to calculate the luminosity. The resulting fits are shown in Figure 2, and the time-evolution of the parameters is presented in Figure 3.
This revised model shows a qualitatively good match to the data, with a median residual of less than 0.05 mag across all epochs, comparable to the expected systematic error. The goodness-of-fit is inferior to that of the original power-law model in Perley et al. (2019) ( of 225 and 145, respectively, on 370 degrees of freedom), although the difference originates primarily from an apparent flux excess in the and bands at late times, which may be due to an unidentified spectral feature. Both models do an excellent job of fitting the early-time data before this feature appears, notably including the epochs at 14.6 and 16.8 days where photometry available.
3.1 NIR Light Curve Modeling
Eqs. (22), (23) show that both the characteristic timescale and luminosity of the measured NIR emission ( erg s-1; d; Fig. 4) can be explained for dust grain sizes m and an assumed CSM density , moderately higher than is found by radio modeling of AT2018cow and other LFBOTs (Ho et al. 2019; Margutti et al. 2019). As we now discuss, however, this high density is consistent given the angular distribution of the CSM inferred from the NIR light curve shape.
As has already been mentioned, neither the ejecta velocity nor the CSM it interacts with are likely to be spherically symmetric, as significant pole-to-equator gradients in both are needed to explain the multi-wavelength data from AT2018cow (Margutti et al., 2019; Fox & Smith, 2019) and are predicted by several LFBOT progenitor models as a result of stellar rotation or binarity (e.g., Quataert et al. 2019; Soker et al. 2019; Schrøder et al. 2020; Uno & Maeda 2020; Metzger 2022). Thus, those regions of the CSM probed most sensitively by the radio/mm emission may not match those which dominate the bulk of the reprocessed IR emission. In particular, the ejecta-CSM shock-powered synchrotron emission is more sensitive to the ejecta speed than CSM density and hence will preferentially arise from higher latitudes (small in Fig. 1) along which the fast jet-like polar outflow from the central engine is directed. By contrast, the reprocessed IR luminosity will arise preferentially from closer to the equatorial plane () where the CSM density is greatest.
A similar angular dependence for the CSM density could contribute to the shape of AT2018’s NIR light curve, particularly its gradual decay over the first 30 days after the explosion (versus the strictly flat light curve prediction for a spherical dust shell). To illustrate this, we have calculated the dust echo light curve for an assumed CSM density profile of the form,
| (24) |
which peaks in the equatorial plane (). This profile results in an angle-dependent dust emission radius (Eq. 16). We calculate the NIR emission received by an observer at a given polar angle by summing the contributions from each solid angle subtended by the central explosion weighting it by the reprocessed energy (Eq. 17) along that direction, accounting for the light-travel arrival delay (see Fig. 1 for the adopted geometry). The assumed grain size and mid-plane density cm-3 determine through cm and the overall normalization of the characteristic duration and peak luminosity of the emission, which still roughly follow the analytic estimates in Eqs. (22), (23) (provided one uses the peak CSM density, ). We only consider emission from the CSM at angles , assuming the dense equatorial CSM will attenuate reprocessed emission from the opposing hemisphere ().
The brown lines in Figure 4 show our calculation for different observer viewing angles, , in comparison to the NIR light curve of AT2018cow. For typical observing angles (e.g., ), one predicts a roughly flat brief initial light curve phase (emission from dust closest to the observer’s line of sight, where the CSM is locally homogeneous for small angles around ) followed by gradual decay over longer timescales as emission is received from larger and larger angles approaching the opposite side of the hemisphere.
The lack of detailed agreement between the model and the observed IR light curve is not unexpected given our ad hoc CSM density profile (Eqs. 1, 24) and other simplifications of the model (we do not account for angle-dependent dust grain properties and radiative transfer effects, for example). The late-time NIR emission at 30 days is also not captured by the toy model, though such emission can arise from dust at radii (where so less energy is reprocessed with a longer delay time; e.g., Maeda et al. 2015) or from the opposite hemisphere () that nevertheless reaches the observer despite absorption by the equatorial CSM.
In our interpretation for the NIR excess from AT2018cow as a dust echo, the broadly similar shape of the X-ray and NIR light curves in Fig. 2 would be coincidental. It is tempting to consider whether the X-ray emission itself could be scattered emission from an early short-lived extremely X-ray-luminous phase. However, such an interpretation is challenged by the unique time-dependent spectral evolution and variability (Margutti et al., 2019) and QPE emission (Pasham et al., 2021). Another point of tension regarding the reprocessing scenario are the apparent short-timescale variability/wiggles in the NIR light curve, such as the “bump” at days. A clumpy CSM with a large density enhancement along the observer’s line of site at radii , might be needed to generate such features.
4 Summary
We conclude thatwhatever their naturethe progenitors of LFBOTs just before exploding, may find themselves enshrouded in dust formed in their own dense CSM, the presence of which is made apparent by the luminous shock-powered radio/mm emission following the explosion. In principle, such dust-shrouded progenitors could be observable as IR sources with luminosities up to erg s-1 (if the putative companion star to AT2018cow detected by Sun et al. 2022 is representative of its progenitor), qualitatively similar to the IR-luminous progenitors of the SN2008S-like explosions (e.g., Prieto et al. 2008; Thompson et al. 2009). Given the short-lived phase of the CSM mass-loss ( yr; see below) and extremely low rate of LFBOTs, such “ultraluminous IR sources” would be extremely rare and difficult to discover in the local universe. We estimate that the planned High Latitude Wide Area Survey on the Nancy Grace Roman Space Telescope (Wang et al. 2022) could in principle detect such a progenitor at the 60 Mpc distance of AT2018cow if it emits a significant fraction of its luminosity at m.
Though most of the dust is ultimately destroyed by the transient’s UV light, the few percent of the radiated energy which absorbed during the rise before this point is re-emitted as a NIR echo of luminosity erg s-1 lasting weeks to months. Given the long wavelength of this emission (a modified blackbody of effective temperature K), this signal is visible over the transient’s rapidly-fading optical/UV continuum. We encourage future NIR follow-up of LFBOTs as a probe of the CSM properties on radial scales cm complementary to that provided by radio/mm observations.
The high luminosity and early-time gradual-decay of AT2018cow’s IR light curve arise naturally if the CSM is preferentially concentrated in a thick equatorial outflow or torus with a peak density cm cm-3 for greater than that at higher latitudes probed by the radio/mm shock emission by a factor (Eq. 1). If the CSM is an outflow, its corresponding mass-loss rate for km s-1 must be large yr-1 and it must contain a total mass Such a large quantity of mass-loss years prior to the explosion provides a strong constraint on any LFBOT progenitor model (see Metzger 2022 for a discussion).
Dust signatures including excess IR emission is observed in many core-collapse SNe (e.g., Bode & Evans 1980; Dwek 1983; Fox et al. 2013), particularly in a handful of the Type Ibn SNe subclass (e.g., Smith et al. 2008; Mattila et al. 2008; Gan et al. 2021) spectrally most similar to AT2018cow. However, the dust emission in these events does not generally become prominent for several weeks or longer after the explosion and the emitting dust may be freshly synthesized by the shock rather than being exclusively pre-existing CSM (e.g., Mattila et al. 2008; Smith et al. 2008). By contrast, the IR emission component in AT2018cow is already present even days after peak light, when the equilibrium temperature behind even the fastest portions of the ejecta is still too high K for dust nucleation.
Though challenging giving their rarity and rapid evolution, we encourage efforts to discover LFBOTs and obtain multi-band photometry if not spectra during their pre-maximum rise phase. The optical/UV spectrum should be substantially reddened by dust attenuation up to luminosities erg s-1 (Eq. 15) capable of destroying the dust.
A possible test of this prediction came with the discovery of the extremely luminous LFBOT candidate MUSSES2020J (Jiang et al., 2022) four days prior to the optical maximum. Contrary to the naive expectation of hotter UV/optical emission at early times after the explosion while the photosphere is still compact, MUSSES2020J exhibited substantially redder colors () four days before optical peak, when the transient luminosity was erg s-1, than near the peak itself (). In light of the above discussion, it is tempting to associate the pre-maximum red-to-blue color evolution with the residual absorption by, and subsequent destruction of, pre-existing dusty CSM. Follow-up photometry and spectra were obtained for this event, but the bluer rest-frame wavelengths they cover (due in part to the high source redshift ) unfortunately preclude constraining the presence of an IR dust echo.
References
- Antoni & Quataert (2022) Antoni, A., & Quataert, E. 2022, MNRAS, 511, 176, doi: 10.1093/mnras/stab3776
- Arcavi et al. (2016) Arcavi, I., Wolf, W. M., Howell, D. A., et al. 2016, ApJ, 819, 35, doi: 10.3847/0004-637X/819/1/35
- Barvainis (1987) Barvainis, R. 1987, ApJ, 320, 537, doi: 10.1086/165571
- Beuermann et al. (1999) Beuermann, K., Hessman, F. V., Reinsch, K., et al. 1999, A&A, 352, L26. https://arxiv.org/abs/astro-ph/9909043
- Bode & Evans (1980) Bode, M. F., & Evans, A. 1980, MNRAS, 193, 21P, doi: 10.1093/mnras/193.1.21P
- Bright et al. (2021) Bright, J. S., Margutti, R., Matthews, D., et al. 2021, arXiv e-prints, arXiv:2110.05514. https://arxiv.org/abs/2110.05514
- Cherchneff & Dwek (2009) Cherchneff, I., & Dwek, E. 2009, ApJ, 703, 642, doi: 10.1088/0004-637X/703/1/642
- Coppejans et al. (2020) Coppejans, D. L., Margutti, R., Terreran, G., et al. 2020, ApJ, 895, L23, doi: 10.3847/2041-8213/ab8cc7
- Davidson & Humphreys (1997) Davidson, K., & Humphreys, R. M. 1997, ARA&A, 35, 1, doi: 10.1146/annurev.astro.35.1.1
- Dessart et al. (2021) Dessart, L., Hillier, D. J., Sukhbold, T., Woosley, S. E., & Janka, H. T. 2021, A&A, 656, A61, doi: 10.1051/0004-6361/202141927
- Draine & Lee (1984) Draine, B. T., & Lee, H. M. 1984, ApJ, 285, 89, doi: 10.1086/162480
- Drout et al. (2014) Drout, M. R., Chornock, R., Soderberg, A. M., Sanders, N. E., et al. 2014, ApJ, 794, 23, doi: 10.1088/0004-637X/794/1/23
- Dwek (1983) Dwek, E. 1983, ApJ, 274, 175, doi: 10.1086/161435
- Fang et al. (2019) Fang, K., Metzger, B. D., Murase, K., Bartos, I., & Kotera, K. 2019, ApJ, 878, 34, doi: 10.3847/1538-4357/ab1b72
- Fox et al. (2013) Fox, O. D., Filippenko, A. V., Skrutskie, M. F., et al. 2013, AJ, 146, 2, doi: 10.1088/0004-6256/146/1/2
- Fox & Smith (2019) Fox, O. D., & Smith, N. 2019, MNRAS, 488, 3772, doi: 10.1093/mnras/stz1925
- Gan et al. (2021) Gan, W.-P., Wang, S.-Q., & Liang, E.-W. 2021, ApJ, 914, 125, doi: 10.3847/1538-4357/abfbdf
- Gottlieb et al. (2022) Gottlieb, O., Tchekhovskoy, A., & Margutti, R. 2022, arXiv e-prints, arXiv:2201.04636. https://arxiv.org/abs/2201.04636
- Ho et al. (2021a) Ho, A. Y. Q., Perley, D. A., Gal-Yam, A., et al. 2021a, arXiv e-prints, arXiv:2105.08811. https://arxiv.org/abs/2105.08811
- Ho et al. (2020) Ho, A. Y. Q., Perley, D. A., Kulkarni, S. R., Dong, D. Z. J., et al. 2020, ApJ, 895, 49, doi: 10.3847/1538-4357/ab8bcf
- Ho et al. (2019) Ho, A. Y. Q., Phinney, E. S., Ravi, V., et al. 2019, ApJ, 871, 73, doi: 10.3847/1538-4357/aaf473
- Ho et al. (2021b) Ho, A. Y. Q., Margalit, B., Bremer, M., et al. 2021b, arXiv e-prints, arXiv:2110.05490. https://arxiv.org/abs/2110.05490
- Jiang et al. (2022) Jiang, J.-a., Yasuda, N., Maeda, K., et al. 2022, ApJ, 933, L36, doi: 10.3847/2041-8213/ac7390
- Kochanek (2011) Kochanek, C. S. 2011, ApJ, 743, 73, doi: 10.1088/0004-637X/743/1/73
- Kremer et al. (2021) Kremer, K., Lu, W., Piro, A. L., et al. 2021, ApJ, 911, 104, doi: 10.3847/1538-4357/abeb14
- Kuin et al. (2019) Kuin, N. P. M., Wu, K., Oates, S., et al. 2019, MNRAS, 487, 2505, doi: 10.1093/mnras/stz053
- Kwok (1975) Kwok, S. 1975, ApJ, 198, 583, doi: 10.1086/153637
- Leung et al. (2020) Leung, S.-C., Blinnikov, S., Nomoto, K., et al. 2020, ApJ, 903, 66, doi: 10.3847/1538-4357/abba33
- Maeda et al. (2015) Maeda, K., Nozawa, T., Nagao, T., & Motohara, K. 2015, MNRAS, 452, 3281, doi: 10.1093/mnras/stv1498
- Margalit et al. (2022) Margalit, B., Quataert, E., & Ho, A. Y. Q. 2022, ApJ, 928, 122, doi: 10.3847/1538-4357/ac53b0
- Margutti et al. (2019) Margutti, R., Metzger, B. D., Chornock, R., et al. 2019, ApJ, 872, 18, doi: 10.3847/1538-4357/aafa01
- Mattila et al. (2008) Mattila, S., Meikle, W. P. S., Lundqvist, P., et al. 2008, MNRAS, 389, 141, doi: 10.1111/j.1365-2966.2008.13516.x
- Metzger (2022) Metzger, B. D. 2022, ApJ, 932, 84, doi: 10.3847/1538-4357/ac6d59
- Nayana & Chandra (2021) Nayana, A. J., & Chandra, P. 2021, ApJ, 912, L9, doi: 10.3847/2041-8213/abed55
- Nozawa et al. (2014) Nozawa, T., Yoon, S.-C., Maeda, K., et al. 2014, ApJ, 787, L17, doi: 10.1088/2041-8205/787/2/L17
- Olling et al. (2015) Olling, R. P., Mushotzky, R., Shaya, E. J., et al. 2015, Nature, 521, 332, doi: 10.1038/nature14455
- Pasham et al. (2021) Pasham, D. R., Ho, W. C. G., Alston, W., Remillard, R., et al. 2021, Nature Astronomy, doi: 10.1038/s41550-021-01524-8
- Perley et al. (2021) Perley, D. A., Ho, A. Y. Q., Yao, Y., et al. 2021, MNRAS, 508, 5138, doi: 10.1093/mnras/stab2785
- Perley et al. (2019) Perley, D. A., Mazzali, P. A., Yan, L., et al. 2019, MNRAS, 484, 1031, doi: 10.1093/mnras/sty3420
- Prentice et al. (2018) Prentice, S. J., Maguire, K., Smartt, S. J., et al. 2018, ApJ, 865, L3, doi: 10.3847/2041-8213/aadd90
- Prieto et al. (2008) Prieto, J. L., Kistler, M. D., Thompson, T. A., et al. 2008, ApJ, 681, L9, doi: 10.1086/589922
- Pursiainen et al. (2018) Pursiainen, M., Childress, M., Smith, M., et al. 2018, MNRAS, 481, 894, doi: 10.1093/mnras/sty2309
- Quataert et al. (2019) Quataert, E., Lecoanet, D., & Coughlin, E. R. 2019, MNRAS, 485, L83, doi: 10.1093/mnrasl/slz031
- Rivera Sandoval et al. (2018) Rivera Sandoval, L. E., Maccarone, T. J., Corsi, A., et al. 2018, MNRAS, 480, L146, doi: 10.1093/mnrasl/sly145
- Schrøder et al. (2020) Schrøder, S. L., MacLeod, M., Loeb, A., Vigna-Gómez, A., & Mandel, I. 2020, ApJ, 892, 13, doi: 10.3847/1538-4357/ab7014
- Smith et al. (2008) Smith, N., Foley, R. J., & Filippenko, A. V. 2008, ApJ, 680, 568, doi: 10.1086/587860
- Soker (2022) Soker, N. 2022, Research in Astronomy and Astrophysics, 22, 055010, doi: 10.1088/1674-4527/ac5b40
- Soker et al. (2019) Soker, N., Grichener, A., & Gilkis, A. 2019, MNRAS, 484, 4972, doi: 10.1093/mnras/stz364
- Sun et al. (2022) Sun, N.-C., Maund, J. R., Crowther, P. A., & Liu, L.-D. 2022, arXiv e-prints, arXiv:2203.01960. https://arxiv.org/abs/2203.01960
- Taddia et al. (2015) Taddia, F., Sollerman, J., Leloudas, G., et al. 2015, A&A, 574, A60, doi: 10.1051/0004-6361/201423915
- Thompson et al. (2009) Thompson, T. A., Prieto, J. L., Stanek, K. Z., et al. 2009, ApJ, 705, 1364, doi: 10.1088/0004-637X/705/2/1364
- Uno & Maeda (2020) Uno, K., & Maeda, K. 2020, ApJ, 897, 156, doi: 10.3847/1538-4357/ab9632
- van Velzen et al. (2016) van Velzen, S., Mendez, A. J., Krolik, J. H., & Gorjian, V. 2016, ApJ, 829, 19, doi: 10.3847/0004-637X/829/1/19
- Wang et al. (2022) Wang, Y., Zhai, Z., Alavi, A., et al. 2022, ApJ, 928, 1, doi: 10.3847/1538-4357/ac4973
- Waxman & Draine (2000) Waxman, E., & Draine, B. T. 2000, ApJ, 537, 796, doi: 10.1086/309053
- Waxman et al. (2022) Waxman, E., Ofek, E. O., & Kushnir, D. 2022, arXiv e-prints, arXiv:2206.10710. https://arxiv.org/abs/2206.10710
- Xiang et al. (2021) Xiang, D., Wang, X., Lin, W., et al. 2021, ApJ, 910, 42, doi: 10.3847/1538-4357/abdeba
- Yao et al. (2021) Yao, Y., Ho, A. Y. Q., Medvedev, P., et al. 2021, arXiv e-prints, arXiv:2112.00751. https://arxiv.org/abs/2112.00751